Project
GNF SymAtlas + NCI-60 cancer cell lines, human (Su, 2004; Ross, 2000)
Navigation
Downloads
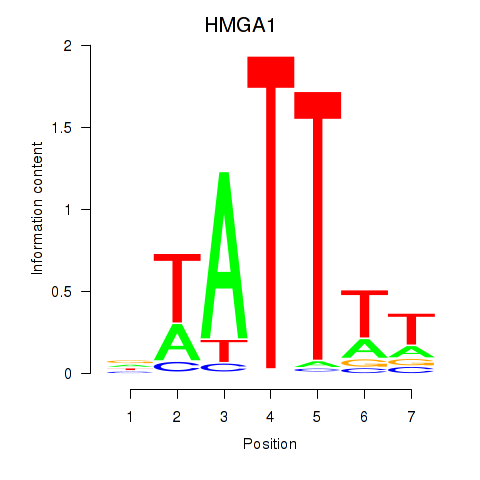
Results for HMGA1
Z-value: 1.04
Motif logo
Transcription factors associated with HMGA1
| Gene Symbol | Gene ID | Gene Info |
|---|---|---|
|
HMGA1
|
ENSG00000137309.20 | HMGA1 |
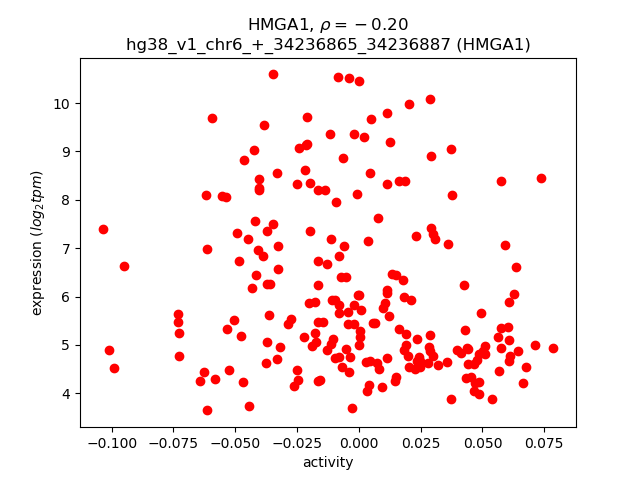
Activity-expression correlation:
| Gene | Promoter | Pearson corr. coef. | P-value | Plot |
|---|---|---|---|---|
| HMGA1 | hg38_v1_chr6_+_34236865_34236887 | -0.20 | 3.5e-03 | Click! |
Activity profile of HMGA1 motif
Sorted Z-values of HMGA1 motif
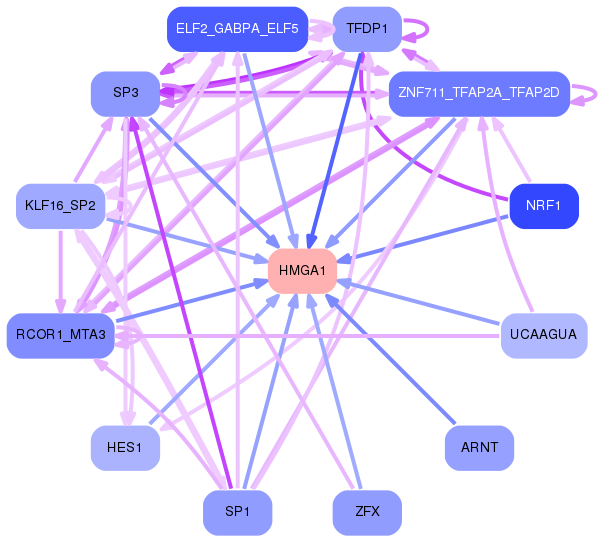
Network of associatons between targets according to the STRING database.

First level regulatory network of HMGA1
Gene Ontology Analysis
Gene overrepresentation in biological process category:
| Log-likelihood per target | Total log-likelihood | Term | Description |
|---|---|---|---|
| 7.9 | 23.7 | GO:2000866 | positive regulation of estrogen secretion(GO:2000863) positive regulation of estradiol secretion(GO:2000866) |
| 4.2 | 50.4 | GO:0051611 | negative regulation of neurotransmitter uptake(GO:0051581) regulation of serotonin uptake(GO:0051611) negative regulation of serotonin uptake(GO:0051612) |
| 4.0 | 16.0 | GO:0031161 | phosphatidylinositol catabolic process(GO:0031161) |
| 2.5 | 7.6 | GO:0098746 | fast, calcium ion-dependent exocytosis of neurotransmitter(GO:0098746) |
| 2.4 | 17.1 | GO:2000324 | positive regulation of glucocorticoid receptor signaling pathway(GO:2000324) |
| 2.3 | 13.8 | GO:0097338 | response to clozapine(GO:0097338) |
| 2.1 | 6.3 | GO:2000097 | regulation of smooth muscle cell-matrix adhesion(GO:2000097) |
| 1.8 | 7.1 | GO:2000639 | regulation of SREBP signaling pathway(GO:2000638) negative regulation of SREBP signaling pathway(GO:2000639) |
| 1.6 | 12.5 | GO:0061709 | reticulophagy(GO:0061709) |
| 1.4 | 4.2 | GO:0006533 | aspartate catabolic process(GO:0006533) |
| 1.4 | 4.1 | GO:0015783 | GDP-fucose transport(GO:0015783) purine nucleotide-sugar transport(GO:0036079) |
| 1.3 | 3.8 | GO:1904395 | retinal rod cell differentiation(GO:0060221) positive regulation of skeletal muscle acetylcholine-gated channel clustering(GO:1904395) negative regulation of neuromuscular junction development(GO:1904397) |
| 1.1 | 4.2 | GO:0072660 | maintenance of protein location in membrane(GO:0072658) maintenance of protein location in plasma membrane(GO:0072660) positive regulation of membrane depolarization during cardiac muscle cell action potential(GO:1900827) |
| 1.0 | 3.1 | GO:0034092 | negative regulation of maintenance of sister chromatid cohesion(GO:0034092) negative regulation of maintenance of mitotic sister chromatid cohesion(GO:0034183) maintenance of mitotic sister chromatid cohesion, telomeric(GO:0099403) mitotic sister chromatid cohesion, telomeric(GO:0099404) regulation of maintenance of mitotic sister chromatid cohesion, telomeric(GO:1904907) negative regulation of maintenance of mitotic sister chromatid cohesion, telomeric(GO:1904908) |
| 1.0 | 11.7 | GO:0002315 | marginal zone B cell differentiation(GO:0002315) |
| 1.0 | 1.9 | GO:0021823 | cerebral cortex tangential migration using cell-cell interactions(GO:0021823) substrate-dependent cerebral cortex tangential migration(GO:0021825) postnatal olfactory bulb interneuron migration(GO:0021827) chemorepulsion involved in postnatal olfactory bulb interneuron migration(GO:0021836) regulation of negative chemotaxis(GO:0050923) |
| 1.0 | 4.8 | GO:0010513 | positive regulation of phosphatidylinositol biosynthetic process(GO:0010513) |
| 0.9 | 3.6 | GO:0071409 | cellular response to cycloheximide(GO:0071409) |
| 0.9 | 2.7 | GO:0038155 | interleukin-23-mediated signaling pathway(GO:0038155) |
| 0.9 | 7.9 | GO:0042118 | endothelial cell activation(GO:0042118) |
| 0.9 | 4.3 | GO:0030311 | poly-N-acetyllactosamine metabolic process(GO:0030309) poly-N-acetyllactosamine biosynthetic process(GO:0030311) |
| 0.9 | 18.0 | GO:0042759 | long-chain fatty acid biosynthetic process(GO:0042759) |
| 0.8 | 7.5 | GO:2000580 | regulation of ATP-dependent microtubule motor activity, plus-end-directed(GO:2000580) positive regulation of ATP-dependent microtubule motor activity, plus-end-directed(GO:2000582) |
| 0.8 | 5.0 | GO:0010751 | negative regulation of nitric oxide mediated signal transduction(GO:0010751) |
| 0.8 | 6.5 | GO:0003172 | primary heart field specification(GO:0003138) sinoatrial valve development(GO:0003172) sinoatrial valve morphogenesis(GO:0003185) |
| 0.8 | 4.9 | GO:0038016 | insulin receptor internalization(GO:0038016) |
| 0.8 | 2.4 | GO:0036111 | very long-chain fatty-acyl-CoA metabolic process(GO:0036111) |
| 0.8 | 2.3 | GO:0071206 | establishment of protein localization to juxtaparanode region of axon(GO:0071206) |
| 0.7 | 2.2 | GO:0044278 | cell wall disruption in other organism(GO:0044278) |
| 0.7 | 10.9 | GO:0043374 | CD8-positive, alpha-beta T cell differentiation(GO:0043374) |
| 0.7 | 2.2 | GO:0021678 | fourth ventricle development(GO:0021592) third ventricle development(GO:0021678) |
| 0.7 | 4.1 | GO:0019255 | UDP-glucuronate biosynthetic process(GO:0006065) glucose 1-phosphate metabolic process(GO:0019255) |
| 0.7 | 4.0 | GO:0061302 | smooth muscle cell-matrix adhesion(GO:0061302) |
| 0.6 | 9.2 | GO:1903760 | regulation of voltage-gated potassium channel activity involved in ventricular cardiac muscle cell action potential repolarization(GO:1903760) |
| 0.6 | 9.2 | GO:0070777 | D-aspartate transport(GO:0070777) D-aspartate import(GO:0070779) |
| 0.6 | 4.2 | GO:0071286 | cellular response to magnesium ion(GO:0071286) |
| 0.6 | 8.0 | GO:0051964 | negative regulation of synapse assembly(GO:0051964) |
| 0.5 | 5.4 | GO:0045162 | clustering of voltage-gated sodium channels(GO:0045162) |
| 0.5 | 2.1 | GO:1904428 | negative regulation of tubulin deacetylation(GO:1904428) |
| 0.5 | 1.6 | GO:0010166 | wax biosynthetic process(GO:0010025) wax metabolic process(GO:0010166) |
| 0.5 | 1.6 | GO:0007538 | primary sex determination(GO:0007538) |
| 0.5 | 19.1 | GO:0008045 | motor neuron axon guidance(GO:0008045) |
| 0.5 | 2.4 | GO:0070433 | negative regulation of nucleotide-binding oligomerization domain containing signaling pathway(GO:0070425) negative regulation of nucleotide-binding oligomerization domain containing 2 signaling pathway(GO:0070433) |
| 0.5 | 0.5 | GO:0046668 | regulation of retinal cell programmed cell death(GO:0046668) |
| 0.5 | 6.2 | GO:0006388 | tRNA splicing, via endonucleolytic cleavage and ligation(GO:0006388) |
| 0.5 | 1.8 | GO:0007113 | endomitotic cell cycle(GO:0007113) |
| 0.5 | 2.3 | GO:1900245 | positive regulation of MDA-5 signaling pathway(GO:1900245) |
| 0.5 | 2.7 | GO:0035063 | nuclear speck organization(GO:0035063) |
| 0.5 | 2.3 | GO:1904970 | brush border assembly(GO:1904970) |
| 0.4 | 7.2 | GO:1902083 | negative regulation of peptidyl-cysteine S-nitrosylation(GO:1902083) |
| 0.4 | 2.6 | GO:0032468 | Golgi calcium ion homeostasis(GO:0032468) |
| 0.4 | 1.3 | GO:0019285 | glycine betaine biosynthetic process from choline(GO:0019285) glycine betaine metabolic process(GO:0031455) glycine betaine biosynthetic process(GO:0031456) |
| 0.4 | 2.1 | GO:0070966 | nuclear-transcribed mRNA catabolic process, no-go decay(GO:0070966) |
| 0.4 | 1.7 | GO:0035927 | RNA import into mitochondrion(GO:0035927) |
| 0.4 | 3.7 | GO:0098814 | spontaneous neurotransmitter secretion(GO:0061669) spontaneous synaptic transmission(GO:0098814) |
| 0.4 | 6.0 | GO:0007258 | JUN phosphorylation(GO:0007258) |
| 0.4 | 1.2 | GO:1901624 | negative regulation of lymphocyte chemotaxis(GO:1901624) |
| 0.4 | 1.6 | GO:0090290 | positive regulation of osteoclast proliferation(GO:0090290) negative regulation of bone mineralization involved in bone maturation(GO:1900158) |
| 0.4 | 0.8 | GO:0099543 | retrograde trans-synaptic signaling by soluble gas(GO:0098923) trans-synaptic signaling by soluble gas(GO:0099543) |
| 0.4 | 1.1 | GO:0044565 | dendritic cell proliferation(GO:0044565) |
| 0.4 | 2.3 | GO:0006001 | fructose catabolic process(GO:0006001) fructose catabolic process to hydroxyacetone phosphate and glyceraldehyde-3-phosphate(GO:0061624) |
| 0.3 | 1.0 | GO:0001831 | trophectodermal cellular morphogenesis(GO:0001831) |
| 0.3 | 2.0 | GO:0006543 | glutamine catabolic process(GO:0006543) |
| 0.3 | 1.5 | GO:0071109 | superior temporal gyrus development(GO:0071109) |
| 0.3 | 6.1 | GO:0030277 | maintenance of gastrointestinal epithelium(GO:0030277) |
| 0.3 | 2.1 | GO:0044245 | polysaccharide digestion(GO:0044245) |
| 0.3 | 7.3 | GO:0070262 | peptidyl-serine dephosphorylation(GO:0070262) |
| 0.3 | 3.9 | GO:0045722 | positive regulation of gluconeogenesis(GO:0045722) |
| 0.3 | 5.7 | GO:0001829 | trophectodermal cell differentiation(GO:0001829) |
| 0.3 | 1.2 | GO:2000393 | negative regulation of lamellipodium morphogenesis(GO:2000393) |
| 0.3 | 2.0 | GO:1905068 | arterial endothelial cell fate commitment(GO:0060844) blood vessel endothelial cell fate commitment(GO:0060846) endothelial cell fate specification(GO:0060847) blood vessel lumenization(GO:0072554) blood vessel endothelial cell fate specification(GO:0097101) positive regulation of ephrin receptor signaling pathway(GO:1901189) positive regulation of canonical Wnt signaling pathway involved in cardiac muscle cell fate commitment(GO:1901297) positive regulation of canonical Wnt signaling pathway involved in heart development(GO:1905068) |
| 0.3 | 3.4 | GO:0016191 | synaptic vesicle uncoating(GO:0016191) |
| 0.3 | 11.2 | GO:0035640 | exploration behavior(GO:0035640) |
| 0.3 | 2.7 | GO:0071763 | nuclear membrane organization(GO:0071763) |
| 0.3 | 1.1 | GO:1903899 | positive regulation of PERK-mediated unfolded protein response(GO:1903899) |
| 0.2 | 1.9 | GO:0016139 | glycoside catabolic process(GO:0016139) |
| 0.2 | 22.8 | GO:0043647 | inositol phosphate metabolic process(GO:0043647) |
| 0.2 | 0.7 | GO:0090234 | regulation of kinetochore assembly(GO:0090234) |
| 0.2 | 0.7 | GO:0018312 | peptidyl-serine ADP-ribosylation(GO:0018312) |
| 0.2 | 2.4 | GO:0051967 | negative regulation of synaptic transmission, glutamatergic(GO:0051967) |
| 0.2 | 9.7 | GO:0046676 | negative regulation of insulin secretion(GO:0046676) |
| 0.2 | 1.9 | GO:0017062 | respiratory chain complex III assembly(GO:0017062) mitochondrial respiratory chain complex III assembly(GO:0034551) |
| 0.2 | 1.7 | GO:0035524 | proline transmembrane transport(GO:0035524) |
| 0.2 | 20.7 | GO:0050911 | detection of chemical stimulus involved in sensory perception of smell(GO:0050911) |
| 0.2 | 2.4 | GO:0048312 | intracellular distribution of mitochondria(GO:0048312) |
| 0.2 | 1.4 | GO:1990592 | protein polyufmylation(GO:1990564) protein K69-linked ufmylation(GO:1990592) |
| 0.2 | 2.2 | GO:0032074 | negative regulation of nuclease activity(GO:0032074) |
| 0.2 | 2.7 | GO:0071688 | striated muscle myosin thick filament assembly(GO:0071688) |
| 0.2 | 9.3 | GO:0061512 | protein localization to cilium(GO:0061512) |
| 0.2 | 4.6 | GO:2000369 | regulation of clathrin-mediated endocytosis(GO:2000369) |
| 0.2 | 1.2 | GO:2000253 | positive regulation of feeding behavior(GO:2000253) |
| 0.2 | 0.7 | GO:1904749 | regulation of protein localization to nucleolus(GO:1904749) |
| 0.2 | 2.4 | GO:0051661 | maintenance of centrosome location(GO:0051661) |
| 0.2 | 1.2 | GO:1904879 | positive regulation of calcium ion transmembrane transport via high voltage-gated calcium channel(GO:1904879) |
| 0.2 | 0.3 | GO:0003218 | cardiac left ventricle formation(GO:0003218) |
| 0.2 | 0.6 | GO:0039516 | modulation by virus of host molecular function(GO:0039506) suppression by virus of host molecular function(GO:0039507) suppression by virus of host catalytic activity(GO:0039513) modulation by virus of host catalytic activity(GO:0039516) suppression by virus of host cysteine-type endopeptidase activity involved in apoptotic process(GO:0039650) negative regulation by symbiont of host catalytic activity(GO:0052053) negative regulation by symbiont of host molecular function(GO:0052056) modulation by symbiont of host catalytic activity(GO:0052148) |
| 0.2 | 1.7 | GO:0045741 | positive regulation of epidermal growth factor-activated receptor activity(GO:0045741) |
| 0.2 | 1.8 | GO:0010739 | positive regulation of protein kinase A signaling(GO:0010739) |
| 0.1 | 4.6 | GO:1901687 | glutathione derivative metabolic process(GO:1901685) glutathione derivative biosynthetic process(GO:1901687) |
| 0.1 | 0.9 | GO:0030643 | cellular phosphate ion homeostasis(GO:0030643) cellular trivalent inorganic anion homeostasis(GO:0072502) |
| 0.1 | 5.0 | GO:0048665 | neuron fate specification(GO:0048665) |
| 0.1 | 3.6 | GO:0043968 | histone H2A acetylation(GO:0043968) |
| 0.1 | 5.3 | GO:0043278 | response to isoquinoline alkaloid(GO:0014072) response to morphine(GO:0043278) |
| 0.1 | 1.5 | GO:0008627 | intrinsic apoptotic signaling pathway in response to osmotic stress(GO:0008627) |
| 0.1 | 2.8 | GO:0007191 | adenylate cyclase-activating dopamine receptor signaling pathway(GO:0007191) |
| 0.1 | 1.2 | GO:0046959 | habituation(GO:0046959) |
| 0.1 | 0.6 | GO:0046952 | ketone body catabolic process(GO:0046952) |
| 0.1 | 11.1 | GO:0051965 | positive regulation of synapse assembly(GO:0051965) |
| 0.1 | 4.9 | GO:0000188 | inactivation of MAPK activity(GO:0000188) |
| 0.1 | 7.5 | GO:0061178 | regulation of insulin secretion involved in cellular response to glucose stimulus(GO:0061178) |
| 0.1 | 2.1 | GO:0010826 | negative regulation of centrosome duplication(GO:0010826) |
| 0.1 | 0.6 | GO:0016199 | axon midline choice point recognition(GO:0016199) |
| 0.1 | 2.1 | GO:0003301 | physiological muscle hypertrophy(GO:0003298) physiological cardiac muscle hypertrophy(GO:0003301) cell growth involved in cardiac muscle cell development(GO:0061049) |
| 0.1 | 0.8 | GO:0032233 | positive regulation of actin filament bundle assembly(GO:0032233) |
| 0.1 | 0.5 | GO:0070131 | positive regulation of mitochondrial translation(GO:0070131) |
| 0.1 | 0.5 | GO:0046391 | 5-phosphoribose 1-diphosphate biosynthetic process(GO:0006015) 5-phosphoribose 1-diphosphate metabolic process(GO:0046391) |
| 0.1 | 0.5 | GO:0006127 | glycerophosphate shuttle(GO:0006127) |
| 0.1 | 0.6 | GO:0018095 | protein polyglutamylation(GO:0018095) |
| 0.1 | 0.4 | GO:0032328 | alanine transport(GO:0032328) |
| 0.1 | 2.2 | GO:0071420 | response to histamine(GO:0034776) cellular response to histamine(GO:0071420) |
| 0.1 | 15.6 | GO:0007156 | homophilic cell adhesion via plasma membrane adhesion molecules(GO:0007156) |
| 0.1 | 0.3 | GO:0009085 | lysine biosynthetic process(GO:0009085) lysine biosynthetic process via aminoadipic acid(GO:0019878) L-lysine catabolic process to acetyl-CoA via saccharopine(GO:0033512) |
| 0.1 | 10.1 | GO:0006334 | nucleosome assembly(GO:0006334) |
| 0.1 | 4.3 | GO:0070884 | regulation of calcineurin-NFAT signaling cascade(GO:0070884) |
| 0.1 | 2.6 | GO:0032012 | regulation of ARF protein signal transduction(GO:0032012) |
| 0.1 | 2.1 | GO:0006590 | thyroid hormone generation(GO:0006590) |
| 0.1 | 0.8 | GO:0039663 | fusion of virus membrane with host plasma membrane(GO:0019064) membrane fusion involved in viral entry into host cell(GO:0039663) multi-organism membrane fusion(GO:0044800) |
| 0.1 | 3.5 | GO:0046329 | negative regulation of JNK cascade(GO:0046329) |
| 0.1 | 0.3 | GO:0051835 | positive regulation of synapse structural plasticity(GO:0051835) |
| 0.1 | 0.4 | GO:0052695 | cellular glucuronidation(GO:0052695) |
| 0.1 | 1.0 | GO:0000055 | ribosomal large subunit export from nucleus(GO:0000055) |
| 0.1 | 1.6 | GO:0006012 | galactose metabolic process(GO:0006012) |
| 0.1 | 0.2 | GO:0034471 | endonucleolytic cleavage to generate mature 5'-end of SSU-rRNA from (SSU-rRNA, 5.8S rRNA, LSU-rRNA)(GO:0000472) rRNA 5'-end processing(GO:0000967) ncRNA 5'-end processing(GO:0034471) |
| 0.1 | 0.2 | GO:0070682 | proteasome regulatory particle assembly(GO:0070682) |
| 0.1 | 0.6 | GO:0015825 | detection of virus(GO:0009597) L-serine transport(GO:0015825) |
| 0.1 | 0.9 | GO:2000389 | regulation of neutrophil extravasation(GO:2000389) |
| 0.1 | 0.4 | GO:0061737 | leukotriene signaling pathway(GO:0061737) |
| 0.1 | 2.1 | GO:1903861 | positive regulation of dendrite extension(GO:1903861) |
| 0.1 | 1.9 | GO:0000042 | protein targeting to Golgi(GO:0000042) |
| 0.1 | 1.1 | GO:0000076 | DNA replication checkpoint(GO:0000076) |
| 0.1 | 1.1 | GO:0007039 | protein catabolic process in the vacuole(GO:0007039) |
| 0.1 | 1.4 | GO:0030299 | intestinal cholesterol absorption(GO:0030299) intestinal lipid absorption(GO:0098856) |
| 0.1 | 1.6 | GO:0002323 | natural killer cell activation involved in immune response(GO:0002323) |
| 0.1 | 0.7 | GO:0035269 | protein O-linked mannosylation(GO:0035269) |
| 0.1 | 1.5 | GO:0006825 | copper ion transport(GO:0006825) |
| 0.1 | 1.0 | GO:0035635 | entry of bacterium into host cell(GO:0035635) |
| 0.1 | 5.7 | GO:0030032 | lamellipodium assembly(GO:0030032) |
| 0.1 | 1.2 | GO:0031293 | membrane protein intracellular domain proteolysis(GO:0031293) |
| 0.1 | 2.0 | GO:0007205 | protein kinase C-activating G-protein coupled receptor signaling pathway(GO:0007205) |
| 0.1 | 0.2 | GO:0002384 | hepatic immune response(GO:0002384) |
| 0.1 | 6.9 | GO:0050796 | regulation of insulin secretion(GO:0050796) |
| 0.1 | 0.2 | GO:2001034 | positive regulation of double-strand break repair via nonhomologous end joining(GO:2001034) |
| 0.1 | 1.4 | GO:0000729 | DNA double-strand break processing(GO:0000729) |
| 0.1 | 2.4 | GO:0030318 | melanocyte differentiation(GO:0030318) |
| 0.1 | 1.7 | GO:0010765 | positive regulation of sodium ion transport(GO:0010765) |
| 0.1 | 1.5 | GO:0034204 | lipid translocation(GO:0034204) phospholipid translocation(GO:0045332) |
| 0.0 | 0.7 | GO:0010839 | negative regulation of keratinocyte proliferation(GO:0010839) |
| 0.0 | 0.5 | GO:0045945 | positive regulation of transcription from RNA polymerase III promoter(GO:0045945) |
| 0.0 | 0.1 | GO:0009106 | lipoate metabolic process(GO:0009106) |
| 0.0 | 1.0 | GO:0090557 | establishment of endothelial intestinal barrier(GO:0090557) |
| 0.0 | 0.2 | GO:0043382 | positive regulation of memory T cell differentiation(GO:0043382) |
| 0.0 | 0.1 | GO:0060335 | positive regulation of response to interferon-gamma(GO:0060332) positive regulation of interferon-gamma-mediated signaling pathway(GO:0060335) |
| 0.0 | 5.5 | GO:0006805 | xenobiotic metabolic process(GO:0006805) |
| 0.0 | 0.1 | GO:0097535 | lymphoid lineage cell migration(GO:0097534) lymphoid lineage cell migration into thymus(GO:0097535) |
| 0.0 | 2.8 | GO:0021954 | central nervous system neuron development(GO:0021954) |
| 0.0 | 0.5 | GO:0006450 | regulation of translational fidelity(GO:0006450) |
| 0.0 | 2.9 | GO:0000381 | regulation of alternative mRNA splicing, via spliceosome(GO:0000381) |
| 0.0 | 0.3 | GO:0006032 | chitin metabolic process(GO:0006030) chitin catabolic process(GO:0006032) |
| 0.0 | 0.1 | GO:0001812 | positive regulation of type I hypersensitivity(GO:0001812) |
| 0.0 | 0.6 | GO:1904776 | regulation of protein localization to cell cortex(GO:1904776) positive regulation of protein localization to cell cortex(GO:1904778) |
| 0.0 | 4.6 | GO:0043149 | contractile actin filament bundle assembly(GO:0030038) stress fiber assembly(GO:0043149) |
| 0.0 | 0.2 | GO:0032377 | regulation of intracellular lipid transport(GO:0032377) regulation of intracellular sterol transport(GO:0032380) regulation of intracellular cholesterol transport(GO:0032383) |
| 0.0 | 0.6 | GO:0017144 | drug metabolic process(GO:0017144) |
| 0.0 | 0.1 | GO:0006663 | platelet activating factor biosynthetic process(GO:0006663) |
| 0.0 | 0.6 | GO:0010575 | positive regulation of vascular endothelial growth factor production(GO:0010575) |
| 0.0 | 0.5 | GO:0090110 | cargo loading into COPII-coated vesicle(GO:0090110) |
| 0.0 | 0.6 | GO:0016973 | poly(A)+ mRNA export from nucleus(GO:0016973) |
| 0.0 | 0.7 | GO:0043555 | regulation of translation in response to stress(GO:0043555) |
| 0.0 | 0.2 | GO:0009650 | UV protection(GO:0009650) |
| 0.0 | 1.0 | GO:1903959 | regulation of anion transmembrane transport(GO:1903959) |
| 0.0 | 0.2 | GO:0090050 | positive regulation of cell migration involved in sprouting angiogenesis(GO:0090050) |
| 0.0 | 0.8 | GO:0045898 | regulation of RNA polymerase II transcriptional preinitiation complex assembly(GO:0045898) |
| 0.0 | 6.0 | GO:0072659 | protein localization to plasma membrane(GO:0072659) |
| 0.0 | 0.2 | GO:0045794 | negative regulation of cell volume(GO:0045794) |
| 0.0 | 2.5 | GO:0007030 | Golgi organization(GO:0007030) |
| 0.0 | 0.1 | GO:1990414 | replication-born double-strand break repair via sister chromatid exchange(GO:1990414) |
| 0.0 | 2.6 | GO:0065004 | protein-DNA complex assembly(GO:0065004) |
| 0.0 | 0.5 | GO:0033234 | negative regulation of protein sumoylation(GO:0033234) |
| 0.0 | 2.2 | GO:0007286 | spermatid development(GO:0007286) |
| 0.0 | 1.1 | GO:0051865 | protein autoubiquitination(GO:0051865) |
| 0.0 | 1.4 | GO:0090502 | RNA phosphodiester bond hydrolysis, endonucleolytic(GO:0090502) |
| 0.0 | 1.6 | GO:0006446 | regulation of translational initiation(GO:0006446) |
| 0.0 | 1.6 | GO:0016575 | histone deacetylation(GO:0016575) |
| 0.0 | 0.5 | GO:0042994 | cytoplasmic sequestering of transcription factor(GO:0042994) |
| 0.0 | 0.3 | GO:0006054 | N-acetylneuraminate metabolic process(GO:0006054) |
| 0.0 | 0.6 | GO:0006699 | bile acid biosynthetic process(GO:0006699) |
| 0.0 | 1.1 | GO:0006749 | glutathione metabolic process(GO:0006749) |
| 0.0 | 0.6 | GO:0048854 | interstrand cross-link repair(GO:0036297) brain morphogenesis(GO:0048854) |
| 0.0 | 0.7 | GO:0007274 | neuromuscular synaptic transmission(GO:0007274) |
| 0.0 | 0.1 | GO:0048386 | positive regulation of retinoic acid receptor signaling pathway(GO:0048386) |
| 0.0 | 1.7 | GO:0048813 | dendrite morphogenesis(GO:0048813) |
| 0.0 | 0.3 | GO:0032780 | negative regulation of ATPase activity(GO:0032780) |
| 0.0 | 0.2 | GO:0000185 | activation of MAPKKK activity(GO:0000185) |
| 0.0 | 0.2 | GO:0070327 | thyroid hormone transport(GO:0070327) |
| 0.0 | 0.6 | GO:0070830 | bicellular tight junction assembly(GO:0070830) |
| 0.0 | 0.3 | GO:0051482 | positive regulation of cytosolic calcium ion concentration involved in phospholipase C-activating G-protein coupled signaling pathway(GO:0051482) |
| 0.0 | 0.2 | GO:2000273 | positive regulation of receptor activity(GO:2000273) |
Gene overrepresentation in cellular component category:
| Log-likelihood per target | Total log-likelihood | Term | Description |
|---|---|---|---|
| 1.5 | 6.2 | GO:0071920 | cleavage body(GO:0071920) |
| 1.5 | 7.6 | GO:0060201 | clathrin-sculpted acetylcholine transport vesicle(GO:0060200) clathrin-sculpted acetylcholine transport vesicle membrane(GO:0060201) |
| 1.0 | 7.1 | GO:1990452 | Parkin-FBXW7-Cul1 ubiquitin ligase complex(GO:1990452) |
| 1.0 | 3.1 | GO:0031933 | telomeric heterochromatin(GO:0031933) |
| 1.0 | 3.9 | GO:0000308 | cytoplasmic cyclin-dependent protein kinase holoenzyme complex(GO:0000308) |
| 0.9 | 2.7 | GO:0072536 | interleukin-23 receptor complex(GO:0072536) |
| 0.8 | 4.2 | GO:0097454 | Schwann cell microvillus(GO:0097454) |
| 0.8 | 11.8 | GO:0035253 | ciliary rootlet(GO:0035253) |
| 0.6 | 13.2 | GO:0005952 | cAMP-dependent protein kinase complex(GO:0005952) |
| 0.6 | 8.7 | GO:0097433 | dense body(GO:0097433) |
| 0.6 | 2.2 | GO:0044307 | dendritic branch(GO:0044307) |
| 0.5 | 4.3 | GO:0097442 | CA3 pyramidal cell dendrite(GO:0097442) |
| 0.5 | 4.8 | GO:0070852 | cell body fiber(GO:0070852) |
| 0.5 | 9.2 | GO:0097025 | MPP7-DLG1-LIN7 complex(GO:0097025) |
| 0.5 | 3.6 | GO:0072487 | MSL complex(GO:0072487) |
| 0.3 | 7.5 | GO:0005868 | cytoplasmic dynein complex(GO:0005868) |
| 0.3 | 9.0 | GO:0035371 | microtubule plus-end(GO:0035371) |
| 0.3 | 8.1 | GO:0033268 | node of Ranvier(GO:0033268) |
| 0.3 | 3.5 | GO:0033010 | paranodal junction(GO:0033010) |
| 0.2 | 9.1 | GO:0031092 | platelet alpha granule membrane(GO:0031092) |
| 0.2 | 2.0 | GO:0002193 | MAML1-RBP-Jkappa- ICN1 complex(GO:0002193) |
| 0.2 | 1.1 | GO:0043194 | axon initial segment(GO:0043194) |
| 0.2 | 20.9 | GO:0045334 | clathrin-coated endocytic vesicle(GO:0045334) |
| 0.2 | 1.1 | GO:0030896 | checkpoint clamp complex(GO:0030896) |
| 0.2 | 8.4 | GO:0000159 | protein phosphatase type 2A complex(GO:0000159) |
| 0.2 | 9.2 | GO:0030673 | axolemma(GO:0030673) |
| 0.2 | 1.7 | GO:0005742 | mitochondrial outer membrane translocase complex(GO:0005742) |
| 0.2 | 10.5 | GO:0005801 | cis-Golgi network(GO:0005801) |
| 0.2 | 0.5 | GO:0097058 | CRLF-CLCF1 complex(GO:0097058) |
| 0.1 | 1.9 | GO:0005750 | mitochondrial respiratory chain complex III(GO:0005750) respiratory chain complex III(GO:0045275) |
| 0.1 | 5.0 | GO:0030173 | integral component of Golgi membrane(GO:0030173) |
| 0.1 | 1.0 | GO:0005827 | polar microtubule(GO:0005827) |
| 0.1 | 2.3 | GO:0030056 | hemidesmosome(GO:0030056) |
| 0.1 | 2.3 | GO:0016281 | eukaryotic translation initiation factor 4F complex(GO:0016281) |
| 0.1 | 5.4 | GO:0019005 | SCF ubiquitin ligase complex(GO:0019005) |
| 0.1 | 11.6 | GO:0097517 | stress fiber(GO:0001725) contractile actin filament bundle(GO:0097517) |
| 0.1 | 0.6 | GO:0070847 | core mediator complex(GO:0070847) |
| 0.1 | 2.1 | GO:0036038 | MKS complex(GO:0036038) |
| 0.1 | 0.2 | GO:0002079 | inner acrosomal membrane(GO:0002079) |
| 0.1 | 1.8 | GO:0000164 | protein phosphatase type 1 complex(GO:0000164) |
| 0.1 | 3.5 | GO:0005720 | nuclear heterochromatin(GO:0005720) |
| 0.1 | 4.8 | GO:0048786 | presynaptic active zone(GO:0048786) |
| 0.1 | 1.0 | GO:0005915 | zonula adherens(GO:0005915) |
| 0.1 | 0.7 | GO:0030991 | intraciliary transport particle A(GO:0030991) |
| 0.1 | 25.0 | GO:0043209 | myelin sheath(GO:0043209) |
| 0.1 | 7.0 | GO:0043195 | terminal bouton(GO:0043195) |
| 0.1 | 2.1 | GO:0031307 | integral component of mitochondrial outer membrane(GO:0031307) |
| 0.1 | 15.5 | GO:0043197 | dendritic spine(GO:0043197) |
| 0.1 | 3.0 | GO:0090545 | NuRD complex(GO:0016581) CHD-type complex(GO:0090545) |
| 0.1 | 1.0 | GO:0016013 | syntrophin complex(GO:0016013) |
| 0.1 | 0.5 | GO:0009331 | glycerol-3-phosphate dehydrogenase complex(GO:0009331) |
| 0.1 | 13.7 | GO:0030427 | site of polarized growth(GO:0030427) |
| 0.1 | 8.7 | GO:0005903 | brush border(GO:0005903) |
| 0.1 | 1.7 | GO:0070971 | endoplasmic reticulum exit site(GO:0070971) |
| 0.1 | 1.2 | GO:0000974 | Prp19 complex(GO:0000974) |
| 0.1 | 2.5 | GO:0016514 | SWI/SNF complex(GO:0016514) npBAF complex(GO:0071564) |
| 0.1 | 5.1 | GO:0005604 | basement membrane(GO:0005604) |
| 0.1 | 1.4 | GO:1990454 | L-type voltage-gated calcium channel complex(GO:1990454) |
| 0.1 | 0.7 | GO:0031595 | nuclear proteasome complex(GO:0031595) |
| 0.1 | 1.0 | GO:0070937 | CRD-mediated mRNA stability complex(GO:0070937) |
| 0.1 | 2.2 | GO:0032589 | neuron projection membrane(GO:0032589) |
| 0.1 | 1.6 | GO:0005779 | integral component of peroxisomal membrane(GO:0005779) intrinsic component of peroxisomal membrane(GO:0031231) |
| 0.1 | 2.7 | GO:0031430 | M band(GO:0031430) |
| 0.1 | 0.2 | GO:0005896 | interleukin-6 receptor complex(GO:0005896) |
| 0.1 | 22.1 | GO:0045121 | membrane raft(GO:0045121) |
| 0.1 | 19.4 | GO:0005788 | endoplasmic reticulum lumen(GO:0005788) |
| 0.1 | 0.6 | GO:0043240 | Fanconi anaemia nuclear complex(GO:0043240) |
| 0.0 | 0.6 | GO:0008091 | spectrin(GO:0008091) |
| 0.0 | 1.0 | GO:0097546 | ciliary base(GO:0097546) |
| 0.0 | 15.8 | GO:0030425 | dendrite(GO:0030425) |
| 0.0 | 0.7 | GO:0005736 | DNA-directed RNA polymerase I complex(GO:0005736) |
| 0.0 | 2.5 | GO:0005637 | nuclear inner membrane(GO:0005637) |
| 0.0 | 1.9 | GO:0031907 | peroxisomal matrix(GO:0005782) microbody lumen(GO:0031907) |
| 0.0 | 0.6 | GO:0000346 | transcription export complex(GO:0000346) |
| 0.0 | 0.2 | GO:0005721 | pericentric heterochromatin(GO:0005721) |
| 0.0 | 0.2 | GO:0030688 | preribosome, small subunit precursor(GO:0030688) |
| 0.0 | 2.5 | GO:0030018 | Z disc(GO:0030018) |
| 0.0 | 3.3 | GO:0005875 | microtubule associated complex(GO:0005875) |
| 0.0 | 5.0 | GO:0005802 | trans-Golgi network(GO:0005802) |
| 0.0 | 0.1 | GO:0097470 | ribbon synapse(GO:0097470) |
| 0.0 | 0.8 | GO:0031519 | PcG protein complex(GO:0031519) |
| 0.0 | 1.9 | GO:0031902 | late endosome membrane(GO:0031902) |
| 0.0 | 6.0 | GO:0043005 | neuron projection(GO:0043005) |
| 0.0 | 1.3 | GO:0031985 | Golgi cisterna(GO:0031985) |
| 0.0 | 0.2 | GO:0097431 | mitotic spindle pole(GO:0097431) |
| 0.0 | 2.0 | GO:0099572 | postsynaptic density(GO:0014069) postsynaptic specialization(GO:0099572) |
| 0.0 | 5.0 | GO:0045202 | synapse(GO:0045202) |
| 0.0 | 3.3 | GO:0043235 | receptor complex(GO:0043235) |
| 0.0 | 0.5 | GO:0031463 | Cul3-RING ubiquitin ligase complex(GO:0031463) |
Gene overrepresentation in molecular function category:
| Log-likelihood per target | Total log-likelihood | Term | Description |
|---|---|---|---|
| 4.0 | 20.2 | GO:0016316 | phosphatidylinositol-3,4-bisphosphate 4-phosphatase activity(GO:0016316) inositol-1,3,4-trisphosphate 4-phosphatase activity(GO:0017161) phosphatidylinositol-4,5-bisphosphate 4-phosphatase activity(GO:0034597) inositol-3,4-bisphosphate 4-phosphatase activity(GO:0052828) |
| 2.0 | 16.0 | GO:0052832 | inositol monophosphate 1-phosphatase activity(GO:0008934) inositol monophosphate 3-phosphatase activity(GO:0052832) inositol monophosphate 4-phosphatase activity(GO:0052833) inositol monophosphate phosphatase activity(GO:0052834) |
| 1.5 | 6.2 | GO:0033677 | DNA/RNA helicase activity(GO:0033677) |
| 1.5 | 7.6 | GO:0030348 | syntaxin-3 binding(GO:0030348) |
| 1.5 | 18.0 | GO:0019911 | structural constituent of myelin sheath(GO:0019911) |
| 1.4 | 4.1 | GO:0005457 | GDP-fucose transmembrane transporter activity(GO:0005457) purine nucleotide-sugar transmembrane transporter activity(GO:0036080) |
| 1.2 | 3.6 | GO:0004534 | 5'-3' exoribonuclease activity(GO:0004534) |
| 1.2 | 7.1 | GO:0060961 | phospholipase D inhibitor activity(GO:0060961) |
| 1.0 | 4.1 | GO:0003983 | UTP:glucose-1-phosphate uridylyltransferase activity(GO:0003983) UTP-monosaccharide-1-phosphate uridylyltransferase activity(GO:0051748) |
| 1.0 | 3.1 | GO:0015616 | DNA translocase activity(GO:0015616) |
| 1.0 | 3.8 | GO:0035373 | chondroitin sulfate proteoglycan binding(GO:0035373) |
| 0.9 | 7.1 | GO:0050816 | phosphothreonine binding(GO:0050816) |
| 0.9 | 2.7 | GO:0042020 | interleukin-23 binding(GO:0042019) interleukin-23 receptor activity(GO:0042020) |
| 0.9 | 13.8 | GO:0004691 | cAMP-dependent protein kinase activity(GO:0004691) |
| 0.9 | 4.3 | GO:0008532 | N-acetyllactosaminide beta-1,3-N-acetylglucosaminyltransferase activity(GO:0008532) |
| 0.8 | 2.5 | GO:0004556 | alpha-amylase activity(GO:0004556) |
| 0.8 | 2.4 | GO:0044594 | 3alpha,7alpha,12alpha-trihydroxy-5beta-cholest-24-enoyl-CoA hydratase activity(GO:0033989) 17-beta-hydroxysteroid dehydrogenase (NAD+) activity(GO:0044594) |
| 0.8 | 6.9 | GO:0008597 | calcium-dependent protein serine/threonine phosphatase regulator activity(GO:0008597) |
| 0.7 | 4.2 | GO:0004046 | aminoacylase activity(GO:0004046) |
| 0.7 | 7.1 | GO:0005549 | odorant binding(GO:0005549) |
| 0.7 | 4.0 | GO:0038062 | protein tyrosine kinase collagen receptor activity(GO:0038062) |
| 0.7 | 18.7 | GO:0008574 | ATP-dependent microtubule motor activity, plus-end-directed(GO:0008574) |
| 0.7 | 9.2 | GO:0015501 | glutamate:sodium symporter activity(GO:0015501) |
| 0.6 | 4.9 | GO:0015235 | cobalamin transporter activity(GO:0015235) |
| 0.6 | 8.3 | GO:0017162 | aryl hydrocarbon receptor binding(GO:0017162) |
| 0.5 | 1.6 | GO:0050528 | acyloxyacyl hydrolase activity(GO:0050528) |
| 0.5 | 1.6 | GO:0033858 | N-acetylgalactosamine kinase activity(GO:0033858) |
| 0.5 | 1.6 | GO:0080019 | fatty-acyl-CoA reductase (alcohol-forming) activity(GO:0080019) |
| 0.5 | 9.2 | GO:0097016 | L27 domain binding(GO:0097016) |
| 0.5 | 6.0 | GO:0004705 | JUN kinase activity(GO:0004705) SAP kinase activity(GO:0016909) |
| 0.4 | 7.9 | GO:0008432 | JUN kinase binding(GO:0008432) |
| 0.4 | 2.1 | GO:0004447 | iodide peroxidase activity(GO:0004447) |
| 0.4 | 1.6 | GO:0051733 | ATP-dependent polydeoxyribonucleotide 5'-hydroxyl-kinase activity(GO:0046404) polydeoxyribonucleotide kinase activity(GO:0051733) ATP-dependent polynucleotide kinase activity(GO:0051734) |
| 0.4 | 6.5 | GO:0003680 | AT DNA binding(GO:0003680) |
| 0.4 | 2.3 | GO:0018479 | benzaldehyde dehydrogenase (NAD+) activity(GO:0018479) |
| 0.4 | 4.4 | GO:0043176 | amine binding(GO:0043176) serotonin binding(GO:0051378) |
| 0.3 | 5.2 | GO:0005344 | oxygen transporter activity(GO:0005344) |
| 0.3 | 1.0 | GO:0031208 | POZ domain binding(GO:0031208) |
| 0.3 | 4.1 | GO:0038132 | neuregulin binding(GO:0038132) |
| 0.3 | 1.7 | GO:0005298 | proline:sodium symporter activity(GO:0005298) |
| 0.3 | 28.2 | GO:0050840 | extracellular matrix binding(GO:0050840) |
| 0.3 | 5.3 | GO:0031821 | G-protein coupled serotonin receptor binding(GO:0031821) |
| 0.3 | 2.0 | GO:0004359 | glutaminase activity(GO:0004359) |
| 0.3 | 4.6 | GO:0035612 | AP-2 adaptor complex binding(GO:0035612) |
| 0.3 | 6.3 | GO:0002162 | dystroglycan binding(GO:0002162) |
| 0.3 | 8.5 | GO:0017075 | syntaxin-1 binding(GO:0017075) |
| 0.3 | 1.4 | GO:0004522 | ribonuclease A activity(GO:0004522) |
| 0.3 | 2.4 | GO:0015277 | kainate selective glutamate receptor activity(GO:0015277) |
| 0.3 | 1.8 | GO:0019788 | NEDD8 transferase activity(GO:0019788) |
| 0.3 | 3.3 | GO:0043295 | glutathione binding(GO:0043295) |
| 0.2 | 2.2 | GO:0070492 | oligosaccharide binding(GO:0070492) |
| 0.2 | 1.9 | GO:0008046 | axon guidance receptor activity(GO:0008046) |
| 0.2 | 1.9 | GO:0008121 | ubiquinol-cytochrome-c reductase activity(GO:0008121) oxidoreductase activity, acting on diphenols and related substances as donors, cytochrome as acceptor(GO:0016681) |
| 0.2 | 0.9 | GO:0000822 | inositol hexakisphosphate binding(GO:0000822) |
| 0.2 | 9.5 | GO:0017091 | AU-rich element binding(GO:0017091) |
| 0.2 | 1.4 | GO:0008310 | single-stranded DNA 3'-5' exodeoxyribonuclease activity(GO:0008310) |
| 0.2 | 2.1 | GO:0042731 | PH domain binding(GO:0042731) |
| 0.2 | 1.7 | GO:0015450 | P-P-bond-hydrolysis-driven protein transmembrane transporter activity(GO:0015450) |
| 0.2 | 0.6 | GO:0003858 | 3-hydroxybutyrate dehydrogenase activity(GO:0003858) |
| 0.2 | 0.6 | GO:0050146 | nucleoside phosphotransferase activity(GO:0050146) |
| 0.2 | 12.0 | GO:0015485 | cholesterol binding(GO:0015485) |
| 0.2 | 5.3 | GO:0001965 | G-protein alpha-subunit binding(GO:0001965) |
| 0.2 | 1.5 | GO:0016724 | ferroxidase activity(GO:0004322) oxidoreductase activity, oxidizing metal ions, oxygen as acceptor(GO:0016724) |
| 0.2 | 3.1 | GO:0004143 | diacylglycerol kinase activity(GO:0004143) |
| 0.2 | 3.8 | GO:0001011 | transcription factor activity, sequence-specific DNA binding, RNA polymerase recruiting(GO:0001011) transcription factor activity, TFIIB-class binding(GO:0001087) |
| 0.2 | 3.0 | GO:0042043 | neurexin family protein binding(GO:0042043) |
| 0.2 | 6.4 | GO:0008157 | protein phosphatase 1 binding(GO:0008157) |
| 0.2 | 2.7 | GO:0031432 | titin binding(GO:0031432) |
| 0.2 | 2.2 | GO:0051864 | histone demethylase activity (H3-K36 specific)(GO:0051864) |
| 0.2 | 2.9 | GO:0031005 | filamin binding(GO:0031005) |
| 0.1 | 13.7 | GO:0004984 | olfactory receptor activity(GO:0004984) |
| 0.1 | 2.3 | GO:0005176 | ErbB-2 class receptor binding(GO:0005176) |
| 0.1 | 2.0 | GO:0086080 | protein binding involved in heterotypic cell-cell adhesion(GO:0086080) |
| 0.1 | 1.1 | GO:0044323 | retinoic acid-responsive element binding(GO:0044323) |
| 0.1 | 6.4 | GO:0046875 | ephrin receptor binding(GO:0046875) |
| 0.1 | 0.5 | GO:0052591 | sn-glycerol-3-phosphate:ubiquinone oxidoreductase activity(GO:0052590) sn-glycerol-3-phosphate:ubiquinone-8 oxidoreductase activity(GO:0052591) |
| 0.1 | 2.0 | GO:0000150 | recombinase activity(GO:0000150) |
| 0.1 | 1.3 | GO:0033038 | bitter taste receptor activity(GO:0033038) |
| 0.1 | 4.3 | GO:0004709 | MAP kinase kinase kinase activity(GO:0004709) |
| 0.1 | 0.7 | GO:0035252 | UDP-xylosyltransferase activity(GO:0035252) xylosyltransferase activity(GO:0042285) |
| 0.1 | 0.7 | GO:0003998 | acylphosphatase activity(GO:0003998) |
| 0.1 | 0.7 | GO:0016929 | SUMO-specific protease activity(GO:0016929) |
| 0.1 | 1.3 | GO:0010314 | phosphatidylinositol-5-phosphate binding(GO:0010314) |
| 0.1 | 2.5 | GO:0052629 | phosphatidylinositol-3,5-bisphosphate 3-phosphatase activity(GO:0052629) |
| 0.1 | 10.2 | GO:0019888 | protein phosphatase regulator activity(GO:0019888) |
| 0.1 | 3.9 | GO:0030332 | cyclin binding(GO:0030332) |
| 0.1 | 1.4 | GO:0086056 | voltage-gated calcium channel activity involved in AV node cell action potential(GO:0086056) |
| 0.1 | 0.6 | GO:0097199 | cysteine-type endopeptidase activity involved in apoptotic signaling pathway(GO:0097199) |
| 0.1 | 1.6 | GO:0005132 | type I interferon receptor binding(GO:0005132) |
| 0.1 | 2.3 | GO:0000339 | RNA cap binding(GO:0000339) |
| 0.1 | 2.5 | GO:0005521 | lamin binding(GO:0005521) |
| 0.1 | 3.0 | GO:0071889 | 14-3-3 protein binding(GO:0071889) |
| 0.1 | 0.5 | GO:0004749 | ribose phosphate diphosphokinase activity(GO:0004749) |
| 0.1 | 2.6 | GO:0005388 | calcium-transporting ATPase activity(GO:0005388) |
| 0.1 | 4.1 | GO:0019894 | kinesin binding(GO:0019894) |
| 0.1 | 4.2 | GO:0030507 | spectrin binding(GO:0030507) |
| 0.1 | 0.7 | GO:0003910 | DNA ligase (ATP) activity(GO:0003910) |
| 0.1 | 2.5 | GO:0004181 | metallocarboxypeptidase activity(GO:0004181) |
| 0.1 | 3.4 | GO:0004364 | glutathione transferase activity(GO:0004364) |
| 0.1 | 2.1 | GO:0008093 | cytoskeletal adaptor activity(GO:0008093) |
| 0.1 | 0.2 | GO:0070119 | ciliary neurotrophic factor binding(GO:0070119) |
| 0.1 | 0.5 | GO:0005127 | ciliary neurotrophic factor receptor binding(GO:0005127) |
| 0.1 | 2.6 | GO:0005086 | ARF guanyl-nucleotide exchange factor activity(GO:0005086) |
| 0.1 | 2.6 | GO:0051428 | peptide hormone receptor binding(GO:0051428) |
| 0.1 | 0.7 | GO:0036402 | proteasome-activating ATPase activity(GO:0036402) |
| 0.1 | 0.5 | GO:0002161 | aminoacyl-tRNA editing activity(GO:0002161) |
| 0.1 | 0.6 | GO:0051425 | PTB domain binding(GO:0051425) |
| 0.1 | 4.2 | GO:0043022 | ribosome binding(GO:0043022) |
| 0.1 | 0.2 | GO:0030375 | thyroid hormone receptor activator activity(GO:0010861) thyroid hormone receptor coactivator activity(GO:0030375) |
| 0.1 | 0.4 | GO:0048101 | calcium- and calmodulin-regulated 3',5'-cyclic-GMP phosphodiesterase activity(GO:0048101) |
| 0.1 | 0.9 | GO:0008503 | benzodiazepine receptor activity(GO:0008503) |
| 0.1 | 0.9 | GO:0015248 | sterol transporter activity(GO:0015248) |
| 0.1 | 0.3 | GO:0023029 | MHC class I protein complex binding(GO:0023024) MHC class Ib protein binding(GO:0023029) |
| 0.1 | 0.6 | GO:0017128 | phospholipid scramblase activity(GO:0017128) |
| 0.1 | 1.9 | GO:0004198 | calcium-dependent cysteine-type endopeptidase activity(GO:0004198) |
| 0.1 | 0.3 | GO:0070915 | lysophosphatidic acid receptor activity(GO:0070915) |
| 0.1 | 0.1 | GO:0016160 | amylase activity(GO:0016160) |
| 0.1 | 1.3 | GO:0004029 | aldehyde dehydrogenase (NAD) activity(GO:0004029) |
| 0.1 | 1.4 | GO:0004806 | triglyceride lipase activity(GO:0004806) |
| 0.1 | 0.3 | GO:0045029 | UDP-activated nucleotide receptor activity(GO:0045029) |
| 0.1 | 0.8 | GO:0019957 | C-C chemokine binding(GO:0019957) |
| 0.1 | 1.5 | GO:0004012 | phospholipid-translocating ATPase activity(GO:0004012) |
| 0.1 | 0.5 | GO:0030280 | structural constituent of epidermis(GO:0030280) |
| 0.1 | 0.6 | GO:0015194 | L-serine transmembrane transporter activity(GO:0015194) serine transmembrane transporter activity(GO:0022889) |
| 0.1 | 0.4 | GO:0045499 | chemorepellent activity(GO:0045499) |
| 0.0 | 1.5 | GO:1905030 | voltage-gated sodium channel activity(GO:0005248) voltage-gated ion channel activity involved in regulation of postsynaptic membrane potential(GO:1905030) |
| 0.0 | 0.8 | GO:0043024 | ribosomal small subunit binding(GO:0043024) |
| 0.0 | 2.8 | GO:0030552 | cAMP binding(GO:0030552) |
| 0.0 | 1.0 | GO:0005247 | voltage-gated chloride channel activity(GO:0005247) |
| 0.0 | 1.0 | GO:0070300 | phosphatidic acid binding(GO:0070300) |
| 0.0 | 1.7 | GO:0070182 | DNA polymerase binding(GO:0070182) |
| 0.0 | 0.9 | GO:0008327 | methyl-CpG binding(GO:0008327) |
| 0.0 | 14.5 | GO:0001227 | transcriptional repressor activity, RNA polymerase II transcription regulatory region sequence-specific binding(GO:0001227) |
| 0.0 | 2.0 | GO:0051018 | protein kinase A binding(GO:0051018) |
| 0.0 | 0.1 | GO:0016979 | lipoate-protein ligase activity(GO:0016979) |
| 0.0 | 0.7 | GO:0001054 | RNA polymerase I activity(GO:0001054) |
| 0.0 | 0.7 | GO:0004000 | adenosine deaminase activity(GO:0004000) |
| 0.0 | 1.1 | GO:0097109 | neuroligin family protein binding(GO:0097109) |
| 0.0 | 1.1 | GO:0003950 | NAD+ ADP-ribosyltransferase activity(GO:0003950) |
| 0.0 | 2.4 | GO:0043621 | protein self-association(GO:0043621) |
| 0.0 | 2.3 | GO:0030374 | ligand-dependent nuclear receptor transcription coactivator activity(GO:0030374) |
| 0.0 | 1.8 | GO:0004407 | histone deacetylase activity(GO:0004407) |
| 0.0 | 0.6 | GO:0030898 | actin-dependent ATPase activity(GO:0030898) |
| 0.0 | 0.1 | GO:0008336 | gamma-butyrobetaine dioxygenase activity(GO:0008336) |
| 0.0 | 4.5 | GO:0005200 | structural constituent of cytoskeleton(GO:0005200) |
| 0.0 | 0.3 | GO:0008061 | chitinase activity(GO:0004568) chitin binding(GO:0008061) |
| 0.0 | 0.2 | GO:0004111 | creatine kinase activity(GO:0004111) |
| 0.0 | 0.6 | GO:0031683 | G-protein beta/gamma-subunit complex binding(GO:0031683) |
| 0.0 | 1.0 | GO:0097110 | scaffold protein binding(GO:0097110) |
| 0.0 | 5.8 | GO:0008017 | microtubule binding(GO:0008017) |
| 0.0 | 0.2 | GO:0060072 | large conductance calcium-activated potassium channel activity(GO:0060072) |
| 0.0 | 0.5 | GO:0070016 | armadillo repeat domain binding(GO:0070016) |
| 0.0 | 1.1 | GO:0008408 | 3'-5' exonuclease activity(GO:0008408) |
| 0.0 | 0.2 | GO:0032454 | histone demethylase activity (H3-K9 specific)(GO:0032454) |
| 0.0 | 0.1 | GO:0016618 | hydroxypyruvate reductase activity(GO:0016618) glyoxylate reductase (NADP) activity(GO:0030267) |
| 0.0 | 2.3 | GO:0005089 | Rho guanyl-nucleotide exchange factor activity(GO:0005089) |
| 0.0 | 0.7 | GO:0043027 | cysteine-type endopeptidase inhibitor activity involved in apoptotic process(GO:0043027) |
| 0.0 | 0.4 | GO:0032451 | demethylase activity(GO:0032451) |
| 0.0 | 0.2 | GO:0015349 | thyroid hormone transmembrane transporter activity(GO:0015349) |
| 0.0 | 0.1 | GO:0009378 | four-way junction helicase activity(GO:0009378) |
| 0.0 | 0.1 | GO:0004445 | inositol-polyphosphate 5-phosphatase activity(GO:0004445) |
| 0.0 | 0.1 | GO:0008970 | phosphatidylcholine 1-acylhydrolase activity(GO:0008970) |
| 0.0 | 0.8 | GO:0005154 | epidermal growth factor receptor binding(GO:0005154) |
| 0.0 | 4.3 | GO:0005085 | guanyl-nucleotide exchange factor activity(GO:0005085) |
| 0.0 | 2.1 | GO:0017124 | SH3 domain binding(GO:0017124) |
| 0.0 | 0.7 | GO:0001105 | RNA polymerase II transcription coactivator activity(GO:0001105) |
| 0.0 | 0.9 | GO:0019905 | syntaxin binding(GO:0019905) |
| 0.0 | 0.6 | GO:0001104 | RNA polymerase II transcription cofactor activity(GO:0001104) |
| 0.0 | 0.1 | GO:0019863 | IgE binding(GO:0019863) |
| 0.0 | 2.3 | GO:0035091 | phosphatidylinositol binding(GO:0035091) |
| 0.0 | 0.3 | GO:0016646 | oxidoreductase activity, acting on the CH-NH group of donors, NAD or NADP as acceptor(GO:0016646) |
Gene overrepresentation in curated gene sets: canonical pathways category:
| Log-likelihood per target | Total log-likelihood | Term | Description |
|---|---|---|---|
| 0.5 | 41.1 | PID INTEGRIN A4B1 PATHWAY | Alpha4 beta1 integrin signaling events |
| 0.2 | 7.7 | PID RAC1 REG PATHWAY | Regulation of RAC1 activity |
| 0.2 | 5.2 | SA PTEN PATHWAY | PTEN is a tumor suppressor that dephosphorylates the lipid messenger phosphatidylinositol triphosphate. |
| 0.2 | 5.3 | PID S1P S1P4 PATHWAY | S1P4 pathway |
| 0.2 | 9.7 | SIG CD40PATHWAYMAP | Genes related to CD40 signaling |
| 0.2 | 4.5 | PID SYNDECAN 3 PATHWAY | Syndecan-3-mediated signaling events |
| 0.2 | 10.0 | PID CDC42 REG PATHWAY | Regulation of CDC42 activity |
| 0.1 | 7.0 | PID ALPHA SYNUCLEIN PATHWAY | Alpha-synuclein signaling |
| 0.1 | 7.8 | PID ATR PATHWAY | ATR signaling pathway |
| 0.1 | 4.3 | PID P38 MKK3 6PATHWAY | p38 MAPK signaling pathway |
| 0.1 | 7.4 | PID P38 ALPHA BETA DOWNSTREAM PATHWAY | Signaling mediated by p38-alpha and p38-beta |
| 0.1 | 6.1 | PID TCR CALCIUM PATHWAY | Calcium signaling in the CD4+ TCR pathway |
| 0.1 | 1.8 | PID LPA4 PATHWAY | LPA4-mediated signaling events |
| 0.1 | 6.1 | PID ECADHERIN NASCENT AJ PATHWAY | E-cadherin signaling in the nascent adherens junction |
| 0.1 | 1.2 | PID RHOA PATHWAY | RhoA signaling pathway |
| 0.1 | 2.5 | PID ERBB NETWORK PATHWAY | ErbB receptor signaling network |
| 0.1 | 4.3 | PID DELTA NP63 PATHWAY | Validated transcriptional targets of deltaNp63 isoforms |
| 0.1 | 3.0 | PID IL12 2PATHWAY | IL12-mediated signaling events |
| 0.1 | 1.8 | PID ERB GENOMIC PATHWAY | Validated nuclear estrogen receptor beta network |
| 0.1 | 2.4 | PID IL23 PATHWAY | IL23-mediated signaling events |
| 0.1 | 0.7 | SA B CELL RECEPTOR COMPLEXES | Antigen binding to B cell receptors activates protein tyrosine kinases, such as the Src family, which ultimate activate MAP kinases. |
| 0.0 | 1.6 | PID CD8 TCR DOWNSTREAM PATHWAY | Downstream signaling in naïve CD8+ T cells |
| 0.0 | 0.9 | PID NOTCH PATHWAY | Notch signaling pathway |
| 0.0 | 2.0 | PID ERA GENOMIC PATHWAY | Validated nuclear estrogen receptor alpha network |
| 0.0 | 2.0 | PID AJDISS 2PATHWAY | Posttranslational regulation of adherens junction stability and dissassembly |
| 0.0 | 1.0 | PID WNT CANONICAL PATHWAY | Canonical Wnt signaling pathway |
| 0.0 | 1.4 | ST DIFFERENTIATION PATHWAY IN PC12 CELLS | Differentiation Pathway in PC12 Cells; this is a specific case of PAC1 Receptor Pathway. |
| 0.0 | 1.8 | PID FCER1 PATHWAY | Fc-epsilon receptor I signaling in mast cells |
| 0.0 | 3.1 | PID CASPASE PATHWAY | Caspase cascade in apoptosis |
| 0.0 | 1.8 | PID HES HEY PATHWAY | Notch-mediated HES/HEY network |
| 0.0 | 0.4 | PID CXCR4 PATHWAY | CXCR4-mediated signaling events |
| 0.0 | 0.9 | PID LIS1 PATHWAY | Lissencephaly gene (LIS1) in neuronal migration and development |
| 0.0 | 1.8 | PID HDAC CLASSI PATHWAY | Signaling events mediated by HDAC Class I |
| 0.0 | 0.2 | ST STAT3 PATHWAY | STAT3 Pathway |
| 0.0 | 0.2 | PID EPHRINB REV PATHWAY | Ephrin B reverse signaling |
| 0.0 | 0.8 | PID MTOR 4PATHWAY | mTOR signaling pathway |
| 0.0 | 0.7 | PID AR TF PATHWAY | Regulation of Androgen receptor activity |
Gene overrepresentation in curated gene sets: REACTOME pathways category:
| Log-likelihood per target | Total log-likelihood | Term | Description |
|---|---|---|---|
| 1.1 | 22.7 | REACTOME SYNTHESIS OF PIPS AT THE EARLY ENDOSOME MEMBRANE | Genes involved in Synthesis of PIPs at the early endosome membrane |
| 0.5 | 19.1 | REACTOME RAP1 SIGNALLING | Genes involved in Rap1 signalling |
| 0.4 | 5.1 | REACTOME DIGESTION OF DIETARY CARBOHYDRATE | Genes involved in Digestion of dietary carbohydrate |
| 0.4 | 13.1 | REACTOME DCC MEDIATED ATTRACTIVE SIGNALING | Genes involved in DCC mediated attractive signaling |
| 0.3 | 7.6 | REACTOME NOREPINEPHRINE NEUROTRANSMITTER RELEASE CYCLE | Genes involved in Norepinephrine Neurotransmitter Release Cycle |
| 0.3 | 11.7 | REACTOME IONOTROPIC ACTIVITY OF KAINATE RECEPTORS | Genes involved in Ionotropic activity of Kainate Receptors |
| 0.3 | 4.4 | REACTOME SEROTONIN RECEPTORS | Genes involved in Serotonin receptors |
| 0.2 | 6.0 | REACTOME JNK C JUN KINASES PHOSPHORYLATION AND ACTIVATION MEDIATED BY ACTIVATED HUMAN TAK1 | Genes involved in JNK (c-Jun kinases) phosphorylation and activation mediated by activated human TAK1 |
| 0.2 | 3.6 | REACTOME DESTABILIZATION OF MRNA BY BRF1 | Genes involved in Destabilization of mRNA by Butyrate Response Factor 1 (BRF1) |
| 0.2 | 7.1 | REACTOME ASSOCIATION OF TRIC CCT WITH TARGET PROTEINS DURING BIOSYNTHESIS | Genes involved in Association of TriC/CCT with target proteins during biosynthesis |
| 0.2 | 6.1 | REACTOME GLUTATHIONE CONJUGATION | Genes involved in Glutathione conjugation |
| 0.2 | 4.1 | REACTOME GLUCURONIDATION | Genes involved in Glucuronidation |
| 0.2 | 6.9 | REACTOME INTERACTION BETWEEN L1 AND ANKYRINS | Genes involved in Interaction between L1 and Ankyrins |
| 0.2 | 2.4 | REACTOME GLUTAMATE NEUROTRANSMITTER RELEASE CYCLE | Genes involved in Glutamate Neurotransmitter Release Cycle |
| 0.2 | 13.9 | REACTOME OLFACTORY SIGNALING PATHWAY | Genes involved in Olfactory Signaling Pathway |
| 0.1 | 5.8 | REACTOME INHIBITION OF INSULIN SECRETION BY ADRENALINE NORADRENALINE | Genes involved in Inhibition of Insulin Secretion by Adrenaline/Noradrenaline |
| 0.1 | 2.6 | REACTOME ALPHA LINOLENIC ACID ALA METABOLISM | Genes involved in alpha-linolenic acid (ALA) metabolism |
| 0.1 | 0.8 | REACTOME BINDING AND ENTRY OF HIV VIRION | Genes involved in Binding and entry of HIV virion |
| 0.1 | 11.7 | REACTOME LOSS OF NLP FROM MITOTIC CENTROSOMES | Genes involved in Loss of Nlp from mitotic centrosomes |
| 0.1 | 5.8 | REACTOME G ALPHA Z SIGNALLING EVENTS | Genes involved in G alpha (z) signalling events |
| 0.1 | 2.0 | REACTOME NOTCH HLH TRANSCRIPTION PATHWAY | Genes involved in Notch-HLH transcription pathway |
| 0.1 | 8.4 | REACTOME AMINO ACID AND OLIGOPEPTIDE SLC TRANSPORTERS | Genes involved in Amino acid and oligopeptide SLC transporters |
| 0.1 | 11.2 | REACTOME INTEGRIN CELL SURFACE INTERACTIONS | Genes involved in Integrin cell surface interactions |
| 0.1 | 1.9 | REACTOME ACTIVATION OF RAC | Genes involved in Activation of Rac |
| 0.1 | 3.8 | REACTOME AMYLOIDS | Genes involved in Amyloids |
| 0.1 | 1.7 | REACTOME ACTIVATED NOTCH1 TRANSMITS SIGNAL TO THE NUCLEUS | Genes involved in Activated NOTCH1 Transmits Signal to the Nucleus |
| 0.1 | 2.9 | REACTOME DOWNREGULATION OF ERBB2 ERBB3 SIGNALING | Genes involved in Downregulation of ERBB2:ERBB3 signaling |
| 0.1 | 0.4 | REACTOME ENDOGENOUS STEROLS | Genes involved in Endogenous sterols |
| 0.1 | 1.6 | REACTOME PEROXISOMAL LIPID METABOLISM | Genes involved in Peroxisomal lipid metabolism |
| 0.1 | 3.4 | REACTOME LYSOSOME VESICLE BIOGENESIS | Genes involved in Lysosome Vesicle Biogenesis |
| 0.1 | 6.0 | REACTOME CIRCADIAN CLOCK | Genes involved in Circadian Clock |
| 0.1 | 4.0 | REACTOME ION TRANSPORT BY P TYPE ATPASES | Genes involved in Ion transport by P-type ATPases |
| 0.1 | 0.5 | REACTOME SYNTHESIS OF BILE ACIDS AND BILE SALTS VIA 24 HYDROXYCHOLESTEROL | Genes involved in Synthesis of bile acids and bile salts via 24-hydroxycholesterol |
| 0.1 | 0.3 | REACTOME YAP1 AND WWTR1 TAZ STIMULATED GENE EXPRESSION | Genes involved in YAP1- and WWTR1 (TAZ)-stimulated gene expression |
| 0.1 | 0.8 | REACTOME GLUCAGON SIGNALING IN METABOLIC REGULATION | Genes involved in Glucagon signaling in metabolic regulation |
| 0.1 | 1.1 | REACTOME TRAF3 DEPENDENT IRF ACTIVATION PATHWAY | Genes involved in TRAF3-dependent IRF activation pathway |
| 0.1 | 1.5 | REACTOME METAL ION SLC TRANSPORTERS | Genes involved in Metal ion SLC transporters |
| 0.1 | 0.6 | REACTOME NFKB ACTIVATION THROUGH FADD RIP1 PATHWAY MEDIATED BY CASPASE 8 AND10 | Genes involved in NF-kB activation through FADD/RIP-1 pathway mediated by caspase-8 and -10 |
| 0.0 | 0.5 | REACTOME CA DEPENDENT EVENTS | Genes involved in Ca-dependent events |
| 0.0 | 1.6 | REACTOME REGULATION OF IFNA SIGNALING | Genes involved in Regulation of IFNA signaling |
| 0.0 | 2.3 | REACTOME ANTIVIRAL MECHANISM BY IFN STIMULATED GENES | Genes involved in Antiviral mechanism by IFN-stimulated genes |
| 0.0 | 1.1 | REACTOME CTLA4 INHIBITORY SIGNALING | Genes involved in CTLA4 inhibitory signaling |
| 0.0 | 0.6 | REACTOME ABACAVIR TRANSPORT AND METABOLISM | Genes involved in Abacavir transport and metabolism |
| 0.0 | 0.7 | REACTOME ACTIVATION OF CHAPERONES BY ATF6 ALPHA | Genes involved in Activation of Chaperones by ATF6-alpha |
| 0.0 | 3.0 | REACTOME L1CAM INTERACTIONS | Genes involved in L1CAM interactions |
| 0.0 | 1.4 | REACTOME METABOLISM OF STEROID HORMONES AND VITAMINS A AND D | Genes involved in Metabolism of steroid hormones and vitamins A and D |
| 0.0 | 2.3 | REACTOME APOPTOTIC CLEAVAGE OF CELLULAR PROTEINS | Genes involved in Apoptotic cleavage of cellular proteins |
| 0.0 | 0.6 | REACTOME FANCONI ANEMIA PATHWAY | Genes involved in Fanconi Anemia pathway |
| 0.0 | 0.5 | REACTOME MITOCHONDRIAL TRNA AMINOACYLATION | Genes involved in Mitochondrial tRNA aminoacylation |
| 0.0 | 1.7 | REACTOME MITOCHONDRIAL PROTEIN IMPORT | Genes involved in Mitochondrial Protein Import |
| 0.0 | 0.4 | REACTOME SYNTHESIS OF PIPS AT THE GOLGI MEMBRANE | Genes involved in Synthesis of PIPs at the Golgi membrane |
| 0.0 | 0.2 | REACTOME IL 6 SIGNALING | Genes involved in Interleukin-6 signaling |
| 0.0 | 0.9 | REACTOME GABA A RECEPTOR ACTIVATION | Genes involved in GABA A receptor activation |
| 0.0 | 1.5 | REACTOME IMMUNOREGULATORY INTERACTIONS BETWEEN A LYMPHOID AND A NON LYMPHOID CELL | Genes involved in Immunoregulatory interactions between a Lymphoid and a non-Lymphoid cell |
| 0.0 | 0.5 | REACTOME TERMINATION OF O GLYCAN BIOSYNTHESIS | Genes involved in Termination of O-glycan biosynthesis |
| 0.0 | 1.4 | REACTOME REGULATION OF INSULIN SECRETION | Genes involved in Regulation of Insulin Secretion |
| 0.0 | 0.3 | REACTOME AMINE DERIVED HORMONES | Genes involved in Amine-derived hormones |
| 0.0 | 0.5 | REACTOME ADHERENS JUNCTIONS INTERACTIONS | Genes involved in Adherens junctions interactions |
| 0.0 | 1.0 | REACTOME NUCLEAR RECEPTOR TRANSCRIPTION PATHWAY | Genes involved in Nuclear Receptor transcription pathway |