Project
GNF SymAtlas + NCI-60 cancer cell lines, human (Su, 2004; Ross, 2000)
Navigation
Downloads
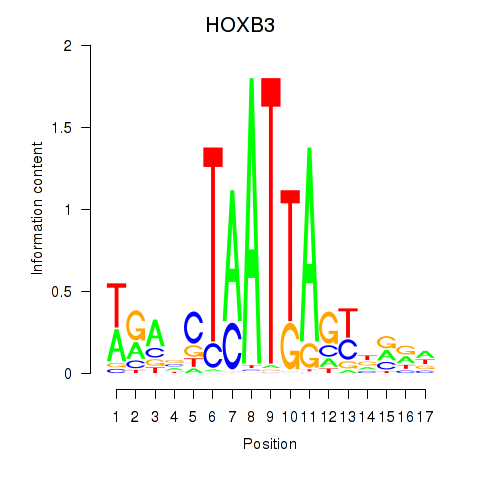
Results for HOXB3
Z-value: 0.74
Motif logo
Transcription factors associated with HOXB3
| Gene Symbol | Gene ID | Gene Info |
|---|---|---|
|
HOXB3
|
ENSG00000120093.12 | HOXB3 |
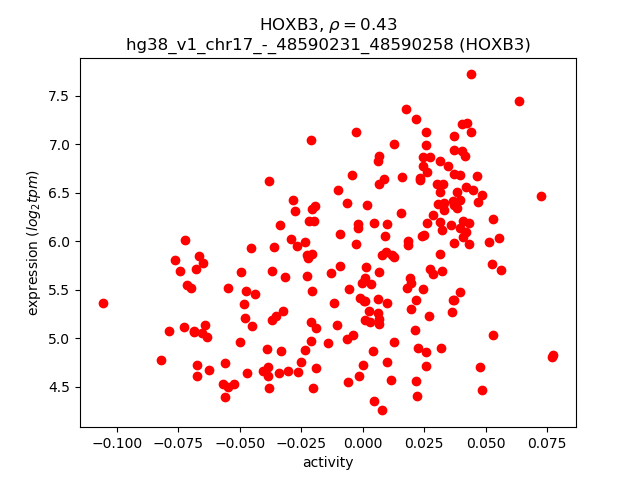
Activity-expression correlation:
| Gene | Promoter | Pearson corr. coef. | P-value | Plot |
|---|---|---|---|---|
| HOXB3 | hg38_v1_chr17_-_48590231_48590258 | 0.43 | 2.4e-11 | Click! |
Activity profile of HOXB3 motif
Sorted Z-values of HOXB3 motif
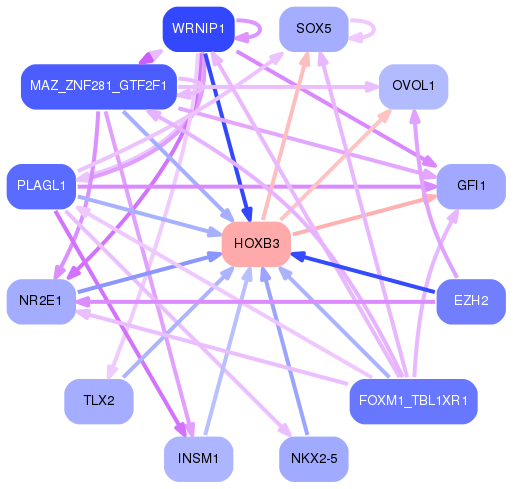
Network of associatons between targets according to the STRING database.

First level regulatory network of HOXB3
| Promoter | Score | Transcript | Gene | Gene Info |
|---|---|---|---|---|
| chr4_+_25160631 | 17.11 |
ENST00000510415.1
ENST00000507794.2 ENST00000512921.4 |
SEPSECS-AS1
PI4K2B
|
SEPSECS antisense RNA 1 (head to head) phosphatidylinositol 4-kinase type 2 beta |
| chr8_-_30812867 | 9.79 |
ENST00000518243.5
|
PPP2CB
|
protein phosphatase 2 catalytic subunit beta |
| chr5_+_36608146 | 9.05 |
ENST00000381918.4
ENST00000513646.1 |
SLC1A3
|
solute carrier family 1 member 3 |
| chrX_-_13817027 | 8.67 |
ENST00000493677.5
ENST00000355135.6 ENST00000316715.9 |
GPM6B
|
glycoprotein M6B |
| chr4_+_112860981 | 7.18 |
ENST00000671704.1
|
ANK2
|
ankyrin 2 |
| chr1_-_230745574 | 6.97 |
ENST00000681269.1
|
AGT
|
angiotensinogen |
| chr4_+_112860912 | 6.95 |
ENST00000671951.1
|
ANK2
|
ankyrin 2 |
| chr8_+_22275309 | 6.86 |
ENST00000356766.11
ENST00000521356.5 |
PIWIL2
|
piwi like RNA-mediated gene silencing 2 |
| chr19_+_17527250 | 6.75 |
ENST00000599164.6
ENST00000449408.6 ENST00000600871.5 ENST00000599124.1 |
NIBAN3
|
niban apoptosis regulator 3 |
| chr4_+_112861053 | 6.73 |
ENST00000672221.1
|
ANK2
|
ankyrin 2 |
| chr5_+_36606355 | 6.66 |
ENST00000681909.1
ENST00000513903.5 ENST00000681795.1 ENST00000680125.1 ENST00000612708.5 ENST00000680232.1 ENST00000681776.1 ENST00000681926.1 ENST00000679958.1 ENST00000265113.9 ENST00000504121.5 ENST00000512374.1 ENST00000613445.5 ENST00000679983.1 |
SLC1A3
|
solute carrier family 1 member 3 |
| chr3_+_319683 | 6.42 |
ENST00000620033.4
|
CHL1
|
cell adhesion molecule L1 like |
| chr4_-_175812746 | 6.13 |
ENST00000393658.6
|
GPM6A
|
glycoprotein M6A |
| chr6_-_52840843 | 5.96 |
ENST00000370989.6
|
GSTA5
|
glutathione S-transferase alpha 5 |
| chr11_+_121576760 | 5.92 |
ENST00000532694.5
ENST00000534286.5 |
SORL1
|
sortilin related receptor 1 |
| chr6_-_62286161 | 5.67 |
ENST00000281156.5
|
KHDRBS2
|
KH RNA binding domain containing, signal transduction associated 2 |
| chr17_+_1771688 | 5.44 |
ENST00000572048.1
ENST00000573763.1 |
SERPINF1
|
serpin family F member 1 |
| chr11_-_117877463 | 5.40 |
ENST00000527717.5
|
FXYD6
|
FXYD domain containing ion transport regulator 6 |
| chr11_+_95789965 | 5.36 |
ENST00000537677.5
|
CEP57
|
centrosomal protein 57 |
| chr5_+_140848360 | 5.34 |
ENST00000532602.2
|
PCDHA9
|
protocadherin alpha 9 |
| chr19_+_9185594 | 5.32 |
ENST00000344248.4
|
OR7D2
|
olfactory receptor family 7 subfamily D member 2 |
| chr1_+_9943428 | 5.09 |
ENST00000403197.5
ENST00000377205.6 |
NMNAT1
|
nicotinamide nucleotide adenylyltransferase 1 |
| chrX_-_108736556 | 5.03 |
ENST00000372129.4
|
IRS4
|
insulin receptor substrate 4 |
| chr20_+_9514562 | 4.77 |
ENST00000246070.3
|
LAMP5
|
lysosomal associated membrane protein family member 5 |
| chr9_-_76906041 | 4.54 |
ENST00000443509.6
ENST00000428286.5 ENST00000376713.3 |
PRUNE2
|
prune homolog 2 with BCH domain |
| chr15_+_78438279 | 4.46 |
ENST00000560440.5
|
IREB2
|
iron responsive element binding protein 2 |
| chr1_-_207052980 | 4.45 |
ENST00000367084.1
|
YOD1
|
YOD1 deubiquitinase |
| chr1_+_207053229 | 4.44 |
ENST00000367080.8
ENST00000367079.3 |
PFKFB2
|
6-phosphofructo-2-kinase/fructose-2,6-biphosphatase 2 |
| chr6_-_32128191 | 4.35 |
ENST00000453203.2
ENST00000375203.8 ENST00000375201.8 |
ATF6B
|
activating transcription factor 6 beta |
| chr17_+_42458844 | 4.26 |
ENST00000393829.6
ENST00000537728.5 ENST00000343619.9 ENST00000264649.10 ENST00000585525.5 ENST00000544137.5 ENST00000589727.5 ENST00000587824.5 |
ATP6V0A1
|
ATPase H+ transporting V0 subunit a1 |
| chr2_+_54123179 | 4.25 |
ENST00000606865.1
|
ACYP2
|
acylphosphatase 2 |
| chr16_+_6019016 | 4.19 |
ENST00000550418.6
|
RBFOX1
|
RNA binding fox-1 homolog 1 |
| chr6_+_160121859 | 4.12 |
ENST00000324965.8
ENST00000457470.6 |
SLC22A1
|
solute carrier family 22 member 1 |
| chr7_+_2519763 | 4.08 |
ENST00000222725.10
ENST00000359574.7 |
LFNG
|
LFNG O-fucosylpeptide 3-beta-N-acetylglucosaminyltransferase |
| chr3_+_131026844 | 4.07 |
ENST00000510769.5
ENST00000383366.9 ENST00000510688.5 ENST00000511262.5 |
NEK11
|
NIMA related kinase 11 |
| chr19_+_57320461 | 3.95 |
ENST00000321545.5
|
ZNF543
|
zinc finger protein 543 |
| chr11_-_129024157 | 3.80 |
ENST00000392657.7
|
ARHGAP32
|
Rho GTPase activating protein 32 |
| chr11_+_24496988 | 3.80 |
ENST00000336930.11
|
LUZP2
|
leucine zipper protein 2 |
| chr16_+_6019071 | 3.79 |
ENST00000547605.5
ENST00000553186.5 |
RBFOX1
|
RNA binding fox-1 homolog 1 |
| chr7_+_5879827 | 3.77 |
ENST00000416608.5
|
OCM
|
oncomodulin |
| chr6_+_160121809 | 3.66 |
ENST00000366963.9
|
SLC22A1
|
solute carrier family 22 member 1 |
| chr10_+_18260715 | 3.59 |
ENST00000615785.4
ENST00000617363.4 ENST00000396576.6 |
CACNB2
|
calcium voltage-gated channel auxiliary subunit beta 2 |
| chr17_-_35063648 | 3.57 |
ENST00000394597.7
|
RFFL
|
ring finger and FYVE like domain containing E3 ubiquitin protein ligase |
| chr14_-_72894091 | 3.56 |
ENST00000556509.6
|
DPF3
|
double PHD fingers 3 |
| chr2_-_101308681 | 3.55 |
ENST00000295317.4
|
RNF149
|
ring finger protein 149 |
| chr2_+_165239432 | 3.55 |
ENST00000636071.2
ENST00000636985.2 |
SCN2A
|
sodium voltage-gated channel alpha subunit 2 |
| chr14_-_24242600 | 3.50 |
ENST00000646753.1
ENST00000558566.1 ENST00000267415.12 ENST00000559019.1 ENST00000399423.8 ENST00000626689.2 |
TINF2
|
TERF1 interacting nuclear factor 2 |
| chr17_-_46579651 | 3.48 |
ENST00000573185.5
ENST00000570550.5 ENST00000445552.6 ENST00000329240.10 ENST00000622488.6 ENST00000336125.6 |
ARL17A
|
ADP ribosylation factor like GTPase 17A |
| chr7_+_26291850 | 3.45 |
ENST00000338523.9
ENST00000446848.6 |
SNX10
|
sorting nexin 10 |
| chr4_+_127632926 | 3.44 |
ENST00000335251.11
|
INTU
|
inturned planar cell polarity protein |
| chr15_+_78438199 | 3.40 |
ENST00000258886.13
|
IREB2
|
iron responsive element binding protein 2 |
| chr22_+_30396991 | 3.39 |
ENST00000617837.4
ENST00000615189.5 ENST00000405717.7 ENST00000402592.7 |
SEC14L2
|
SEC14 like lipid binding 2 |
| chr8_+_27311471 | 3.38 |
ENST00000397501.5
|
PTK2B
|
protein tyrosine kinase 2 beta |
| chr19_+_54137740 | 3.33 |
ENST00000644245.1
ENST00000646002.1 ENST00000221232.11 ENST00000440571.6 ENST00000617930.2 |
CNOT3
|
CCR4-NOT transcription complex subunit 3 |
| chr3_-_105869035 | 3.26 |
ENST00000447441.6
ENST00000403724.5 ENST00000405772.5 |
CBLB
|
Cbl proto-oncogene B |
| chr12_-_11395556 | 3.24 |
ENST00000565533.1
ENST00000389362.6 ENST00000546254.3 |
PRB2
PRB1
|
proline rich protein BstNI subfamily 2 proline rich protein BstNI subfamily 1 |
| chr14_+_32329256 | 3.21 |
ENST00000280979.9
|
AKAP6
|
A-kinase anchoring protein 6 |
| chr16_+_590056 | 3.18 |
ENST00000248139.8
ENST00000568586.5 ENST00000538492.5 |
RAB40C
|
RAB40C, member RAS oncogene family |
| chr1_-_51331315 | 3.11 |
ENST00000262676.9
|
TTC39A
|
tetratricopeptide repeat domain 39A |
| chr14_+_69398683 | 3.07 |
ENST00000556605.5
ENST00000031146.8 ENST00000336643.10 |
SLC39A9
|
solute carrier family 39 member 9 |
| chr3_-_44477639 | 3.03 |
ENST00000396077.8
|
ZNF445
|
zinc finger protein 445 |
| chr2_+_113059194 | 2.99 |
ENST00000393200.7
|
IL36RN
|
interleukin 36 receptor antagonist |
| chr8_-_85341659 | 2.95 |
ENST00000522389.5
|
CA1
|
carbonic anhydrase 1 |
| chr19_+_49527988 | 2.93 |
ENST00000270645.8
|
RCN3
|
reticulocalbin 3 |
| chr2_+_165239388 | 2.89 |
ENST00000424833.5
ENST00000375437.7 ENST00000631182.3 |
SCN2A
|
sodium voltage-gated channel alpha subunit 2 |
| chr1_-_92486916 | 2.88 |
ENST00000294702.6
|
GFI1
|
growth factor independent 1 transcriptional repressor |
| chr4_+_94974984 | 2.88 |
ENST00000672698.1
|
BMPR1B
|
bone morphogenetic protein receptor type 1B |
| chr8_-_17722217 | 2.87 |
ENST00000381861.7
|
MTUS1
|
microtubule associated scaffold protein 1 |
| chr19_-_14848922 | 2.82 |
ENST00000641129.1
|
OR7A10
|
olfactory receptor family 7 subfamily A member 10 |
| chr15_+_62561361 | 2.81 |
ENST00000561311.5
|
TLN2
|
talin 2 |
| chr8_-_85341705 | 2.78 |
ENST00000517618.5
|
CA1
|
carbonic anhydrase 1 |
| chrX_+_139530730 | 2.76 |
ENST00000218099.7
|
F9
|
coagulation factor IX |
| chr3_-_131026726 | 2.72 |
ENST00000514044.5
ENST00000264992.8 |
ASTE1
|
asteroid homolog 1 |
| chr6_-_110179995 | 2.70 |
ENST00000392586.5
ENST00000419252.1 ENST00000359451.6 ENST00000392588.5 |
WASF1
|
WASP family member 1 |
| chr2_+_113058637 | 2.67 |
ENST00000346807.7
|
IL36RN
|
interleukin 36 receptor antagonist |
| chr18_-_24311495 | 2.65 |
ENST00000357041.8
|
OSBPL1A
|
oxysterol binding protein like 1A |
| chr9_+_128149447 | 2.64 |
ENST00000277480.7
ENST00000372998.1 |
LCN2
|
lipocalin 2 |
| chr11_-_120120880 | 2.60 |
ENST00000526881.1
|
TRIM29
|
tripartite motif containing 29 |
| chr4_-_145180496 | 2.58 |
ENST00000447906.8
|
OTUD4
|
OTU deubiquitinase 4 |
| chr3_-_39280021 | 2.55 |
ENST00000399220.3
|
CX3CR1
|
C-X3-C motif chemokine receptor 1 |
| chr6_+_26204552 | 2.54 |
ENST00000615164.2
|
H4C5
|
H4 clustered histone 5 |
| chr13_-_109786567 | 2.52 |
ENST00000375856.5
|
IRS2
|
insulin receptor substrate 2 |
| chr17_-_64130813 | 2.48 |
ENST00000606895.2
|
ERN1
|
endoplasmic reticulum to nucleus signaling 1 |
| chr17_-_46361718 | 2.45 |
ENST00000575960.5
ENST00000575698.5 ENST00000571246.5 ENST00000434041.6 ENST00000656849.1 ENST00000570618.5 ENST00000450673.4 ENST00000622877.4 |
ARL17B
|
ADP ribosylation factor like GTPase 17B |
| chr12_-_118359105 | 2.43 |
ENST00000541186.5
ENST00000539872.5 |
TAOK3
|
TAO kinase 3 |
| chr1_+_15236509 | 2.34 |
ENST00000683790.1
|
FHAD1
|
forkhead associated phosphopeptide binding domain 1 |
| chr1_+_197268222 | 2.34 |
ENST00000367400.8
ENST00000638467.1 ENST00000367399.6 |
CRB1
|
crumbs cell polarity complex component 1 |
| chr2_-_169031317 | 2.31 |
ENST00000650372.1
|
ABCB11
|
ATP binding cassette subfamily B member 11 |
| chr3_-_161105224 | 2.27 |
ENST00000651254.1
ENST00000651178.1 ENST00000476999.6 ENST00000652596.1 ENST00000651305.1 ENST00000652111.1 ENST00000651292.1 ENST00000651282.1 ENST00000651380.1 ENST00000494173.7 ENST00000484127.5 ENST00000650733.1 ENST00000494818.6 ENST00000492353.5 ENST00000652143.1 ENST00000473142.5 ENST00000651147.1 ENST00000468268.5 ENST00000460353.2 ENST00000651953.1 ENST00000651972.1 ENST00000652730.1 ENST00000651460.1 ENST00000652059.1 ENST00000651509.1 ENST00000651801.1 ENST00000651686.1 ENST00000320474.10 ENST00000392781.7 ENST00000392779.6 ENST00000651791.1 ENST00000651117.1 ENST00000652032.1 |
B3GALNT1
|
beta-1,3-N-acetylgalactosaminyltransferase 1 (globoside blood group) |
| chr9_-_5339874 | 2.27 |
ENST00000223862.2
|
RLN1
|
relaxin 1 |
| chr11_+_94973640 | 2.25 |
ENST00000335080.6
ENST00000536741.1 |
KDM4D
|
lysine demethylase 4D |
| chr14_+_61187544 | 2.20 |
ENST00000555185.5
ENST00000557294.5 ENST00000556778.5 |
PRKCH
|
protein kinase C eta |
| chr5_-_22853320 | 2.19 |
ENST00000504376.6
ENST00000382254.6 |
CDH12
|
cadherin 12 |
| chr1_-_51330527 | 2.16 |
ENST00000439482.6
|
TTC39A
|
tetratricopeptide repeat domain 39A |
| chr12_+_93677556 | 2.15 |
ENST00000542893.2
|
CRADD
|
CASP2 and RIPK1 domain containing adaptor with death domain |
| chr12_-_7936177 | 2.14 |
ENST00000544291.1
ENST00000075120.12 |
SLC2A3
|
solute carrier family 2 member 3 |
| chr12_+_6310669 | 2.14 |
ENST00000684764.1
|
PLEKHG6
|
pleckstrin homology and RhoGEF domain containing G6 |
| chr6_+_26045374 | 2.10 |
ENST00000612966.3
|
H3C3
|
H3 clustered histone 3 |
| chr3_-_151329539 | 2.07 |
ENST00000325602.6
|
P2RY13
|
purinergic receptor P2Y13 |
| chr11_-_60183011 | 2.07 |
ENST00000533023.5
ENST00000420732.6 ENST00000528851.6 |
MS4A6A
|
membrane spanning 4-domains A6A |
| chrX_-_6535118 | 2.06 |
ENST00000381089.7
ENST00000612369.4 ENST00000398729.1 |
VCX3A
|
variable charge X-linked 3A |
| chr8_-_42768602 | 2.04 |
ENST00000534622.5
|
CHRNA6
|
cholinergic receptor nicotinic alpha 6 subunit |
| chr14_+_32329341 | 2.03 |
ENST00000557354.5
ENST00000557102.1 ENST00000557272.1 |
AKAP6
|
A-kinase anchoring protein 6 |
| chr14_+_94174334 | 2.01 |
ENST00000328839.3
|
PPP4R4
|
protein phosphatase 4 regulatory subunit 4 |
| chr4_-_99290975 | 2.01 |
ENST00000209668.3
|
ADH1A
|
alcohol dehydrogenase 1A (class I), alpha polypeptide |
| chr12_-_122716790 | 2.00 |
ENST00000528880.3
|
HCAR3
|
hydroxycarboxylic acid receptor 3 |
| chr6_-_169250825 | 1.98 |
ENST00000676869.1
ENST00000676760.1 |
THBS2
|
thrombospondin 2 |
| chr12_+_20695553 | 1.98 |
ENST00000545102.1
|
SLCO1C1
|
solute carrier organic anion transporter family member 1C1 |
| chr5_+_129748091 | 1.95 |
ENST00000564719.2
|
MINAR2
|
membrane integral NOTCH2 associated receptor 2 |
| chrX_+_15749848 | 1.93 |
ENST00000479740.5
ENST00000454127.2 |
CA5B
|
carbonic anhydrase 5B |
| chr18_-_46964408 | 1.92 |
ENST00000676383.1
|
ENSG00000288616.1
|
elongin A3 family member D |
| chr2_+_199955770 | 1.90 |
ENST00000435773.2
|
MAIP1
|
matrix AAA peptidase interacting protein 1 |
| chr12_+_18261511 | 1.88 |
ENST00000538779.6
ENST00000433979.6 |
PIK3C2G
|
phosphatidylinositol-4-phosphate 3-kinase catalytic subunit type 2 gamma |
| chr5_-_34043205 | 1.86 |
ENST00000382065.8
ENST00000231338.7 |
C1QTNF3
|
C1q and TNF related 3 |
| chr2_+_90038848 | 1.85 |
ENST00000390270.2
|
IGKV3D-20
|
immunoglobulin kappa variable 3D-20 |
| chr11_-_84317296 | 1.81 |
ENST00000280241.12
ENST00000398301.6 |
DLG2
|
discs large MAGUK scaffold protein 2 |
| chr2_+_88885397 | 1.80 |
ENST00000390243.2
|
IGKV4-1
|
immunoglobulin kappa variable 4-1 |
| chr11_-_60183191 | 1.79 |
ENST00000412309.6
|
MS4A6A
|
membrane spanning 4-domains A6A |
| chr11_+_24497155 | 1.75 |
ENST00000529015.5
ENST00000533227.5 |
LUZP2
|
leucine zipper protein 2 |
| chr4_+_37453914 | 1.74 |
ENST00000381980.9
ENST00000508175.5 |
C4orf19
|
chromosome 4 open reading frame 19 |
| chr2_-_119525301 | 1.72 |
ENST00000627145.1
|
SCTR
|
secretin receptor |
| chr1_-_248277976 | 1.69 |
ENST00000641220.1
|
OR2T33
|
olfactory receptor family 2 subfamily T member 33 |
| chr2_-_119524483 | 1.66 |
ENST00000019103.8
|
SCTR
|
secretin receptor |
| chr3_-_161105399 | 1.66 |
ENST00000652593.1
|
B3GALNT1
|
beta-1,3-N-acetylgalactosaminyltransferase 1 (globoside blood group) |
| chr14_+_94174284 | 1.65 |
ENST00000304338.8
|
PPP4R4
|
protein phosphatase 4 regulatory subunit 4 |
| chr1_-_1778399 | 1.63 |
ENST00000341426.9
|
NADK
|
NAD kinase |
| chr1_+_197268204 | 1.61 |
ENST00000535699.5
ENST00000538660.5 |
CRB1
|
crumbs cell polarity complex component 1 |
| chr3_+_122183664 | 1.60 |
ENST00000639785.2
|
CASR
|
calcium sensing receptor |
| chr12_-_122703346 | 1.60 |
ENST00000328880.6
|
HCAR2
|
hydroxycarboxylic acid receptor 2 |
| chr2_+_233671879 | 1.59 |
ENST00000354728.5
|
UGT1A9
|
UDP glucuronosyltransferase family 1 member A9 |
| chr2_-_165203870 | 1.58 |
ENST00000639244.1
ENST00000409101.7 ENST00000668657.1 |
SCN3A
|
sodium voltage-gated channel alpha subunit 3 |
| chr3_-_161105070 | 1.57 |
ENST00000651430.1
ENST00000650695.1 ENST00000651689.1 ENST00000651916.1 ENST00000488170.5 ENST00000652377.1 ENST00000652669.1 |
B3GALNT1
|
beta-1,3-N-acetylgalactosaminyltransferase 1 (globoside blood group) |
| chr21_-_36542600 | 1.56 |
ENST00000399136.5
|
CLDN14
|
claudin 14 |
| chr7_-_100167284 | 1.47 |
ENST00000413800.5
|
GAL3ST4
|
galactose-3-O-sulfotransferase 4 |
| chr11_-_118264282 | 1.45 |
ENST00000278937.7
|
MPZL2
|
myelin protein zero like 2 |
| chr1_-_1778790 | 1.44 |
ENST00000341991.7
|
NADK
|
NAD kinase |
| chr21_-_14546297 | 1.44 |
ENST00000400566.6
ENST00000400564.5 |
SAMSN1
|
SAM domain, SH3 domain and nuclear localization signals 1 |
| chr11_+_2301987 | 1.44 |
ENST00000612299.4
ENST00000182290.9 |
TSPAN32
|
tetraspanin 32 |
| chr1_+_174700413 | 1.41 |
ENST00000529145.6
ENST00000325589.9 |
RABGAP1L
|
RAB GTPase activating protein 1 like |
| chr12_-_23584600 | 1.41 |
ENST00000396007.6
|
SOX5
|
SRY-box transcription factor 5 |
| chr12_-_52652207 | 1.40 |
ENST00000309680.4
|
KRT2
|
keratin 2 |
| chrX_+_37349287 | 1.40 |
ENST00000466533.5
ENST00000542554.5 ENST00000543642.5 ENST00000484460.5 ENST00000378628.9 ENST00000449135.6 ENST00000463135.1 ENST00000465127.1 |
PRRG1
ENSG00000250349.3
|
proline rich and Gla domain 1 novel proline rich Gla (G-carboxyglutamic acid) 1 (PRRG1) and tetraspanin 7 (TSPAN7) protein |
| chr7_+_143954844 | 1.37 |
ENST00000641412.1
|
OR2F1
|
olfactory receptor family 2 subfamily F member 1 |
| chr11_+_17260353 | 1.37 |
ENST00000530527.5
|
NUCB2
|
nucleobindin 2 |
| chr1_+_160190567 | 1.34 |
ENST00000368078.8
|
CASQ1
|
calsequestrin 1 |
| chr5_-_32444722 | 1.33 |
ENST00000265069.13
|
ZFR
|
zinc finger RNA binding protein |
| chr2_+_29113989 | 1.33 |
ENST00000404424.5
|
CLIP4
|
CAP-Gly domain containing linker protein family member 4 |
| chr1_+_15617415 | 1.31 |
ENST00000480945.6
|
DDI2
|
DNA damage inducible 1 homolog 2 |
| chr2_+_64988469 | 1.30 |
ENST00000531327.5
|
SLC1A4
|
solute carrier family 1 member 4 |
| chr6_+_110180418 | 1.27 |
ENST00000368930.5
ENST00000307731.2 |
CDC40
|
cell division cycle 40 |
| chr6_-_110815408 | 1.25 |
ENST00000368911.8
|
CDK19
|
cyclin dependent kinase 19 |
| chr1_-_51330553 | 1.24 |
ENST00000680483.1
ENST00000371747.7 |
TTC39A
|
tetratricopeptide repeat domain 39A |
| chr15_-_78234513 | 1.24 |
ENST00000558130.1
ENST00000258873.9 |
ACSBG1
|
acyl-CoA synthetase bubblegum family member 1 |
| chr20_-_45972171 | 1.24 |
ENST00000322927.3
|
ZNF335
|
zinc finger protein 335 |
| chr7_-_135211313 | 1.22 |
ENST00000682802.1
ENST00000683848.1 ENST00000354475.5 |
WDR91
|
WD repeat domain 91 |
| chr2_-_88861258 | 1.21 |
ENST00000390240.2
|
IGKJ3
|
immunoglobulin kappa joining 3 |
| chr8_+_49911396 | 1.19 |
ENST00000642720.2
|
SNTG1
|
syntrophin gamma 1 |
| chr12_+_119668109 | 1.18 |
ENST00000229328.10
ENST00000630317.1 |
PRKAB1
|
protein kinase AMP-activated non-catalytic subunit beta 1 |
| chr14_+_100019375 | 1.17 |
ENST00000544450.6
|
EVL
|
Enah/Vasp-like |
| chr16_-_29505820 | 1.16 |
ENST00000550665.5
|
NPIPB12
|
nuclear pore complex interacting protein family member B12 |
| chr17_-_42185452 | 1.16 |
ENST00000293330.1
|
HCRT
|
hypocretin neuropeptide precursor |
| chr6_+_150368892 | 1.15 |
ENST00000229447.9
ENST00000392256.6 |
IYD
|
iodotyrosine deiodinase |
| chrX_+_136648214 | 1.13 |
ENST00000370628.2
|
CD40LG
|
CD40 ligand |
| chr6_+_29461440 | 1.13 |
ENST00000396792.2
|
OR2H1
|
olfactory receptor family 2 subfamily H member 1 |
| chr1_-_13285154 | 1.12 |
ENST00000357367.6
ENST00000614831.1 |
PRAMEF8
|
PRAME family member 8 |
| chr12_-_91058016 | 1.02 |
ENST00000266719.4
|
KERA
|
keratocan |
| chr1_-_66801276 | 1.00 |
ENST00000304526.3
|
INSL5
|
insulin like 5 |
| chr16_+_48244264 | 0.99 |
ENST00000285737.9
|
LONP2
|
lon peptidase 2, peroxisomal |
| chr1_+_192636121 | 0.98 |
ENST00000543215.5
ENST00000391995.7 |
RGS13
|
regulator of G protein signaling 13 |
| chr14_+_20781139 | 0.98 |
ENST00000304677.3
|
RNASE6
|
ribonuclease A family member k6 |
| chr11_+_15073562 | 0.96 |
ENST00000533448.1
ENST00000324229.11 |
CALCB
|
calcitonin related polypeptide beta |
| chr2_+_48314637 | 0.95 |
ENST00000413569.5
ENST00000340553.8 |
FOXN2
|
forkhead box N2 |
| chr2_+_137964446 | 0.93 |
ENST00000280096.5
ENST00000280097.5 |
HNMT
|
histamine N-methyltransferase |
| chr3_-_165078480 | 0.92 |
ENST00000264382.8
|
SI
|
sucrase-isomaltase |
| chr11_+_65787056 | 0.92 |
ENST00000335987.8
|
OVOL1
|
ovo like transcriptional repressor 1 |
| chr3_+_122055355 | 0.91 |
ENST00000330540.7
ENST00000469710.5 ENST00000493101.5 |
CD86
|
CD86 molecule |
| chr5_+_149357999 | 0.91 |
ENST00000274569.9
|
PCYOX1L
|
prenylcysteine oxidase 1 like |
| chr16_-_28363508 | 0.90 |
ENST00000532254.1
|
NPIPB6
|
nuclear pore complex interacting protein family member B6 |
| chr22_+_22811737 | 0.90 |
ENST00000390315.3
|
IGLV3-10
|
immunoglobulin lambda variable 3-10 |
| chr12_-_118359639 | 0.90 |
ENST00000541786.5
ENST00000419821.6 ENST00000541878.5 |
TAOK3
|
TAO kinase 3 |
| chr19_-_5286163 | 0.90 |
ENST00000592099.5
ENST00000588012.5 ENST00000262963.10 ENST00000587303.5 ENST00000590509.5 |
PTPRS
|
protein tyrosine phosphatase receptor type S |
| chr2_+_233636445 | 0.84 |
ENST00000344644.9
|
UGT1A10
|
UDP glucuronosyltransferase family 1 member A10 |
| chr3_-_151316795 | 0.81 |
ENST00000260843.5
|
GPR87
|
G protein-coupled receptor 87 |
| chr16_-_29404029 | 0.81 |
ENST00000524087.5
|
NPIPB11
|
nuclear pore complex interacting protein family member B11 |
| chr16_+_50696999 | 0.79 |
ENST00000300589.6
|
NOD2
|
nucleotide binding oligomerization domain containing 2 |
| chr3_+_43690928 | 0.79 |
ENST00000644371.2
|
ABHD5
|
abhydrolase domain containing 5, lysophosphatidic acid acyltransferase |
| chr22_+_22720615 | 0.78 |
ENST00000390309.2
|
IGLV3-19
|
immunoglobulin lambda variable 3-19 |
| chr21_-_26051023 | 0.78 |
ENST00000415997.1
|
APP
|
amyloid beta precursor protein |
| chr8_+_49911604 | 0.78 |
ENST00000642164.1
ENST00000644093.1 ENST00000643999.1 ENST00000647073.1 ENST00000646880.1 |
SNTG1
|
syntrophin gamma 1 |
| chr2_+_233636502 | 0.77 |
ENST00000373445.1
|
UGT1A10
|
UDP glucuronosyltransferase family 1 member A10 |
| chr17_+_46295099 | 0.75 |
ENST00000393465.7
ENST00000320254.5 |
LRRC37A
|
leucine rich repeat containing 37A |
| chr2_+_137964279 | 0.75 |
ENST00000329366.8
|
HNMT
|
histamine N-methyltransferase |
| chr16_+_28638065 | 0.73 |
ENST00000683297.1
|
NPIPB8
|
nuclear pore complex interacting protein family member B8 |
| chr11_-_63608542 | 0.73 |
ENST00000540943.1
|
PLAAT3
|
phospholipase A and acyltransferase 3 |
| chr10_-_114144599 | 0.72 |
ENST00000428953.1
|
CCDC186
|
coiled-coil domain containing 186 |
| chr3_-_105868964 | 0.72 |
ENST00000394030.8
|
CBLB
|
Cbl proto-oncogene B |
| chr16_+_11965234 | 0.72 |
ENST00000562385.1
|
TNFRSF17
|
TNF receptor superfamily member 17 |
| chr6_-_25042003 | 0.71 |
ENST00000510784.8
|
RIPOR2
|
RHO family interacting cell polarization regulator 2 |
| chr16_+_31873772 | 0.70 |
ENST00000394846.7
ENST00000300870.15 |
ZNF267
|
zinc finger protein 267 |
| chr17_-_10469558 | 0.66 |
ENST00000255381.2
|
MYH4
|
myosin heavy chain 4 |
Gene Ontology Analysis
Gene overrepresentation in biological process category:
| Log-likelihood per target | Total log-likelihood | Term | Description |
|---|---|---|---|
| 2.3 | 7.0 | GO:0007199 | G-protein coupled receptor signaling pathway coupled to cGMP nucleotide second messenger(GO:0007199) response to muscle activity involved in regulation of muscle adaptation(GO:0014873) |
| 2.3 | 6.9 | GO:0060903 | positive regulation of meiosis I(GO:0060903) |
| 2.1 | 20.9 | GO:0036371 | protein localization to M-band(GO:0036309) protein localization to T-tubule(GO:0036371) |
| 2.0 | 5.9 | GO:1902769 | regulation of choline O-acetyltransferase activity(GO:1902769) positive regulation of choline O-acetyltransferase activity(GO:1902771) negative regulation of tau-protein kinase activity(GO:1902948) positive regulation of early endosome to recycling endosome transport(GO:1902955) negative regulation of aspartic-type endopeptidase activity involved in amyloid precursor protein catabolic process(GO:1902960) negative regulation of neurofibrillary tangle assembly(GO:1902997) negative regulation of aspartic-type peptidase activity(GO:1905246) |
| 1.6 | 15.7 | GO:0006537 | glutamate biosynthetic process(GO:0006537) gamma-aminobutyric acid biosynthetic process(GO:0009449) |
| 1.5 | 4.4 | GO:1990168 | protein K33-linked deubiquitination(GO:1990168) |
| 1.3 | 5.1 | GO:0034628 | nicotinamide nucleotide biosynthetic process from aspartate(GO:0019355) 'de novo' NAD biosynthetic process(GO:0034627) 'de novo' NAD biosynthetic process from aspartate(GO:0034628) |
| 1.1 | 3.4 | GO:2000538 | regulation of cGMP-mediated signaling(GO:0010752) regulation of B cell chemotaxis(GO:2000537) positive regulation of B cell chemotaxis(GO:2000538) |
| 1.1 | 7.8 | GO:0048241 | epinephrine transport(GO:0048241) |
| 1.0 | 2.9 | GO:0070105 | positive regulation of interleukin-6-mediated signaling pathway(GO:0070105) |
| 0.9 | 3.5 | GO:0010836 | negative regulation of protein ADP-ribosylation(GO:0010836) |
| 0.9 | 5.2 | GO:1902261 | positive regulation of delayed rectifier potassium channel activity(GO:1902261) |
| 0.8 | 4.1 | GO:0007386 | compartment pattern specification(GO:0007386) |
| 0.8 | 5.4 | GO:0060770 | negative regulation of epithelial cell proliferation involved in prostate gland development(GO:0060770) |
| 0.7 | 4.4 | GO:0033133 | positive regulation of glucokinase activity(GO:0033133) |
| 0.7 | 8.7 | GO:0051612 | negative regulation of neurotransmitter uptake(GO:0051581) regulation of serotonin uptake(GO:0051611) negative regulation of serotonin uptake(GO:0051612) |
| 0.7 | 2.1 | GO:0070837 | dehydroascorbic acid transport(GO:0070837) |
| 0.7 | 3.6 | GO:2001271 | negative regulation of cysteine-type endopeptidase activity involved in execution phase of apoptosis(GO:2001271) |
| 0.7 | 5.7 | GO:0019732 | antifungal humoral response(GO:0019732) |
| 0.6 | 2.5 | GO:0002881 | negative regulation of chronic inflammatory response to non-antigenic stimulus(GO:0002881) |
| 0.6 | 3.1 | GO:0006741 | NADP biosynthetic process(GO:0006741) |
| 0.6 | 2.3 | GO:0015722 | canalicular bile acid transport(GO:0015722) |
| 0.6 | 2.3 | GO:2001034 | positive regulation of double-strand break repair via nonhomologous end joining(GO:2001034) |
| 0.5 | 6.4 | GO:0008627 | intrinsic apoptotic signaling pathway in response to osmotic stress(GO:0008627) |
| 0.5 | 2.6 | GO:0015688 | response to mycotoxin(GO:0010046) iron chelate transport(GO:0015688) siderophore transport(GO:0015891) |
| 0.5 | 3.6 | GO:1902514 | regulation of calcium ion transmembrane transport via high voltage-gated calcium channel(GO:1902514) positive regulation of calcium ion transmembrane transport via high voltage-gated calcium channel(GO:1904879) |
| 0.5 | 2.5 | GO:0010746 | regulation of plasma membrane long-chain fatty acid transport(GO:0010746) negative regulation of plasma membrane long-chain fatty acid transport(GO:0010748) |
| 0.5 | 3.2 | GO:0051552 | flavone metabolic process(GO:0051552) |
| 0.4 | 0.9 | GO:0032687 | negative regulation of interferon-alpha production(GO:0032687) |
| 0.4 | 2.2 | GO:0050861 | positive regulation of B cell receptor signaling pathway(GO:0050861) |
| 0.4 | 2.9 | GO:0048165 | ovarian cumulus expansion(GO:0001550) fused antrum stage(GO:0048165) negative regulation of chondrocyte proliferation(GO:1902731) |
| 0.4 | 2.7 | GO:0051388 | positive regulation of neurotrophin TRK receptor signaling pathway(GO:0051388) |
| 0.4 | 1.4 | GO:0030886 | negative regulation of myeloid dendritic cell activation(GO:0030886) |
| 0.4 | 2.5 | GO:0006987 | activation of signaling protein activity involved in unfolded protein response(GO:0006987) |
| 0.3 | 3.5 | GO:0070162 | adiponectin secretion(GO:0070162) regulation of adiponectin secretion(GO:0070163) |
| 0.3 | 4.4 | GO:1990440 | positive regulation of transcription from RNA polymerase II promoter in response to endoplasmic reticulum stress(GO:1990440) |
| 0.3 | 4.3 | GO:0015985 | energy coupled proton transport, down electrochemical gradient(GO:0015985) ATP synthesis coupled proton transport(GO:0015986) |
| 0.3 | 2.8 | GO:0007598 | blood coagulation, extrinsic pathway(GO:0007598) |
| 0.3 | 0.9 | GO:1901994 | meiotic cell cycle phase transition(GO:0044771) regulation of meiotic cell cycle phase transition(GO:1901993) negative regulation of meiotic cell cycle phase transition(GO:1901994) |
| 0.3 | 0.9 | GO:0002665 | negative regulation of T cell tolerance induction(GO:0002665) negative regulation of T cell anergy(GO:0002668) negative regulation of lymphocyte anergy(GO:0002912) regulation of lymphotoxin A production(GO:0032681) positive regulation of lymphotoxin A production(GO:0032761) regulation of lymphotoxin A biosynthetic process(GO:0043016) positive regulation of lymphotoxin A biosynthetic process(GO:0043017) |
| 0.3 | 0.9 | GO:0030327 | prenylated protein catabolic process(GO:0030327) |
| 0.3 | 4.0 | GO:0007175 | negative regulation of epidermal growth factor-activated receptor activity(GO:0007175) |
| 0.3 | 1.7 | GO:0052805 | histamine metabolic process(GO:0001692) histidine catabolic process(GO:0006548) imidazole-containing compound catabolic process(GO:0052805) |
| 0.3 | 1.9 | GO:0015811 | L-cystine transport(GO:0015811) |
| 0.2 | 5.5 | GO:0009312 | oligosaccharide biosynthetic process(GO:0009312) |
| 0.2 | 1.9 | GO:0036444 | calcium ion transmembrane import into mitochondrion(GO:0036444) |
| 0.2 | 1.4 | GO:0055059 | asymmetric neuroblast division(GO:0055059) |
| 0.2 | 6.4 | GO:0035640 | exploration behavior(GO:0035640) |
| 0.2 | 0.8 | GO:0035419 | detection of peptidoglycan(GO:0032499) activation of MAPK activity involved in innate immune response(GO:0035419) regulation of prostaglandin-endoperoxide synthase activity(GO:0060584) positive regulation of prostaglandin-endoperoxide synthase activity(GO:0060585) |
| 0.2 | 0.8 | GO:0051563 | smooth endoplasmic reticulum calcium ion homeostasis(GO:0051563) |
| 0.2 | 2.1 | GO:0006069 | ethanol oxidation(GO:0006069) |
| 0.2 | 4.7 | GO:0034453 | microtubule anchoring(GO:0034453) |
| 0.2 | 3.9 | GO:0045880 | positive regulation of smoothened signaling pathway(GO:0045880) |
| 0.2 | 1.2 | GO:0051970 | negative regulation of transmission of nerve impulse(GO:0051970) |
| 0.2 | 2.0 | GO:0070327 | thyroid hormone transport(GO:0070327) |
| 0.2 | 12.4 | GO:0007032 | endosome organization(GO:0007032) |
| 0.2 | 0.6 | GO:0019805 | quinolinate biosynthetic process(GO:0019805) |
| 0.2 | 3.3 | GO:0001829 | trophectodermal cell differentiation(GO:0001829) |
| 0.2 | 2.8 | GO:0007016 | cytoskeletal anchoring at plasma membrane(GO:0007016) |
| 0.2 | 1.2 | GO:0080182 | histone H3-K4 trimethylation(GO:0080182) |
| 0.2 | 6.8 | GO:0051491 | positive regulation of filopodium assembly(GO:0051491) |
| 0.2 | 2.9 | GO:0035589 | G-protein coupled purinergic nucleotide receptor signaling pathway(GO:0035589) |
| 0.1 | 1.3 | GO:0014877 | response to muscle inactivity involved in regulation of muscle adaptation(GO:0014877) response to denervation involved in regulation of muscle adaptation(GO:0014894) |
| 0.1 | 7.7 | GO:0006730 | one-carbon metabolic process(GO:0006730) |
| 0.1 | 0.9 | GO:0044245 | polysaccharide digestion(GO:0044245) |
| 0.1 | 3.7 | GO:0032515 | negative regulation of phosphoprotein phosphatase activity(GO:0032515) |
| 0.1 | 9.4 | GO:0046677 | response to antibiotic(GO:0046677) |
| 0.1 | 12.7 | GO:0050911 | detection of chemical stimulus involved in sensory perception of smell(GO:0050911) |
| 0.1 | 1.0 | GO:2000253 | positive regulation of feeding behavior(GO:2000253) |
| 0.1 | 3.1 | GO:0006829 | zinc II ion transport(GO:0006829) |
| 0.1 | 6.0 | GO:0031572 | G2 DNA damage checkpoint(GO:0031572) |
| 0.1 | 0.6 | GO:0045872 | positive regulation of rhodopsin gene expression(GO:0045872) |
| 0.1 | 3.9 | GO:0042462 | eye photoreceptor cell development(GO:0042462) |
| 0.1 | 8.0 | GO:0000381 | regulation of alternative mRNA splicing, via spliceosome(GO:0000381) |
| 0.1 | 1.8 | GO:2000353 | positive regulation of endothelial cell apoptotic process(GO:2000353) |
| 0.1 | 0.5 | GO:0010513 | positive regulation of phosphatidylinositol biosynthetic process(GO:0010513) |
| 0.1 | 1.1 | GO:0006570 | tyrosine metabolic process(GO:0006570) |
| 0.1 | 1.4 | GO:0042340 | keratan sulfate catabolic process(GO:0042340) |
| 0.1 | 1.6 | GO:0005513 | detection of calcium ion(GO:0005513) |
| 0.1 | 1.0 | GO:0031998 | regulation of fatty acid beta-oxidation(GO:0031998) |
| 0.1 | 1.0 | GO:1900028 | negative regulation of ruffle assembly(GO:1900028) |
| 0.1 | 0.5 | GO:0006689 | ganglioside catabolic process(GO:0006689) |
| 0.1 | 1.2 | GO:0035878 | nail development(GO:0035878) |
| 0.1 | 2.6 | GO:0071108 | protein K48-linked deubiquitination(GO:0071108) |
| 0.1 | 0.5 | GO:0032534 | regulation of microvillus assembly(GO:0032534) |
| 0.1 | 2.0 | GO:0014059 | dopamine secretion(GO:0014046) regulation of dopamine secretion(GO:0014059) |
| 0.1 | 6.3 | GO:0006879 | cellular iron ion homeostasis(GO:0006879) |
| 0.1 | 2.6 | GO:0006699 | bile acid biosynthetic process(GO:0006699) |
| 0.1 | 1.9 | GO:0039703 | viral RNA genome replication(GO:0039694) RNA replication(GO:0039703) |
| 0.1 | 1.0 | GO:0051546 | keratinocyte migration(GO:0051546) |
| 0.1 | 0.5 | GO:0071963 | establishment or maintenance of cell polarity regulating cell shape(GO:0071963) |
| 0.1 | 0.4 | GO:0030579 | ubiquitin-dependent SMAD protein catabolic process(GO:0030579) |
| 0.1 | 8.9 | GO:0007156 | homophilic cell adhesion via plasma membrane adhesion molecules(GO:0007156) |
| 0.0 | 4.2 | GO:0006749 | glutathione metabolic process(GO:0006749) |
| 0.0 | 1.8 | GO:0097120 | receptor localization to synapse(GO:0097120) |
| 0.0 | 1.6 | GO:0016338 | calcium-independent cell-cell adhesion via plasma membrane cell-adhesion molecules(GO:0016338) |
| 0.0 | 5.5 | GO:1903779 | regulation of cardiac conduction(GO:1903779) |
| 0.0 | 3.4 | GO:0045540 | regulation of cholesterol biosynthetic process(GO:0045540) |
| 0.0 | 1.6 | GO:0019228 | neuronal action potential(GO:0019228) |
| 0.0 | 2.3 | GO:0048024 | regulation of mRNA splicing, via spliceosome(GO:0048024) |
| 0.0 | 1.4 | GO:0050869 | negative regulation of B cell activation(GO:0050869) |
| 0.0 | 0.6 | GO:0042420 | dopamine catabolic process(GO:0042420) |
| 0.0 | 1.2 | GO:0000038 | very long-chain fatty acid metabolic process(GO:0000038) long-chain fatty-acyl-CoA biosynthetic process(GO:0035338) |
| 0.0 | 0.3 | GO:0048227 | plasma membrane to endosome transport(GO:0048227) |
| 0.0 | 0.4 | GO:0033623 | regulation of integrin activation(GO:0033623) |
| 0.0 | 0.4 | GO:0060252 | positive regulation of glial cell proliferation(GO:0060252) |
| 0.0 | 0.2 | GO:0052697 | flavonoid glucuronidation(GO:0052696) xenobiotic glucuronidation(GO:0052697) |
| 0.0 | 0.3 | GO:0010898 | positive regulation of triglyceride catabolic process(GO:0010898) |
| 0.0 | 1.7 | GO:0006904 | vesicle docking involved in exocytosis(GO:0006904) |
| 0.0 | 2.1 | GO:0071260 | cellular response to mechanical stimulus(GO:0071260) |
| 0.0 | 4.3 | GO:0002377 | immunoglobulin production(GO:0002377) |
| 0.0 | 1.0 | GO:0045744 | negative regulation of G-protein coupled receptor protein signaling pathway(GO:0045744) |
| 0.0 | 2.0 | GO:0051965 | positive regulation of synapse assembly(GO:0051965) |
| 0.0 | 1.0 | GO:0019731 | antibacterial humoral response(GO:0019731) |
| 0.0 | 0.2 | GO:0006657 | CDP-choline pathway(GO:0006657) |
| 0.0 | 1.3 | GO:0009311 | oligosaccharide metabolic process(GO:0009311) |
| 0.0 | 3.5 | GO:0043409 | negative regulation of MAPK cascade(GO:0043409) |
| 0.0 | 1.6 | GO:0050729 | positive regulation of inflammatory response(GO:0050729) |
| 0.0 | 0.8 | GO:0002260 | lymphocyte homeostasis(GO:0002260) |
| 0.0 | 1.1 | GO:0006369 | termination of RNA polymerase II transcription(GO:0006369) |
| 0.0 | 1.2 | GO:0090630 | activation of GTPase activity(GO:0090630) |
| 0.0 | 2.4 | GO:0007565 | female pregnancy(GO:0007565) |
| 0.0 | 0.8 | GO:0035914 | skeletal muscle cell differentiation(GO:0035914) |
Gene overrepresentation in cellular component category:
| Log-likelihood per target | Total log-likelihood | Term | Description |
|---|---|---|---|
| 1.7 | 6.9 | GO:0071546 | pi-body(GO:0071546) |
| 0.8 | 2.5 | GO:1990597 | AIP1-IRE1 complex(GO:1990597) |
| 0.8 | 4.8 | GO:0032584 | growth cone membrane(GO:0032584) |
| 0.7 | 5.2 | GO:0014701 | junctional sarcoplasmic reticulum membrane(GO:0014701) |
| 0.5 | 5.4 | GO:0043203 | axon hillock(GO:0043203) |
| 0.5 | 3.4 | GO:0031313 | extrinsic component of endosome membrane(GO:0031313) |
| 0.4 | 3.5 | GO:0070187 | telosome(GO:0070187) |
| 0.4 | 4.3 | GO:0000220 | vacuolar proton-transporting V-type ATPase, V0 domain(GO:0000220) |
| 0.4 | 6.4 | GO:0033270 | paranode region of axon(GO:0033270) |
| 0.4 | 20.9 | GO:0031430 | M band(GO:0031430) |
| 0.4 | 6.7 | GO:0005641 | nuclear envelope lumen(GO:0005641) |
| 0.3 | 3.3 | GO:0030015 | CCR4-NOT core complex(GO:0030015) |
| 0.3 | 1.3 | GO:0014802 | terminal cisterna(GO:0014802) |
| 0.3 | 6.1 | GO:0044295 | axonal growth cone(GO:0044295) |
| 0.2 | 3.4 | GO:0017146 | NMDA selective glutamate receptor complex(GO:0017146) |
| 0.2 | 9.3 | GO:0000159 | protein phosphatase type 2A complex(GO:0000159) |
| 0.2 | 2.3 | GO:0046581 | intercellular canaliculus(GO:0046581) |
| 0.2 | 2.7 | GO:0031209 | SCAR complex(GO:0031209) |
| 0.2 | 2.5 | GO:1990712 | HFE-transferrin receptor complex(GO:1990712) |
| 0.2 | 3.6 | GO:1990454 | L-type voltage-gated calcium channel complex(GO:1990454) |
| 0.2 | 2.0 | GO:0016013 | syntrophin complex(GO:0016013) |
| 0.1 | 0.5 | GO:0005889 | hydrogen:potassium-exchanging ATPase complex(GO:0005889) |
| 0.1 | 4.1 | GO:0030173 | integral component of Golgi membrane(GO:0030173) |
| 0.1 | 3.6 | GO:0071565 | nBAF complex(GO:0071565) |
| 0.1 | 3.7 | GO:0008287 | protein serine/threonine phosphatase complex(GO:0008287) phosphatase complex(GO:1903293) |
| 0.1 | 2.5 | GO:0044298 | neuronal cell body membrane(GO:0032809) cell body membrane(GO:0044298) |
| 0.1 | 1.6 | GO:0001518 | voltage-gated sodium channel complex(GO:0001518) |
| 0.1 | 2.0 | GO:0005892 | acetylcholine-gated channel complex(GO:0005892) |
| 0.1 | 1.9 | GO:0005942 | phosphatidylinositol 3-kinase complex(GO:0005942) |
| 0.1 | 0.7 | GO:0060171 | stereocilium membrane(GO:0060171) |
| 0.1 | 5.7 | GO:0005902 | microvillus(GO:0005902) |
| 0.1 | 0.5 | GO:0070852 | cell body fiber(GO:0070852) |
| 0.1 | 2.3 | GO:0035861 | site of double-strand break(GO:0035861) |
| 0.1 | 0.6 | GO:0000813 | ESCRT I complex(GO:0000813) |
| 0.1 | 1.2 | GO:0031588 | nucleotide-activated protein kinase complex(GO:0031588) |
| 0.1 | 0.9 | GO:0098563 | integral component of synaptic vesicle membrane(GO:0030285) intrinsic component of synaptic vesicle membrane(GO:0098563) |
| 0.1 | 1.8 | GO:0044224 | juxtaparanode region of axon(GO:0044224) |
| 0.1 | 4.2 | GO:0055038 | recycling endosome membrane(GO:0055038) |
| 0.0 | 3.4 | GO:0005881 | cytoplasmic microtubule(GO:0005881) |
| 0.0 | 10.2 | GO:0005802 | trans-Golgi network(GO:0005802) |
| 0.0 | 1.6 | GO:0016592 | mediator complex(GO:0016592) |
| 0.0 | 3.4 | GO:0036064 | ciliary basal body(GO:0036064) |
| 0.0 | 1.4 | GO:0045095 | keratin filament(GO:0045095) |
| 0.0 | 0.7 | GO:0032982 | myosin filament(GO:0032982) |
| 0.0 | 4.1 | GO:0005796 | Golgi lumen(GO:0005796) |
| 0.0 | 1.4 | GO:0008305 | integrin complex(GO:0008305) |
| 0.0 | 8.6 | GO:0016323 | basolateral plasma membrane(GO:0016323) |
| 0.0 | 2.9 | GO:0017053 | transcriptional repressor complex(GO:0017053) |
| 0.0 | 2.1 | GO:0070821 | tertiary granule membrane(GO:0070821) |
| 0.0 | 1.9 | GO:0005581 | collagen trimer(GO:0005581) |
| 0.0 | 2.0 | GO:0005913 | cell-cell adherens junction(GO:0005913) |
| 0.0 | 11.7 | GO:0043025 | neuronal cell body(GO:0043025) |
| 0.0 | 6.3 | GO:0005911 | cell-cell junction(GO:0005911) |
| 0.0 | 3.8 | GO:0045211 | postsynaptic membrane(GO:0045211) |
| 0.0 | 1.2 | GO:0005791 | rough endoplasmic reticulum(GO:0005791) |
| 0.0 | 0.1 | GO:0008282 | ATP-sensitive potassium channel complex(GO:0008282) |
| 0.0 | 0.9 | GO:0031093 | platelet alpha granule lumen(GO:0031093) |
| 0.0 | 1.3 | GO:0032580 | Golgi cisterna membrane(GO:0032580) |
| 0.0 | 3.5 | GO:0072562 | blood microparticle(GO:0072562) |
| 0.0 | 4.4 | GO:0005578 | proteinaceous extracellular matrix(GO:0005578) |
| 0.0 | 0.7 | GO:0005782 | peroxisomal matrix(GO:0005782) microbody lumen(GO:0031907) |
| 0.0 | 11.6 | GO:0005615 | extracellular space(GO:0005615) |
| 0.0 | 1.3 | GO:0005788 | endoplasmic reticulum lumen(GO:0005788) |
Gene overrepresentation in molecular function category:
| Log-likelihood per target | Total log-likelihood | Term | Description |
|---|---|---|---|
| 2.9 | 17.1 | GO:0004430 | 1-phosphatidylinositol 4-kinase activity(GO:0004430) |
| 2.6 | 7.9 | GO:0030350 | iron-responsive element binding(GO:0030350) |
| 1.9 | 7.8 | GO:0005277 | acetylcholine transmembrane transporter activity(GO:0005277) secondary active organic cation transmembrane transporter activity(GO:0008513) acetate ester transmembrane transporter activity(GO:1901375) |
| 1.5 | 4.4 | GO:1904455 | ubiquitin-specific protease activity involved in negative regulation of ERAD pathway(GO:1904455) |
| 1.3 | 5.1 | GO:0000309 | nicotinamide-nucleotide adenylyltransferase activity(GO:0000309) |
| 1.1 | 5.7 | GO:0005152 | interleukin-1 receptor antagonist activity(GO:0005152) |
| 1.1 | 3.4 | GO:0008431 | vitamin E binding(GO:0008431) |
| 1.1 | 15.7 | GO:0015501 | glutamate:sodium symporter activity(GO:0015501) |
| 1.1 | 5.5 | GO:0047273 | galactosylgalactosylglucosylceramide beta-D-acetylgalactosaminyltransferase activity(GO:0047273) |
| 1.0 | 4.1 | GO:0033829 | O-fucosylpeptide 3-beta-N-acetylglucosaminyltransferase activity(GO:0033829) |
| 0.7 | 4.4 | GO:0003873 | 6-phosphofructo-2-kinase activity(GO:0003873) |
| 0.7 | 2.1 | GO:0033300 | dehydroascorbic acid transporter activity(GO:0033300) |
| 0.7 | 4.2 | GO:0003998 | acylphosphatase activity(GO:0003998) |
| 0.6 | 2.5 | GO:0016495 | C-X3-C chemokine receptor activity(GO:0016495) |
| 0.6 | 1.8 | GO:0005174 | CD40 receptor binding(GO:0005174) |
| 0.6 | 5.7 | GO:0004064 | arylesterase activity(GO:0004064) |
| 0.4 | 1.3 | GO:0050698 | proteoglycan sulfotransferase activity(GO:0050698) |
| 0.4 | 6.5 | GO:0030306 | ADP-ribosylation factor binding(GO:0030306) |
| 0.4 | 7.0 | GO:0031702 | type 1 angiotensin receptor binding(GO:0031702) |
| 0.4 | 2.2 | GO:0004699 | calcium-independent protein kinase C activity(GO:0004699) |
| 0.3 | 5.2 | GO:0008179 | adenylate cyclase binding(GO:0008179) |
| 0.3 | 20.9 | GO:0030507 | spectrin binding(GO:0030507) |
| 0.3 | 3.4 | GO:0004972 | NMDA glutamate receptor activity(GO:0004972) |
| 0.3 | 3.6 | GO:0086056 | voltage-gated calcium channel activity involved in AV node cell action potential(GO:0086056) |
| 0.3 | 1.9 | GO:0015184 | L-cystine transmembrane transporter activity(GO:0015184) |
| 0.3 | 2.1 | GO:0004024 | alcohol dehydrogenase activity, zinc-dependent(GO:0004024) |
| 0.3 | 4.3 | GO:0015125 | bile acid transmembrane transporter activity(GO:0015125) |
| 0.3 | 7.5 | GO:0043548 | phosphatidylinositol 3-kinase binding(GO:0043548) |
| 0.3 | 8.0 | GO:1905030 | voltage-gated sodium channel activity(GO:0005248) voltage-gated ion channel activity involved in regulation of postsynaptic membrane potential(GO:1905030) |
| 0.2 | 2.9 | GO:0005025 | transforming growth factor beta receptor activity, type I(GO:0005025) |
| 0.2 | 1.1 | GO:0004447 | iodide peroxidase activity(GO:0004447) |
| 0.2 | 0.6 | GO:0016822 | hydrolase activity, acting on acid carbon-carbon bonds(GO:0016822) hydrolase activity, acting on acid carbon-carbon bonds, in ketonic substances(GO:0016823) |
| 0.2 | 1.9 | GO:0035005 | 1-phosphatidylinositol-4-phosphate 3-kinase activity(GO:0035005) |
| 0.2 | 0.9 | GO:0004558 | alpha-1,4-glucosidase activity(GO:0004558) |
| 0.2 | 5.7 | GO:0008266 | poly(U) RNA binding(GO:0008266) |
| 0.2 | 3.4 | GO:0005545 | 1-phosphatidylinositol binding(GO:0005545) |
| 0.2 | 0.5 | GO:0030290 | sphingolipid activator protein activity(GO:0030290) beta-N-acetylgalactosaminidase activity(GO:0032428) |
| 0.2 | 3.2 | GO:0035497 | cAMP response element binding(GO:0035497) |
| 0.2 | 2.9 | GO:0001608 | G-protein coupled nucleotide receptor activity(GO:0001608) G-protein coupled purinergic nucleotide receptor activity(GO:0045028) |
| 0.1 | 1.9 | GO:0004089 | carbonate dehydratase activity(GO:0004089) |
| 0.1 | 9.3 | GO:0004521 | endoribonuclease activity(GO:0004521) |
| 0.1 | 0.9 | GO:0016670 | oxidoreductase activity, acting on a sulfur group of donors, oxygen as acceptor(GO:0016670) |
| 0.1 | 4.7 | GO:0017134 | fibroblast growth factor binding(GO:0017134) |
| 0.1 | 12.7 | GO:0004984 | olfactory receptor activity(GO:0004984) |
| 0.1 | 1.0 | GO:0004176 | ATP-dependent peptidase activity(GO:0004176) |
| 0.1 | 6.0 | GO:0004364 | glutathione transferase activity(GO:0004364) |
| 0.1 | 2.1 | GO:0070513 | death domain binding(GO:0070513) |
| 0.1 | 2.3 | GO:0032454 | histone demethylase activity (H3-K9 specific)(GO:0032454) |
| 0.1 | 1.4 | GO:0030280 | structural constituent of epidermis(GO:0030280) |
| 0.1 | 9.7 | GO:0004722 | protein serine/threonine phosphatase activity(GO:0004722) |
| 0.1 | 0.4 | GO:0032184 | SUMO polymer binding(GO:0032184) |
| 0.1 | 3.1 | GO:0003951 | NAD+ kinase activity(GO:0003951) |
| 0.1 | 5.4 | GO:0001784 | phosphotyrosine binding(GO:0001784) |
| 0.1 | 3.3 | GO:0004709 | MAP kinase kinase kinase activity(GO:0004709) |
| 0.1 | 0.9 | GO:0035374 | chondroitin sulfate binding(GO:0035374) |
| 0.1 | 3.4 | GO:0001972 | retinoic acid binding(GO:0001972) glucuronosyltransferase activity(GO:0015020) |
| 0.1 | 0.8 | GO:0051425 | PTB domain binding(GO:0051425) |
| 0.1 | 1.2 | GO:0004679 | AMP-activated protein kinase activity(GO:0004679) |
| 0.1 | 2.0 | GO:0098641 | cadherin binding involved in cell-cell adhesion(GO:0098641) |
| 0.1 | 3.5 | GO:0042162 | telomeric DNA binding(GO:0042162) |
| 0.1 | 1.2 | GO:0031957 | very long-chain fatty acid-CoA ligase activity(GO:0031957) |
| 0.1 | 2.6 | GO:0015248 | sterol transporter activity(GO:0015248) |
| 0.1 | 2.0 | GO:0022848 | acetylcholine-gated cation channel activity(GO:0022848) |
| 0.1 | 5.0 | GO:0004867 | serine-type endopeptidase inhibitor activity(GO:0004867) |
| 0.1 | 0.8 | GO:0050700 | CARD domain binding(GO:0050700) |
| 0.1 | 11.3 | GO:0002020 | protease binding(GO:0002020) |
| 0.1 | 1.2 | GO:0005522 | profilin binding(GO:0005522) |
| 0.1 | 0.6 | GO:0008131 | primary amine oxidase activity(GO:0008131) |
| 0.1 | 1.6 | GO:0004435 | phosphatidylinositol phospholipase C activity(GO:0004435) |
| 0.1 | 2.1 | GO:0005184 | neuropeptide hormone activity(GO:0005184) |
| 0.0 | 6.1 | GO:0005262 | calcium channel activity(GO:0005262) |
| 0.0 | 0.3 | GO:0010465 | nerve growth factor receptor activity(GO:0010465) |
| 0.0 | 2.8 | GO:0017080 | sodium channel regulator activity(GO:0017080) |
| 0.0 | 0.2 | GO:0004105 | choline-phosphate cytidylyltransferase activity(GO:0004105) |
| 0.0 | 0.5 | GO:0043176 | amine binding(GO:0043176) serotonin binding(GO:0051378) |
| 0.0 | 1.8 | GO:0004385 | guanylate kinase activity(GO:0004385) |
| 0.0 | 0.1 | GO:0008281 | sulfonylurea receptor activity(GO:0008281) |
| 0.0 | 3.3 | GO:0019888 | protein phosphatase regulator activity(GO:0019888) |
| 0.0 | 2.6 | GO:0004843 | thiol-dependent ubiquitin-specific protease activity(GO:0004843) |
| 0.0 | 2.3 | GO:0048365 | Rac GTPase binding(GO:0048365) |
| 0.0 | 0.4 | GO:0031005 | filamin binding(GO:0031005) |
| 0.0 | 1.7 | GO:0043022 | ribosome binding(GO:0043022) |
| 0.0 | 8.6 | GO:0008022 | protein C-terminus binding(GO:0008022) |
| 0.0 | 2.7 | GO:0051117 | ATPase binding(GO:0051117) |
| 0.0 | 22.5 | GO:0005509 | calcium ion binding(GO:0005509) |
| 0.0 | 0.7 | GO:0000146 | microfilament motor activity(GO:0000146) |
| 0.0 | 1.6 | GO:0004693 | cyclin-dependent protein serine/threonine kinase activity(GO:0004693) |
| 0.0 | 2.4 | GO:0005179 | hormone activity(GO:0005179) |
| 0.0 | 0.7 | GO:0071889 | 14-3-3 protein binding(GO:0071889) |
| 0.0 | 0.5 | GO:0042813 | Wnt-activated receptor activity(GO:0042813) |
| 0.0 | 2.1 | GO:0005089 | Rho guanyl-nucleotide exchange factor activity(GO:0005089) |
| 0.0 | 0.9 | GO:0015026 | coreceptor activity(GO:0015026) |
| 0.0 | 4.4 | GO:0004252 | serine-type endopeptidase activity(GO:0004252) |
| 0.0 | 2.8 | GO:0051015 | actin filament binding(GO:0051015) |
| 0.0 | 1.0 | GO:0004540 | ribonuclease activity(GO:0004540) |
| 0.0 | 0.3 | GO:0003841 | 1-acylglycerol-3-phosphate O-acyltransferase activity(GO:0003841) |
| 0.0 | 1.7 | GO:0008170 | N-methyltransferase activity(GO:0008170) |
| 0.0 | 3.0 | GO:0061630 | ubiquitin protein ligase activity(GO:0061630) |
| 0.0 | 1.3 | GO:0043130 | ubiquitin binding(GO:0043130) |
| 0.0 | 0.6 | GO:0048306 | calcium-dependent protein binding(GO:0048306) |
| 0.0 | 1.4 | GO:0004518 | nuclease activity(GO:0004518) |
| 0.0 | 1.2 | GO:0000979 | RNA polymerase II core promoter sequence-specific DNA binding(GO:0000979) |
Gene overrepresentation in curated gene sets: canonical pathways category:
| Log-likelihood per target | Total log-likelihood | Term | Description |
|---|---|---|---|
| 0.2 | 3.2 | SA REG CASCADE OF CYCLIN EXPR | Expression of cyclins regulates progression through the cell cycle by activating cyclin-dependent kinases. |
| 0.1 | 7.5 | SIG INSULIN RECEPTOR PATHWAY IN CARDIAC MYOCYTES | Genes related to the insulin receptor pathway |
| 0.1 | 3.4 | SA PTEN PATHWAY | PTEN is a tumor suppressor that dephosphorylates the lipid messenger phosphatidylinositol triphosphate. |
| 0.1 | 3.3 | PID P38 MKK3 6PATHWAY | p38 MAPK signaling pathway |
| 0.1 | 5.8 | PID CD40 PATHWAY | CD40/CD40L signaling |
| 0.1 | 7.5 | PID TGFBR PATHWAY | TGF-beta receptor signaling |
| 0.1 | 3.6 | PID TNF PATHWAY | TNF receptor signaling pathway |
| 0.1 | 1.6 | PID ECADHERIN KERATINOCYTE PATHWAY | E-cadherin signaling in keratinocytes |
| 0.1 | 2.9 | PID BMP PATHWAY | BMP receptor signaling |
| 0.1 | 2.1 | PID HIV NEF PATHWAY | HIV-1 Nef: Negative effector of Fas and TNF-alpha |
| 0.1 | 13.5 | NABA ECM REGULATORS | Genes encoding enzymes and their regulators involved in the remodeling of the extracellular matrix |
| 0.0 | 2.7 | SIG REGULATION OF THE ACTIN CYTOSKELETON BY RHO GTPASES | Genes related to regulation of the actin cytoskeleton |
| 0.0 | 3.7 | PID TRKR PATHWAY | Neurotrophic factor-mediated Trk receptor signaling |
| 0.0 | 5.7 | PID CMYB PATHWAY | C-MYB transcription factor network |
| 0.0 | 3.5 | PID TELOMERASE PATHWAY | Regulation of Telomerase |
| 0.0 | 2.2 | PID TXA2PATHWAY | Thromboxane A2 receptor signaling |
| 0.0 | 0.8 | PID GLYPICAN 1PATHWAY | Glypican 1 network |
| 0.0 | 2.2 | PID DELTA NP63 PATHWAY | Validated transcriptional targets of deltaNp63 isoforms |
| 0.0 | 0.8 | PID NFKAPPAB CANONICAL PATHWAY | Canonical NF-kappaB pathway |
| 0.0 | 0.6 | PID ARF 3PATHWAY | Arf1 pathway |
| 0.0 | 1.4 | NABA PROTEOGLYCANS | Genes encoding proteoglycans |
| 0.0 | 0.9 | PID IL12 STAT4 PATHWAY | IL12 signaling mediated by STAT4 |
| 0.0 | 1.2 | PID LKB1 PATHWAY | LKB1 signaling events |
| 0.0 | 7.1 | NABA SECRETED FACTORS | Genes encoding secreted soluble factors |
| 0.0 | 2.0 | PID INTEGRIN1 PATHWAY | Beta1 integrin cell surface interactions |
| 0.0 | 0.7 | ST DIFFERENTIATION PATHWAY IN PC12 CELLS | Differentiation Pathway in PC12 Cells; this is a specific case of PAC1 Receptor Pathway. |
| 0.0 | 0.7 | ST INTEGRIN SIGNALING PATHWAY | Integrin Signaling Pathway |
| 0.0 | 1.9 | NABA MATRISOME ASSOCIATED | Ensemble of genes encoding ECM-associated proteins including ECM-affilaited proteins, ECM regulators and secreted factors |
Gene overrepresentation in curated gene sets: REACTOME pathways category:
| Log-likelihood per target | Total log-likelihood | Term | Description |
|---|---|---|---|
| 0.8 | 19.0 | REACTOME SYNTHESIS OF PIPS AT THE GOLGI MEMBRANE | Genes involved in Synthesis of PIPs at the Golgi membrane |
| 0.7 | 9.8 | REACTOME ABACAVIR TRANSPORT AND METABOLISM | Genes involved in Abacavir transport and metabolism |
| 0.6 | 9.7 | REACTOME INHIBITION OF REPLICATION INITIATION OF DAMAGED DNA BY RB1 E2F1 | Genes involved in Inhibition of replication initiation of damaged DNA by RB1/E2F1 |
| 0.5 | 7.7 | REACTOME REVERSIBLE HYDRATION OF CARBON DIOXIDE | Genes involved in Reversible Hydration of Carbon Dioxide |
| 0.4 | 3.5 | REACTOME PACKAGING OF TELOMERE ENDS | Genes involved in Packaging Of Telomere Ends |
| 0.2 | 17.6 | REACTOME AMINO ACID AND OLIGOPEPTIDE SLC TRANSPORTERS | Genes involved in Amino acid and oligopeptide SLC transporters |
| 0.2 | 2.8 | REACTOME GAMMA CARBOXYLATION TRANSPORT AND AMINO TERMINAL CLEAVAGE OF PROTEINS | Genes involved in Gamma-carboxylation, transport, and amino-terminal cleavage of proteins |
| 0.2 | 2.0 | REACTOME TRANSPORT OF ORGANIC ANIONS | Genes involved in Transport of organic anions |
| 0.2 | 4.1 | REACTOME PRE NOTCH PROCESSING IN GOLGI | Genes involved in Pre-NOTCH Processing in Golgi |
| 0.1 | 6.4 | REACTOME INTERACTION BETWEEN L1 AND ANKYRINS | Genes involved in Interaction between L1 and Ankyrins |
| 0.1 | 2.3 | REACTOME RECYCLING OF BILE ACIDS AND SALTS | Genes involved in Recycling of bile acids and salts |
| 0.1 | 2.5 | REACTOME CHEMOKINE RECEPTORS BIND CHEMOKINES | Genes involved in Chemokine receptors bind chemokines |
| 0.1 | 12.3 | REACTOME OLFACTORY SIGNALING PATHWAY | Genes involved in Olfactory Signaling Pathway |
| 0.1 | 4.2 | REACTOME GLUTATHIONE CONJUGATION | Genes involved in Glutathione conjugation |
| 0.1 | 2.5 | REACTOME SIGNAL ATTENUATION | Genes involved in Signal attenuation |
| 0.1 | 2.1 | REACTOME P2Y RECEPTORS | Genes involved in P2Y receptors |
| 0.1 | 4.0 | REACTOME ANTIGEN ACTIVATES B CELL RECEPTOR LEADING TO GENERATION OF SECOND MESSENGERS | Genes involved in Antigen Activates B Cell Receptor Leading to Generation of Second Messengers |
| 0.1 | 2.1 | REACTOME FACILITATIVE NA INDEPENDENT GLUCOSE TRANSPORTERS | Genes involved in Facilitative Na+-independent glucose transporters |
| 0.1 | 2.0 | REACTOME PRESYNAPTIC NICOTINIC ACETYLCHOLINE RECEPTORS | Genes involved in Presynaptic nicotinic acetylcholine receptors |
| 0.1 | 3.3 | REACTOME DEADENYLATION OF MRNA | Genes involved in Deadenylation of mRNA |
| 0.1 | 3.6 | REACTOME INHIBITION OF INSULIN SECRETION BY ADRENALINE NORADRENALINE | Genes involved in Inhibition of Insulin Secretion by Adrenaline/Noradrenaline |
| 0.1 | 3.4 | REACTOME GLUCAGON TYPE LIGAND RECEPTORS | Genes involved in Glucagon-type ligand receptors |
| 0.1 | 0.6 | REACTOME TRYPTOPHAN CATABOLISM | Genes involved in Tryptophan catabolism |
| 0.1 | 1.4 | REACTOME KERATAN SULFATE DEGRADATION | Genes involved in Keratan sulfate degradation |
| 0.1 | 4.1 | REACTOME GLYCOLYSIS | Genes involved in Glycolysis |
| 0.1 | 1.6 | REACTOME CLASS C 3 METABOTROPIC GLUTAMATE PHEROMONE RECEPTORS | Genes involved in Class C/3 (Metabotropic glutamate/pheromone receptors) |
| 0.1 | 0.9 | REACTOME DIGESTION OF DIETARY CARBOHYDRATE | Genes involved in Digestion of dietary carbohydrate |
| 0.1 | 2.2 | REACTOME G ALPHA Z SIGNALLING EVENTS | Genes involved in G alpha (z) signalling events |
| 0.1 | 5.1 | REACTOME METABOLISM OF VITAMINS AND COFACTORS | Genes involved in Metabolism of vitamins and cofactors |
| 0.1 | 1.8 | REACTOME GLUCURONIDATION | Genes involved in Glucuronidation |
| 0.1 | 2.9 | REACTOME SIGNALING BY BMP | Genes involved in Signaling by BMP |
| 0.1 | 12.3 | REACTOME G ALPHA I SIGNALLING EVENTS | Genes involved in G alpha (i) signalling events |
| 0.1 | 0.5 | REACTOME SEROTONIN RECEPTORS | Genes involved in Serotonin receptors |
| 0.1 | 1.2 | REACTOME REGULATION OF RHEB GTPASE ACTIVITY BY AMPK | Genes involved in Regulation of Rheb GTPase activity by AMPK |
| 0.1 | 3.4 | REACTOME IL 2 SIGNALING | Genes involved in Interleukin-2 signaling |
| 0.1 | 1.1 | REACTOME AMINE DERIVED HORMONES | Genes involved in Amine-derived hormones |
| 0.1 | 0.9 | REACTOME CD28 DEPENDENT VAV1 PATHWAY | Genes involved in CD28 dependent Vav1 pathway |
| 0.1 | 2.2 | REACTOME ADHERENS JUNCTIONS INTERACTIONS | Genes involved in Adherens junctions interactions |
| 0.1 | 4.7 | REACTOME LOSS OF NLP FROM MITOTIC CENTROSOMES | Genes involved in Loss of Nlp from mitotic centrosomes |
| 0.1 | 0.6 | REACTOME MEMBRANE BINDING AND TARGETTING OF GAG PROTEINS | Genes involved in Membrane binding and targetting of GAG proteins |
| 0.0 | 1.6 | REACTOME TIGHT JUNCTION INTERACTIONS | Genes involved in Tight junction interactions |
| 0.0 | 2.2 | REACTOME TRANSCRIPTIONAL REGULATION OF WHITE ADIPOCYTE DIFFERENTIATION | Genes involved in Transcriptional Regulation of White Adipocyte Differentiation |
| 0.0 | 1.2 | REACTOME GENERATION OF SECOND MESSENGER MOLECULES | Genes involved in Generation of second messenger molecules |
| 0.0 | 0.8 | REACTOME ACTIVATED TAK1 MEDIATES P38 MAPK ACTIVATION | Genes involved in activated TAK1 mediates p38 MAPK activation |
| 0.0 | 0.6 | REACTOME NOREPINEPHRINE NEUROTRANSMITTER RELEASE CYCLE | Genes involved in Norepinephrine Neurotransmitter Release Cycle |
| 0.0 | 0.9 | REACTOME CELL EXTRACELLULAR MATRIX INTERACTIONS | Genes involved in Cell-extracellular matrix interactions |
| 0.0 | 1.0 | REACTOME ASSOCIATION OF TRIC CCT WITH TARGET PROTEINS DURING BIOSYNTHESIS | Genes involved in Association of TriC/CCT with target proteins during biosynthesis |
| 0.0 | 2.6 | REACTOME MHC CLASS II ANTIGEN PRESENTATION | Genes involved in MHC class II antigen presentation |
| 0.0 | 1.7 | REACTOME IMMUNOREGULATORY INTERACTIONS BETWEEN A LYMPHOID AND A NON LYMPHOID CELL | Genes involved in Immunoregulatory interactions between a Lymphoid and a non-Lymphoid cell |
| 0.0 | 8.2 | REACTOME GENERIC TRANSCRIPTION PATHWAY | Genes involved in Generic Transcription Pathway |
| 0.0 | 1.2 | REACTOME PEPTIDE LIGAND BINDING RECEPTORS | Genes involved in Peptide ligand-binding receptors |
| 0.0 | 1.8 | REACTOME UNFOLDED PROTEIN RESPONSE | Genes involved in Unfolded Protein Response |
| 0.0 | 0.3 | REACTOME HORMONE SENSITIVE LIPASE HSL MEDIATED TRIACYLGLYCEROL HYDROLYSIS | Genes involved in Hormone-sensitive lipase (HSL)-mediated triacylglycerol hydrolysis |