Project
GNF SymAtlas + NCI-60 cancer cell lines, human (Su, 2004; Ross, 2000)
Navigation
Downloads
Results for HOXB4_LHX9
Z-value: 0.72
Motif logo
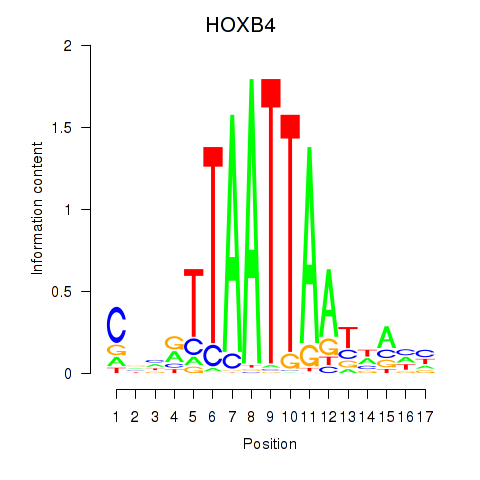
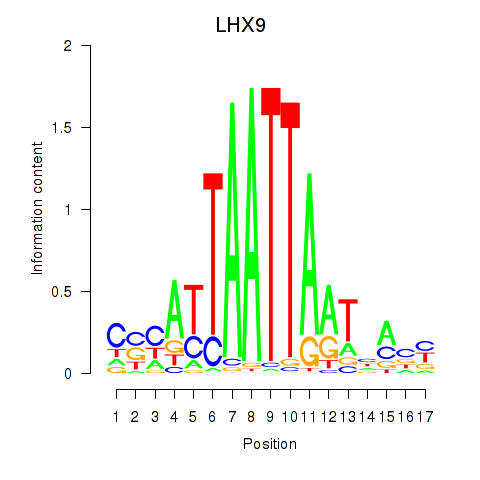
Transcription factors associated with HOXB4_LHX9
| Gene Symbol | Gene ID | Gene Info |
|---|---|---|
|
HOXB4
|
ENSG00000182742.6 | HOXB4 |
|
LHX9
|
ENSG00000143355.16 | LHX9 |
Activity profile of HOXB4_LHX9 motif
Sorted Z-values of HOXB4_LHX9 motif
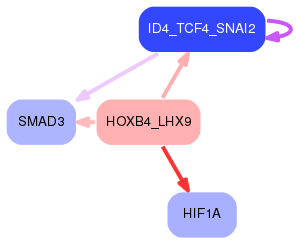
Network of associatons between targets according to the STRING database.

First level regulatory network of HOXB4_LHX9
Gene Ontology Analysis
Gene overrepresentation in biological process category:
| Log-likelihood per target | Total log-likelihood | Term | Description |
|---|---|---|---|
| 5.5 | 27.3 | GO:0044111 | development involved in symbiotic interaction(GO:0044111) |
| 4.2 | 29.7 | GO:0006880 | intracellular sequestering of iron ion(GO:0006880) sequestering of iron ion(GO:0097577) |
| 4.1 | 16.5 | GO:0006617 | SRP-dependent cotranslational protein targeting to membrane, signal sequence recognition(GO:0006617) |
| 3.6 | 10.8 | GO:0009786 | regulation of asymmetric cell division(GO:0009786) |
| 2.5 | 12.5 | GO:0030174 | regulation of DNA-dependent DNA replication initiation(GO:0030174) |
| 2.4 | 17.1 | GO:0051541 | elastin metabolic process(GO:0051541) |
| 2.4 | 46.0 | GO:0003334 | keratinocyte development(GO:0003334) |
| 2.3 | 18.4 | GO:0042866 | pyruvate biosynthetic process(GO:0042866) |
| 2.3 | 6.9 | GO:0031456 | glycine betaine biosynthetic process from choline(GO:0019285) glycine betaine metabolic process(GO:0031455) glycine betaine biosynthetic process(GO:0031456) |
| 2.2 | 13.3 | GO:0009438 | methylglyoxal metabolic process(GO:0009438) |
| 2.1 | 10.3 | GO:0031291 | Ran protein signal transduction(GO:0031291) |
| 2.0 | 9.9 | GO:0033383 | geranyl diphosphate metabolic process(GO:0033383) geranyl diphosphate biosynthetic process(GO:0033384) farnesyl diphosphate biosynthetic process(GO:0045337) |
| 1.8 | 5.3 | GO:0000454 | snoRNA guided rRNA pseudouridine synthesis(GO:0000454) |
| 1.6 | 8.2 | GO:0010286 | heat acclimation(GO:0010286) cellular heat acclimation(GO:0070370) |
| 1.4 | 19.6 | GO:0051096 | positive regulation of helicase activity(GO:0051096) |
| 1.4 | 8.1 | GO:0090063 | positive regulation of microtubule nucleation(GO:0090063) |
| 1.3 | 6.5 | GO:0099590 | neurotransmitter receptor internalization(GO:0099590) |
| 1.2 | 3.5 | GO:0045715 | negative regulation of low-density lipoprotein particle receptor biosynthetic process(GO:0045715) |
| 1.2 | 3.5 | GO:2000397 | ubiquitin-dependent endocytosis(GO:0070086) positive regulation of viral budding via host ESCRT complex(GO:1903774) regulation of ubiquitin-dependent endocytosis(GO:2000395) positive regulation of ubiquitin-dependent endocytosis(GO:2000397) |
| 1.2 | 3.5 | GO:1903674 | regulation of cap-dependent translational initiation(GO:1903674) positive regulation of cap-dependent translational initiation(GO:1903676) |
| 1.1 | 8.8 | GO:0071847 | TNFSF11-mediated signaling pathway(GO:0071847) |
| 1.1 | 6.5 | GO:0010643 | cell communication by chemical coupling(GO:0010643) |
| 1.1 | 3.2 | GO:0010730 | negative regulation of hydrogen peroxide biosynthetic process(GO:0010730) |
| 1.1 | 3.2 | GO:0036510 | trimming of terminal mannose on C branch(GO:0036510) |
| 1.0 | 12.6 | GO:0045835 | negative regulation of meiotic nuclear division(GO:0045835) |
| 0.9 | 2.8 | GO:1901420 | negative regulation of response to alcohol(GO:1901420) |
| 0.9 | 2.7 | GO:1903595 | positive regulation of histamine secretion by mast cell(GO:1903595) |
| 0.9 | 3.6 | GO:0002270 | plasmacytoid dendritic cell activation(GO:0002270) regulation of restriction endodeoxyribonuclease activity(GO:0032072) negative regulation of apoptotic cell clearance(GO:2000426) |
| 0.9 | 6.8 | GO:0032020 | ISG15-protein conjugation(GO:0032020) |
| 0.7 | 2.8 | GO:0035880 | embryonic nail plate morphogenesis(GO:0035880) |
| 0.7 | 2.1 | GO:0044752 | response to human chorionic gonadotropin(GO:0044752) cellular response to thyroxine stimulus(GO:0097069) cellular response to L-phenylalanine derivative(GO:1904387) |
| 0.7 | 5.5 | GO:0016139 | glycoside catabolic process(GO:0016139) |
| 0.7 | 6.2 | GO:0045040 | protein import into mitochondrial outer membrane(GO:0045040) |
| 0.7 | 2.0 | GO:1902524 | positive regulation of protein K48-linked ubiquitination(GO:1902524) |
| 0.7 | 6.0 | GO:2000645 | negative regulation of receptor catabolic process(GO:2000645) |
| 0.6 | 4.9 | GO:0016255 | attachment of GPI anchor to protein(GO:0016255) |
| 0.6 | 28.0 | GO:0070979 | protein K11-linked ubiquitination(GO:0070979) |
| 0.6 | 2.9 | GO:0070425 | negative regulation of nucleotide-binding oligomerization domain containing signaling pathway(GO:0070425) negative regulation of nucleotide-binding oligomerization domain containing 2 signaling pathway(GO:0070433) |
| 0.6 | 9.2 | GO:0090084 | negative regulation of inclusion body assembly(GO:0090084) |
| 0.5 | 3.3 | GO:0071460 | cellular response to cell-matrix adhesion(GO:0071460) |
| 0.5 | 3.1 | GO:1900368 | regulation of RNA interference(GO:1900368) negative regulation of RNA interference(GO:1900369) |
| 0.5 | 5.6 | GO:2001288 | positive regulation of caveolin-mediated endocytosis(GO:2001288) |
| 0.5 | 1.4 | GO:0050717 | positive regulation of interleukin-1 alpha secretion(GO:0050717) |
| 0.4 | 3.6 | GO:0009597 | detection of virus(GO:0009597) |
| 0.4 | 2.6 | GO:0070973 | protein localization to endoplasmic reticulum exit site(GO:0070973) |
| 0.4 | 2.1 | GO:0003350 | pulmonary myocardium development(GO:0003350) |
| 0.4 | 1.3 | GO:0003162 | atrioventricular node development(GO:0003162) |
| 0.4 | 3.4 | GO:0006659 | phosphatidylserine biosynthetic process(GO:0006659) |
| 0.4 | 5.8 | GO:1904869 | regulation of protein localization to Cajal body(GO:1904869) positive regulation of protein localization to Cajal body(GO:1904871) |
| 0.4 | 10.0 | GO:0051764 | actin crosslink formation(GO:0051764) |
| 0.4 | 3.2 | GO:1904798 | positive regulation of core promoter binding(GO:1904798) |
| 0.3 | 2.8 | GO:0030091 | protein repair(GO:0030091) |
| 0.3 | 11.1 | GO:0031468 | nuclear envelope reassembly(GO:0031468) |
| 0.3 | 2.2 | GO:0031339 | negative regulation of vesicle fusion(GO:0031339) |
| 0.3 | 2.2 | GO:0045110 | intermediate filament bundle assembly(GO:0045110) |
| 0.3 | 2.4 | GO:0006203 | dGTP catabolic process(GO:0006203) |
| 0.3 | 3.9 | GO:1900623 | regulation of monocyte aggregation(GO:1900623) positive regulation of monocyte aggregation(GO:1900625) |
| 0.3 | 1.8 | GO:2000253 | positive regulation of feeding behavior(GO:2000253) |
| 0.3 | 3.3 | GO:0042407 | cristae formation(GO:0042407) |
| 0.3 | 1.3 | GO:0010710 | regulation of collagen catabolic process(GO:0010710) |
| 0.3 | 11.7 | GO:0006376 | mRNA splice site selection(GO:0006376) |
| 0.3 | 1.6 | GO:0061767 | negative regulation of lung blood pressure(GO:0061767) |
| 0.3 | 2.0 | GO:0002759 | regulation of antimicrobial humoral response(GO:0002759) |
| 0.2 | 17.5 | GO:0070125 | mitochondrial translational elongation(GO:0070125) |
| 0.2 | 1.8 | GO:0035414 | negative regulation of catenin import into nucleus(GO:0035414) |
| 0.2 | 7.1 | GO:0030033 | microvillus assembly(GO:0030033) |
| 0.2 | 1.1 | GO:0002074 | extraocular skeletal muscle development(GO:0002074) |
| 0.2 | 0.6 | GO:0002184 | cytoplasmic translational termination(GO:0002184) |
| 0.2 | 4.0 | GO:0010592 | positive regulation of lamellipodium assembly(GO:0010592) |
| 0.2 | 1.4 | GO:0051388 | positive regulation of neurotrophin TRK receptor signaling pathway(GO:0051388) |
| 0.2 | 0.6 | GO:0002304 | gamma-delta intraepithelial T cell differentiation(GO:0002304) CD8-positive, gamma-delta intraepithelial T cell differentiation(GO:0002305) |
| 0.2 | 8.9 | GO:0006409 | tRNA export from nucleus(GO:0006409) tRNA-containing ribonucleoprotein complex export from nucleus(GO:0071431) |
| 0.2 | 2.9 | GO:0040032 | post-embryonic body morphogenesis(GO:0040032) |
| 0.2 | 2.2 | GO:0052696 | flavonoid glucuronidation(GO:0052696) xenobiotic glucuronidation(GO:0052697) |
| 0.2 | 2.6 | GO:0000338 | protein deneddylation(GO:0000338) |
| 0.2 | 0.7 | GO:0060335 | positive regulation of response to interferon-gamma(GO:0060332) positive regulation of interferon-gamma-mediated signaling pathway(GO:0060335) regulation of G0 to G1 transition(GO:0070316) |
| 0.2 | 2.7 | GO:0007253 | cytoplasmic sequestering of NF-kappaB(GO:0007253) |
| 0.2 | 4.2 | GO:0061157 | mRNA destabilization(GO:0061157) |
| 0.2 | 1.1 | GO:0044245 | polysaccharide digestion(GO:0044245) |
| 0.2 | 14.1 | GO:0051436 | negative regulation of ubiquitin-protein ligase activity involved in mitotic cell cycle(GO:0051436) |
| 0.1 | 0.7 | GO:0042796 | snRNA transcription from RNA polymerase III promoter(GO:0042796) |
| 0.1 | 4.5 | GO:0000272 | polysaccharide catabolic process(GO:0000272) glycogen catabolic process(GO:0005980) glucan catabolic process(GO:0009251) cellular polysaccharide catabolic process(GO:0044247) |
| 0.1 | 5.0 | GO:1901998 | toxin transport(GO:1901998) |
| 0.1 | 3.5 | GO:0008334 | histone mRNA metabolic process(GO:0008334) |
| 0.1 | 3.0 | GO:0031581 | hemidesmosome assembly(GO:0031581) |
| 0.1 | 2.9 | GO:0006359 | regulation of transcription from RNA polymerase III promoter(GO:0006359) |
| 0.1 | 7.4 | GO:0006910 | phagocytosis, recognition(GO:0006910) |
| 0.1 | 1.9 | GO:0000028 | ribosomal small subunit assembly(GO:0000028) |
| 0.1 | 1.9 | GO:0007064 | mitotic sister chromatid cohesion(GO:0007064) |
| 0.1 | 3.4 | GO:0061099 | negative regulation of protein tyrosine kinase activity(GO:0061099) |
| 0.1 | 2.2 | GO:0000042 | protein targeting to Golgi(GO:0000042) |
| 0.1 | 0.4 | GO:0098789 | pre-mRNA cleavage required for polyadenylation(GO:0098789) |
| 0.1 | 0.9 | GO:0002315 | marginal zone B cell differentiation(GO:0002315) |
| 0.1 | 6.6 | GO:0046902 | regulation of mitochondrial membrane permeability(GO:0046902) |
| 0.1 | 0.3 | GO:0039534 | negative regulation of MDA-5 signaling pathway(GO:0039534) |
| 0.1 | 1.5 | GO:0060347 | heart trabecula formation(GO:0060347) |
| 0.1 | 2.6 | GO:0051642 | centrosome localization(GO:0051642) |
| 0.1 | 0.6 | GO:0061732 | mitochondrial acetyl-CoA biosynthetic process from pyruvate(GO:0061732) |
| 0.1 | 1.3 | GO:0055070 | copper ion homeostasis(GO:0055070) |
| 0.1 | 9.3 | GO:0030705 | cytoskeleton-dependent intracellular transport(GO:0030705) |
| 0.1 | 6.5 | GO:0000070 | mitotic sister chromatid segregation(GO:0000070) |
| 0.1 | 0.8 | GO:0007252 | I-kappaB phosphorylation(GO:0007252) |
| 0.0 | 1.0 | GO:0019371 | cyclooxygenase pathway(GO:0019371) |
| 0.0 | 2.4 | GO:0051881 | regulation of mitochondrial membrane potential(GO:0051881) |
| 0.0 | 1.4 | GO:0043252 | sodium-independent organic anion transport(GO:0043252) |
| 0.0 | 0.9 | GO:0048240 | sperm capacitation(GO:0048240) |
| 0.0 | 1.0 | GO:1904659 | hexose transmembrane transport(GO:0035428) glucose transmembrane transport(GO:1904659) |
| 0.0 | 2.3 | GO:0006369 | termination of RNA polymerase II transcription(GO:0006369) |
| 0.0 | 0.5 | GO:0030150 | protein import into mitochondrial matrix(GO:0030150) |
| 0.0 | 0.1 | GO:0034334 | adherens junction maintenance(GO:0034334) |
| 0.0 | 0.8 | GO:0000462 | maturation of SSU-rRNA from tricistronic rRNA transcript (SSU-rRNA, 5.8S rRNA, LSU-rRNA)(GO:0000462) |
| 0.0 | 0.4 | GO:0010499 | proteasomal ubiquitin-independent protein catabolic process(GO:0010499) |
| 0.0 | 4.7 | GO:0038095 | Fc-epsilon receptor signaling pathway(GO:0038095) |
| 0.0 | 4.2 | GO:0006614 | SRP-dependent cotranslational protein targeting to membrane(GO:0006614) |
| 0.0 | 0.2 | GO:0009441 | glycolate metabolic process(GO:0009441) |
| 0.0 | 4.0 | GO:0035335 | peptidyl-tyrosine dephosphorylation(GO:0035335) |
| 0.0 | 6.5 | GO:0045732 | positive regulation of protein catabolic process(GO:0045732) |
| 0.0 | 0.8 | GO:1901685 | glutathione derivative metabolic process(GO:1901685) glutathione derivative biosynthetic process(GO:1901687) |
| 0.0 | 2.5 | GO:0002456 | T cell mediated immunity(GO:0002456) |
| 0.0 | 1.6 | GO:0007157 | heterophilic cell-cell adhesion via plasma membrane cell adhesion molecules(GO:0007157) |
| 0.0 | 0.2 | GO:0044829 | positive regulation by host of viral genome replication(GO:0044829) |
| 0.0 | 0.5 | GO:0006833 | water transport(GO:0006833) |
| 0.0 | 0.5 | GO:0001580 | detection of chemical stimulus involved in sensory perception of bitter taste(GO:0001580) |
| 0.0 | 6.3 | GO:0000377 | RNA splicing, via transesterification reactions with bulged adenosine as nucleophile(GO:0000377) mRNA splicing, via spliceosome(GO:0000398) |
| 0.0 | 2.6 | GO:0002377 | immunoglobulin production(GO:0002377) |
| 0.0 | 1.3 | GO:0045454 | cell redox homeostasis(GO:0045454) |
| 0.0 | 1.0 | GO:0006890 | retrograde vesicle-mediated transport, Golgi to ER(GO:0006890) |
| 0.0 | 1.2 | GO:0051028 | mRNA transport(GO:0051028) |
| 0.0 | 0.2 | GO:0035589 | G-protein coupled purinergic nucleotide receptor signaling pathway(GO:0035589) |
| 0.0 | 0.0 | GO:0051919 | positive regulation of fibrinolysis(GO:0051919) |
Gene overrepresentation in cellular component category:
| Log-likelihood per target | Total log-likelihood | Term | Description |
|---|---|---|---|
| 4.2 | 29.7 | GO:0044326 | dendritic spine neck(GO:0044326) |
| 3.9 | 27.3 | GO:0044352 | pinosome(GO:0044352) macropinosome(GO:0044354) |
| 2.8 | 11.1 | GO:1990730 | VCP-NSFL1C complex(GO:1990730) |
| 1.8 | 16.5 | GO:0005786 | signal recognition particle, endoplasmic reticulum targeting(GO:0005786) |
| 1.3 | 4.0 | GO:0036194 | muscle cell projection(GO:0036194) muscle cell projection membrane(GO:0036195) |
| 1.2 | 4.9 | GO:0042765 | GPI-anchor transamidase complex(GO:0042765) |
| 1.2 | 10.8 | GO:0036449 | microtubule minus-end(GO:0036449) meiotic spindle(GO:0072687) |
| 1.2 | 7.1 | GO:0000444 | MIS12/MIND type complex(GO:0000444) |
| 1.2 | 3.5 | GO:0034686 | integrin alphav-beta8 complex(GO:0034686) |
| 1.1 | 12.5 | GO:0030870 | Mre11 complex(GO:0030870) |
| 0.9 | 9.2 | GO:0070852 | cell body fiber(GO:0070852) |
| 0.9 | 46.0 | GO:0002102 | podosome(GO:0002102) |
| 0.8 | 6.6 | GO:0005742 | mitochondrial outer membrane translocase complex(GO:0005742) |
| 0.8 | 5.3 | GO:0090661 | box H/ACA snoRNP complex(GO:0031429) box H/ACA RNP complex(GO:0072588) box H/ACA scaRNP complex(GO:0072589) box H/ACA telomerase RNP complex(GO:0090661) |
| 0.7 | 15.3 | GO:0071004 | U2-type prespliceosome(GO:0071004) |
| 0.7 | 2.1 | GO:0017109 | glutamate-cysteine ligase complex(GO:0017109) |
| 0.6 | 12.6 | GO:0005952 | cAMP-dependent protein kinase complex(GO:0005952) |
| 0.6 | 8.1 | GO:0005869 | dynactin complex(GO:0005869) |
| 0.6 | 3.3 | GO:0061617 | MICOS complex(GO:0061617) |
| 0.5 | 2.4 | GO:0045272 | plasma membrane respiratory chain complex I(GO:0045272) |
| 0.5 | 14.1 | GO:0005838 | proteasome regulatory particle(GO:0005838) |
| 0.5 | 1.4 | GO:0072557 | IPAF inflammasome complex(GO:0072557) |
| 0.4 | 1.3 | GO:0034677 | integrin alpha7-beta1 complex(GO:0034677) |
| 0.4 | 5.8 | GO:0002199 | zona pellucida receptor complex(GO:0002199) |
| 0.4 | 3.1 | GO:0044530 | supraspliceosomal complex(GO:0044530) |
| 0.4 | 6.6 | GO:0043073 | germ cell nucleus(GO:0043073) |
| 0.4 | 10.3 | GO:0071782 | endoplasmic reticulum tubular network(GO:0071782) |
| 0.4 | 3.5 | GO:0000813 | ESCRT I complex(GO:0000813) |
| 0.4 | 19.6 | GO:0009295 | nucleoid(GO:0009295) mitochondrial nucleoid(GO:0042645) |
| 0.4 | 8.2 | GO:0035098 | ESC/E(Z) complex(GO:0035098) |
| 0.4 | 3.9 | GO:0035692 | macrophage migration inhibitory factor receptor complex(GO:0035692) |
| 0.3 | 3.2 | GO:0097550 | transcriptional preinitiation complex(GO:0097550) |
| 0.3 | 12.2 | GO:0005762 | organellar large ribosomal subunit(GO:0000315) mitochondrial large ribosomal subunit(GO:0005762) |
| 0.3 | 3.1 | GO:0035749 | myelin sheath adaxonal region(GO:0035749) |
| 0.3 | 6.5 | GO:0030122 | AP-2 adaptor complex(GO:0030122) |
| 0.3 | 6.5 | GO:0030056 | hemidesmosome(GO:0030056) |
| 0.3 | 1.1 | GO:0005873 | plus-end kinesin complex(GO:0005873) |
| 0.3 | 1.1 | GO:0005863 | striated muscle myosin thick filament(GO:0005863) |
| 0.3 | 14.4 | GO:1904115 | axon cytoplasm(GO:1904115) |
| 0.2 | 5.4 | GO:0005868 | cytoplasmic dynein complex(GO:0005868) |
| 0.2 | 6.5 | GO:0005921 | gap junction(GO:0005921) |
| 0.2 | 0.6 | GO:0018444 | translation release factor complex(GO:0018444) |
| 0.2 | 3.5 | GO:0000164 | protein phosphatase type 1 complex(GO:0000164) |
| 0.2 | 5.3 | GO:0000314 | organellar small ribosomal subunit(GO:0000314) mitochondrial small ribosomal subunit(GO:0005763) |
| 0.2 | 3.6 | GO:0005641 | nuclear envelope lumen(GO:0005641) |
| 0.2 | 9.6 | GO:0042571 | immunoglobulin complex, circulating(GO:0042571) |
| 0.2 | 1.6 | GO:0071144 | SMAD2-SMAD3 protein complex(GO:0071144) |
| 0.2 | 0.7 | GO:0035363 | histone locus body(GO:0035363) |
| 0.1 | 1.3 | GO:0002193 | MAML1-RBP-Jkappa- ICN1 complex(GO:0002193) |
| 0.1 | 2.9 | GO:0005666 | DNA-directed RNA polymerase III complex(GO:0005666) |
| 0.1 | 21.6 | GO:1904813 | ficolin-1-rich granule(GO:0101002) ficolin-1-rich granule lumen(GO:1904813) |
| 0.1 | 1.4 | GO:0031209 | SCAR complex(GO:0031209) |
| 0.1 | 3.2 | GO:0044322 | endoplasmic reticulum quality control compartment(GO:0044322) |
| 0.1 | 0.4 | GO:0071920 | cleavage body(GO:0071920) |
| 0.1 | 0.9 | GO:0097524 | sperm plasma membrane(GO:0097524) |
| 0.1 | 2.8 | GO:0016327 | apicolateral plasma membrane(GO:0016327) |
| 0.1 | 3.1 | GO:0031258 | lamellipodium membrane(GO:0031258) |
| 0.1 | 8.9 | GO:0005643 | nuclear pore(GO:0005643) |
| 0.1 | 1.9 | GO:0030669 | clathrin-coated endocytic vesicle membrane(GO:0030669) |
| 0.1 | 0.5 | GO:0005610 | laminin-5 complex(GO:0005610) |
| 0.1 | 0.8 | GO:0030127 | COPII vesicle coat(GO:0030127) |
| 0.1 | 3.3 | GO:0019005 | SCF ubiquitin ligase complex(GO:0019005) |
| 0.1 | 2.6 | GO:0045095 | keratin filament(GO:0045095) |
| 0.1 | 0.8 | GO:0008385 | IkappaB kinase complex(GO:0008385) |
| 0.1 | 2.6 | GO:0008180 | COP9 signalosome(GO:0008180) |
| 0.1 | 0.8 | GO:0030140 | trans-Golgi network transport vesicle(GO:0030140) |
| 0.1 | 5.5 | GO:0035578 | azurophil granule lumen(GO:0035578) |
| 0.1 | 1.0 | GO:0031527 | filopodium membrane(GO:0031527) |
| 0.1 | 5.0 | GO:0031594 | neuromuscular junction(GO:0031594) |
| 0.1 | 2.9 | GO:0031463 | Cul3-RING ubiquitin ligase complex(GO:0031463) |
| 0.1 | 3.2 | GO:0005771 | multivesicular body(GO:0005771) |
| 0.0 | 0.6 | GO:0045254 | pyruvate dehydrogenase complex(GO:0045254) |
| 0.0 | 23.4 | GO:0010008 | endosome membrane(GO:0010008) |
| 0.0 | 4.2 | GO:0022625 | cytosolic large ribosomal subunit(GO:0022625) |
| 0.0 | 6.5 | GO:0000151 | ubiquitin ligase complex(GO:0000151) |
| 0.0 | 3.2 | GO:0031903 | peroxisomal membrane(GO:0005778) microbody membrane(GO:0031903) |
| 0.0 | 0.3 | GO:0030688 | preribosome, small subunit precursor(GO:0030688) |
| 0.0 | 13.5 | GO:0005874 | microtubule(GO:0005874) |
| 0.0 | 3.6 | GO:0071013 | catalytic step 2 spliceosome(GO:0071013) |
| 0.0 | 0.8 | GO:0032040 | small-subunit processome(GO:0032040) |
| 0.0 | 1.9 | GO:0022627 | cytosolic small ribosomal subunit(GO:0022627) |
| 0.0 | 1.9 | GO:0005834 | heterotrimeric G-protein complex(GO:0005834) |
| 0.0 | 12.2 | GO:0030529 | intracellular ribonucleoprotein complex(GO:0030529) |
| 0.0 | 0.8 | GO:0032592 | integral component of mitochondrial membrane(GO:0032592) |
| 0.0 | 1.6 | GO:0005923 | bicellular tight junction(GO:0005923) |
| 0.0 | 0.1 | GO:0031314 | extrinsic component of mitochondrial inner membrane(GO:0031314) |
| 0.0 | 1.8 | GO:0005769 | early endosome(GO:0005769) |
Gene overrepresentation in molecular function category:
| Log-likelihood per target | Total log-likelihood | Term | Description |
|---|---|---|---|
| 5.5 | 27.3 | GO:0019834 | phospholipase A2 inhibitor activity(GO:0019834) |
| 4.6 | 18.4 | GO:0004743 | pyruvate kinase activity(GO:0004743) |
| 2.8 | 16.5 | GO:0030942 | endoplasmic reticulum signal peptide binding(GO:0030942) |
| 2.0 | 9.9 | GO:0004337 | dimethylallyltranstransferase activity(GO:0004161) geranyltranstransferase activity(GO:0004337) |
| 1.9 | 43.0 | GO:0051371 | muscle alpha-actinin binding(GO:0051371) |
| 1.5 | 4.5 | GO:0008466 | glycogenin glucosyltransferase activity(GO:0008466) |
| 1.4 | 6.8 | GO:0042296 | ISG15 transferase activity(GO:0042296) |
| 1.2 | 4.9 | GO:0003923 | GPI-anchor transamidase activity(GO:0003923) |
| 1.1 | 5.5 | GO:0016936 | galactoside binding(GO:0016936) |
| 0.9 | 13.3 | GO:0016846 | carbon-sulfur lyase activity(GO:0016846) |
| 0.9 | 7.1 | GO:0004111 | creatine kinase activity(GO:0004111) |
| 0.9 | 3.5 | GO:1990430 | extracellular matrix protein binding(GO:1990430) |
| 0.8 | 2.4 | GO:0035529 | NADH pyrophosphatase activity(GO:0035529) |
| 0.8 | 5.3 | GO:0034513 | box H/ACA snoRNA binding(GO:0034513) |
| 0.7 | 29.7 | GO:0004198 | calcium-dependent cysteine-type endopeptidase activity(GO:0004198) |
| 0.7 | 2.1 | GO:0004357 | glutamate-cysteine ligase activity(GO:0004357) |
| 0.7 | 31.6 | GO:0061631 | ubiquitin conjugating enzyme activity(GO:0061631) |
| 0.6 | 12.6 | GO:0008603 | cAMP-dependent protein kinase regulator activity(GO:0008603) |
| 0.6 | 3.5 | GO:0071074 | eukaryotic initiation factor eIF2 binding(GO:0071074) |
| 0.6 | 2.8 | GO:0008113 | peptide-methionine (S)-S-oxide reductase activity(GO:0008113) |
| 0.6 | 6.6 | GO:0015266 | protein channel activity(GO:0015266) |
| 0.5 | 2.7 | GO:1990460 | leptin receptor binding(GO:1990460) |
| 0.5 | 2.2 | GO:0016524 | latrotoxin receptor activity(GO:0016524) |
| 0.5 | 3.6 | GO:0010858 | calcium-dependent protein kinase regulator activity(GO:0010858) |
| 0.4 | 2.2 | GO:1990254 | keratin filament binding(GO:1990254) |
| 0.4 | 24.7 | GO:0051879 | Hsp90 protein binding(GO:0051879) |
| 0.4 | 3.2 | GO:0004571 | mannosyl-oligosaccharide 1,2-alpha-mannosidase activity(GO:0004571) |
| 0.4 | 3.1 | GO:0003726 | double-stranded RNA adenosine deaminase activity(GO:0003726) |
| 0.4 | 4.4 | GO:0015194 | L-serine transmembrane transporter activity(GO:0015194) serine transmembrane transporter activity(GO:0022889) |
| 0.3 | 3.4 | GO:0030292 | protein tyrosine kinase inhibitor activity(GO:0030292) |
| 0.3 | 9.2 | GO:0070628 | proteasome binding(GO:0070628) |
| 0.3 | 6.5 | GO:0005522 | profilin binding(GO:0005522) |
| 0.3 | 5.6 | GO:0019871 | sodium channel inhibitor activity(GO:0019871) |
| 0.3 | 6.5 | GO:0035615 | clathrin adaptor activity(GO:0035615) endocytic adaptor activity(GO:0098748) |
| 0.3 | 0.8 | GO:0004618 | phosphoglycerate kinase activity(GO:0004618) |
| 0.3 | 6.0 | GO:0052629 | phosphatidylinositol-3,5-bisphosphate 3-phosphatase activity(GO:0052629) |
| 0.3 | 1.6 | GO:0031962 | mineralocorticoid receptor binding(GO:0031962) |
| 0.3 | 1.0 | GO:0005412 | glucose:sodium symporter activity(GO:0005412) |
| 0.3 | 6.9 | GO:0004029 | aldehyde dehydrogenase (NAD) activity(GO:0004029) |
| 0.2 | 3.5 | GO:0046790 | virion binding(GO:0046790) |
| 0.2 | 2.6 | GO:1990825 | sequence-specific mRNA binding(GO:1990825) |
| 0.2 | 3.9 | GO:0005176 | ErbB-2 class receptor binding(GO:0005176) |
| 0.2 | 1.1 | GO:0004558 | alpha-1,4-glucosidase activity(GO:0004558) |
| 0.2 | 3.4 | GO:0017128 | phospholipid scramblase activity(GO:0017128) |
| 0.2 | 8.0 | GO:0070840 | dynein complex binding(GO:0070840) |
| 0.2 | 8.9 | GO:0000049 | tRNA binding(GO:0000049) |
| 0.2 | 1.9 | GO:0070181 | small ribosomal subunit rRNA binding(GO:0070181) |
| 0.2 | 1.0 | GO:0004666 | prostaglandin-endoperoxide synthase activity(GO:0004666) |
| 0.2 | 2.6 | GO:0045504 | dynein heavy chain binding(GO:0045504) |
| 0.2 | 9.3 | GO:0004003 | ATP-dependent DNA helicase activity(GO:0004003) |
| 0.2 | 8.8 | GO:0004385 | guanylate kinase activity(GO:0004385) |
| 0.2 | 8.2 | GO:0004407 | histone deacetylase activity(GO:0004407) |
| 0.2 | 3.6 | GO:0032794 | GTPase activating protein binding(GO:0032794) |
| 0.2 | 10.0 | GO:0005080 | protein kinase C binding(GO:0005080) |
| 0.2 | 1.3 | GO:0098639 | collagen binding involved in cell-matrix adhesion(GO:0098639) |
| 0.2 | 2.7 | GO:0030215 | semaphorin receptor binding(GO:0030215) |
| 0.2 | 5.8 | GO:0044183 | protein binding involved in protein folding(GO:0044183) |
| 0.2 | 9.6 | GO:0034987 | immunoglobulin receptor binding(GO:0034987) |
| 0.2 | 2.9 | GO:0051430 | mu-type opioid receptor binding(GO:0031852) corticotropin-releasing hormone receptor binding(GO:0051429) corticotropin-releasing hormone receptor 1 binding(GO:0051430) |
| 0.1 | 0.6 | GO:0004739 | pyruvate dehydrogenase (acetyl-transferring) activity(GO:0004739) |
| 0.1 | 5.0 | GO:0016922 | ligand-dependent nuclear receptor binding(GO:0016922) |
| 0.1 | 1.4 | GO:0050700 | CARD domain binding(GO:0050700) |
| 0.1 | 1.0 | GO:0060002 | plus-end directed microfilament motor activity(GO:0060002) |
| 0.1 | 18.7 | GO:0003697 | single-stranded DNA binding(GO:0003697) |
| 0.1 | 2.4 | GO:0051537 | 2 iron, 2 sulfur cluster binding(GO:0051537) |
| 0.1 | 21.7 | GO:0003735 | structural constituent of ribosome(GO:0003735) |
| 0.1 | 0.6 | GO:0008079 | translation release factor activity(GO:0003747) translation termination factor activity(GO:0008079) |
| 0.1 | 2.4 | GO:0043325 | phosphatidylinositol-3,4-bisphosphate binding(GO:0043325) |
| 0.1 | 25.5 | GO:0003729 | mRNA binding(GO:0003729) poly(A) RNA binding(GO:0044822) |
| 0.1 | 10.9 | GO:0043130 | ubiquitin binding(GO:0043130) |
| 0.1 | 2.2 | GO:0042813 | Wnt-activated receptor activity(GO:0042813) |
| 0.1 | 4.6 | GO:0017112 | Rab guanyl-nucleotide exchange factor activity(GO:0017112) |
| 0.1 | 3.2 | GO:0046966 | thyroid hormone receptor binding(GO:0046966) |
| 0.1 | 4.0 | GO:0008138 | protein tyrosine/serine/threonine phosphatase activity(GO:0008138) |
| 0.1 | 2.3 | GO:0005540 | hyaluronic acid binding(GO:0005540) |
| 0.1 | 0.2 | GO:0003973 | (S)-2-hydroxy-acid oxidase activity(GO:0003973) oxidoreductase activity, acting on the CH-OH group of donors, oxygen as acceptor(GO:0016899) very-long-chain-(S)-2-hydroxy-acid oxidase activity(GO:0052852) long-chain-(S)-2-hydroxy-long-chain-acid oxidase activity(GO:0052853) medium-chain-(S)-2-hydroxy-acid oxidase activity(GO:0052854) |
| 0.1 | 0.9 | GO:0047372 | acylglycerol lipase activity(GO:0047372) |
| 0.1 | 0.2 | GO:0008511 | sodium:potassium:chloride symporter activity(GO:0008511) |
| 0.0 | 3.0 | GO:0004112 | cyclic-nucleotide phosphodiesterase activity(GO:0004112) |
| 0.0 | 1.4 | GO:0015347 | sodium-independent organic anion transmembrane transporter activity(GO:0015347) |
| 0.0 | 0.5 | GO:0033038 | bitter taste receptor activity(GO:0033038) |
| 0.0 | 1.9 | GO:0005154 | epidermal growth factor receptor binding(GO:0005154) |
| 0.0 | 0.7 | GO:0001011 | transcription factor activity, sequence-specific DNA binding, RNA polymerase recruiting(GO:0001011) transcription factor activity, TFIIB-class binding(GO:0001087) |
| 0.0 | 0.5 | GO:0015250 | water channel activity(GO:0015250) |
| 0.0 | 0.3 | GO:0089720 | caspase binding(GO:0089720) |
| 0.0 | 0.8 | GO:0005123 | death receptor binding(GO:0005123) |
| 0.0 | 1.8 | GO:0005507 | copper ion binding(GO:0005507) |
| 0.0 | 0.8 | GO:0004709 | MAP kinase kinase kinase activity(GO:0004709) |
| 0.0 | 0.8 | GO:0015020 | glucuronosyltransferase activity(GO:0015020) |
| 0.0 | 6.6 | GO:0005516 | calmodulin binding(GO:0005516) |
| 0.0 | 1.4 | GO:0048365 | Rac GTPase binding(GO:0048365) |
| 0.0 | 7.8 | GO:0016887 | ATPase activity(GO:0016887) |
| 0.0 | 1.8 | GO:0001158 | enhancer sequence-specific DNA binding(GO:0001158) |
| 0.0 | 0.2 | GO:0045028 | G-protein coupled nucleotide receptor activity(GO:0001608) G-protein coupled purinergic nucleotide receptor activity(GO:0045028) |
Gene overrepresentation in curated gene sets: canonical pathways category:
| Log-likelihood per target | Total log-likelihood | Term | Description |
|---|---|---|---|
| 0.9 | 44.1 | PID BARD1 PATHWAY | BARD1 signaling events |
| 0.6 | 14.4 | PID HIF1A PATHWAY | Hypoxic and oxygen homeostasis regulation of HIF-1-alpha |
| 0.3 | 11.9 | PID SMAD2 3PATHWAY | Regulation of cytoplasmic and nuclear SMAD2/3 signaling |
| 0.2 | 13.9 | PID INTEGRIN A4B1 PATHWAY | Alpha4 beta1 integrin signaling events |
| 0.2 | 8.1 | PID NCADHERIN PATHWAY | N-cadherin signaling events |
| 0.2 | 7.4 | PID AVB3 OPN PATHWAY | Osteopontin-mediated events |
| 0.2 | 10.6 | PID EPHB FWD PATHWAY | EPHB forward signaling |
| 0.1 | 13.1 | PID TRKR PATHWAY | Neurotrophic factor-mediated Trk receptor signaling |
| 0.1 | 3.9 | PID PRL SIGNALING EVENTS PATHWAY | Signaling events mediated by PRL |
| 0.1 | 22.2 | NABA ECM AFFILIATED | Genes encoding proteins affiliated structurally or functionally to extracellular matrix proteins |
| 0.1 | 3.5 | PID ERBB1 INTERNALIZATION PATHWAY | Internalization of ErbB1 |
| 0.1 | 8.2 | PID TELOMERASE PATHWAY | Regulation of Telomerase |
| 0.1 | 2.9 | PID TOLL ENDOGENOUS PATHWAY | Endogenous TLR signaling |
| 0.1 | 4.6 | PID MET PATHWAY | Signaling events mediated by Hepatocyte Growth Factor Receptor (c-Met) |
| 0.1 | 2.8 | PID WNT SIGNALING PATHWAY | Wnt signaling network |
| 0.1 | 2.2 | PID INSULIN GLUCOSE PATHWAY | Insulin-mediated glucose transport |
| 0.1 | 4.2 | PID BCR 5PATHWAY | BCR signaling pathway |
| 0.1 | 3.3 | PID FOXM1 PATHWAY | FOXM1 transcription factor network |
| 0.1 | 1.9 | PID ERBB NETWORK PATHWAY | ErbB receptor signaling network |
| 0.1 | 2.6 | NABA COLLAGENS | Genes encoding collagen proteins |
| 0.1 | 1.4 | PID IL1 PATHWAY | IL1-mediated signaling events |
| 0.0 | 3.2 | PID RAC1 PATHWAY | RAC1 signaling pathway |
| 0.0 | 2.2 | PID DELTA NP63 PATHWAY | Validated transcriptional targets of deltaNp63 isoforms |
| 0.0 | 1.0 | PID NETRIN PATHWAY | Netrin-mediated signaling events |
| 0.0 | 1.3 | PID KIT PATHWAY | Signaling events mediated by Stem cell factor receptor (c-Kit) |
| 0.0 | 0.8 | PID ATM PATHWAY | ATM pathway |
| 0.0 | 1.3 | PID HES HEY PATHWAY | Notch-mediated HES/HEY network |
| 0.0 | 0.8 | PID HIF2PATHWAY | HIF-2-alpha transcription factor network |
| 0.0 | 0.9 | PID CDC42 REG PATHWAY | Regulation of CDC42 activity |
| 0.0 | 0.7 | PID RXR VDR PATHWAY | RXR and RAR heterodimerization with other nuclear receptor |
| 0.0 | 0.5 | PID SYNDECAN 2 PATHWAY | Syndecan-2-mediated signaling events |
Gene overrepresentation in curated gene sets: REACTOME pathways category:
| Log-likelihood per target | Total log-likelihood | Term | Description |
|---|---|---|---|
| 1.3 | 46.0 | REACTOME OXYGEN DEPENDENT PROLINE HYDROXYLATION OF HYPOXIA INDUCIBLE FACTOR ALPHA | Genes involved in Oxygen-dependent Proline Hydroxylation of Hypoxia-inducible Factor Alpha |
| 0.9 | 14.0 | REACTOME APOPTOSIS INDUCED DNA FRAGMENTATION | Genes involved in Apoptosis induced DNA fragmentation |
| 0.8 | 10.0 | REACTOME REGULATION OF INSULIN SECRETION BY ACETYLCHOLINE | Genes involved in Regulation of Insulin Secretion by Acetylcholine |
| 0.5 | 3.5 | REACTOME MEMBRANE BINDING AND TARGETTING OF GAG PROTEINS | Genes involved in Membrane binding and targetting of GAG proteins |
| 0.5 | 12.5 | REACTOME HOMOLOGOUS RECOMBINATION REPAIR OF REPLICATION INDEPENDENT DOUBLE STRAND BREAKS | Genes involved in Homologous recombination repair of replication-independent double-strand breaks |
| 0.4 | 10.6 | REACTOME SIGNALING BY HIPPO | Genes involved in Signaling by Hippo |
| 0.4 | 6.0 | REACTOME SYNTHESIS OF PIPS AT THE LATE ENDOSOME MEMBRANE | Genes involved in Synthesis of PIPs at the late endosome membrane |
| 0.4 | 8.2 | REACTOME DEPOSITION OF NEW CENPA CONTAINING NUCLEOSOMES AT THE CENTROMERE | Genes involved in Deposition of New CENPA-containing Nucleosomes at the Centromere |
| 0.4 | 11.2 | REACTOME PKA MEDIATED PHOSPHORYLATION OF CREB | Genes involved in PKA-mediated phosphorylation of CREB |
| 0.3 | 10.5 | REACTOME FORMATION OF TUBULIN FOLDING INTERMEDIATES BY CCT TRIC | Genes involved in Formation of tubulin folding intermediates by CCT/TriC |
| 0.3 | 6.5 | REACTOME TRAFFICKING OF GLUR2 CONTAINING AMPA RECEPTORS | Genes involved in Trafficking of GluR2-containing AMPA receptors |
| 0.2 | 9.9 | REACTOME CHOLESTEROL BIOSYNTHESIS | Genes involved in Cholesterol biosynthesis |
| 0.2 | 3.5 | REACTOME SLBP DEPENDENT PROCESSING OF REPLICATION DEPENDENT HISTONE PRE MRNAS | Genes involved in SLBP Dependent Processing of Replication-Dependent Histone Pre-mRNAs |
| 0.2 | 20.6 | REACTOME APC C CDH1 MEDIATED DEGRADATION OF CDC20 AND OTHER APC C CDH1 TARGETED PROTEINS IN LATE MITOSIS EARLY G1 | Genes involved in APC/C:Cdh1 mediated degradation of Cdc20 and other APC/C:Cdh1 targeted proteins in late mitosis/early G1 |
| 0.2 | 3.2 | REACTOME CALNEXIN CALRETICULIN CYCLE | Genes involved in Calnexin/calreticulin cycle |
| 0.2 | 3.5 | REACTOME PECAM1 INTERACTIONS | Genes involved in PECAM1 interactions |
| 0.2 | 4.5 | REACTOME GLYCOGEN BREAKDOWN GLYCOGENOLYSIS | Genes involved in Glycogen breakdown (glycogenolysis) |
| 0.2 | 3.9 | REACTOME HYALURONAN UPTAKE AND DEGRADATION | Genes involved in Hyaluronan uptake and degradation |
| 0.1 | 4.9 | REACTOME POST TRANSLATIONAL MODIFICATION SYNTHESIS OF GPI ANCHORED PROTEINS | Genes involved in Post-translational modification: synthesis of GPI-anchored proteins |
| 0.1 | 11.7 | REACTOME LOSS OF NLP FROM MITOTIC CENTROSOMES | Genes involved in Loss of Nlp from mitotic centrosomes |
| 0.1 | 3.5 | REACTOME ACTIVATION OF RAC | Genes involved in Activation of Rac |
| 0.1 | 22.6 | REACTOME SRP DEPENDENT COTRANSLATIONAL PROTEIN TARGETING TO MEMBRANE | Genes involved in SRP-dependent cotranslational protein targeting to membrane |
| 0.1 | 0.8 | REACTOME IRAK2 MEDIATED ACTIVATION OF TAK1 COMPLEX UPON TLR7 8 OR 9 STIMULATION | Genes involved in IRAK2 mediated activation of TAK1 complex upon TLR7/8 or 9 stimulation |
| 0.1 | 6.6 | REACTOME MITOCHONDRIAL PROTEIN IMPORT | Genes involved in Mitochondrial Protein Import |
| 0.1 | 5.5 | REACTOME GLYCOSPHINGOLIPID METABOLISM | Genes involved in Glycosphingolipid metabolism |
| 0.1 | 1.3 | REACTOME PLATELET ADHESION TO EXPOSED COLLAGEN | Genes involved in Platelet Adhesion to exposed collagen |
| 0.1 | 3.2 | REACTOME RNA POL II TRANSCRIPTION PRE INITIATION AND PROMOTER OPENING | Genes involved in RNA Polymerase II Transcription Pre-Initiation And Promoter Opening |
| 0.1 | 1.1 | REACTOME DIGESTION OF DIETARY CARBOHYDRATE | Genes involved in Digestion of dietary carbohydrate |
| 0.1 | 12.9 | REACTOME MRNA SPLICING | Genes involved in mRNA Splicing |
| 0.1 | 2.9 | REACTOME GLUCAGON SIGNALING IN METABOLIC REGULATION | Genes involved in Glucagon signaling in metabolic regulation |
| 0.1 | 1.4 | REACTOME THE NLRP3 INFLAMMASOME | Genes involved in The NLRP3 inflammasome |
| 0.1 | 1.4 | REACTOME TRANSPORT OF ORGANIC ANIONS | Genes involved in Transport of organic anions |
| 0.1 | 1.3 | REACTOME NOTCH HLH TRANSCRIPTION PATHWAY | Genes involved in Notch-HLH transcription pathway |
| 0.1 | 2.1 | REACTOME SULFUR AMINO ACID METABOLISM | Genes involved in Sulfur amino acid metabolism |
| 0.1 | 3.1 | REACTOME MRNA PROCESSING | Genes involved in mRNA Processing |
| 0.1 | 1.9 | REACTOME SHC1 EVENTS IN ERBB4 SIGNALING | Genes involved in SHC1 events in ERBB4 signaling |
| 0.0 | 1.6 | REACTOME DOWNREGULATION OF SMAD2 3 SMAD4 TRANSCRIPTIONAL ACTIVITY | Genes involved in Downregulation of SMAD2/3:SMAD4 transcriptional activity |
| 0.0 | 0.8 | REACTOME ACTIVATION OF BH3 ONLY PROTEINS | Genes involved in Activation of BH3-only proteins |
| 0.0 | 1.1 | REACTOME KINESINS | Genes involved in Kinesins |
| 0.0 | 0.5 | REACTOME PASSIVE TRANSPORT BY AQUAPORINS | Genes involved in Passive Transport by Aquaporins |
| 0.0 | 2.6 | REACTOME COLLAGEN FORMATION | Genes involved in Collagen formation |
| 0.0 | 0.6 | REACTOME REGULATION OF PYRUVATE DEHYDROGENASE PDH COMPLEX | Genes involved in Regulation of pyruvate dehydrogenase (PDH) complex |
| 0.0 | 0.8 | REACTOME GLUCURONIDATION | Genes involved in Glucuronidation |
| 0.0 | 2.4 | REACTOME RESPIRATORY ELECTRON TRANSPORT | Genes involved in Respiratory electron transport |
| 0.0 | 0.7 | REACTOME CIRCADIAN REPRESSION OF EXPRESSION BY REV ERBA | Genes involved in Circadian Repression of Expression by REV-ERBA |
| 0.0 | 1.0 | REACTOME NETRIN1 SIGNALING | Genes involved in Netrin-1 signaling |
| 0.0 | 0.6 | REACTOME NONSENSE MEDIATED DECAY ENHANCED BY THE EXON JUNCTION COMPLEX | Genes involved in Nonsense Mediated Decay Enhanced by the Exon Junction Complex |
| 0.0 | 0.8 | REACTOME GLUCONEOGENESIS | Genes involved in Gluconeogenesis |