Project
GNF SymAtlas + NCI-60 cancer cell lines, human (Su, 2004; Ross, 2000)
Navigation
Downloads
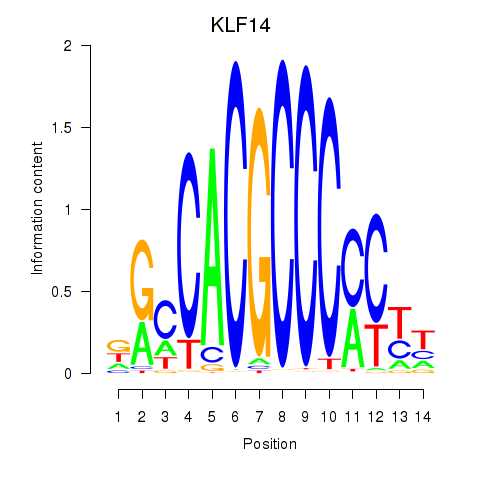
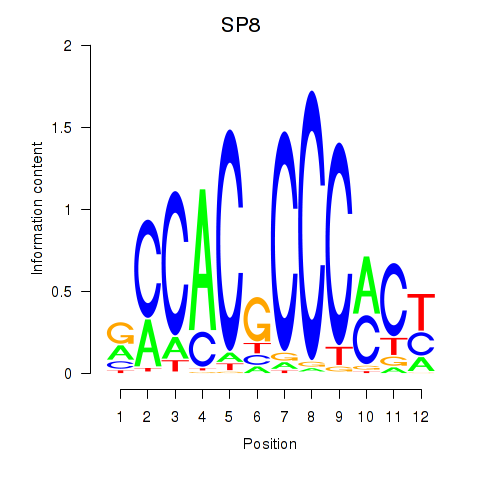
Results for KLF14_SP8
Z-value: 1.70
Motif logo
Transcription factors associated with KLF14_SP8
| Gene Symbol | Gene ID | Gene Info |
|---|---|---|
|
KLF14
|
ENSG00000266265.4 | KLF14 |
|
SP8
|
ENSG00000164651.17 | SP8 |
Activity profile of KLF14_SP8 motif
Sorted Z-values of KLF14_SP8 motif
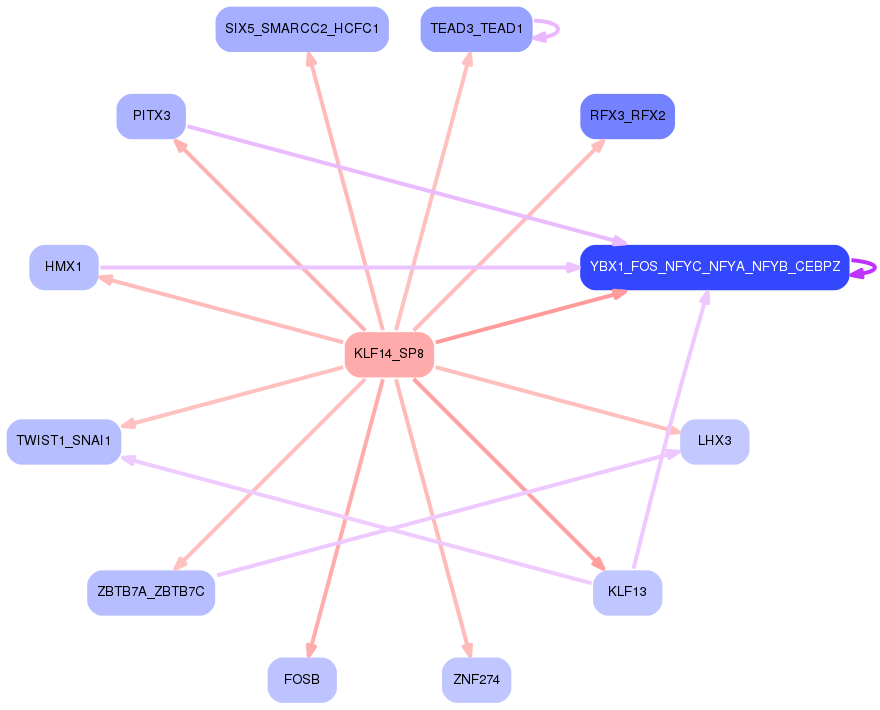
Network of associatons between targets according to the STRING database.

First level regulatory network of KLF14_SP8
Gene Ontology Analysis
Gene overrepresentation in biological process category:
| Log-likelihood per target | Total log-likelihood | Term | Description |
|---|---|---|---|
| 8.3 | 24.9 | GO:0070845 | misfolded protein transport(GO:0070843) polyubiquitinated protein transport(GO:0070844) polyubiquitinated misfolded protein transport(GO:0070845) Hsp90 deacetylation(GO:0070846) |
| 7.9 | 23.7 | GO:0006210 | pyrimidine nucleobase catabolic process(GO:0006208) thymine catabolic process(GO:0006210) thymine metabolic process(GO:0019859) |
| 6.6 | 53.2 | GO:0006384 | transcription initiation from RNA polymerase III promoter(GO:0006384) |
| 6.4 | 25.6 | GO:1904980 | positive regulation of endosome organization(GO:1904980) |
| 6.1 | 36.8 | GO:0016926 | protein desumoylation(GO:0016926) |
| 6.0 | 42.1 | GO:1904100 | regulation of protein O-linked glycosylation(GO:1904098) positive regulation of protein O-linked glycosylation(GO:1904100) |
| 5.9 | 5.9 | GO:0050666 | regulation of sulfur amino acid metabolic process(GO:0031335) regulation of homocysteine metabolic process(GO:0050666) |
| 5.8 | 17.3 | GO:0060152 | peroxisome localization(GO:0060151) microtubule-based peroxisome localization(GO:0060152) |
| 5.7 | 17.2 | GO:0055048 | regulation of spindle elongation(GO:0032887) regulation of mitotic spindle elongation(GO:0032888) anastral spindle assembly(GO:0055048) protein localization to spindle pole body(GO:0071988) regulation of protein localization to spindle pole body(GO:1902363) positive regulation of protein localization to spindle pole body(GO:1902365) positive regulation of mitotic spindle elongation(GO:1902846) |
| 5.2 | 15.5 | GO:2001151 | regulation of renal water transport(GO:2001151) positive regulation of renal water transport(GO:2001153) |
| 5.2 | 15.5 | GO:1902595 | regulation of DNA replication origin binding(GO:1902595) |
| 5.1 | 96.8 | GO:0019614 | catechol-containing compound catabolic process(GO:0019614) catecholamine catabolic process(GO:0042424) |
| 4.9 | 19.6 | GO:0099558 | maintenance of synapse structure(GO:0099558) |
| 4.8 | 14.4 | GO:2000777 | positive regulation of proteasomal ubiquitin-dependent protein catabolic process involved in cellular response to hypoxia(GO:2000777) |
| 4.8 | 14.3 | GO:1904933 | regulation of cell proliferation in midbrain(GO:1904933) |
| 4.7 | 18.6 | GO:0048496 | maintenance of organ identity(GO:0048496) |
| 4.6 | 18.5 | GO:0090299 | fibroblast growth factor receptor signaling pathway involved in neural plate anterior/posterior pattern formation(GO:0060825) regulation of neural crest formation(GO:0090299) negative regulation of neural crest formation(GO:0090301) regulation of fibroblast growth factor receptor signaling pathway involved in neural plate anterior/posterior pattern formation(GO:2000313) negative regulation of fibroblast growth factor receptor signaling pathway involved in neural plate anterior/posterior pattern formation(GO:2000314) |
| 4.6 | 13.7 | GO:0009386 | translational attenuation(GO:0009386) |
| 4.5 | 22.7 | GO:0006432 | phenylalanyl-tRNA aminoacylation(GO:0006432) |
| 4.5 | 18.0 | GO:0006669 | sphinganine-1-phosphate biosynthetic process(GO:0006669) |
| 4.4 | 22.1 | GO:0046167 | glycerol-3-phosphate biosynthetic process(GO:0046167) |
| 4.3 | 13.0 | GO:1903383 | neuron intrinsic apoptotic signaling pathway in response to hydrogen peroxide(GO:0036482) positive regulation of mitochondrial electron transport, NADH to ubiquinone(GO:1902958) regulation of hydrogen peroxide-induced neuron intrinsic apoptotic signaling pathway(GO:1903383) negative regulation of hydrogen peroxide-induced neuron intrinsic apoptotic signaling pathway(GO:1903384) |
| 4.3 | 73.7 | GO:1903830 | magnesium ion transmembrane transport(GO:1903830) |
| 4.1 | 4.1 | GO:0035470 | positive regulation of vascular wound healing(GO:0035470) |
| 4.1 | 28.5 | GO:0042271 | susceptibility to natural killer cell mediated cytotoxicity(GO:0042271) |
| 3.9 | 19.7 | GO:0071494 | cellular response to UV-C(GO:0071494) |
| 3.9 | 11.8 | GO:0002416 | IgG immunoglobulin transcytosis in epithelial cells mediated by FcRn immunoglobulin receptor(GO:0002416) |
| 3.9 | 11.6 | GO:0072365 | regulation of cellular ketone metabolic process by negative regulation of transcription from RNA polymerase II promoter(GO:0072365) |
| 3.8 | 30.3 | GO:0000160 | phosphorelay signal transduction system(GO:0000160) |
| 3.7 | 11.2 | GO:0036292 | DNA rewinding(GO:0036292) |
| 3.7 | 11.2 | GO:0060032 | notochord regression(GO:0060032) |
| 3.7 | 14.8 | GO:0044828 | negative regulation by host of viral genome replication(GO:0044828) |
| 3.7 | 11.1 | GO:1903892 | negative regulation of ATF6-mediated unfolded protein response(GO:1903892) |
| 3.7 | 14.7 | GO:0070426 | positive regulation of nucleotide-binding oligomerization domain containing signaling pathway(GO:0070426) positive regulation of nucleotide-binding oligomerization domain containing 2 signaling pathway(GO:0070434) |
| 3.6 | 10.8 | GO:0038162 | erythropoietin-mediated signaling pathway(GO:0038162) |
| 3.6 | 14.3 | GO:1903984 | regulation of TRAIL-activated apoptotic signaling pathway(GO:1903121) positive regulation of TRAIL-activated apoptotic signaling pathway(GO:1903984) |
| 3.5 | 10.6 | GO:0035691 | macrophage migration inhibitory factor signaling pathway(GO:0035691) |
| 3.5 | 59.8 | GO:0007130 | synaptonemal complex assembly(GO:0007130) |
| 3.5 | 10.6 | GO:0090038 | negative regulation of protein kinase C signaling(GO:0090038) |
| 3.5 | 13.9 | GO:0006663 | platelet activating factor biosynthetic process(GO:0006663) |
| 3.5 | 13.9 | GO:2000327 | regulation of ligand-dependent nuclear receptor transcription coactivator activity(GO:2000325) positive regulation of ligand-dependent nuclear receptor transcription coactivator activity(GO:2000327) |
| 3.4 | 10.3 | GO:0060903 | positive regulation of meiosis I(GO:0060903) |
| 3.4 | 6.9 | GO:0060800 | regulation of cell differentiation involved in embryonic placenta development(GO:0060800) |
| 3.4 | 10.2 | GO:0019046 | release from viral latency(GO:0019046) |
| 3.4 | 13.5 | GO:2000686 | regulation of rubidium ion transmembrane transporter activity(GO:2000686) |
| 3.3 | 9.9 | GO:1990168 | protein K33-linked deubiquitination(GO:1990168) |
| 3.2 | 9.7 | GO:1990166 | protein localization to site of double-strand break(GO:1990166) |
| 3.1 | 12.5 | GO:0021814 | cell motility involved in cerebral cortex radial glia guided migration(GO:0021814) modulation of microtubule cytoskeleton involved in cerebral cortex radial glia guided migration(GO:0021815) |
| 3.1 | 12.4 | GO:1900169 | regulation of glucocorticoid mediated signaling pathway(GO:1900169) |
| 3.0 | 9.1 | GO:1904692 | positive regulation of type B pancreatic cell proliferation(GO:1904692) |
| 3.0 | 17.8 | GO:0070829 | response to vitamin B2(GO:0033274) heterochromatin maintenance(GO:0070829) |
| 2.9 | 8.7 | GO:0008065 | establishment of blood-nerve barrier(GO:0008065) |
| 2.9 | 14.4 | GO:0006041 | glucosamine metabolic process(GO:0006041) |
| 2.9 | 14.3 | GO:1990164 | histone H3-S28 phosphorylation(GO:0043988) histone H2A phosphorylation(GO:1990164) |
| 2.8 | 14.2 | GO:0034721 | histone H3-K4 demethylation, trimethyl-H3-K4-specific(GO:0034721) |
| 2.8 | 11.2 | GO:0015910 | peroxisomal long-chain fatty acid import(GO:0015910) |
| 2.8 | 5.6 | GO:0001743 | optic placode formation(GO:0001743) |
| 2.8 | 24.8 | GO:2000286 | receptor internalization involved in canonical Wnt signaling pathway(GO:2000286) |
| 2.7 | 19.1 | GO:0090166 | Golgi disassembly(GO:0090166) |
| 2.7 | 18.9 | GO:0070127 | tRNA aminoacylation for mitochondrial protein translation(GO:0070127) |
| 2.7 | 10.7 | GO:0021707 | cerebellar granular layer formation(GO:0021684) cerebellar granule cell differentiation(GO:0021707) |
| 2.6 | 15.6 | GO:0022027 | interkinetic nuclear migration(GO:0022027) |
| 2.6 | 7.7 | GO:0046416 | D-amino acid metabolic process(GO:0046416) |
| 2.5 | 17.8 | GO:0006003 | fructose 2,6-bisphosphate metabolic process(GO:0006003) |
| 2.5 | 7.6 | GO:1904742 | negative regulation of maintenance of sister chromatid cohesion(GO:0034092) negative regulation of maintenance of mitotic sister chromatid cohesion(GO:0034183) protein auto-ADP-ribosylation(GO:0070213) maintenance of mitotic sister chromatid cohesion, telomeric(GO:0099403) mitotic sister chromatid cohesion, telomeric(GO:0099404) regulation of telomeric DNA binding(GO:1904742) regulation of maintenance of mitotic sister chromatid cohesion, telomeric(GO:1904907) negative regulation of maintenance of mitotic sister chromatid cohesion, telomeric(GO:1904908) |
| 2.5 | 15.1 | GO:0038016 | insulin receptor internalization(GO:0038016) |
| 2.4 | 9.7 | GO:0018125 | peptidyl-cysteine methylation(GO:0018125) |
| 2.4 | 12.1 | GO:0016560 | protein import into peroxisome matrix, docking(GO:0016560) |
| 2.4 | 7.2 | GO:2001302 | cellular response to interleukin-13(GO:0035963) regulation of engulfment of apoptotic cell(GO:1901074) lipoxin biosynthetic process(GO:2001301) lipoxin A4 metabolic process(GO:2001302) lipoxin A4 biosynthetic process(GO:2001303) |
| 2.4 | 9.6 | GO:0061086 | negative regulation of histone H3-K27 methylation(GO:0061086) |
| 2.3 | 9.4 | GO:2001034 | positive regulation of double-strand break repair via nonhomologous end joining(GO:2001034) |
| 2.3 | 20.7 | GO:0098535 | de novo centriole assembly(GO:0098535) |
| 2.3 | 6.9 | GO:0038193 | thromboxane A2 signaling pathway(GO:0038193) |
| 2.3 | 11.3 | GO:1904059 | regulation of locomotor rhythm(GO:1904059) |
| 2.1 | 12.7 | GO:0060414 | aorta smooth muscle tissue morphogenesis(GO:0060414) |
| 2.1 | 6.3 | GO:0043553 | negative regulation of phosphatidylinositol 3-kinase activity(GO:0043553) negative regulation of autophagosome maturation(GO:1901097) |
| 2.1 | 10.5 | GO:0071896 | protein localization to adherens junction(GO:0071896) |
| 2.1 | 6.2 | GO:0042137 | sequestering of neurotransmitter(GO:0042137) |
| 2.1 | 6.2 | GO:1901624 | negative regulation of lymphocyte chemotaxis(GO:1901624) |
| 2.0 | 6.1 | GO:0036166 | phenotypic switching(GO:0036166) regulation of phenotypic switching(GO:1900239) |
| 2.0 | 20.3 | GO:0034058 | endosomal vesicle fusion(GO:0034058) |
| 2.0 | 6.0 | GO:1900425 | negative regulation of defense response to bacterium(GO:1900425) |
| 2.0 | 8.0 | GO:0043474 | eye pigment biosynthetic process(GO:0006726) eye pigment metabolic process(GO:0042441) pigment metabolic process involved in developmental pigmentation(GO:0043324) pigment metabolic process involved in pigmentation(GO:0043474) |
| 2.0 | 5.9 | GO:0090521 | glomerular visceral epithelial cell migration(GO:0090521) |
| 2.0 | 5.9 | GO:1903526 | negative regulation of membrane tubulation(GO:1903526) |
| 2.0 | 5.9 | GO:1905167 | positive regulation of lysosomal protein catabolic process(GO:1905167) |
| 1.9 | 1.9 | GO:0072103 | glomerulus vasculature morphogenesis(GO:0072103) glomerular capillary formation(GO:0072104) |
| 1.9 | 26.5 | GO:0035330 | regulation of hippo signaling(GO:0035330) |
| 1.9 | 7.5 | GO:1903070 | negative regulation of ER-associated ubiquitin-dependent protein catabolic process(GO:1903070) |
| 1.9 | 5.6 | GO:1900114 | positive regulation of histone H3-K9 trimethylation(GO:1900114) |
| 1.8 | 18.4 | GO:0090292 | nuclear matrix anchoring at nuclear membrane(GO:0090292) |
| 1.8 | 22.0 | GO:0045647 | negative regulation of erythrocyte differentiation(GO:0045647) |
| 1.8 | 10.9 | GO:1902174 | positive regulation of keratinocyte apoptotic process(GO:1902174) |
| 1.8 | 7.2 | GO:0031161 | phosphatidylinositol catabolic process(GO:0031161) |
| 1.8 | 9.0 | GO:0035469 | determination of pancreatic left/right asymmetry(GO:0035469) |
| 1.8 | 8.9 | GO:0042796 | snRNA transcription from RNA polymerase III promoter(GO:0042796) |
| 1.8 | 10.6 | GO:0072502 | cellular phosphate ion homeostasis(GO:0030643) cellular trivalent inorganic anion homeostasis(GO:0072502) |
| 1.7 | 5.2 | GO:1903288 | positive regulation of potassium ion import(GO:1903288) |
| 1.7 | 5.1 | GO:0001868 | regulation of complement activation, lectin pathway(GO:0001868) negative regulation of complement activation, lectin pathway(GO:0001869) |
| 1.7 | 5.0 | GO:0031587 | positive regulation of inositol 1,4,5-trisphosphate-sensitive calcium-release channel activity(GO:0031587) |
| 1.7 | 5.0 | GO:2000118 | regulation of sodium-dependent phosphate transport(GO:2000118) |
| 1.7 | 31.4 | GO:0006744 | ubiquinone biosynthetic process(GO:0006744) quinone biosynthetic process(GO:1901663) |
| 1.6 | 6.6 | GO:1900186 | negative regulation of clathrin-mediated endocytosis(GO:1900186) |
| 1.6 | 16.3 | GO:0046520 | diol biosynthetic process(GO:0034312) sphingosine biosynthetic process(GO:0046512) sphingoid biosynthetic process(GO:0046520) |
| 1.6 | 6.5 | GO:1902952 | positive regulation of dendritic spine maintenance(GO:1902952) |
| 1.6 | 9.8 | GO:0035063 | nuclear speck organization(GO:0035063) |
| 1.6 | 9.7 | GO:0021966 | corticospinal neuron axon guidance(GO:0021966) |
| 1.6 | 118.2 | GO:0045600 | positive regulation of fat cell differentiation(GO:0045600) |
| 1.6 | 9.6 | GO:0035616 | histone H2B conserved C-terminal lysine deubiquitination(GO:0035616) |
| 1.6 | 6.4 | GO:0002741 | positive regulation of cytokine secretion involved in immune response(GO:0002741) |
| 1.6 | 4.7 | GO:0098507 | polynucleotide 5' dephosphorylation(GO:0098507) |
| 1.6 | 7.8 | GO:2000676 | positive regulation of type B pancreatic cell apoptotic process(GO:2000676) |
| 1.5 | 6.2 | GO:0072237 | ascending thin limb development(GO:0072021) metanephric ascending thin limb development(GO:0072218) metanephric proximal tubule development(GO:0072237) |
| 1.5 | 1.5 | GO:0032058 | positive regulation of translational initiation in response to stress(GO:0032058) |
| 1.5 | 4.6 | GO:0021869 | forebrain ventricular zone progenitor cell division(GO:0021869) |
| 1.5 | 3.0 | GO:0010621 | negative regulation of transcription by transcription factor localization(GO:0010621) |
| 1.5 | 13.7 | GO:0071376 | response to corticotropin-releasing hormone(GO:0043435) cellular response to corticotropin-releasing hormone stimulus(GO:0071376) |
| 1.5 | 53.7 | GO:0045187 | regulation of circadian sleep/wake cycle, sleep(GO:0045187) |
| 1.5 | 3.0 | GO:0016476 | regulation of embryonic cell shape(GO:0016476) |
| 1.5 | 2.9 | GO:1903348 | positive regulation of bicellular tight junction assembly(GO:1903348) |
| 1.4 | 4.3 | GO:0001831 | trophectodermal cellular morphogenesis(GO:0001831) |
| 1.4 | 4.3 | GO:1990519 | pyrimidine nucleotide transport(GO:0006864) mitochondrial pyrimidine nucleotide import(GO:1990519) |
| 1.4 | 5.7 | GO:0090324 | negative regulation of oxidative phosphorylation(GO:0090324) |
| 1.4 | 12.7 | GO:0048102 | autophagic cell death(GO:0048102) |
| 1.4 | 26.9 | GO:1901897 | regulation of relaxation of cardiac muscle(GO:1901897) |
| 1.4 | 12.7 | GO:0044829 | positive regulation by host of viral genome replication(GO:0044829) |
| 1.4 | 5.6 | GO:0010900 | negative regulation of phosphatidylcholine catabolic process(GO:0010900) |
| 1.4 | 7.0 | GO:0051415 | interphase microtubule nucleation by interphase microtubule organizing center(GO:0051415) microtubule nucleation by microtubule organizing center(GO:0051418) |
| 1.4 | 4.2 | GO:0033078 | extrathymic T cell differentiation(GO:0033078) regulation of extrathymic T cell differentiation(GO:0033082) sebum secreting cell proliferation(GO:1990654) |
| 1.4 | 9.7 | GO:0035021 | negative regulation of Rac protein signal transduction(GO:0035021) |
| 1.4 | 5.6 | GO:0036269 | swimming behavior(GO:0036269) |
| 1.4 | 9.7 | GO:0060770 | negative regulation of epithelial cell proliferation involved in prostate gland development(GO:0060770) |
| 1.4 | 38.2 | GO:0032011 | ARF protein signal transduction(GO:0032011) |
| 1.4 | 8.2 | GO:0021523 | somatic motor neuron differentiation(GO:0021523) |
| 1.4 | 1.4 | GO:0034497 | protein localization to pre-autophagosomal structure(GO:0034497) |
| 1.4 | 2.7 | GO:0071284 | cellular response to lead ion(GO:0071284) |
| 1.4 | 4.1 | GO:0097156 | fasciculation of motor neuron axon(GO:0097156) |
| 1.4 | 6.8 | GO:0030070 | insulin processing(GO:0030070) |
| 1.3 | 26.8 | GO:0044458 | motile cilium assembly(GO:0044458) |
| 1.3 | 5.4 | GO:0030037 | actin filament reorganization involved in cell cycle(GO:0030037) |
| 1.3 | 6.7 | GO:0021997 | neural plate axis specification(GO:0021997) |
| 1.3 | 4.0 | GO:0014740 | negative regulation of muscle hyperplasia(GO:0014740) |
| 1.3 | 18.2 | GO:0021873 | forebrain neuroblast division(GO:0021873) |
| 1.3 | 3.9 | GO:0021722 | superior olivary nucleus development(GO:0021718) superior olivary nucleus maturation(GO:0021722) |
| 1.3 | 5.2 | GO:0006049 | UDP-N-acetylglucosamine catabolic process(GO:0006049) |
| 1.3 | 16.8 | GO:2001135 | regulation of endocytic recycling(GO:2001135) |
| 1.3 | 6.4 | GO:1904684 | negative regulation of metalloendopeptidase activity(GO:1904684) |
| 1.3 | 3.9 | GO:0048250 | mitochondrial iron ion transport(GO:0048250) |
| 1.3 | 3.8 | GO:0060398 | regulation of growth hormone receptor signaling pathway(GO:0060398) |
| 1.3 | 3.8 | GO:0070634 | transepithelial ammonium transport(GO:0070634) |
| 1.3 | 5.1 | GO:0030950 | establishment or maintenance of actin cytoskeleton polarity(GO:0030950) |
| 1.3 | 16.5 | GO:0003351 | epithelial cilium movement(GO:0003351) |
| 1.3 | 7.5 | GO:0061152 | trachea submucosa development(GO:0061152) trachea gland development(GO:0061153) |
| 1.2 | 3.7 | GO:0098937 | dendritic transport(GO:0098935) anterograde dendritic transport(GO:0098937) |
| 1.2 | 5.0 | GO:0034444 | regulation of plasma lipoprotein particle oxidation(GO:0034444) negative regulation of plasma lipoprotein particle oxidation(GO:0034445) |
| 1.2 | 3.7 | GO:1902263 | apoptotic process involved in embryonic digit morphogenesis(GO:1902263) |
| 1.2 | 1.2 | GO:2000417 | negative regulation of eosinophil migration(GO:2000417) |
| 1.2 | 9.8 | GO:0007288 | sperm axoneme assembly(GO:0007288) |
| 1.2 | 6.1 | GO:0098795 | mRNA cleavage involved in gene silencing by miRNA(GO:0035279) mRNA cleavage involved in gene silencing by siRNA(GO:0090625) mRNA cleavage involved in gene silencing(GO:0098795) |
| 1.2 | 8.5 | GO:0071557 | histone H3-K27 demethylation(GO:0071557) |
| 1.2 | 8.5 | GO:0045007 | depurination(GO:0045007) |
| 1.2 | 4.8 | GO:0052509 | induction by symbiont of host defense response(GO:0044416) induction of host immune response by virus(GO:0046730) active induction of host immune response by virus(GO:0046732) modulation by symbiont of host defense response(GO:0052031) induction by organism of defense response of other organism involved in symbiotic interaction(GO:0052251) modulation by organism of defense response of other organism involved in symbiotic interaction(GO:0052255) positive regulation by symbiont of host defense response(GO:0052509) positive regulation by organism of defense response of other organism involved in symbiotic interaction(GO:0052510) modulation by organism of immune response of other organism involved in symbiotic interaction(GO:0052552) modulation by symbiont of host immune response(GO:0052553) modulation by virus of host immune response(GO:0075528) |
| 1.2 | 1.2 | GO:0045799 | positive regulation of chromatin assembly or disassembly(GO:0045799) |
| 1.2 | 3.6 | GO:1901674 | histone H3-K27 acetylation(GO:0043974) regulation of histone H3-K27 acetylation(GO:1901674) |
| 1.2 | 2.4 | GO:0014004 | microglia differentiation(GO:0014004) microglia development(GO:0014005) |
| 1.2 | 4.8 | GO:0034146 | toll-like receptor 5 signaling pathway(GO:0034146) |
| 1.2 | 2.4 | GO:2001038 | regulation of cellular response to drug(GO:2001038) |
| 1.2 | 3.5 | GO:0070317 | negative regulation of G0 to G1 transition(GO:0070317) |
| 1.2 | 2.4 | GO:0031860 | telomeric 3' overhang formation(GO:0031860) |
| 1.2 | 1.2 | GO:0030910 | olfactory placode formation(GO:0030910) olfactory placode development(GO:0071698) olfactory placode morphogenesis(GO:0071699) |
| 1.2 | 3.5 | GO:1905053 | regulation of base-excision repair(GO:1905051) positive regulation of base-excision repair(GO:1905053) |
| 1.2 | 6.9 | GO:0055057 | neuronal stem cell division(GO:0036445) neuroblast division(GO:0055057) asymmetric neuroblast division(GO:0055059) |
| 1.2 | 10.4 | GO:0009407 | toxin catabolic process(GO:0009407) secondary metabolite catabolic process(GO:0090487) |
| 1.1 | 14.9 | GO:0016188 | synaptic vesicle maturation(GO:0016188) |
| 1.1 | 8.0 | GO:1902856 | negative regulation of nonmotile primary cilium assembly(GO:1902856) |
| 1.1 | 3.4 | GO:0014057 | positive regulation of acetylcholine secretion, neurotransmission(GO:0014057) |
| 1.1 | 3.4 | GO:0046066 | dGDP metabolic process(GO:0046066) |
| 1.1 | 6.7 | GO:0035617 | stress granule disassembly(GO:0035617) |
| 1.1 | 5.6 | GO:0030311 | poly-N-acetyllactosamine metabolic process(GO:0030309) poly-N-acetyllactosamine biosynthetic process(GO:0030311) |
| 1.1 | 3.3 | GO:0060708 | spongiotrophoblast differentiation(GO:0060708) |
| 1.1 | 3.3 | GO:0050720 | regulation of interleukin-1 biosynthetic process(GO:0045360) positive regulation of interleukin-1 biosynthetic process(GO:0045362) interleukin-1 beta biosynthetic process(GO:0050720) response to interleukin-8(GO:0098758) cellular response to interleukin-8(GO:0098759) regulation of progesterone biosynthetic process(GO:2000182) |
| 1.1 | 8.8 | GO:0070164 | negative regulation of adiponectin secretion(GO:0070164) |
| 1.1 | 8.8 | GO:0046604 | positive regulation of mitotic centrosome separation(GO:0046604) |
| 1.1 | 6.5 | GO:0001920 | negative regulation of receptor recycling(GO:0001920) |
| 1.1 | 12.0 | GO:2001256 | regulation of store-operated calcium entry(GO:2001256) |
| 1.1 | 3.2 | GO:0010700 | negative regulation of norepinephrine secretion(GO:0010700) |
| 1.1 | 3.2 | GO:0016185 | synaptic vesicle budding from presynaptic endocytic zone membrane(GO:0016185) |
| 1.1 | 4.3 | GO:1904428 | negative regulation of tubulin deacetylation(GO:1904428) |
| 1.1 | 3.2 | GO:0099526 | presynaptic signal transduction(GO:0098928) presynapse to nucleus signaling pathway(GO:0099526) |
| 1.1 | 3.2 | GO:0002025 | vasodilation by norepinephrine-epinephrine involved in regulation of systemic arterial blood pressure(GO:0002025) |
| 1.1 | 3.2 | GO:0031117 | positive regulation of microtubule depolymerization(GO:0031117) |
| 1.1 | 20.3 | GO:0090344 | negative regulation of cell aging(GO:0090344) |
| 1.1 | 3.2 | GO:0021555 | midbrain-hindbrain boundary morphogenesis(GO:0021555) |
| 1.0 | 2.1 | GO:1904529 | regulation of actin filament binding(GO:1904529) regulation of actin binding(GO:1904616) |
| 1.0 | 3.1 | GO:0034085 | establishment of sister chromatid cohesion(GO:0034085) cohesin loading(GO:0071921) regulation of cohesin loading(GO:0071922) |
| 1.0 | 6.2 | GO:0048505 | regulation of development, heterochronic(GO:0040034) regulation of timing of cell differentiation(GO:0048505) |
| 1.0 | 3.1 | GO:0008355 | olfactory learning(GO:0008355) |
| 1.0 | 3.1 | GO:0045629 | negative regulation of T-helper 2 cell differentiation(GO:0045629) |
| 1.0 | 4.1 | GO:0032466 | negative regulation of cytokinesis(GO:0032466) |
| 1.0 | 4.1 | GO:0033159 | negative regulation of protein import into nucleus, translocation(GO:0033159) |
| 1.0 | 2.1 | GO:0002339 | B cell selection(GO:0002339) |
| 1.0 | 6.1 | GO:1902075 | cellular response to salt(GO:1902075) |
| 1.0 | 10.2 | GO:0035414 | negative regulation of catenin import into nucleus(GO:0035414) |
| 1.0 | 3.0 | GO:1902630 | regulation of membrane hyperpolarization(GO:1902630) |
| 1.0 | 7.1 | GO:0017196 | N-terminal peptidyl-methionine acetylation(GO:0017196) |
| 1.0 | 10.1 | GO:0032000 | positive regulation of fatty acid beta-oxidation(GO:0032000) |
| 1.0 | 4.0 | GO:0060355 | positive regulation of cell adhesion molecule production(GO:0060355) |
| 1.0 | 10.0 | GO:1902746 | regulation of lens fiber cell differentiation(GO:1902746) |
| 1.0 | 4.0 | GO:0003431 | growth plate cartilage chondrocyte growth(GO:0003430) growth plate cartilage chondrocyte development(GO:0003431) |
| 1.0 | 1.0 | GO:0038180 | nerve growth factor signaling pathway(GO:0038180) |
| 1.0 | 2.0 | GO:0015870 | acetylcholine transport(GO:0015870) |
| 1.0 | 2.9 | GO:0060501 | positive regulation of epithelial cell proliferation involved in lung morphogenesis(GO:0060501) |
| 1.0 | 6.9 | GO:0006489 | dolichyl diphosphate biosynthetic process(GO:0006489) dolichyl diphosphate metabolic process(GO:0046465) |
| 1.0 | 5.9 | GO:0006543 | glutamine catabolic process(GO:0006543) |
| 1.0 | 2.9 | GO:0002086 | diaphragm contraction(GO:0002086) |
| 1.0 | 2.9 | GO:0090187 | positive regulation of pancreatic juice secretion(GO:0090187) |
| 1.0 | 4.9 | GO:0042636 | negative regulation of hair cycle(GO:0042636) |
| 0.9 | 1.9 | GO:1903116 | positive regulation of actin filament-based movement(GO:1903116) |
| 0.9 | 1.9 | GO:0048715 | negative regulation of oligodendrocyte differentiation(GO:0048715) |
| 0.9 | 5.6 | GO:0042713 | sperm ejaculation(GO:0042713) |
| 0.9 | 2.8 | GO:0071934 | thiamine transport(GO:0015888) thiamine transmembrane transport(GO:0071934) |
| 0.9 | 3.7 | GO:0019072 | viral genome packaging(GO:0019072) viral RNA genome packaging(GO:0019074) |
| 0.9 | 2.8 | GO:0042412 | taurine biosynthetic process(GO:0042412) |
| 0.9 | 2.8 | GO:0051230 | mitotic spindle disassembly(GO:0051228) spindle disassembly(GO:0051230) |
| 0.9 | 4.6 | GO:1902093 | positive regulation of sperm motility(GO:1902093) |
| 0.9 | 2.7 | GO:1990637 | response to prolactin(GO:1990637) |
| 0.9 | 1.8 | GO:0090234 | regulation of centromere complex assembly(GO:0090230) regulation of kinetochore assembly(GO:0090234) |
| 0.9 | 2.7 | GO:0035054 | embryonic heart tube anterior/posterior pattern specification(GO:0035054) |
| 0.9 | 2.7 | GO:0060455 | negative regulation of gastric acid secretion(GO:0060455) |
| 0.9 | 24.2 | GO:0050873 | brown fat cell differentiation(GO:0050873) |
| 0.9 | 16.8 | GO:0048490 | anterograde synaptic vesicle transport(GO:0048490) synaptic vesicle cytoskeletal transport(GO:0099514) synaptic vesicle transport along microtubule(GO:0099517) |
| 0.9 | 8.7 | GO:0001842 | neural fold formation(GO:0001842) |
| 0.9 | 6.1 | GO:1904354 | negative regulation of telomere capping(GO:1904354) |
| 0.9 | 21.7 | GO:0010763 | positive regulation of fibroblast migration(GO:0010763) |
| 0.9 | 11.2 | GO:1901223 | negative regulation of NIK/NF-kappaB signaling(GO:1901223) |
| 0.9 | 5.1 | GO:0035624 | receptor transactivation(GO:0035624) |
| 0.9 | 2.6 | GO:0072277 | platelet-derived growth factor receptor-alpha signaling pathway(GO:0035790) metanephric glomerulus morphogenesis(GO:0072275) metanephric glomerulus vasculature morphogenesis(GO:0072276) metanephric glomerular capillary formation(GO:0072277) |
| 0.8 | 15.3 | GO:1904706 | negative regulation of vascular smooth muscle cell proliferation(GO:1904706) |
| 0.8 | 3.4 | GO:1904381 | Golgi apparatus mannose trimming(GO:1904381) |
| 0.8 | 6.8 | GO:1900112 | regulation of histone H3-K9 trimethylation(GO:1900112) |
| 0.8 | 12.6 | GO:0031573 | intra-S DNA damage checkpoint(GO:0031573) |
| 0.8 | 2.5 | GO:0048633 | positive regulation of skeletal muscle tissue growth(GO:0048633) |
| 0.8 | 7.5 | GO:0090232 | positive regulation of spindle checkpoint(GO:0090232) |
| 0.8 | 3.3 | GO:0060684 | epithelial-mesenchymal cell signaling(GO:0060684) |
| 0.8 | 32.1 | GO:0042772 | DNA damage response, signal transduction by p53 class mediator resulting in transcription of p21 class mediator(GO:0006978) DNA damage response, signal transduction resulting in transcription(GO:0042772) |
| 0.8 | 6.5 | GO:0070278 | extracellular matrix constituent secretion(GO:0070278) |
| 0.8 | 1.6 | GO:1904049 | negative regulation of spontaneous neurotransmitter secretion(GO:1904049) |
| 0.8 | 20.9 | GO:0098534 | centriole replication(GO:0007099) centriole assembly(GO:0098534) |
| 0.8 | 0.8 | GO:0051461 | positive regulation of corticotropin secretion(GO:0051461) |
| 0.8 | 2.4 | GO:0021781 | glial cell fate commitment(GO:0021781) |
| 0.8 | 5.6 | GO:0060992 | response to fungicide(GO:0060992) |
| 0.8 | 8.7 | GO:0021694 | cerebellar Purkinje cell layer formation(GO:0021694) cerebellar Purkinje cell differentiation(GO:0021702) |
| 0.8 | 10.2 | GO:0045792 | negative regulation of cell size(GO:0045792) |
| 0.8 | 1.6 | GO:0002024 | diet induced thermogenesis(GO:0002024) |
| 0.8 | 6.3 | GO:0032020 | ISG15-protein conjugation(GO:0032020) |
| 0.8 | 4.7 | GO:1903350 | response to dopamine(GO:1903350) cellular response to dopamine(GO:1903351) |
| 0.8 | 2.3 | GO:1902513 | regulation of organelle transport along microtubule(GO:1902513) |
| 0.8 | 20.8 | GO:0032515 | negative regulation of phosphoprotein phosphatase activity(GO:0032515) |
| 0.8 | 2.3 | GO:0032525 | somite rostral/caudal axis specification(GO:0032525) |
| 0.8 | 18.3 | GO:0051412 | response to corticosterone(GO:0051412) |
| 0.8 | 2.3 | GO:1901873 | regulation of post-translational protein modification(GO:1901873) negative regulation of post-translational protein modification(GO:1901874) |
| 0.7 | 6.7 | GO:0048243 | norepinephrine secretion(GO:0048243) |
| 0.7 | 3.7 | GO:2000049 | positive regulation of cell-cell adhesion mediated by cadherin(GO:2000049) |
| 0.7 | 7.4 | GO:1902525 | regulation of protein monoubiquitination(GO:1902525) |
| 0.7 | 4.4 | GO:0090245 | axis elongation involved in somitogenesis(GO:0090245) |
| 0.7 | 6.6 | GO:0034382 | chylomicron remnant clearance(GO:0034382) triglyceride-rich lipoprotein particle clearance(GO:0071830) |
| 0.7 | 5.8 | GO:0031087 | nuclear-transcribed mRNA catabolic process, deadenylation-independent decay(GO:0031086) deadenylation-independent decapping of nuclear-transcribed mRNA(GO:0031087) |
| 0.7 | 2.2 | GO:0035881 | amacrine cell differentiation(GO:0035881) |
| 0.7 | 39.3 | GO:0001578 | microtubule bundle formation(GO:0001578) |
| 0.7 | 6.4 | GO:0042148 | strand invasion(GO:0042148) |
| 0.7 | 6.4 | GO:0033087 | negative regulation of immature T cell proliferation(GO:0033087) negative regulation of immature T cell proliferation in thymus(GO:0033088) |
| 0.7 | 0.7 | GO:0031630 | regulation of synaptic vesicle fusion to presynaptic membrane(GO:0031630) |
| 0.7 | 4.2 | GO:0043619 | regulation of transcription from RNA polymerase II promoter in response to oxidative stress(GO:0043619) |
| 0.7 | 7.1 | GO:0048843 | negative regulation of axon extension involved in axon guidance(GO:0048843) |
| 0.7 | 4.9 | GO:0006655 | phosphatidylglycerol biosynthetic process(GO:0006655) |
| 0.7 | 11.9 | GO:0038092 | nodal signaling pathway(GO:0038092) |
| 0.7 | 6.3 | GO:0097500 | receptor localization to nonmotile primary cilium(GO:0097500) |
| 0.7 | 2.1 | GO:0030241 | skeletal muscle myosin thick filament assembly(GO:0030241) sarcomerogenesis(GO:0048769) |
| 0.7 | 6.9 | GO:1900227 | positive regulation of NLRP3 inflammasome complex assembly(GO:1900227) |
| 0.7 | 4.1 | GO:0021798 | forebrain dorsal/ventral pattern formation(GO:0021798) |
| 0.7 | 8.9 | GO:1901621 | regulation of smoothened signaling pathway involved in dorsal/ventral neural tube patterning(GO:1901620) negative regulation of smoothened signaling pathway involved in dorsal/ventral neural tube patterning(GO:1901621) |
| 0.7 | 6.8 | GO:0001675 | acrosome assembly(GO:0001675) |
| 0.7 | 2.0 | GO:0005988 | lactose metabolic process(GO:0005988) lactose biosynthetic process(GO:0005989) |
| 0.7 | 10.1 | GO:0030208 | dermatan sulfate biosynthetic process(GO:0030208) |
| 0.7 | 2.0 | GO:0060633 | negative regulation of transcription initiation from RNA polymerase II promoter(GO:0060633) negative regulation of DNA-templated transcription, initiation(GO:2000143) |
| 0.7 | 9.4 | GO:0021819 | layer formation in cerebral cortex(GO:0021819) |
| 0.7 | 3.3 | GO:0010793 | regulation of mRNA export from nucleus(GO:0010793) |
| 0.7 | 5.9 | GO:0070475 | rRNA base methylation(GO:0070475) |
| 0.7 | 30.8 | GO:0051646 | mitochondrion localization(GO:0051646) |
| 0.7 | 2.0 | GO:1900154 | regulation of bone trabecula formation(GO:1900154) negative regulation of bone trabecula formation(GO:1900155) |
| 0.6 | 3.9 | GO:0090649 | response to oxygen-glucose deprivation(GO:0090649) cellular response to oxygen-glucose deprivation(GO:0090650) |
| 0.6 | 16.7 | GO:0002089 | lens morphogenesis in camera-type eye(GO:0002089) |
| 0.6 | 1.9 | GO:0048617 | foregut morphogenesis(GO:0007440) embryonic foregut morphogenesis(GO:0048617) |
| 0.6 | 2.5 | GO:0048861 | leukemia inhibitory factor signaling pathway(GO:0048861) |
| 0.6 | 7.0 | GO:2000138 | positive regulation of cell proliferation involved in heart morphogenesis(GO:2000138) |
| 0.6 | 5.7 | GO:0048681 | negative regulation of axon regeneration(GO:0048681) |
| 0.6 | 9.4 | GO:0032780 | negative regulation of ATPase activity(GO:0032780) |
| 0.6 | 2.5 | GO:0032713 | negative regulation of interleukin-4 production(GO:0032713) |
| 0.6 | 5.0 | GO:0070995 | NADPH oxidation(GO:0070995) |
| 0.6 | 1.2 | GO:0051933 | amino acid neurotransmitter reuptake(GO:0051933) glutamate reuptake(GO:0051935) |
| 0.6 | 3.7 | GO:0034587 | piRNA metabolic process(GO:0034587) |
| 0.6 | 4.9 | GO:1904262 | negative regulation of TORC1 signaling(GO:1904262) |
| 0.6 | 2.5 | GO:0033603 | positive regulation of dopamine secretion(GO:0033603) |
| 0.6 | 1.8 | GO:0061734 | parkin-mediated mitophagy in response to mitochondrial depolarization(GO:0061734) |
| 0.6 | 7.9 | GO:0048172 | regulation of short-term neuronal synaptic plasticity(GO:0048172) |
| 0.6 | 6.1 | GO:0048240 | sperm capacitation(GO:0048240) |
| 0.6 | 6.0 | GO:0035095 | behavioral response to nicotine(GO:0035095) |
| 0.6 | 10.2 | GO:0044030 | regulation of DNA methylation(GO:0044030) |
| 0.6 | 1.8 | GO:0044332 | Wnt signaling pathway involved in dorsal/ventral axis specification(GO:0044332) |
| 0.6 | 4.8 | GO:0038028 | insulin receptor signaling pathway via phosphatidylinositol 3-kinase(GO:0038028) |
| 0.6 | 1.2 | GO:0075071 | autophagy of host cells involved in interaction with symbiont(GO:0075044) autophagy involved in symbiotic interaction(GO:0075071) |
| 0.6 | 11.9 | GO:0051457 | maintenance of protein location in nucleus(GO:0051457) |
| 0.6 | 3.0 | GO:0014886 | transition between slow and fast fiber(GO:0014886) |
| 0.6 | 3.0 | GO:0007512 | adult heart development(GO:0007512) |
| 0.6 | 0.6 | GO:1901420 | negative regulation of response to alcohol(GO:1901420) |
| 0.6 | 1.8 | GO:0036146 | cellular response to mycotoxin(GO:0036146) |
| 0.6 | 7.1 | GO:0031284 | positive regulation of guanylate cyclase activity(GO:0031284) |
| 0.6 | 5.8 | GO:0051611 | negative regulation of neurotransmitter uptake(GO:0051581) serotonin uptake(GO:0051610) regulation of serotonin uptake(GO:0051611) negative regulation of serotonin uptake(GO:0051612) |
| 0.6 | 5.8 | GO:0048671 | negative regulation of collateral sprouting(GO:0048671) |
| 0.6 | 1.7 | GO:0003218 | cardiac left ventricle formation(GO:0003218) |
| 0.6 | 6.3 | GO:0097116 | postsynaptic density organization(GO:0097106) postsynaptic density assembly(GO:0097107) gephyrin clustering involved in postsynaptic density assembly(GO:0097116) |
| 0.6 | 8.6 | GO:0048266 | behavioral response to pain(GO:0048266) |
| 0.6 | 2.3 | GO:0035234 | ectopic germ cell programmed cell death(GO:0035234) |
| 0.6 | 4.0 | GO:0034638 | phosphatidylcholine catabolic process(GO:0034638) |
| 0.6 | 12.5 | GO:0090141 | positive regulation of mitochondrial fission(GO:0090141) |
| 0.6 | 2.8 | GO:0016240 | autophagosome docking(GO:0016240) |
| 0.6 | 0.6 | GO:0021692 | cerebellar Purkinje cell layer morphogenesis(GO:0021692) |
| 0.6 | 2.8 | GO:0032483 | regulation of Rab protein signal transduction(GO:0032483) |
| 0.6 | 6.1 | GO:1990416 | cellular response to brain-derived neurotrophic factor stimulus(GO:1990416) |
| 0.6 | 6.7 | GO:0006776 | vitamin A metabolic process(GO:0006776) |
| 0.5 | 0.5 | GO:0051586 | positive regulation of neurotransmitter uptake(GO:0051582) positive regulation of dopamine uptake involved in synaptic transmission(GO:0051586) positive regulation of catecholamine uptake involved in synaptic transmission(GO:0051944) |
| 0.5 | 3.3 | GO:2000781 | positive regulation of double-strand break repair(GO:2000781) |
| 0.5 | 1.6 | GO:0090286 | cytoskeletal anchoring at nuclear membrane(GO:0090286) |
| 0.5 | 3.2 | GO:0034128 | negative regulation of MyD88-independent toll-like receptor signaling pathway(GO:0034128) |
| 0.5 | 4.3 | GO:2000651 | positive regulation of sodium ion transmembrane transporter activity(GO:2000651) |
| 0.5 | 3.2 | GO:0032717 | negative regulation of interleukin-8 production(GO:0032717) |
| 0.5 | 5.9 | GO:0034498 | early endosome to Golgi transport(GO:0034498) |
| 0.5 | 16.1 | GO:0097503 | sialylation(GO:0097503) |
| 0.5 | 8.6 | GO:0022038 | corpus callosum development(GO:0022038) |
| 0.5 | 2.1 | GO:0019086 | late viral transcription(GO:0019086) |
| 0.5 | 5.8 | GO:0060575 | intestinal epithelial cell differentiation(GO:0060575) |
| 0.5 | 3.7 | GO:0010968 | regulation of microtubule nucleation(GO:0010968) |
| 0.5 | 4.2 | GO:0010533 | regulation of activation of Janus kinase activity(GO:0010533) |
| 0.5 | 2.6 | GO:0050861 | positive regulation of B cell receptor signaling pathway(GO:0050861) |
| 0.5 | 1.6 | GO:0033512 | L-lysine catabolic process to acetyl-CoA via saccharopine(GO:0033512) |
| 0.5 | 4.7 | GO:0060068 | vagina development(GO:0060068) |
| 0.5 | 3.1 | GO:0071105 | response to interleukin-11(GO:0071105) |
| 0.5 | 2.0 | GO:1902023 | regulation of amino acid import(GO:0010958) L-arginine import(GO:0043091) arginine import(GO:0090467) L-arginine transport(GO:1902023) |
| 0.5 | 3.1 | GO:0042074 | cell migration involved in gastrulation(GO:0042074) |
| 0.5 | 7.1 | GO:0002052 | positive regulation of neuroblast proliferation(GO:0002052) |
| 0.5 | 7.1 | GO:0040020 | regulation of meiotic nuclear division(GO:0040020) |
| 0.5 | 7.0 | GO:0000022 | mitotic spindle elongation(GO:0000022) |
| 0.5 | 3.5 | GO:0060137 | maternal process involved in parturition(GO:0060137) |
| 0.5 | 17.7 | GO:0006783 | heme biosynthetic process(GO:0006783) |
| 0.5 | 2.9 | GO:0036462 | TRAIL-activated apoptotic signaling pathway(GO:0036462) |
| 0.5 | 27.3 | GO:0042384 | cilium assembly(GO:0042384) |
| 0.5 | 1.5 | GO:0006114 | glycerol biosynthetic process(GO:0006114) |
| 0.5 | 10.7 | GO:0034162 | toll-like receptor 9 signaling pathway(GO:0034162) |
| 0.5 | 3.4 | GO:0016198 | axon choice point recognition(GO:0016198) |
| 0.5 | 2.4 | GO:1902613 | regulation of anti-Mullerian hormone signaling pathway(GO:1902612) negative regulation of anti-Mullerian hormone signaling pathway(GO:1902613) anti-Mullerian hormone signaling pathway(GO:1990262) |
| 0.5 | 2.9 | GO:0061343 | cell adhesion involved in heart morphogenesis(GO:0061343) |
| 0.5 | 6.2 | GO:0034453 | microtubule anchoring(GO:0034453) |
| 0.5 | 0.5 | GO:0010587 | miRNA catabolic process(GO:0010587) |
| 0.5 | 1.9 | GO:2000297 | negative regulation of synapse maturation(GO:2000297) |
| 0.5 | 2.3 | GO:0009048 | dosage compensation(GO:0007549) dosage compensation by inactivation of X chromosome(GO:0009048) |
| 0.5 | 1.9 | GO:0070221 | sulfide oxidation(GO:0019418) sulfide oxidation, using sulfide:quinone oxidoreductase(GO:0070221) |
| 0.5 | 9.3 | GO:0016254 | preassembly of GPI anchor in ER membrane(GO:0016254) |
| 0.5 | 0.9 | GO:0060666 | dichotomous subdivision of terminal units involved in salivary gland branching(GO:0060666) |
| 0.5 | 1.4 | GO:0071499 | cellular response to laminar fluid shear stress(GO:0071499) |
| 0.5 | 7.8 | GO:1904778 | regulation of protein localization to cell cortex(GO:1904776) positive regulation of protein localization to cell cortex(GO:1904778) |
| 0.5 | 2.7 | GO:0008298 | intracellular mRNA localization(GO:0008298) |
| 0.5 | 0.9 | GO:0021999 | neural plate anterior/posterior regionalization(GO:0021999) |
| 0.4 | 3.6 | GO:0046549 | retinal cone cell differentiation(GO:0042670) retinal cone cell development(GO:0046549) |
| 0.4 | 0.9 | GO:0061428 | negative regulation of transcription from RNA polymerase II promoter in response to hypoxia(GO:0061428) |
| 0.4 | 3.5 | GO:2000105 | positive regulation of DNA-dependent DNA replication(GO:2000105) |
| 0.4 | 8.6 | GO:0000042 | protein targeting to Golgi(GO:0000042) |
| 0.4 | 1.3 | GO:0051877 | pigment granule aggregation in cell center(GO:0051877) |
| 0.4 | 2.6 | GO:0015705 | iodide transport(GO:0015705) |
| 0.4 | 0.4 | GO:0045448 | regulation of mitotic cell cycle, embryonic(GO:0009794) mitotic cell cycle, embryonic(GO:0045448) |
| 0.4 | 1.3 | GO:0070105 | positive regulation of interleukin-6-mediated signaling pathway(GO:0070105) |
| 0.4 | 3.8 | GO:0030807 | positive regulation of cyclic nucleotide catabolic process(GO:0030807) positive regulation of cAMP catabolic process(GO:0030822) positive regulation of purine nucleotide catabolic process(GO:0033123) |
| 0.4 | 3.0 | GO:0051342 | regulation of cyclic-nucleotide phosphodiesterase activity(GO:0051342) negative regulation of cyclic-nucleotide phosphodiesterase activity(GO:0051344) |
| 0.4 | 1.3 | GO:0051231 | spindle elongation(GO:0051231) |
| 0.4 | 23.9 | GO:0015701 | bicarbonate transport(GO:0015701) |
| 0.4 | 2.5 | GO:0071321 | cellular response to cGMP(GO:0071321) |
| 0.4 | 4.2 | GO:0032926 | negative regulation of activin receptor signaling pathway(GO:0032926) |
| 0.4 | 2.9 | GO:0016191 | synaptic vesicle uncoating(GO:0016191) vesicle uncoating(GO:0072319) |
| 0.4 | 0.4 | GO:0009957 | epidermal cell fate specification(GO:0009957) |
| 0.4 | 0.8 | GO:0060526 | prostate glandular acinus morphogenesis(GO:0060526) prostate epithelial cord arborization involved in prostate glandular acinus morphogenesis(GO:0060527) |
| 0.4 | 6.2 | GO:0032366 | intracellular sterol transport(GO:0032366) intracellular cholesterol transport(GO:0032367) |
| 0.4 | 149.2 | GO:0051056 | regulation of small GTPase mediated signal transduction(GO:0051056) |
| 0.4 | 21.1 | GO:0050775 | positive regulation of dendrite morphogenesis(GO:0050775) |
| 0.4 | 16.2 | GO:0034446 | substrate adhesion-dependent cell spreading(GO:0034446) |
| 0.4 | 1.6 | GO:0006701 | progesterone biosynthetic process(GO:0006701) |
| 0.4 | 1.2 | GO:0031665 | negative regulation of lipopolysaccharide-mediated signaling pathway(GO:0031665) |
| 0.4 | 2.8 | GO:0044387 | negative regulation of protein kinase activity by regulation of protein phosphorylation(GO:0044387) |
| 0.4 | 2.0 | GO:0060363 | cranial suture morphogenesis(GO:0060363) |
| 0.4 | 4.4 | GO:0033169 | histone H3-K9 demethylation(GO:0033169) |
| 0.4 | 3.2 | GO:0023035 | CD40 signaling pathway(GO:0023035) |
| 0.4 | 5.6 | GO:1904714 | regulation of chaperone-mediated autophagy(GO:1904714) |
| 0.4 | 2.4 | GO:0071394 | cellular response to testosterone stimulus(GO:0071394) |
| 0.4 | 7.2 | GO:0045494 | photoreceptor cell maintenance(GO:0045494) |
| 0.4 | 15.0 | GO:0016266 | O-glycan processing(GO:0016266) |
| 0.4 | 2.0 | GO:1990253 | cellular response to leucine starvation(GO:1990253) |
| 0.4 | 2.3 | GO:0070445 | oligodendrocyte progenitor proliferation(GO:0070444) regulation of oligodendrocyte progenitor proliferation(GO:0070445) |
| 0.4 | 3.8 | GO:0018027 | peptidyl-lysine dimethylation(GO:0018027) |
| 0.4 | 1.9 | GO:0007217 | tachykinin receptor signaling pathway(GO:0007217) |
| 0.4 | 4.2 | GO:0030575 | nuclear body organization(GO:0030575) |
| 0.4 | 6.4 | GO:0031643 | positive regulation of myelination(GO:0031643) |
| 0.4 | 5.3 | GO:0046007 | negative regulation of activated T cell proliferation(GO:0046007) |
| 0.4 | 0.4 | GO:0010807 | regulation of synaptic vesicle priming(GO:0010807) |
| 0.4 | 3.4 | GO:0006528 | asparagine metabolic process(GO:0006528) |
| 0.4 | 2.2 | GO:0060453 | regulation of gastric acid secretion(GO:0060453) |
| 0.4 | 2.2 | GO:0007256 | activation of JNKK activity(GO:0007256) |
| 0.4 | 4.1 | GO:2000178 | negative regulation of neural precursor cell proliferation(GO:2000178) |
| 0.4 | 4.8 | GO:0033689 | negative regulation of osteoblast proliferation(GO:0033689) |
| 0.4 | 4.4 | GO:0043508 | negative regulation of JUN kinase activity(GO:0043508) |
| 0.4 | 1.5 | GO:0086053 | SA node cell to atrial cardiac muscle cell communication by electrical coupling(GO:0086021) AV node cell to bundle of His cell communication by electrical coupling(GO:0086053) |
| 0.4 | 1.1 | GO:0010760 | negative regulation of macrophage chemotaxis(GO:0010760) |
| 0.4 | 0.7 | GO:0021800 | cerebral cortex tangential migration(GO:0021800) |
| 0.4 | 23.0 | GO:0043966 | histone H3 acetylation(GO:0043966) |
| 0.4 | 1.8 | GO:0043982 | histone H4-K5 acetylation(GO:0043981) histone H4-K8 acetylation(GO:0043982) |
| 0.4 | 1.8 | GO:0048105 | establishment of body hair or bristle planar orientation(GO:0048104) establishment of body hair planar orientation(GO:0048105) |
| 0.4 | 1.8 | GO:2000672 | regulation of motor neuron apoptotic process(GO:2000671) negative regulation of motor neuron apoptotic process(GO:2000672) |
| 0.3 | 1.0 | GO:0006651 | diacylglycerol biosynthetic process(GO:0006651) |
| 0.3 | 11.5 | GO:0042026 | protein refolding(GO:0042026) |
| 0.3 | 1.4 | GO:0014859 | negative regulation of skeletal muscle cell proliferation(GO:0014859) negative regulation of skeletal muscle satellite cell proliferation(GO:1902723) |
| 0.3 | 10.8 | GO:0042036 | negative regulation of cytokine biosynthetic process(GO:0042036) |
| 0.3 | 4.2 | GO:0048742 | regulation of skeletal muscle fiber development(GO:0048742) |
| 0.3 | 2.8 | GO:0043374 | CD8-positive, alpha-beta T cell differentiation(GO:0043374) |
| 0.3 | 5.4 | GO:0043011 | myeloid dendritic cell differentiation(GO:0043011) |
| 0.3 | 7.5 | GO:0070584 | mitochondrion morphogenesis(GO:0070584) |
| 0.3 | 4.4 | GO:0036149 | phosphatidylinositol acyl-chain remodeling(GO:0036149) |
| 0.3 | 5.1 | GO:0015671 | oxygen transport(GO:0015671) |
| 0.3 | 2.3 | GO:0032218 | riboflavin transport(GO:0032218) |
| 0.3 | 1.0 | GO:2000366 | cardiac muscle tissue regeneration(GO:0061026) regulation of STAT protein import into nucleus(GO:2000364) positive regulation of STAT protein import into nucleus(GO:2000366) |
| 0.3 | 1.7 | GO:0030860 | regulation of polarized epithelial cell differentiation(GO:0030860) |
| 0.3 | 8.3 | GO:0071108 | protein K48-linked deubiquitination(GO:0071108) |
| 0.3 | 3.6 | GO:0007175 | negative regulation of epidermal growth factor-activated receptor activity(GO:0007175) |
| 0.3 | 3.3 | GO:2000480 | negative regulation of cAMP-dependent protein kinase activity(GO:2000480) |
| 0.3 | 1.6 | GO:0016139 | glycoside catabolic process(GO:0016139) |
| 0.3 | 11.5 | GO:0016339 | calcium-dependent cell-cell adhesion via plasma membrane cell adhesion molecules(GO:0016339) |
| 0.3 | 1.3 | GO:1904261 | positive regulation of extracellular matrix assembly(GO:1901203) regulation of basement membrane assembly involved in embryonic body morphogenesis(GO:1904259) positive regulation of basement membrane assembly involved in embryonic body morphogenesis(GO:1904261) basement membrane assembly involved in embryonic body morphogenesis(GO:2001197) |
| 0.3 | 1.9 | GO:0046340 | diacylglycerol catabolic process(GO:0046340) |
| 0.3 | 1.9 | GO:0051026 | chiasma assembly(GO:0051026) |
| 0.3 | 3.2 | GO:1900273 | positive regulation of long-term synaptic potentiation(GO:1900273) |
| 0.3 | 1.3 | GO:0071110 | protein biotinylation(GO:0009305) histone biotinylation(GO:0071110) |
| 0.3 | 3.5 | GO:0070977 | bone maturation(GO:0070977) |
| 0.3 | 27.2 | GO:0030574 | collagen catabolic process(GO:0030574) |
| 0.3 | 9.2 | GO:0034260 | negative regulation of GTPase activity(GO:0034260) |
| 0.3 | 0.3 | GO:0051106 | positive regulation of DNA ligation(GO:0051106) |
| 0.3 | 0.3 | GO:0014724 | regulation of twitch skeletal muscle contraction(GO:0014724) |
| 0.3 | 4.4 | GO:0042753 | positive regulation of circadian rhythm(GO:0042753) |
| 0.3 | 1.5 | GO:0019323 | pentose catabolic process(GO:0019323) |
| 0.3 | 3.6 | GO:0030322 | stabilization of membrane potential(GO:0030322) |
| 0.3 | 0.9 | GO:0086048 | membrane depolarization during bundle of His cell action potential(GO:0086048) |
| 0.3 | 0.6 | GO:0061739 | protein lipidation involved in autophagosome assembly(GO:0061739) |
| 0.3 | 2.6 | GO:0003215 | cardiac right ventricle morphogenesis(GO:0003215) |
| 0.3 | 1.4 | GO:0093001 | glycolysis from storage polysaccharide through glucose-1-phosphate(GO:0093001) |
| 0.3 | 2.9 | GO:0042373 | vitamin K metabolic process(GO:0042373) |
| 0.3 | 4.8 | GO:0006646 | phosphatidylethanolamine biosynthetic process(GO:0006646) phosphatidylethanolamine metabolic process(GO:0046337) |
| 0.3 | 2.8 | GO:0043984 | histone H4-K16 acetylation(GO:0043984) |
| 0.3 | 1.7 | GO:2000535 | regulation of entry of bacterium into host cell(GO:2000535) |
| 0.3 | 2.2 | GO:0032228 | regulation of synaptic transmission, GABAergic(GO:0032228) |
| 0.3 | 1.7 | GO:0014051 | gamma-aminobutyric acid secretion(GO:0014051) |
| 0.3 | 1.9 | GO:0035608 | protein deglutamylation(GO:0035608) |
| 0.3 | 2.8 | GO:0010804 | negative regulation of tumor necrosis factor-mediated signaling pathway(GO:0010804) |
| 0.3 | 3.0 | GO:1900103 | positive regulation of endoplasmic reticulum unfolded protein response(GO:1900103) |
| 0.3 | 2.2 | GO:2000574 | regulation of microtubule motor activity(GO:2000574) |
| 0.3 | 2.2 | GO:0036066 | protein O-linked fucosylation(GO:0036066) |
| 0.3 | 1.4 | GO:0042360 | vitamin E metabolic process(GO:0042360) |
| 0.3 | 1.1 | GO:1905232 | cellular response to L-glutamate(GO:1905232) |
| 0.3 | 4.8 | GO:0006506 | GPI anchor biosynthetic process(GO:0006506) |
| 0.3 | 1.9 | GO:1902947 | regulation of tau-protein kinase activity(GO:1902947) positive regulation of tau-protein kinase activity(GO:1902949) |
| 0.3 | 4.8 | GO:0044804 | nucleophagy(GO:0044804) |
| 0.3 | 20.2 | GO:0009301 | snRNA transcription(GO:0009301) snRNA transcription from RNA polymerase II promoter(GO:0042795) |
| 0.3 | 8.1 | GO:0051181 | cofactor transport(GO:0051181) |
| 0.3 | 3.4 | GO:0031297 | replication fork processing(GO:0031297) |
| 0.3 | 2.3 | GO:0060080 | inhibitory postsynaptic potential(GO:0060080) |
| 0.3 | 0.8 | GO:1902109 | negative regulation of mitochondrial membrane permeability involved in apoptotic process(GO:1902109) |
| 0.3 | 2.1 | GO:0060297 | primary heart field specification(GO:0003138) sinoatrial valve development(GO:0003172) sinoatrial valve morphogenesis(GO:0003185) regulation of sarcomere organization(GO:0060297) |
| 0.3 | 6.7 | GO:0003170 | heart valve development(GO:0003170) |
| 0.3 | 3.3 | GO:2001241 | positive regulation of extrinsic apoptotic signaling pathway in absence of ligand(GO:2001241) |
| 0.3 | 2.3 | GO:0048820 | hair follicle maturation(GO:0048820) |
| 0.3 | 1.3 | GO:0050651 | dermatan sulfate proteoglycan biosynthetic process(GO:0050651) |
| 0.2 | 3.2 | GO:0048512 | circadian behavior(GO:0048512) |
| 0.2 | 1.2 | GO:0010457 | centriole-centriole cohesion(GO:0010457) |
| 0.2 | 0.5 | GO:0002268 | follicular dendritic cell differentiation(GO:0002268) |
| 0.2 | 4.8 | GO:0006884 | cell volume homeostasis(GO:0006884) |
| 0.2 | 5.2 | GO:0009880 | embryonic pattern specification(GO:0009880) |
| 0.2 | 2.3 | GO:0055075 | potassium ion homeostasis(GO:0055075) |
| 0.2 | 2.0 | GO:0070734 | histone H3-K27 methylation(GO:0070734) |
| 0.2 | 9.2 | GO:0048791 | calcium ion-regulated exocytosis of neurotransmitter(GO:0048791) |
| 0.2 | 0.4 | GO:0070316 | regulation of G0 to G1 transition(GO:0070316) |
| 0.2 | 0.4 | GO:0070272 | proton-transporting ATP synthase complex assembly(GO:0043461) proton-transporting ATP synthase complex biogenesis(GO:0070272) |
| 0.2 | 2.1 | GO:0032516 | positive regulation of phosphoprotein phosphatase activity(GO:0032516) |
| 0.2 | 10.0 | GO:0030212 | hyaluronan metabolic process(GO:0030212) |
| 0.2 | 1.1 | GO:0006657 | CDP-choline pathway(GO:0006657) |
| 0.2 | 1.0 | GO:1901350 | cell-cell signaling involved in cell-cell junction organization(GO:1901350) |
| 0.2 | 1.9 | GO:1990573 | potassium ion import across plasma membrane(GO:1990573) |
| 0.2 | 16.0 | GO:0007218 | neuropeptide signaling pathway(GO:0007218) |
| 0.2 | 1.2 | GO:1903232 | melanosome assembly(GO:1903232) |
| 0.2 | 0.4 | GO:0044340 | canonical Wnt signaling pathway involved in regulation of cell proliferation(GO:0044340) |
| 0.2 | 3.9 | GO:1902083 | negative regulation of peptidyl-cysteine S-nitrosylation(GO:1902083) |
| 0.2 | 1.0 | GO:0015959 | diadenosine polyphosphate metabolic process(GO:0015959) |
| 0.2 | 0.2 | GO:0009786 | regulation of asymmetric cell division(GO:0009786) |
| 0.2 | 1.4 | GO:0014824 | artery smooth muscle contraction(GO:0014824) |
| 0.2 | 2.8 | GO:0010603 | regulation of cytoplasmic mRNA processing body assembly(GO:0010603) |
| 0.2 | 1.0 | GO:0021796 | cerebral cortex regionalization(GO:0021796) |
| 0.2 | 5.5 | GO:0043276 | anoikis(GO:0043276) |
| 0.2 | 1.2 | GO:0071550 | death-inducing signaling complex assembly(GO:0071550) |
| 0.2 | 3.1 | GO:0035640 | exploration behavior(GO:0035640) |
| 0.2 | 1.4 | GO:0018026 | peptidyl-lysine monomethylation(GO:0018026) |
| 0.2 | 0.6 | GO:0009950 | dorsal/ventral axis specification(GO:0009950) |
| 0.2 | 0.6 | GO:0018076 | N-terminal peptidyl-lysine acetylation(GO:0018076) |
| 0.2 | 3.9 | GO:0032958 | inositol phosphate biosynthetic process(GO:0032958) |
| 0.2 | 5.4 | GO:0021954 | central nervous system neuron development(GO:0021954) |
| 0.2 | 0.4 | GO:0015860 | purine nucleoside transmembrane transport(GO:0015860) |
| 0.2 | 3.3 | GO:0002040 | sprouting angiogenesis(GO:0002040) |
| 0.2 | 1.4 | GO:0045987 | positive regulation of smooth muscle contraction(GO:0045987) |
| 0.2 | 1.8 | GO:0001955 | blood vessel maturation(GO:0001955) |
| 0.2 | 6.2 | GO:0014047 | glutamate secretion(GO:0014047) |
| 0.2 | 0.9 | GO:1904293 | negative regulation of ERAD pathway(GO:1904293) |
| 0.2 | 4.4 | GO:0051281 | positive regulation of release of sequestered calcium ion into cytosol(GO:0051281) |
| 0.2 | 0.3 | GO:0002326 | B cell lineage commitment(GO:0002326) |
| 0.2 | 5.8 | GO:1901385 | regulation of voltage-gated calcium channel activity(GO:1901385) |
| 0.2 | 1.9 | GO:0060689 | cell differentiation involved in salivary gland development(GO:0060689) |
| 0.2 | 1.4 | GO:0002175 | protein localization to paranode region of axon(GO:0002175) |
| 0.2 | 1.0 | GO:0014850 | response to muscle activity(GO:0014850) |
| 0.2 | 2.5 | GO:0097320 | membrane tubulation(GO:0097320) |
| 0.2 | 0.5 | GO:0033386 | geranylgeranyl diphosphate metabolic process(GO:0033385) geranylgeranyl diphosphate biosynthetic process(GO:0033386) peripheral nervous system neuron axonogenesis(GO:0048936) |
| 0.2 | 0.3 | GO:0003418 | growth plate cartilage chondrocyte differentiation(GO:0003418) |
| 0.2 | 3.7 | GO:0016578 | histone deubiquitination(GO:0016578) |
| 0.2 | 1.1 | GO:0045163 | clustering of voltage-gated potassium channels(GO:0045163) |
| 0.2 | 2.1 | GO:0048536 | spleen development(GO:0048536) |
| 0.1 | 0.4 | GO:0019556 | histidine catabolic process to glutamate and formamide(GO:0019556) histidine catabolic process to glutamate and formate(GO:0019557) formamide metabolic process(GO:0043606) |
| 0.1 | 1.5 | GO:0032495 | response to muramyl dipeptide(GO:0032495) |
| 0.1 | 3.7 | GO:0030890 | positive regulation of B cell proliferation(GO:0030890) |
| 0.1 | 1.8 | GO:0006450 | regulation of translational fidelity(GO:0006450) |
| 0.1 | 1.6 | GO:0010633 | negative regulation of epithelial cell migration(GO:0010633) |
| 0.1 | 3.9 | GO:0000083 | regulation of transcription involved in G1/S transition of mitotic cell cycle(GO:0000083) |
| 0.1 | 1.0 | GO:0070208 | protein heterotrimerization(GO:0070208) |
| 0.1 | 0.3 | GO:2000466 | negative regulation of glycogen (starch) synthase activity(GO:2000466) |
| 0.1 | 3.8 | GO:0006241 | CTP biosynthetic process(GO:0006241) CTP metabolic process(GO:0046036) |
| 0.1 | 1.5 | GO:0035999 | tetrahydrofolate interconversion(GO:0035999) |
| 0.1 | 1.9 | GO:0016973 | poly(A)+ mRNA export from nucleus(GO:0016973) |
| 0.1 | 0.7 | GO:0030259 | lipid glycosylation(GO:0030259) |
| 0.1 | 3.1 | GO:0045840 | positive regulation of mitotic nuclear division(GO:0045840) |
| 0.1 | 2.0 | GO:0007196 | adenylate cyclase-inhibiting G-protein coupled glutamate receptor signaling pathway(GO:0007196) |
| 0.1 | 2.0 | GO:0016576 | histone dephosphorylation(GO:0016576) |
| 0.1 | 2.8 | GO:1901685 | glutathione derivative metabolic process(GO:1901685) glutathione derivative biosynthetic process(GO:1901687) |
| 0.1 | 1.6 | GO:0042417 | dopamine metabolic process(GO:0042417) |
| 0.1 | 1.4 | GO:0036465 | synaptic vesicle recycling(GO:0036465) |
| 0.1 | 1.7 | GO:0021516 | dorsal spinal cord development(GO:0021516) |
| 0.1 | 0.5 | GO:0061668 | mitochondrial ribosome assembly(GO:0061668) mitochondrial large ribosomal subunit assembly(GO:1902775) |
| 0.1 | 0.4 | GO:0050758 | thymidylate synthase biosynthetic process(GO:0050757) regulation of thymidylate synthase biosynthetic process(GO:0050758) negative regulation of thymidylate synthase biosynthetic process(GO:0050760) |
| 0.1 | 1.9 | GO:2000369 | regulation of clathrin-mediated endocytosis(GO:2000369) |
| 0.1 | 1.0 | GO:0002029 | desensitization of G-protein coupled receptor protein signaling pathway(GO:0002029) negative adaptation of signaling pathway(GO:0022401) |
| 0.1 | 3.2 | GO:0019933 | cAMP-mediated signaling(GO:0019933) |
| 0.1 | 1.8 | GO:0018298 | protein-chromophore linkage(GO:0018298) |
| 0.1 | 1.2 | GO:0033235 | positive regulation of protein sumoylation(GO:0033235) |
| 0.1 | 1.1 | GO:0090136 | epithelial cell-cell adhesion(GO:0090136) |
| 0.1 | 0.4 | GO:0006288 | base-excision repair, DNA ligation(GO:0006288) |
| 0.1 | 1.4 | GO:0003197 | endocardial cushion development(GO:0003197) |
| 0.1 | 4.0 | GO:0072378 | blood coagulation, fibrin clot formation(GO:0072378) |
| 0.1 | 1.7 | GO:0050995 | negative regulation of lipid catabolic process(GO:0050995) |
| 0.1 | 1.2 | GO:0055003 | cardiac myofibril assembly(GO:0055003) |
| 0.1 | 4.3 | GO:0007602 | phototransduction(GO:0007602) |
| 0.1 | 2.6 | GO:0030488 | tRNA methylation(GO:0030488) |
| 0.1 | 1.3 | GO:0002042 | cell migration involved in sprouting angiogenesis(GO:0002042) |
| 0.1 | 3.1 | GO:0006198 | cAMP catabolic process(GO:0006198) |
| 0.1 | 0.4 | GO:0038007 | anterior/posterior axon guidance(GO:0033564) netrin-activated signaling pathway(GO:0038007) |
| 0.1 | 4.8 | GO:0046323 | glucose import(GO:0046323) |
| 0.1 | 0.4 | GO:0051797 | regulation of hair follicle development(GO:0051797) |
| 0.1 | 7.0 | GO:0006968 | cellular defense response(GO:0006968) |
| 0.1 | 0.9 | GO:1900017 | positive regulation of cytokine production involved in inflammatory response(GO:1900017) |
| 0.1 | 0.8 | GO:2000425 | regulation of apoptotic cell clearance(GO:2000425) |
| 0.1 | 2.2 | GO:0010107 | potassium ion import(GO:0010107) |
| 0.1 | 1.5 | GO:0050919 | negative chemotaxis(GO:0050919) |
| 0.1 | 2.5 | GO:0032008 | positive regulation of TOR signaling(GO:0032008) |
| 0.1 | 1.2 | GO:0006069 | ethanol oxidation(GO:0006069) |
| 0.1 | 1.2 | GO:0048265 | response to pain(GO:0048265) |
| 0.1 | 5.0 | GO:0006501 | C-terminal protein lipidation(GO:0006501) |
| 0.1 | 0.3 | GO:1902231 | positive regulation of intrinsic apoptotic signaling pathway in response to DNA damage(GO:1902231) |
| 0.1 | 1.0 | GO:0007258 | JUN phosphorylation(GO:0007258) |
| 0.1 | 1.7 | GO:0018146 | keratan sulfate biosynthetic process(GO:0018146) |
| 0.1 | 3.2 | GO:0019731 | antibacterial humoral response(GO:0019731) |
| 0.1 | 0.5 | GO:0010762 | regulation of fibroblast migration(GO:0010762) |
| 0.1 | 0.5 | GO:0070673 | response to interleukin-18(GO:0070673) |
| 0.1 | 0.6 | GO:0050951 | sensory perception of temperature stimulus(GO:0050951) |
| 0.1 | 3.1 | GO:0002260 | lymphocyte homeostasis(GO:0002260) |
| 0.1 | 0.8 | GO:0046459 | short-chain fatty acid metabolic process(GO:0046459) |
| 0.1 | 3.2 | GO:0007257 | activation of JUN kinase activity(GO:0007257) |
| 0.1 | 1.3 | GO:0097623 | potassium ion export across plasma membrane(GO:0097623) |
| 0.1 | 1.6 | GO:0036092 | phosphatidylinositol-3-phosphate biosynthetic process(GO:0036092) |
| 0.1 | 2.5 | GO:0007274 | neuromuscular synaptic transmission(GO:0007274) |
| 0.1 | 1.1 | GO:0030388 | fructose 1,6-bisphosphate metabolic process(GO:0030388) |
| 0.1 | 1.7 | GO:0048009 | insulin-like growth factor receptor signaling pathway(GO:0048009) |
| 0.1 | 0.6 | GO:0015851 | nucleobase transport(GO:0015851) |
| 0.1 | 1.2 | GO:0061436 | establishment of skin barrier(GO:0061436) |
| 0.1 | 3.6 | GO:0050909 | sensory perception of taste(GO:0050909) |
| 0.1 | 0.5 | GO:0036152 | phosphatidylethanolamine acyl-chain remodeling(GO:0036152) |
| 0.1 | 1.2 | GO:0006600 | creatine metabolic process(GO:0006600) |
| 0.1 | 2.8 | GO:0043252 | sodium-independent organic anion transport(GO:0043252) |
| 0.1 | 1.5 | GO:0043551 | regulation of phosphatidylinositol 3-kinase activity(GO:0043551) |
| 0.1 | 1.5 | GO:0014003 | oligodendrocyte development(GO:0014003) |
| 0.1 | 0.2 | GO:1900383 | regulation of synaptic plasticity by receptor localization to synapse(GO:1900383) |
| 0.1 | 0.5 | GO:0002933 | lipid hydroxylation(GO:0002933) |
| 0.1 | 2.0 | GO:0043268 | positive regulation of potassium ion transport(GO:0043268) |
| 0.1 | 1.7 | GO:0045332 | lipid translocation(GO:0034204) phospholipid translocation(GO:0045332) |
| 0.1 | 1.0 | GO:1901750 | leukotriene D4 metabolic process(GO:1901748) leukotriene D4 biosynthetic process(GO:1901750) |
| 0.1 | 1.0 | GO:0002027 | regulation of heart rate(GO:0002027) |
| 0.1 | 1.4 | GO:0033540 | fatty acid beta-oxidation using acyl-CoA oxidase(GO:0033540) |
| 0.1 | 0.2 | GO:0045591 | positive regulation of regulatory T cell differentiation(GO:0045591) |
| 0.1 | 0.3 | GO:0034628 | nicotinamide nucleotide biosynthetic process from aspartate(GO:0019355) 'de novo' NAD biosynthetic process(GO:0034627) 'de novo' NAD biosynthetic process from aspartate(GO:0034628) |
| 0.1 | 1.5 | GO:0019372 | lipoxygenase pathway(GO:0019372) |
| 0.1 | 0.6 | GO:1900028 | negative regulation of ruffle assembly(GO:1900028) |
| 0.1 | 1.3 | GO:0030513 | positive regulation of BMP signaling pathway(GO:0030513) |
| 0.1 | 0.5 | GO:0018401 | peptidyl-proline hydroxylation to 4-hydroxy-L-proline(GO:0018401) |
| 0.1 | 7.6 | GO:0050953 | sensory perception of light stimulus(GO:0050953) |
| 0.1 | 1.5 | GO:0009435 | NAD biosynthetic process(GO:0009435) |
| 0.1 | 0.4 | GO:0030050 | vesicle transport along actin filament(GO:0030050) |
| 0.1 | 0.3 | GO:0033353 | S-adenosylmethionine cycle(GO:0033353) |
| 0.1 | 0.3 | GO:0006686 | sphingomyelin biosynthetic process(GO:0006686) |
| 0.1 | 0.7 | GO:0086046 | membrane depolarization during SA node cell action potential(GO:0086046) |
| 0.1 | 0.1 | GO:0036124 | histone H3-K9 trimethylation(GO:0036124) |
| 0.1 | 1.1 | GO:0006517 | protein deglycosylation(GO:0006517) |
| 0.1 | 0.3 | GO:0043518 | negative regulation of DNA damage response, signal transduction by p53 class mediator(GO:0043518) |
| 0.1 | 0.3 | GO:0097264 | self proteolysis(GO:0097264) |
| 0.1 | 0.8 | GO:0007398 | ectoderm development(GO:0007398) |
| 0.0 | 0.7 | GO:0006895 | Golgi to endosome transport(GO:0006895) |
| 0.0 | 1.6 | GO:0051282 | release of sequestered calcium ion into cytosol(GO:0051209) regulation of sequestering of calcium ion(GO:0051282) negative regulation of sequestering of calcium ion(GO:0051283) |
| 0.0 | 1.8 | GO:0007214 | gamma-aminobutyric acid signaling pathway(GO:0007214) |
| 0.0 | 1.1 | GO:0046597 | negative regulation of viral entry into host cell(GO:0046597) |
| 0.0 | 4.5 | GO:0030449 | regulation of complement activation(GO:0030449) regulation of protein activation cascade(GO:2000257) |
| 0.0 | 0.7 | GO:0003334 | keratinocyte development(GO:0003334) |
| 0.0 | 0.8 | GO:2000649 | regulation of sodium ion transmembrane transporter activity(GO:2000649) |
| 0.0 | 0.7 | GO:0010596 | negative regulation of endothelial cell migration(GO:0010596) |
| 0.0 | 0.1 | GO:0072114 | regulation of kidney size(GO:0035564) regulation of pronephros size(GO:0035565) pronephros morphogenesis(GO:0072114) |
| 0.0 | 1.4 | GO:0034308 | primary alcohol metabolic process(GO:0034308) |
| 0.0 | 2.6 | GO:0007612 | learning(GO:0007612) |
| 0.0 | 0.3 | GO:0042533 | tumor necrosis factor biosynthetic process(GO:0042533) regulation of tumor necrosis factor biosynthetic process(GO:0042534) |
| 0.0 | 0.8 | GO:0042059 | negative regulation of epidermal growth factor receptor signaling pathway(GO:0042059) |
| 0.0 | 2.0 | GO:0030101 | natural killer cell activation(GO:0030101) |
| 0.0 | 1.1 | GO:1901379 | regulation of potassium ion transmembrane transport(GO:1901379) |
| 0.0 | 12.8 | GO:0043547 | positive regulation of GTPase activity(GO:0043547) |
| 0.0 | 1.4 | GO:0019233 | sensory perception of pain(GO:0019233) |
| 0.0 | 0.1 | GO:0048840 | otolith development(GO:0048840) |
| 0.0 | 2.7 | GO:0007156 | homophilic cell adhesion via plasma membrane adhesion molecules(GO:0007156) |
| 0.0 | 0.1 | GO:0097428 | protein maturation by iron-sulfur cluster transfer(GO:0097428) |
| 0.0 | 0.7 | GO:0007200 | phospholipase C-activating G-protein coupled receptor signaling pathway(GO:0007200) |
| 0.0 | 0.1 | GO:0030327 | prenylated protein catabolic process(GO:0030327) |
| 0.0 | 0.3 | GO:0035904 | aorta development(GO:0035904) |
Gene overrepresentation in cellular component category:
| Log-likelihood per target | Total log-likelihood | Term | Description |
|---|---|---|---|
| 12.2 | 36.5 | GO:0097224 | sperm connecting piece(GO:0097224) |
| 10.3 | 31.0 | GO:0090571 | RNA polymerase II transcription repressor complex(GO:0090571) |
| 7.6 | 22.7 | GO:0009328 | phenylalanine-tRNA ligase complex(GO:0009328) |
| 6.9 | 48.6 | GO:0030893 | meiotic cohesin complex(GO:0030893) |
| 5.9 | 53.2 | GO:0090576 | RNA polymerase III transcription factor complex(GO:0090576) |
| 5.7 | 17.2 | GO:0055028 | cortical microtubule(GO:0055028) mitotic spindle astral microtubule(GO:0061673) |
| 5.4 | 48.8 | GO:0001520 | outer dense fiber(GO:0001520) |
| 5.2 | 57.3 | GO:0030061 | mitochondrial crista(GO:0030061) |
| 5.2 | 20.7 | GO:0070695 | FHF complex(GO:0070695) |
| 5.1 | 20.3 | GO:0033263 | CORVET complex(GO:0033263) |
| 4.7 | 14.2 | GO:0097229 | sperm end piece(GO:0097229) |
| 4.1 | 37.1 | GO:0097427 | microtubule bundle(GO:0097427) |
| 4.1 | 16.2 | GO:0032777 | Piccolo NuA4 histone acetyltransferase complex(GO:0032777) |
| 3.8 | 30.3 | GO:0032593 | insulin-responsive compartment(GO:0032593) |
| 3.7 | 69.5 | GO:0016461 | unconventional myosin complex(GO:0016461) |
| 3.5 | 14.0 | GO:0002945 | cyclin K-CDK13 complex(GO:0002945) |
| 3.3 | 10.0 | GO:0098536 | deuterosome(GO:0098536) |
| 3.2 | 34.9 | GO:0070775 | H3 histone acetyltransferase complex(GO:0070775) MOZ/MORF histone acetyltransferase complex(GO:0070776) |
| 3.1 | 9.4 | GO:0000333 | telomerase catalytic core complex(GO:0000333) |
| 2.9 | 11.5 | GO:0034365 | discoidal high-density lipoprotein particle(GO:0034365) |
| 2.5 | 28.0 | GO:0098651 | basement membrane collagen trimer(GO:0098651) |
| 2.4 | 21.6 | GO:0044294 | dendritic growth cone(GO:0044294) |
| 2.2 | 8.9 | GO:0035363 | histone locus body(GO:0035363) |
| 2.2 | 4.3 | GO:0005683 | U7 snRNP(GO:0005683) |
| 2.1 | 12.8 | GO:0031501 | mannosyltransferase complex(GO:0031501) |
| 2.1 | 19.1 | GO:0000137 | Golgi cis cisterna(GO:0000137) |
| 2.1 | 18.5 | GO:0005672 | transcription factor TFIIA complex(GO:0005672) |
| 2.0 | 2.0 | GO:0000138 | Golgi trans cisterna(GO:0000138) |
| 2.0 | 6.1 | GO:0035189 | Rb-E2F complex(GO:0035189) |
| 2.0 | 24.4 | GO:0016602 | CCAAT-binding factor complex(GO:0016602) |
| 2.0 | 10.1 | GO:0060200 | clathrin-sculpted acetylcholine transport vesicle(GO:0060200) clathrin-sculpted acetylcholine transport vesicle membrane(GO:0060201) |
| 2.0 | 12.2 | GO:0097129 | cyclin D2-CDK4 complex(GO:0097129) |
| 2.0 | 28.3 | GO:0048188 | Set1C/COMPASS complex(GO:0048188) |
| 2.0 | 5.9 | GO:0044611 | nuclear pore inner ring(GO:0044611) |
| 1.9 | 7.7 | GO:0060199 | clathrin-sculpted glutamate transport vesicle(GO:0060199) clathrin-sculpted glutamate transport vesicle membrane(GO:0060203) |
| 1.8 | 8.9 | GO:0030896 | checkpoint clamp complex(GO:0030896) |
| 1.8 | 7.0 | GO:0008275 | gamma-tubulin small complex(GO:0008275) |
| 1.7 | 6.7 | GO:0036128 | CatSper complex(GO:0036128) |
| 1.6 | 21.4 | GO:0005915 | zonula adherens(GO:0005915) |
| 1.6 | 14.6 | GO:0033391 | chromatoid body(GO:0033391) |
| 1.6 | 9.4 | GO:1990584 | cardiac Troponin complex(GO:1990584) |
| 1.6 | 10.9 | GO:0035686 | sperm fibrous sheath(GO:0035686) |
| 1.5 | 6.2 | GO:1990393 | 3M complex(GO:1990393) |
| 1.5 | 8.9 | GO:0014802 | terminal cisterna(GO:0014802) |
| 1.4 | 4.2 | GO:0030991 | intraciliary transport particle A(GO:0030991) |
| 1.4 | 5.6 | GO:0071942 | XPC complex(GO:0071942) |
| 1.4 | 22.1 | GO:0030914 | STAGA complex(GO:0030914) |
| 1.3 | 12.1 | GO:0072687 | meiotic spindle(GO:0072687) |
| 1.3 | 7.9 | GO:0002177 | manchette(GO:0002177) |
| 1.3 | 3.9 | GO:0016533 | cyclin-dependent protein kinase 5 holoenzyme complex(GO:0016533) |
| 1.3 | 10.4 | GO:0097425 | smooth endoplasmic reticulum membrane(GO:0030868) smooth endoplasmic reticulum part(GO:0097425) |
| 1.3 | 16.6 | GO:0034993 | microtubule organizing center attachment site(GO:0034992) LINC complex(GO:0034993) |
| 1.2 | 4.8 | GO:1990075 | periciliary membrane compartment(GO:1990075) |
| 1.1 | 50.0 | GO:0097546 | ciliary base(GO:0097546) |
| 1.1 | 36.8 | GO:0035861 | site of double-strand break(GO:0035861) |
| 1.1 | 3.2 | GO:0099569 | cytoskeleton of presynaptic active zone(GO:0048788) presynaptic active zone cytoplasmic component(GO:0098831) presynaptic cytoskeleton(GO:0099569) |
| 1.1 | 9.7 | GO:0070652 | HAUS complex(GO:0070652) |
| 1.0 | 12.3 | GO:0098839 | postsynaptic density membrane(GO:0098839) |
| 1.0 | 15.1 | GO:0043083 | synaptic cleft(GO:0043083) |
| 1.0 | 13.0 | GO:0097413 | Lewy body(GO:0097413) |
| 1.0 | 5.0 | GO:1990031 | pinceau fiber(GO:1990031) |
| 1.0 | 15.6 | GO:0035102 | PRC1 complex(GO:0035102) |
| 1.0 | 10.6 | GO:0035692 | macrophage migration inhibitory factor receptor complex(GO:0035692) |
| 0.9 | 6.6 | GO:0000124 | SAGA complex(GO:0000124) |
| 0.9 | 5.6 | GO:0034673 | inhibin-betaglycan-ActRII complex(GO:0034673) |
| 0.9 | 2.7 | GO:0000805 | X chromosome(GO:0000805) |
| 0.9 | 44.1 | GO:0016235 | aggresome(GO:0016235) |
| 0.9 | 8.0 | GO:0032391 | photoreceptor connecting cilium(GO:0032391) |
| 0.9 | 15.6 | GO:0000242 | pericentriolar material(GO:0000242) |
| 0.9 | 6.9 | GO:0072487 | MSL complex(GO:0072487) |
| 0.8 | 22.7 | GO:0005682 | U5 snRNP(GO:0005682) |
| 0.8 | 8.4 | GO:0043203 | axon hillock(GO:0043203) |
| 0.8 | 9.7 | GO:0000800 | lateral element(GO:0000800) |
| 0.8 | 22.4 | GO:0005680 | anaphase-promoting complex(GO:0005680) |
| 0.8 | 8.0 | GO:0097443 | sorting endosome(GO:0097443) |
| 0.8 | 29.1 | GO:0030173 | integral component of Golgi membrane(GO:0030173) |
| 0.8 | 6.3 | GO:0044327 | dendritic spine head(GO:0044327) |
| 0.8 | 10.1 | GO:0008385 | IkappaB kinase complex(GO:0008385) |
| 0.8 | 1.5 | GO:0031205 | endoplasmic reticulum Sec complex(GO:0031205) |
| 0.8 | 3.0 | GO:1990578 | perinuclear endoplasmic reticulum membrane(GO:1990578) |
| 0.7 | 5.9 | GO:0030430 | host cell cytoplasm(GO:0030430) host cell cytoplasm part(GO:0033655) |
| 0.7 | 24.0 | GO:0030132 | clathrin coat of coated pit(GO:0030132) |
| 0.7 | 14.3 | GO:0031089 | platelet dense granule lumen(GO:0031089) |
| 0.7 | 4.9 | GO:1990130 | Iml1 complex(GO:1990130) |
| 0.7 | 19.5 | GO:0030131 | clathrin adaptor complex(GO:0030131) |
| 0.7 | 6.2 | GO:0072546 | ER membrane protein complex(GO:0072546) |
| 0.7 | 1.4 | GO:0098592 | cytoplasmic side of apical plasma membrane(GO:0098592) |
| 0.7 | 3.4 | GO:0032302 | MutSbeta complex(GO:0032302) |
| 0.7 | 12.9 | GO:0036038 | MKS complex(GO:0036038) |
| 0.7 | 4.0 | GO:0048787 | presynaptic active zone membrane(GO:0048787) |
| 0.7 | 2.0 | GO:0030906 | retromer, cargo-selective complex(GO:0030906) |
| 0.7 | 4.7 | GO:0002116 | semaphorin receptor complex(GO:0002116) |
| 0.7 | 22.2 | GO:0034451 | centriolar satellite(GO:0034451) |
| 0.6 | 3.1 | GO:0035838 | growing cell tip(GO:0035838) |
| 0.6 | 12.2 | GO:0097025 | MPP7-DLG1-LIN7 complex(GO:0097025) |
| 0.6 | 1.2 | GO:1903349 | omegasome membrane(GO:1903349) |
| 0.6 | 10.7 | GO:0042622 | photoreceptor outer segment membrane(GO:0042622) |
| 0.6 | 18.5 | GO:0034706 | sodium channel complex(GO:0034706) |
| 0.6 | 2.4 | GO:0005889 | hydrogen:potassium-exchanging ATPase complex(GO:0005889) |
| 0.6 | 1.8 | GO:0097058 | CRLF-CLCF1 complex(GO:0097058) |
| 0.6 | 3.5 | GO:0060091 | kinocilium(GO:0060091) |
| 0.6 | 2.3 | GO:0033596 | TSC1-TSC2 complex(GO:0033596) |
| 0.6 | 1.7 | GO:0005944 | phosphatidylinositol 3-kinase complex, class IB(GO:0005944) |
| 0.6 | 3.4 | GO:0033063 | DNA recombinase mediator complex(GO:0033061) Rad51B-Rad51C-Rad51D-XRCC2 complex(GO:0033063) |
| 0.6 | 2.8 | GO:0032449 | CBM complex(GO:0032449) |
| 0.6 | 5.0 | GO:0031414 | N-terminal protein acetyltransferase complex(GO:0031414) |
| 0.5 | 25.5 | GO:0036064 | ciliary basal body(GO:0036064) |
| 0.5 | 13.4 | GO:0014731 | spectrin-associated cytoskeleton(GO:0014731) |
| 0.5 | 3.2 | GO:0005827 | polar microtubule(GO:0005827) |
| 0.5 | 23.3 | GO:0048786 | presynaptic active zone(GO:0048786) |
| 0.5 | 17.0 | GO:0042629 | mast cell granule(GO:0042629) |
| 0.5 | 1.0 | GO:0030130 | clathrin coat of trans-Golgi network vesicle(GO:0030130) |
| 0.5 | 16.2 | GO:0080008 | Cul4-RING E3 ubiquitin ligase complex(GO:0080008) |
| 0.5 | 18.7 | GO:0030660 | Golgi-associated vesicle membrane(GO:0030660) |
| 0.5 | 5.5 | GO:0043240 | Fanconi anaemia nuclear complex(GO:0043240) |
| 0.5 | 3.2 | GO:0036157 | outer dynein arm(GO:0036157) |
| 0.4 | 4.0 | GO:0071953 | elastic fiber(GO:0071953) |
| 0.4 | 33.4 | GO:0099501 | synaptic vesicle membrane(GO:0030672) exocytic vesicle membrane(GO:0099501) |
| 0.4 | 1.7 | GO:0032937 | SREBP-SCAP-Insig complex(GO:0032937) |
| 0.4 | 2.9 | GO:1990909 | Wnt signalosome(GO:1990909) |
| 0.4 | 2.8 | GO:0008024 | cyclin/CDK positive transcription elongation factor complex(GO:0008024) |
| 0.4 | 1.2 | GO:1990597 | AIP1-IRE1 complex(GO:1990597) |
| 0.4 | 2.0 | GO:0097513 | myosin II filament(GO:0097513) |
| 0.4 | 5.9 | GO:0030478 | actin cap(GO:0030478) |
| 0.4 | 2.8 | GO:0044666 | MLL3/4 complex(GO:0044666) |
| 0.4 | 2.0 | GO:0034448 | EGO complex(GO:0034448) Gtr1-Gtr2 GTPase complex(GO:1990131) |
| 0.4 | 1.9 | GO:1902937 | inward rectifier potassium channel complex(GO:1902937) |
| 0.4 | 0.4 | GO:0070044 | synaptobrevin 2-SNAP-25-syntaxin-1a complex(GO:0070044) |
| 0.4 | 1.5 | GO:0072558 | NLRP1 inflammasome complex(GO:0072558) |
| 0.4 | 50.5 | GO:0034705 | voltage-gated potassium channel complex(GO:0008076) potassium channel complex(GO:0034705) |
| 0.3 | 34.3 | GO:0044450 | microtubule organizing center part(GO:0044450) |
| 0.3 | 3.0 | GO:0033268 | node of Ranvier(GO:0033268) |
| 0.3 | 1.3 | GO:0045180 | basal cortex(GO:0045180) |
| 0.3 | 5.2 | GO:0005890 | sodium:potassium-exchanging ATPase complex(GO:0005890) |
| 0.3 | 1.0 | GO:0034686 | integrin alphav-beta8 complex(GO:0034686) |
| 0.3 | 1.6 | GO:0044326 | dendritic spine neck(GO:0044326) |
| 0.3 | 3.9 | GO:0016013 | syntrophin complex(GO:0016013) |
| 0.3 | 6.0 | GO:0030877 | beta-catenin destruction complex(GO:0030877) |
| 0.3 | 0.3 | GO:0070522 | ERCC4-ERCC1 complex(GO:0070522) |
| 0.3 | 1.3 | GO:0032584 | growth cone membrane(GO:0032584) |
| 0.3 | 6.6 | GO:0034045 | pre-autophagosomal structure membrane(GO:0034045) |
| 0.3 | 1.5 | GO:0044224 | juxtaparanode region of axon(GO:0044224) |
| 0.3 | 0.9 | GO:0072379 | BAT3 complex(GO:0071818) ER membrane insertion complex(GO:0072379) |
| 0.3 | 10.4 | GO:0031594 | neuromuscular junction(GO:0031594) |
| 0.3 | 1.7 | GO:0030123 | AP-3 adaptor complex(GO:0030123) |
| 0.3 | 5.6 | GO:0042627 | chylomicron(GO:0042627) |
| 0.3 | 4.2 | GO:0031235 | intrinsic component of the cytoplasmic side of the plasma membrane(GO:0031235) |
| 0.3 | 1.7 | GO:0044214 | spanning component of plasma membrane(GO:0044214) spanning component of membrane(GO:0089717) |
| 0.3 | 15.8 | GO:0045334 | clathrin-coated endocytic vesicle(GO:0045334) |
| 0.3 | 0.8 | GO:0051286 | cell tip(GO:0051286) |
| 0.3 | 1.3 | GO:0032444 | activin responsive factor complex(GO:0032444) |
| 0.3 | 0.8 | GO:0071062 | alphav-beta3 integrin-vitronectin complex(GO:0071062) |
| 0.3 | 1.6 | GO:0034751 | aryl hydrocarbon receptor complex(GO:0034751) |
| 0.3 | 3.6 | GO:0000145 | exocyst(GO:0000145) |
| 0.3 | 1.0 | GO:0005968 | Rab-protein geranylgeranyltransferase complex(GO:0005968) |
| 0.3 | 3.0 | GO:0030008 | TRAPP complex(GO:0030008) |
| 0.2 | 0.7 | GO:0016938 | kinesin I complex(GO:0016938) |
| 0.2 | 31.4 | GO:0016605 | PML body(GO:0016605) |
| 0.2 | 3.7 | GO:0045009 | melanosome membrane(GO:0033162) chitosome(GO:0045009) |
| 0.2 | 1.2 | GO:0072534 | perineuronal net(GO:0072534) |
| 0.2 | 1.4 | GO:0005945 | 6-phosphofructokinase complex(GO:0005945) |
| 0.2 | 2.3 | GO:0005883 | neurofilament(GO:0005883) |
| 0.2 | 2.7 | GO:0005662 | DNA replication factor A complex(GO:0005662) |
| 0.2 | 3.8 | GO:0032281 | AMPA glutamate receptor complex(GO:0032281) |
| 0.2 | 1.3 | GO:0033256 | I-kappaB/NF-kappaB complex(GO:0033256) |
| 0.2 | 16.6 | GO:0005776 | autophagosome(GO:0005776) |
| 0.2 | 2.2 | GO:0005614 | interstitial matrix(GO:0005614) |
| 0.2 | 8.5 | GO:0097014 | axoneme(GO:0005930) ciliary plasm(GO:0097014) |
| 0.2 | 2.5 | GO:0031209 | SCAR complex(GO:0031209) |
| 0.2 | 6.0 | GO:0005892 | acetylcholine-gated channel complex(GO:0005892) |
| 0.2 | 31.4 | GO:0032587 | ruffle membrane(GO:0032587) |
| 0.2 | 10.5 | GO:0005891 | voltage-gated calcium channel complex(GO:0005891) |
| 0.2 | 12.5 | GO:0035577 | azurophil granule membrane(GO:0035577) |
| 0.2 | 9.7 | GO:0033017 | sarcoplasmic reticulum membrane(GO:0033017) |
| 0.2 | 5.4 | GO:0060170 | ciliary membrane(GO:0060170) |
| 0.2 | 2.6 | GO:0044295 | axonal growth cone(GO:0044295) |
| 0.2 | 0.7 | GO:0042406 | extrinsic component of endoplasmic reticulum membrane(GO:0042406) |
| 0.2 | 24.3 | GO:0043296 | apical junction complex(GO:0043296) |
| 0.2 | 3.9 | GO:0001917 | photoreceptor inner segment(GO:0001917) |
| 0.2 | 0.7 | GO:0020018 | ciliary pocket(GO:0020016) ciliary pocket membrane(GO:0020018) |
| 0.2 | 0.9 | GO:0000835 | ER ubiquitin ligase complex(GO:0000835) Hrd1p ubiquitin ligase complex(GO:0000836) |
| 0.2 | 5.2 | GO:0032420 | stereocilium(GO:0032420) |
| 0.2 | 0.6 | GO:0038039 | G-protein coupled receptor heterodimeric complex(GO:0038039) |
| 0.2 | 7.1 | GO:0001533 | cornified envelope(GO:0001533) |
| 0.1 | 0.7 | GO:0032807 | DNA ligase IV complex(GO:0032807) |
| 0.1 | 11.7 | GO:0005581 | collagen trimer(GO:0005581) |
| 0.1 | 7.7 | GO:0042734 | presynaptic membrane(GO:0042734) |
| 0.1 | 2.3 | GO:0005922 | connexon complex(GO:0005922) |
| 0.1 | 4.5 | GO:0005865 | striated muscle thin filament(GO:0005865) |
| 0.1 | 1.9 | GO:0035631 | CD40 receptor complex(GO:0035631) |
| 0.1 | 0.4 | GO:1990761 | growth cone lamellipodium(GO:1990761) |
| 0.1 | 11.0 | GO:0001726 | ruffle(GO:0001726) |
| 0.1 | 1.2 | GO:0005845 | mRNA cap binding complex(GO:0005845) |
| 0.1 | 1.6 | GO:0005751 | mitochondrial respiratory chain complex IV(GO:0005751) |
| 0.1 | 9.1 | GO:0035580 | specific granule lumen(GO:0035580) |
| 0.1 | 12.9 | GO:0043204 | perikaryon(GO:0043204) |
| 0.1 | 1.6 | GO:0008074 | guanylate cyclase complex, soluble(GO:0008074) |
| 0.1 | 0.5 | GO:0033269 | internode region of axon(GO:0033269) |
| 0.1 | 0.4 | GO:0031673 | H zone(GO:0031673) |
| 0.1 | 0.4 | GO:1990907 | beta-catenin-TCF complex(GO:1990907) |
| 0.1 | 3.5 | GO:0031904 | endosome lumen(GO:0031904) |
| 0.1 | 0.5 | GO:0035859 | Seh1-associated complex(GO:0035859) |
| 0.1 | 7.8 | GO:0005796 | Golgi lumen(GO:0005796) |
| 0.1 | 16.6 | GO:0005578 | proteinaceous extracellular matrix(GO:0005578) |
| 0.1 | 0.2 | GO:0002079 | inner acrosomal membrane(GO:0002079) |
| 0.1 | 25.2 | GO:0005667 | transcription factor complex(GO:0005667) |
| 0.1 | 0.5 | GO:0005767 | secondary lysosome(GO:0005767) phagolysosome(GO:0032010) |
| 0.1 | 2.4 | GO:0001772 | immunological synapse(GO:0001772) |
| 0.1 | 2.3 | GO:1902711 | GABA receptor complex(GO:1902710) GABA-A receptor complex(GO:1902711) |
| 0.1 | 0.1 | GO:0043196 | varicosity(GO:0043196) |
| 0.1 | 4.9 | GO:0016459 | myosin complex(GO:0016459) |
| 0.1 | 0.2 | GO:0030289 | protein phosphatase 4 complex(GO:0030289) |
| 0.1 | 0.5 | GO:0042587 | glycogen granule(GO:0042587) |
| 0.1 | 2.1 | GO:0016592 | mediator complex(GO:0016592) |
| 0.1 | 1.0 | GO:0005605 | basal lamina(GO:0005605) |
| 0.0 | 0.5 | GO:0005664 | origin recognition complex(GO:0000808) nuclear origin of replication recognition complex(GO:0005664) |
| 0.0 | 1.2 | GO:0051233 | spindle midzone(GO:0051233) |
| 0.0 | 2.4 | GO:0031463 | Cul3-RING ubiquitin ligase complex(GO:0031463) |
| 0.0 | 1.4 | GO:0005905 | clathrin-coated pit(GO:0005905) |
| 0.0 | 3.1 | GO:0001669 | acrosomal vesicle(GO:0001669) |
| 0.0 | 1.2 | GO:0036126 | sperm flagellum(GO:0036126) |
| 0.0 | 1.5 | GO:0030175 | filopodium(GO:0030175) |
| 0.0 | 1.2 | GO:0045095 | keratin filament(GO:0045095) |
| 0.0 | 8.0 | GO:0016323 | basolateral plasma membrane(GO:0016323) |
| 0.0 | 6.9 | GO:0043235 | receptor complex(GO:0043235) |
| 0.0 | 0.3 | GO:0030688 | preribosome, small subunit precursor(GO:0030688) |
| 0.0 | 4.0 | GO:0031225 | anchored component of membrane(GO:0031225) |
| 0.0 | 0.7 | GO:0031514 | motile cilium(GO:0031514) |
| 0.0 | 0.2 | GO:0097136 | Bcl-2 family protein complex(GO:0097136) |
| 0.0 | 0.3 | GO:0044300 | cerebellar mossy fiber(GO:0044300) |
| 0.0 | 0.7 | GO:0005779 | integral component of peroxisomal membrane(GO:0005779) intrinsic component of peroxisomal membrane(GO:0031231) |
| 0.0 | 0.2 | GO:0008091 | spectrin(GO:0008091) |
| 0.0 | 0.3 | GO:0030673 | axolemma(GO:0030673) |
| 0.0 | 0.1 | GO:0001652 | granular component(GO:0001652) |
| 0.0 | 0.2 | GO:0001750 | photoreceptor outer segment(GO:0001750) |
Gene overrepresentation in molecular function category:
| Log-likelihood per target | Total log-likelihood | Term | Description |
|---|---|---|---|
| 13.3 | 53.2 | GO:0000995 | transcription factor activity, core RNA polymerase III binding(GO:0000995) |
| 10.8 | 96.8 | GO:0016206 | catechol O-methyltransferase activity(GO:0016206) |
| 9.5 | 28.5 | GO:0032093 | SAM domain binding(GO:0032093) |
| 7.4 | 37.0 | GO:0042903 | tubulin deacetylase activity(GO:0042903) |
| 6.8 | 27.1 | GO:0004667 | prostaglandin-D synthase activity(GO:0004667) |
| 6.4 | 25.6 | GO:0032184 | SUMO polymer binding(GO:0032184) |
| 6.1 | 36.8 | GO:0016929 | SUMO-specific protease activity(GO:0016929) |
| 5.7 | 40.2 | GO:0004169 | dolichyl-phosphate-mannose-protein mannosyltransferase activity(GO:0004169) |
| 4.8 | 33.4 | GO:0000155 | phosphorelay sensor kinase activity(GO:0000155) |
| 4.7 | 14.2 | GO:0008321 | Ral guanyl-nucleotide exchange factor activity(GO:0008321) |
| 4.7 | 23.3 | GO:0070097 | delta-catenin binding(GO:0070097) |
| 4.5 | 22.7 | GO:0004826 | phenylalanine-tRNA ligase activity(GO:0004826) |
| 4.4 | 22.1 | GO:0004370 | glycerol kinase activity(GO:0004370) |
| 4.3 | 73.7 | GO:0015095 | magnesium ion transmembrane transporter activity(GO:0015095) |
| 4.3 | 12.8 | GO:0004584 | dolichyl-phosphate-mannose-glycolipid alpha-mannosyltransferase activity(GO:0004584) |
| 3.8 | 15.1 | GO:0035033 | histone deacetylase regulator activity(GO:0035033) |
| 3.7 | 36.5 | GO:0032027 | myosin light chain binding(GO:0032027) |
| 3.7 | 25.6 | GO:0043812 | phosphatidylinositol-4-phosphate phosphatase activity(GO:0043812) |
| 3.5 | 13.9 | GO:0047192 | 1-alkylglycerophosphocholine O-acetyltransferase activity(GO:0047192) |
| 3.2 | 19.5 | GO:0035252 | UDP-xylosyltransferase activity(GO:0035252) xylosyltransferase activity(GO:0042285) |
| 3.2 | 12.7 | GO:0004687 | myosin light chain kinase activity(GO:0004687) |
| 3.1 | 27.7 | GO:0055131 | C3HC4-type RING finger domain binding(GO:0055131) |
| 3.0 | 17.8 | GO:0004489 | methylenetetrahydrofolate reductase (NAD(P)H) activity(GO:0004489) |
| 3.0 | 17.8 | GO:0003873 | 6-phosphofructo-2-kinase activity(GO:0003873) |
| 2.9 | 11.8 | GO:0019770 | IgG receptor activity(GO:0019770) |
| 2.8 | 14.2 | GO:0034647 | histone demethylase activity (H3-trimethyl-K4 specific)(GO:0034647) |
| 2.8 | 8.5 | GO:0033142 | progesterone receptor binding(GO:0033142) |
| 2.8 | 11.3 | GO:0001626 | nociceptin receptor activity(GO:0001626) |
| 2.8 | 16.7 | GO:0017040 | ceramidase activity(GO:0017040) |
| 2.8 | 11.1 | GO:0000822 | inositol hexakisphosphate binding(GO:0000822) |
| 2.7 | 2.7 | GO:0001537 | N-acetylgalactosamine 4-O-sulfotransferase activity(GO:0001537) |
| 2.7 | 8.0 | GO:1904455 | ubiquitin-specific protease activity involved in negative regulation of ERAD pathway(GO:1904455) |
| 2.7 | 13.3 | GO:0061676 | importin-alpha family protein binding(GO:0061676) |
| 2.6 | 18.0 | GO:0008481 | sphinganine kinase activity(GO:0008481) D-erythro-sphingosine kinase activity(GO:0017050) |
| 2.4 | 7.3 | GO:0015199 | amino-acid betaine transmembrane transporter activity(GO:0015199) carnitine transmembrane transporter activity(GO:0015226) |
| 2.4 | 12.1 | GO:0005052 | peroxisome matrix targeting signal-1 binding(GO:0005052) |
| 2.4 | 24.2 | GO:0051011 | microtubule minus-end binding(GO:0051011) |
| 2.4 | 9.6 | GO:0016434 | rRNA (cytosine) methyltransferase activity(GO:0016434) |
| 2.4 | 7.2 | GO:0047977 | hepoxilin-epoxide hydrolase activity(GO:0047977) |
| 2.3 | 16.4 | GO:0010997 | anaphase-promoting complex binding(GO:0010997) |
| 2.3 | 13.8 | GO:0061665 | SUMO ligase activity(GO:0061665) |
| 2.3 | 6.9 | GO:0001010 | transcription factor activity, sequence-specific DNA binding transcription factor recruiting(GO:0001010) |
| 2.3 | 20.7 | GO:0030976 | thiamine pyrophosphate binding(GO:0030976) |
| 2.3 | 6.9 | GO:0004960 | thromboxane receptor activity(GO:0004960) thromboxane A2 receptor activity(GO:0004961) |
| 2.3 | 11.3 | GO:0004045 | aminoacyl-tRNA hydrolase activity(GO:0004045) |
| 2.1 | 8.5 | GO:0032406 | MutLbeta complex binding(GO:0032406) MutSbeta complex binding(GO:0032408) |
| 2.1 | 10.4 | GO:0047374 | methylumbelliferyl-acetate deacetylase activity(GO:0047374) |
| 2.1 | 10.4 | GO:0045174 | glutathione dehydrogenase (ascorbate) activity(GO:0045174) methylarsonate reductase activity(GO:0050610) |
| 2.0 | 64.9 | GO:0043015 | gamma-tubulin binding(GO:0043015) |
| 2.0 | 11.9 | GO:0000182 | rDNA binding(GO:0000182) |
| 1.9 | 9.7 | GO:0086062 | voltage-gated sodium channel activity involved in Purkinje myocyte action potential(GO:0086062) |
| 1.9 | 15.5 | GO:0005000 | vasopressin receptor activity(GO:0005000) |
| 1.9 | 5.8 | GO:0030226 | apolipoprotein receptor activity(GO:0030226) |
| 1.9 | 7.5 | GO:0015056 | corticotrophin-releasing factor receptor activity(GO:0015056) |
| 1.8 | 14.5 | GO:0015235 | cobalamin transporter activity(GO:0015235) |
| 1.8 | 10.7 | GO:0004704 | NF-kappaB-inducing kinase activity(GO:0004704) |
| 1.8 | 5.3 | GO:0047756 | chondroitin 4-sulfotransferase activity(GO:0047756) |
| 1.7 | 31.2 | GO:0004089 | carbonate dehydratase activity(GO:0004089) |
| 1.7 | 6.6 | GO:0004741 | [pyruvate dehydrogenase (lipoamide)] phosphatase activity(GO:0004741) |
| 1.6 | 6.5 | GO:0070326 | very-low-density lipoprotein particle receptor binding(GO:0070326) |
| 1.6 | 4.8 | GO:0035473 | lipase binding(GO:0035473) |
| 1.6 | 4.8 | GO:0070290 | N-acylphosphatidylethanolamine-specific phospholipase D activity(GO:0070290) |
| 1.6 | 11.2 | GO:0005324 | long-chain fatty acid transporter activity(GO:0005324) |
| 1.6 | 20.7 | GO:0004723 | calcium-dependent protein serine/threonine phosphatase activity(GO:0004723) |
| 1.6 | 11.0 | GO:0042289 | MHC class II protein binding(GO:0042289) |
| 1.6 | 4.7 | GO:0004651 | polynucleotide 5'-phosphatase activity(GO:0004651) |
| 1.6 | 9.4 | GO:0030172 | troponin C binding(GO:0030172) |
| 1.6 | 6.3 | GO:0047288 | monosialoganglioside sialyltransferase activity(GO:0047288) |
| 1.5 | 12.4 | GO:1990829 | C-rich single-stranded DNA binding(GO:1990829) |
| 1.5 | 6.2 | GO:0004668 | protein-arginine deiminase activity(GO:0004668) |
| 1.5 | 12.3 | GO:0031812 | G-protein coupled nucleotide receptor binding(GO:0031811) P2Y1 nucleotide receptor binding(GO:0031812) |
| 1.5 | 21.5 | GO:0055056 | D-glucose transmembrane transporter activity(GO:0055056) |
| 1.5 | 3.0 | GO:0001223 | transcription coactivator binding(GO:0001223) |
| 1.5 | 9.0 | GO:0000404 | heteroduplex DNA loop binding(GO:0000404) |
| 1.5 | 12.0 | GO:0043996 | histone acetyltransferase activity (H4-K5 specific)(GO:0043995) histone acetyltransferase activity (H4-K8 specific)(GO:0043996) histone acetyltransferase activity (H4-K16 specific)(GO:0046972) |
| 1.5 | 10.3 | GO:0008172 | S-methyltransferase activity(GO:0008172) |
| 1.4 | 23.1 | GO:0004716 | receptor signaling protein tyrosine kinase activity(GO:0004716) |
| 1.4 | 4.3 | GO:0031208 | POZ domain binding(GO:0031208) |
| 1.4 | 4.3 | GO:0015218 | pyrimidine nucleotide transmembrane transporter activity(GO:0015218) |
| 1.4 | 6.9 | GO:0004468 | lysine N-acetyltransferase activity, acting on acetyl phosphate as donor(GO:0004468) |
| 1.3 | 20.1 | GO:0032454 | histone demethylase activity (H3-K9 specific)(GO:0032454) |
| 1.3 | 22.2 | GO:0004861 | cyclin-dependent protein serine/threonine kinase inhibitor activity(GO:0004861) |
| 1.3 | 3.9 | GO:0016534 | cyclin-dependent protein kinase 5 activator activity(GO:0016534) |
| 1.3 | 5.2 | GO:0003827 | alpha-1,3-mannosylglycoprotein 2-beta-N-acetylglucosaminyltransferase activity(GO:0003827) |
| 1.3 | 6.3 | GO:0042296 | ISG15 transferase activity(GO:0042296) |
| 1.2 | 6.2 | GO:0008889 | glycerophosphodiester phosphodiesterase activity(GO:0008889) |
| 1.2 | 7.3 | GO:0004359 | glutaminase activity(GO:0004359) |
| 1.2 | 8.5 | GO:0071558 | histone demethylase activity (H3-K27 specific)(GO:0071558) |
| 1.2 | 1.2 | GO:0005128 | erythropoietin receptor binding(GO:0005128) |
| 1.2 | 4.8 | GO:0015207 | ATP:ADP antiporter activity(GO:0005471) adenine transmembrane transporter activity(GO:0015207) |
| 1.1 | 3.4 | GO:0016497 | substance K receptor activity(GO:0016497) |
| 1.1 | 20.3 | GO:0042800 | histone methyltransferase activity (H3-K4 specific)(GO:0042800) |
| 1.1 | 5.6 | GO:0008532 | N-acetyllactosaminide beta-1,3-N-acetylglucosaminyltransferase activity(GO:0008532) |
| 1.1 | 3.2 | GO:0004939 | beta-adrenergic receptor activity(GO:0004939) |
| 1.0 | 3.1 | GO:0035651 | AP-3 adaptor complex binding(GO:0035651) |
| 1.0 | 5.1 | GO:0016841 | ammonia-lyase activity(GO:0016841) |
| 1.0 | 7.2 | GO:0005134 | interleukin-2 receptor binding(GO:0005134) |
| 1.0 | 22.5 | GO:0008191 | metalloendopeptidase inhibitor activity(GO:0008191) |
| 1.0 | 7.1 | GO:0010853 | cyclase activator activity(GO:0010853) guanylate cyclase activator activity(GO:0030250) |
| 1.0 | 34.0 | GO:0005086 | ARF guanyl-nucleotide exchange factor activity(GO:0005086) |
| 1.0 | 13.9 | GO:0005078 | MAP-kinase scaffold activity(GO:0005078) |
| 1.0 | 4.0 | GO:0047391 | alkylglycerophosphoethanolamine phosphodiesterase activity(GO:0047391) |
| 1.0 | 8.9 | GO:0010385 | double-stranded methylated DNA binding(GO:0010385) |
| 1.0 | 4.9 | GO:0070051 | fibrinogen binding(GO:0070051) |
| 1.0 | 9.8 | GO:0070181 | small ribosomal subunit rRNA binding(GO:0070181) |
| 1.0 | 5.8 | GO:0051373 | FATZ binding(GO:0051373) |
| 1.0 | 7.7 | GO:0003910 | DNA ligase (ATP) activity(GO:0003910) |
| 0.9 | 2.8 | GO:0097371 | MDM2/MDM4 family protein binding(GO:0097371) |
| 0.9 | 2.8 | GO:0015234 | thiamine transmembrane transporter activity(GO:0015234) thiamine uptake transmembrane transporter activity(GO:0015403) |
| 0.9 | 2.8 | GO:0004782 | sulfinoalanine decarboxylase activity(GO:0004782) |
| 0.9 | 1.9 | GO:0048408 | epidermal growth factor binding(GO:0048408) |
| 0.9 | 21.3 | GO:0030676 | Rac guanyl-nucleotide exchange factor activity(GO:0030676) |
| 0.9 | 3.6 | GO:0004142 | diacylglycerol cholinephosphotransferase activity(GO:0004142) |
| 0.9 | 8.0 | GO:0046974 | histone methyltransferase activity (H3-K9 specific)(GO:0046974) |
| 0.9 | 1.8 | GO:0047184 | 1-acylglycerophosphocholine O-acyltransferase activity(GO:0047184) |
| 0.9 | 13.1 | GO:0008140 | cAMP response element binding protein binding(GO:0008140) |
| 0.9 | 6.0 | GO:0008568 | microtubule-severing ATPase activity(GO:0008568) |
| 0.9 | 5.1 | GO:0016807 | cysteine-type carboxypeptidase activity(GO:0016807) cysteine-type exopeptidase activity(GO:0070004) |
| 0.9 | 18.8 | GO:0000062 | fatty-acyl-CoA binding(GO:0000062) |
| 0.9 | 2.6 | GO:0005017 | platelet-derived growth factor-activated receptor activity(GO:0005017) |
| 0.8 | 5.9 | GO:0031078 | histone deacetylase activity (H3-K14 specific)(GO:0031078) NAD-dependent histone deacetylase activity (H3-K14 specific)(GO:0032041) |
| 0.8 | 68.0 | GO:0008080 | N-acetyltransferase activity(GO:0008080) |
| 0.8 | 5.7 | GO:0051525 | NFAT protein binding(GO:0051525) |
| 0.8 | 7.1 | GO:0036312 | phosphatidylinositol 3-kinase regulatory subunit binding(GO:0036312) |
| 0.8 | 6.3 | GO:0097322 | 7SK snRNA binding(GO:0097322) |
| 0.8 | 5.4 | GO:0030368 | interleukin-17 receptor activity(GO:0030368) |
| 0.8 | 3.0 | GO:0035939 | microsatellite binding(GO:0035939) |
| 0.8 | 4.5 | GO:0004305 | ethanolamine kinase activity(GO:0004305) |
| 0.8 | 2.3 | GO:0008900 | hydrogen:potassium-exchanging ATPase activity(GO:0008900) |
| 0.7 | 4.5 | GO:0016416 | O-palmitoyltransferase activity(GO:0016416) |
| 0.7 | 10.4 | GO:0016876 | aminoacyl-tRNA ligase activity(GO:0004812) ligase activity, forming carbon-oxygen bonds(GO:0016875) ligase activity, forming aminoacyl-tRNA and related compounds(GO:0016876) |
| 0.7 | 3.0 | GO:0043237 | laminin-1 binding(GO:0043237) |
| 0.7 | 5.2 | GO:0003828 | alpha-N-acetylneuraminate alpha-2,8-sialyltransferase activity(GO:0003828) |
| 0.7 | 8.8 | GO:0034596 | phosphatidylinositol phosphate 4-phosphatase activity(GO:0034596) |
| 0.7 | 6.6 | GO:0048495 | Roundabout binding(GO:0048495) |
| 0.7 | 2.9 | GO:0032450 | maltose alpha-glucosidase activity(GO:0032450) |
| 0.7 | 2.9 | GO:0045569 | TRAIL binding(GO:0045569) |
| 0.7 | 19.0 | GO:0005003 | ephrin receptor activity(GO:0005003) |
| 0.7 | 1.5 | GO:0098519 | nucleotide phosphatase activity, acting on free nucleotides(GO:0098519) |
| 0.7 | 20.2 | GO:0051959 | dynein light intermediate chain binding(GO:0051959) |
| 0.7 | 15.8 | GO:0070530 | K63-linked polyubiquitin binding(GO:0070530) |
| 0.7 | 60.7 | GO:0004712 | protein serine/threonine/tyrosine kinase activity(GO:0004712) |
| 0.7 | 30.4 | GO:0017112 | Rab guanyl-nucleotide exchange factor activity(GO:0017112) |
| 0.7 | 4.9 | GO:0071535 | RING-like zinc finger domain binding(GO:0071535) |
| 0.7 | 5.6 | GO:0060228 | phosphatidylcholine-sterol O-acyltransferase activator activity(GO:0060228) |
| 0.7 | 5.6 | GO:0098821 | BMP receptor activity(GO:0098821) |
| 0.7 | 2.7 | GO:0071987 | WD40-repeat domain binding(GO:0071987) |
| 0.7 | 262.1 | GO:0005096 | GTPase activator activity(GO:0005096) |
| 0.7 | 2.7 | GO:0047708 | biotinidase activity(GO:0047708) |
| 0.7 | 2.0 | GO:0001641 | group II metabotropic glutamate receptor activity(GO:0001641) |
| 0.7 | 3.9 | GO:0002161 | aminoacyl-tRNA editing activity(GO:0002161) |
| 0.6 | 1.9 | GO:0033878 | hormone-sensitive lipase activity(GO:0033878) |
| 0.6 | 2.6 | GO:0015111 | iodide transmembrane transporter activity(GO:0015111) |
| 0.6 | 3.2 | GO:0047144 | 2-acylglycerol-3-phosphate O-acyltransferase activity(GO:0047144) |
| 0.6 | 15.5 | GO:0050321 | tau-protein kinase activity(GO:0050321) |
| 0.6 | 8.6 | GO:0043024 | ribosomal small subunit binding(GO:0043024) |
| 0.6 | 1.8 | GO:0004874 | aryl hydrocarbon receptor activity(GO:0004874) |
| 0.6 | 15.7 | GO:0005545 | 1-phosphatidylinositol binding(GO:0005545) |
| 0.6 | 2.4 | GO:0035373 | chondroitin sulfate proteoglycan binding(GO:0035373) |
| 0.6 | 1.8 | GO:0043533 | inositol 1,3,4,5 tetrakisphosphate binding(GO:0043533) |
| 0.6 | 5.3 | GO:0015272 | ATP-activated inward rectifier potassium channel activity(GO:0015272) |
| 0.6 | 1.8 | GO:0004698 | calcium-dependent protein kinase C activity(GO:0004698) |
| 0.6 | 5.2 | GO:0031685 | adenosine receptor binding(GO:0031685) |
| 0.6 | 3.5 | GO:0005143 | interleukin-12 receptor binding(GO:0005143) |
| 0.6 | 2.3 | GO:0019797 | procollagen-proline 3-dioxygenase activity(GO:0019797) |
| 0.6 | 9.0 | GO:0009881 | photoreceptor activity(GO:0009881) |
| 0.6 | 2.8 | GO:0001888 | glucuronyl-galactosyl-proteoglycan 4-alpha-N-acetylglucosaminyltransferase activity(GO:0001888) |
| 0.6 | 2.8 | GO:0003835 | beta-galactoside alpha-2,6-sialyltransferase activity(GO:0003835) |
| 0.5 | 3.8 | GO:0004652 | polynucleotide adenylyltransferase activity(GO:0004652) |
| 0.5 | 10.6 | GO:0005522 | profilin binding(GO:0005522) |
| 0.5 | 10.0 | GO:0008353 | RNA polymerase II carboxy-terminal domain kinase activity(GO:0008353) |
| 0.5 | 8.4 | GO:0001222 | transcription corepressor binding(GO:0001222) |
| 0.5 | 1.6 | GO:0017162 | aryl hydrocarbon receptor binding(GO:0017162) |
| 0.5 | 2.6 | GO:0016427 | tRNA (cytosine) methyltransferase activity(GO:0016427) |
| 0.5 | 1.5 | GO:0004750 | ribulose-phosphate 3-epimerase activity(GO:0004750) |
| 0.5 | 3.6 | GO:0001517 | N-acetylglucosamine 6-O-sulfotransferase activity(GO:0001517) |
| 0.5 | 11.2 | GO:0016722 | oxidoreductase activity, oxidizing metal ions(GO:0016722) |
| 0.5 | 2.5 | GO:0005222 | intracellular cAMP activated cation channel activity(GO:0005222) |
| 0.5 | 4.5 | GO:0019869 | chloride channel inhibitor activity(GO:0019869) |
| 0.5 | 1.5 | GO:0030272 | 5-formyltetrahydrofolate cyclo-ligase activity(GO:0030272) |
| 0.5 | 1.5 | GO:0070984 | SET domain binding(GO:0070984) |
| 0.5 | 4.5 | GO:0004969 | histamine receptor activity(GO:0004969) |
| 0.5 | 6.9 | GO:0022820 | potassium:chloride symporter activity(GO:0015379) potassium ion symporter activity(GO:0022820) |
| 0.5 | 2.0 | GO:1901375 | acetylcholine transmembrane transporter activity(GO:0005277) acetate ester transmembrane transporter activity(GO:1901375) |
| 0.5 | 2.5 | GO:0008422 | beta-glucosidase activity(GO:0008422) |
| 0.5 | 1.4 | GO:1990050 | phosphatidic acid transporter activity(GO:1990050) |
| 0.5 | 2.9 | GO:0016900 | oxidoreductase activity, acting on the CH-OH group of donors, disulfide as acceptor(GO:0016900) vitamin-K-epoxide reductase (warfarin-sensitive) activity(GO:0047057) |
| 0.5 | 5.2 | GO:0005391 | sodium:potassium-exchanging ATPase activity(GO:0005391) potassium-transporting ATPase activity(GO:0008556) |
| 0.5 | 6.0 | GO:0048185 | activin binding(GO:0048185) |
| 0.5 | 6.4 | GO:0000150 | recombinase activity(GO:0000150) |
| 0.5 | 1.4 | GO:0005502 | 11-cis retinal binding(GO:0005502) |
| 0.5 | 9.5 | GO:0001087 | transcription factor activity, sequence-specific DNA binding, RNA polymerase recruiting(GO:0001011) transcription factor activity, TFIIB-class binding(GO:0001087) |
| 0.5 | 3.6 | GO:0005534 | galactose binding(GO:0005534) |
| 0.4 | 14.6 | GO:0030742 | GTP-dependent protein binding(GO:0030742) |
| 0.4 | 26.9 | GO:0035064 | methylated histone binding(GO:0035064) |
| 0.4 | 3.5 | GO:1990380 | Lys48-specific deubiquitinase activity(GO:1990380) |
| 0.4 | 1.3 | GO:0001221 | transcription cofactor binding(GO:0001221) |
| 0.4 | 13.3 | GO:0005001 | transmembrane receptor protein tyrosine phosphatase activity(GO:0005001) transmembrane receptor protein phosphatase activity(GO:0019198) |
| 0.4 | 3.4 | GO:0004571 | mannosyl-oligosaccharide 1,2-alpha-mannosidase activity(GO:0004571) |
| 0.4 | 4.2 | GO:0047498 | calcium-dependent phospholipase A2 activity(GO:0047498) |
| 0.4 | 1.7 | GO:0046935 | 1-phosphatidylinositol-3-kinase regulator activity(GO:0046935) |
| 0.4 | 2.1 | GO:1904288 | BAT3 complex binding(GO:1904288) |
| 0.4 | 8.2 | GO:0070300 | phosphatidic acid binding(GO:0070300) |
| 0.4 | 3.7 | GO:0004117 | calmodulin-dependent cyclic-nucleotide phosphodiesterase activity(GO:0004117) |
| 0.4 | 1.2 | GO:0005174 | CD40 receptor binding(GO:0005174) |
| 0.4 | 0.8 | GO:0030911 | TPR domain binding(GO:0030911) |
| 0.4 | 5.2 | GO:0005432 | calcium:sodium antiporter activity(GO:0005432) |
| 0.4 | 1.6 | GO:0001025 | RNA polymerase III transcription factor binding(GO:0001025) |
| 0.4 | 3.9 | GO:0004957 | prostaglandin E receptor activity(GO:0004957) |
| 0.4 | 5.5 | GO:0043548 | phosphatidylinositol 3-kinase binding(GO:0043548) |
| 0.4 | 6.6 | GO:0017151 | DEAD/H-box RNA helicase binding(GO:0017151) |
| 0.4 | 4.3 | GO:0046875 | ephrin receptor binding(GO:0046875) |
| 0.4 | 20.8 | GO:0015026 | coreceptor activity(GO:0015026) |
| 0.4 | 1.1 | GO:0001224 | RNA polymerase II transcription cofactor binding(GO:0001224) RNA polymerase II transcription coactivator binding(GO:0001225) |
| 0.4 | 4.9 | GO:0009374 | biotin binding(GO:0009374) |
| 0.4 | 4.8 | GO:0003707 | steroid hormone receptor activity(GO:0003707) |
| 0.4 | 3.6 | GO:0022841 | potassium ion leak channel activity(GO:0022841) |
| 0.4 | 4.0 | GO:0017154 | semaphorin receptor activity(GO:0017154) |
| 0.4 | 1.5 | GO:0086077 | gap junction channel activity involved in SA node cell-atrial cardiac muscle cell electrical coupling(GO:0086020) gap junction channel activity involved in AV node cell-bundle of His cell electrical coupling(GO:0086077) |
| 0.4 | 1.8 | GO:0005127 | ciliary neurotrophic factor receptor binding(GO:0005127) |
| 0.3 | 1.4 | GO:0004461 | lactose synthase activity(GO:0004461) |
| 0.3 | 4.1 | GO:0004118 | cGMP-stimulated cyclic-nucleotide phosphodiesterase activity(GO:0004118) |
| 0.3 | 3.1 | GO:0031802 | type 5 metabotropic glutamate receptor binding(GO:0031802) |
| 0.3 | 3.4 | GO:0043425 | bHLH transcription factor binding(GO:0043425) |
| 0.3 | 1.0 | GO:0070568 | guanylyltransferase activity(GO:0070568) |
| 0.3 | 5.1 | GO:0005344 | oxygen transporter activity(GO:0005344) |
| 0.3 | 2.3 | GO:0032217 | riboflavin transporter activity(GO:0032217) |
| 0.3 | 1.3 | GO:0030618 | transforming growth factor beta receptor, pathway-specific cytoplasmic mediator activity(GO:0030618) |
| 0.3 | 4.0 | GO:0019992 | diacylglycerol binding(GO:0019992) |
| 0.3 | 1.3 | GO:0052812 | phosphatidylinositol-3,4-bisphosphate 5-kinase activity(GO:0052812) |
| 0.3 | 18.0 | GO:0035035 | histone acetyltransferase binding(GO:0035035) |
| 0.3 | 8.2 | GO:0004709 | MAP kinase kinase kinase activity(GO:0004709) |
| 0.3 | 6.5 | GO:0097109 | neuroligin family protein binding(GO:0097109) |
| 0.3 | 1.0 | GO:1990430 | extracellular matrix protein binding(GO:1990430) |
| 0.3 | 4.2 | GO:0070700 | BMP receptor binding(GO:0070700) |
| 0.3 | 8.9 | GO:0005234 | extracellular-glutamate-gated ion channel activity(GO:0005234) |
| 0.3 | 1.3 | GO:0015018 | galactosylgalactosylxylosylprotein 3-beta-glucuronosyltransferase activity(GO:0015018) |
| 0.3 | 1.9 | GO:0047696 | beta-adrenergic receptor kinase activity(GO:0047696) |
| 0.3 | 0.3 | GO:0003909 | DNA ligase activity(GO:0003909) |
| 0.3 | 1.5 | GO:0043546 | molybdopterin cofactor binding(GO:0043546) |
| 0.3 | 25.5 | GO:0101005 | thiol-dependent ubiquitinyl hydrolase activity(GO:0036459) ubiquitinyl hydrolase activity(GO:0101005) |
| 0.3 | 6.6 | GO:0004602 | glutathione peroxidase activity(GO:0004602) |
| 0.3 | 1.5 | GO:0004430 | 1-phosphatidylinositol 4-kinase activity(GO:0004430) |
| 0.3 | 7.7 | GO:0071949 | FAD binding(GO:0071949) |
| 0.3 | 1.5 | GO:0047066 | phospholipid-hydroperoxide glutathione peroxidase activity(GO:0047066) |
| 0.3 | 0.9 | GO:0071532 | ankyrin repeat binding(GO:0071532) |
| 0.3 | 6.4 | GO:0098641 | cadherin binding involved in cell-cell adhesion(GO:0098641) |
| 0.3 | 3.8 | GO:0005381 | iron ion transmembrane transporter activity(GO:0005381) |
| 0.3 | 2.6 | GO:0070679 | store-operated calcium channel activity(GO:0015279) inositol 1,4,5 trisphosphate binding(GO:0070679) |
| 0.3 | 3.2 | GO:0045503 | dynein light chain binding(GO:0045503) |
| 0.3 | 2.0 | GO:0005138 | interleukin-6 receptor binding(GO:0005138) |
| 0.3 | 18.3 | GO:0005089 | Rho guanyl-nucleotide exchange factor activity(GO:0005089) |
| 0.3 | 4.2 | GO:0015280 | ligand-gated sodium channel activity(GO:0015280) |
| 0.3 | 3.1 | GO:0004115 | 3',5'-cyclic-AMP phosphodiesterase activity(GO:0004115) |
| 0.3 | 3.3 | GO:0005007 | fibroblast growth factor-activated receptor activity(GO:0005007) |
| 0.3 | 2.2 | GO:0004111 | creatine kinase activity(GO:0004111) |
| 0.3 | 3.8 | GO:0016671 | oxidoreductase activity, acting on a sulfur group of donors, disulfide as acceptor(GO:0016671) |
| 0.3 | 1.1 | GO:0004102 | choline O-acetyltransferase activity(GO:0004102) |
| 0.3 | 4.5 | GO:0043274 | phospholipase binding(GO:0043274) |
| 0.3 | 1.3 | GO:0004999 | vasoactive intestinal polypeptide receptor activity(GO:0004999) |
| 0.3 | 8.4 | GO:0008331 | high voltage-gated calcium channel activity(GO:0008331) |
| 0.3 | 7.6 | GO:0031624 | ubiquitin conjugating enzyme binding(GO:0031624) |
| 0.3 | 2.6 | GO:0031435 | mitogen-activated protein kinase kinase kinase binding(GO:0031435) |
| 0.3 | 2.6 | GO:0019789 | SUMO transferase activity(GO:0019789) |
| 0.3 | 4.8 | GO:0005247 | voltage-gated chloride channel activity(GO:0005247) |
| 0.3 | 1.3 | GO:0004427 | inorganic diphosphatase activity(GO:0004427) |
| 0.3 | 1.8 | GO:0050291 | sphingosine N-acyltransferase activity(GO:0050291) |
| 0.3 | 3.5 | GO:0016846 | carbon-sulfur lyase activity(GO:0016846) |
| 0.2 | 7.5 | GO:0005109 | frizzled binding(GO:0005109) |
| 0.2 | 1.2 | GO:0008174 | mRNA methyltransferase activity(GO:0008174) |
| 0.2 | 5.7 | GO:0031402 | sodium ion binding(GO:0031402) |
| 0.2 | 1.2 | GO:0004522 | ribonuclease A activity(GO:0004522) |
| 0.2 | 1.5 | GO:0030332 | cyclin binding(GO:0030332) |
| 0.2 | 3.1 | GO:0005149 | interleukin-1 receptor binding(GO:0005149) |
| 0.2 | 242.0 | GO:0000981 | RNA polymerase II transcription factor activity, sequence-specific DNA binding(GO:0000981) |
| 0.2 | 8.2 | GO:0030552 | cAMP binding(GO:0030552) |
| 0.2 | 5.5 | GO:0050998 | nitric-oxide synthase binding(GO:0050998) |
| 0.2 | 0.9 | GO:0008467 | [heparan sulfate]-glucosamine 3-sulfotransferase 1 activity(GO:0008467) |
| 0.2 | 1.2 | GO:0004991 | parathyroid hormone receptor activity(GO:0004991) |
| 0.2 | 1.1 | GO:0008526 | phosphatidylinositol transporter activity(GO:0008526) |
| 0.2 | 7.4 | GO:0070840 | dynein complex binding(GO:0070840) |
| 0.2 | 0.9 | GO:0086007 | voltage-gated calcium channel activity involved in cardiac muscle cell action potential(GO:0086007) |
| 0.2 | 5.5 | GO:0030371 | translation repressor activity(GO:0030371) |
| 0.2 | 3.5 | GO:0070182 | DNA polymerase binding(GO:0070182) |
| 0.2 | 1.7 | GO:0005250 | A-type (transient outward) potassium channel activity(GO:0005250) |
| 0.2 | 1.1 | GO:0004105 | choline-phosphate cytidylyltransferase activity(GO:0004105) |
| 0.2 | 6.8 | GO:0033613 | activating transcription factor binding(GO:0033613) |
| 0.2 | 3.4 | GO:0017110 | nucleoside-diphosphatase activity(GO:0017110) |
| 0.2 | 6.0 | GO:0003887 | DNA-directed DNA polymerase activity(GO:0003887) |
| 0.2 | 6.0 | GO:0022848 | acetylcholine-gated cation channel activity(GO:0022848) |
| 0.2 | 1.0 | GO:0052840 | endopolyphosphatase activity(GO:0000298) diphosphoinositol-polyphosphate diphosphatase activity(GO:0008486) bis(5'-adenosyl)-hexaphosphatase activity(GO:0034431) bis(5'-adenosyl)-pentaphosphatase activity(GO:0034432) inositol diphosphate tetrakisphosphate diphosphatase activity(GO:0052840) inositol bisdiphosphate tetrakisphosphate diphosphatase activity(GO:0052841) inositol diphosphate pentakisphosphate diphosphatase activity(GO:0052842) inositol-1-diphosphate-2,3,4,5,6-pentakisphosphate diphosphatase activity(GO:0052843) inositol-3-diphosphate-1,2,4,5,6-pentakisphosphate diphosphatase activity(GO:0052844) inositol-5-diphosphate-1,2,3,4,6-pentakisphosphate diphosphatase activity(GO:0052845) inositol-1,5-bisdiphosphate-2,3,4,6-tetrakisphosphate 1-diphosphatase activity(GO:0052846) inositol-1,5-bisdiphosphate-2,3,4,6-tetrakisphosphate 5-diphosphatase activity(GO:0052847) inositol-3,5-bisdiphosphate-2,3,4,6-tetrakisphosphate 5-diphosphatase activity(GO:0052848) |
| 0.2 | 1.4 | GO:0042799 | histone methyltransferase activity (H4-K20 specific)(GO:0042799) |
| 0.2 | 1.5 | GO:0015232 | heme transporter activity(GO:0015232) |
| 0.2 | 15.8 | GO:0005262 | calcium channel activity(GO:0005262) |
| 0.2 | 4.8 | GO:0004622 | lysophospholipase activity(GO:0004622) |
| 0.2 | 8.5 | GO:0030695 | GTPase regulator activity(GO:0030695) |
| 0.2 | 0.7 | GO:0047291 | neolactotetraosylceramide alpha-2,3-sialyltransferase activity(GO:0004513) lactosylceramide alpha-2,3-sialyltransferase activity(GO:0047291) |
| 0.2 | 4.6 | GO:0031593 | polyubiquitin binding(GO:0031593) |
| 0.2 | 3.6 | GO:0045499 | chemorepellent activity(GO:0045499) |
| 0.2 | 5.5 | GO:0003950 | NAD+ ADP-ribosyltransferase activity(GO:0003950) |
| 0.2 | 17.8 | GO:0005201 | extracellular matrix structural constituent(GO:0005201) |
| 0.2 | 1.4 | GO:0008443 | phosphofructokinase activity(GO:0008443) |
| 0.2 | 2.3 | GO:0022851 | GABA-gated chloride ion channel activity(GO:0022851) |
| 0.2 | 2.1 | GO:0004065 | arylsulfatase activity(GO:0004065) |
| 0.2 | 6.6 | GO:0005544 | calcium-dependent phospholipid binding(GO:0005544) |
| 0.2 | 2.1 | GO:0005547 | phosphatidylinositol-3,4,5-trisphosphate binding(GO:0005547) |
| 0.2 | 1.2 | GO:0003836 | beta-galactoside (CMP) alpha-2,3-sialyltransferase activity(GO:0003836) |
| 0.2 | 0.8 | GO:0044547 | DNA topoisomerase binding(GO:0044547) |
| 0.2 | 1.3 | GO:0004865 | protein serine/threonine phosphatase inhibitor activity(GO:0004865) |
| 0.2 | 2.5 | GO:0045236 | CXCR chemokine receptor binding(GO:0045236) |
| 0.2 | 1.1 | GO:0004962 | endothelin receptor activity(GO:0004962) |
| 0.2 | 1.0 | GO:0015205 | nucleobase transmembrane transporter activity(GO:0015205) |
| 0.2 | 2.3 | GO:0004859 | phospholipase inhibitor activity(GO:0004859) |
| 0.2 | 0.6 | GO:0004965 | G-protein coupled GABA receptor activity(GO:0004965) |
| 0.2 | 8.4 | GO:0030507 | spectrin binding(GO:0030507) |
| 0.1 | 2.8 | GO:0031005 | filamin binding(GO:0031005) |
| 0.1 | 1.2 | GO:0004024 | alcohol dehydrogenase activity, zinc-dependent(GO:0004024) |
| 0.1 | 0.4 | GO:0005042 | netrin receptor activity(GO:0005042) |
| 0.1 | 1.2 | GO:0001871 | pattern binding(GO:0001871) polysaccharide binding(GO:0030247) |
| 0.1 | 3.7 | GO:0030276 | clathrin binding(GO:0030276) |
| 0.1 | 3.8 | GO:0008519 | ammonium transmembrane transporter activity(GO:0008519) |
| 0.1 | 0.4 | GO:0005173 | stem cell factor receptor binding(GO:0005173) |
| 0.1 | 0.4 | GO:0000248 | C-5 sterol desaturase activity(GO:0000248) sterol desaturase activity(GO:0070704) |
| 0.1 | 23.4 | GO:0004871 | signal transducer activity(GO:0004871) |
| 0.1 | 2.0 | GO:0019215 | intermediate filament binding(GO:0019215) |
| 0.1 | 2.3 | GO:0030898 | actin-dependent ATPase activity(GO:0030898) |
| 0.1 | 1.5 | GO:0016888 | endodeoxyribonuclease activity, producing 5'-phosphomonoesters(GO:0016888) |
| 0.1 | 3.2 | GO:0005326 | neurotransmitter transporter activity(GO:0005326) |
| 0.1 | 1.3 | GO:0050750 | low-density lipoprotein particle receptor binding(GO:0050750) |
| 0.1 | 4.8 | GO:0004683 | calmodulin-dependent protein kinase activity(GO:0004683) |
| 0.1 | 0.8 | GO:0086089 | voltage-gated potassium channel activity involved in atrial cardiac muscle cell action potential repolarization(GO:0086089) |
| 0.1 | 1.9 | GO:0033549 | MAP kinase phosphatase activity(GO:0033549) |
| 0.1 | 11.4 | GO:0004860 | protein kinase inhibitor activity(GO:0004860) |
| 0.1 | 1.6 | GO:0017127 | cholesterol transporter activity(GO:0017127) |
| 0.1 | 5.8 | GO:0048306 | calcium-dependent protein binding(GO:0048306) |
| 0.1 | 9.7 | GO:0005249 | voltage-gated potassium channel activity(GO:0005249) |
| 0.1 | 2.2 | GO:0005314 | high-affinity glutamate transmembrane transporter activity(GO:0005314) |
| 0.1 | 2.2 | GO:0001106 | RNA polymerase II transcription corepressor activity(GO:0001106) |
| 0.1 | 0.3 | GO:0033188 | sphingomyelin synthase activity(GO:0033188) ceramide cholinephosphotransferase activity(GO:0047493) |
| 0.1 | 3.1 | GO:0005104 | fibroblast growth factor receptor binding(GO:0005104) |
| 0.1 | 1.6 | GO:0043495 | protein anchor(GO:0043495) |
| 0.1 | 1.0 | GO:0019841 | retinol binding(GO:0019841) |
| 0.1 | 1.6 | GO:0004383 | guanylate cyclase activity(GO:0004383) |
| 0.1 | 0.4 | GO:0097108 | hedgehog family protein binding(GO:0097108) |
| 0.1 | 1.1 | GO:0004332 | fructose-bisphosphate aldolase activity(GO:0004332) |
| 0.1 | 1.1 | GO:0045294 | alpha-catenin binding(GO:0045294) |
| 0.1 | 2.7 | GO:0004181 | metallocarboxypeptidase activity(GO:0004181) |
| 0.1 | 0.5 | GO:0004161 | dimethylallyltranstransferase activity(GO:0004161) geranyltranstransferase activity(GO:0004337) |
| 0.1 | 2.8 | GO:0015347 | sodium-independent organic anion transmembrane transporter activity(GO:0015347) |
| 0.1 | 0.8 | GO:0003988 | acetyl-CoA C-acyltransferase activity(GO:0003988) |
| 0.1 | 0.9 | GO:0005243 | gap junction channel activity(GO:0005243) |
| 0.1 | 0.7 | GO:0070742 | C2H2 zinc finger domain binding(GO:0070742) |
| 0.1 | 0.7 | GO:0035312 | 5'-3' exodeoxyribonuclease activity(GO:0035312) |
| 0.1 | 0.5 | GO:0001591 | dopamine neurotransmitter receptor activity, coupled via Gi/Go(GO:0001591) |
| 0.1 | 1.8 | GO:0004435 | phosphatidylinositol phospholipase C activity(GO:0004435) |
| 0.1 | 0.5 | GO:0019826 | oxygen sensor activity(GO:0019826) |
| 0.1 | 3.3 | GO:0008408 | 3'-5' exonuclease activity(GO:0008408) |
| 0.1 | 1.0 | GO:0036374 | glutathione hydrolase activity(GO:0036374) |
| 0.1 | 2.3 | GO:0001530 | lipopolysaccharide binding(GO:0001530) |
| 0.1 | 0.3 | GO:0000309 | nicotinamide-nucleotide adenylyltransferase activity(GO:0000309) |
| 0.1 | 1.7 | GO:0004012 | phospholipid-translocating ATPase activity(GO:0004012) |
| 0.1 | 0.8 | GO:0008429 | phosphatidylethanolamine binding(GO:0008429) |
| 0.1 | 2.3 | GO:0030971 | receptor tyrosine kinase binding(GO:0030971) |
| 0.1 | 3.0 | GO:0005230 | extracellular ligand-gated ion channel activity(GO:0005230) |
| 0.1 | 0.3 | GO:0050436 | microfibril binding(GO:0050436) |
| 0.1 | 2.3 | GO:0005158 | insulin receptor binding(GO:0005158) |
| 0.1 | 2.3 | GO:0043621 | protein self-association(GO:0043621) |
| 0.1 | 3.7 | GO:0017137 | Rab GTPase binding(GO:0017137) |
| 0.1 | 0.8 | GO:0005229 | intracellular calcium activated chloride channel activity(GO:0005229) |
| 0.1 | 0.5 | GO:1901611 | phosphatidylglycerol binding(GO:1901611) cardiolipin binding(GO:1901612) |
| 0.1 | 0.9 | GO:0038191 | neuropilin binding(GO:0038191) |
| 0.1 | 6.6 | GO:0003714 | transcription corepressor activity(GO:0003714) |
| 0.1 | 0.3 | GO:0004013 | adenosylhomocysteinase activity(GO:0004013) trialkylsulfonium hydrolase activity(GO:0016802) |
| 0.1 | 1.9 | GO:0030544 | Hsp70 protein binding(GO:0030544) |
| 0.0 | 1.6 | GO:0005154 | epidermal growth factor receptor binding(GO:0005154) |
| 0.0 | 0.7 | GO:0070016 | armadillo repeat domain binding(GO:0070016) |
| 0.0 | 1.6 | GO:0008188 | neuropeptide receptor activity(GO:0008188) |
| 0.0 | 0.5 | GO:0002151 | G-quadruplex RNA binding(GO:0002151) |
| 0.0 | 0.3 | GO:0015116 | sulfate transmembrane transporter activity(GO:0015116) |
| 0.0 | 3.7 | GO:0004553 | hydrolase activity, hydrolyzing O-glycosyl compounds(GO:0004553) |
| 0.0 | 4.4 | GO:0004867 | serine-type endopeptidase inhibitor activity(GO:0004867) |
| 0.0 | 10.5 | GO:0004252 | serine-type endopeptidase activity(GO:0004252) |
| 0.0 | 1.4 | GO:0019894 | kinesin binding(GO:0019894) |
| 0.0 | 0.6 | GO:0032393 | MHC class I receptor activity(GO:0032393) |
| 0.0 | 0.5 | GO:0016713 | oxidoreductase activity, acting on paired donors, with incorporation or reduction of molecular oxygen, reduced iron-sulfur protein as one donor, and incorporation of one atom of oxygen(GO:0016713) |
| 0.0 | 0.6 | GO:0080025 | phosphatidylinositol-3,5-bisphosphate binding(GO:0080025) |
| 0.0 | 17.5 | GO:0004672 | protein kinase activity(GO:0004672) |
| 0.0 | 2.9 | GO:0031072 | heat shock protein binding(GO:0031072) |
| 0.0 | 0.7 | GO:0015276 | ligand-gated ion channel activity(GO:0015276) ligand-gated channel activity(GO:0022834) |
| 0.0 | 3.6 | GO:0002020 | protease binding(GO:0002020) |
| 0.0 | 0.7 | GO:0005537 | mannose binding(GO:0005537) |
| 0.0 | 1.0 | GO:0017046 | peptide hormone binding(GO:0017046) |
| 0.0 | 15.7 | GO:0001071 | nucleic acid binding transcription factor activity(GO:0001071) transcription factor activity, sequence-specific DNA binding(GO:0003700) |
| 0.0 | 4.4 | GO:0005085 | guanyl-nucleotide exchange factor activity(GO:0005085) |
| 0.0 | 0.5 | GO:0051184 | cofactor transporter activity(GO:0051184) |
| 0.0 | 0.1 | GO:0008158 | hedgehog receptor activity(GO:0008158) |
| 0.0 | 1.1 | GO:0015459 | potassium channel regulator activity(GO:0015459) |
| 0.0 | 0.5 | GO:0051371 | muscle alpha-actinin binding(GO:0051371) |
| 0.0 | 0.3 | GO:0008097 | 5S rRNA binding(GO:0008097) |
| 0.0 | 0.3 | GO:0008195 | phosphatidate phosphatase activity(GO:0008195) |
| 0.0 | 0.4 | GO:0016638 | oxidoreductase activity, acting on the CH-NH2 group of donors(GO:0016638) |
| 0.0 | 14.3 | GO:0004872 | receptor activity(GO:0004872) molecular transducer activity(GO:0060089) |
| 0.0 | 0.1 | GO:0042500 | aspartic endopeptidase activity, intramembrane cleaving(GO:0042500) |
| 0.0 | 0.1 | GO:0004140 | dephospho-CoA kinase activity(GO:0004140) |
| 0.0 | 0.1 | GO:0030275 | LRR domain binding(GO:0030275) |
| 0.0 | 0.4 | GO:0001540 | beta-amyloid binding(GO:0001540) |
| 0.0 | 0.1 | GO:0008198 | ferrous iron binding(GO:0008198) |
Gene overrepresentation in curated gene sets: canonical pathways category:
| Log-likelihood per target | Total log-likelihood | Term | Description |
|---|---|---|---|
| 3.2 | 6.4 | PID S1P S1P4 PATHWAY | S1P4 pathway |
| 1.9 | 3.9 | PID P38 GAMMA DELTA PATHWAY | Signaling mediated by p38-gamma and p38-delta |
| 1.2 | 25.6 | PID PI3KCI AKT PATHWAY | Class I PI3K signaling events mediated by Akt |
| 1.0 | 22.1 | PID TCR JNK PATHWAY | JNK signaling in the CD4+ TCR pathway |
| 1.0 | 32.5 | ST WNT CA2 CYCLIC GMP PATHWAY | Wnt/Ca2+/cyclic GMP signaling. |
| 0.9 | 3.5 | PID S1P S1P3 PATHWAY | S1P3 pathway |
| 0.9 | 58.4 | PID PLK1 PATHWAY | PLK1 signaling events |
| 0.9 | 20.6 | PID LPA4 PATHWAY | LPA4-mediated signaling events |
| 0.9 | 67.4 | SIG CHEMOTAXIS | Genes related to chemotaxis |
| 0.8 | 31.6 | ST MYOCYTE AD PATHWAY | Myocyte Adrenergic Pathway is a specific case of the generalized Adrenergic Pathway. |
| 0.8 | 1.6 | PID ERB GENOMIC PATHWAY | Validated nuclear estrogen receptor beta network |
| 0.7 | 2.9 | PID RANBP2 PATHWAY | Sumoylation by RanBP2 regulates transcriptional repression |
| 0.6 | 12.6 | ST GAQ PATHWAY | G alpha q Pathway |
| 0.6 | 11.1 | SA PROGRAMMED CELL DEATH | Programmed cell death, or apoptosis, eliminates damaged or unneeded cells. |
| 0.6 | 34.7 | PID RXR VDR PATHWAY | RXR and RAR heterodimerization with other nuclear receptor |
| 0.6 | 28.2 | NABA BASEMENT MEMBRANES | Genes encoding structural components of basement membranes |
| 0.6 | 20.3 | PID WNT CANONICAL PATHWAY | Canonical Wnt signaling pathway |
| 0.6 | 3.6 | PID WNT NONCANONICAL PATHWAY | Noncanonical Wnt signaling pathway |
| 0.6 | 35.9 | PID CDC42 REG PATHWAY | Regulation of CDC42 activity |
| 0.5 | 4.8 | SIG IL4RECEPTOR IN B LYPHOCYTES | Genes related to IL4 rceptor signaling in B lymphocytes |
| 0.5 | 6.8 | PID IL5 PATHWAY | IL5-mediated signaling events |
| 0.5 | 5.2 | ST TYPE I INTERFERON PATHWAY | Type I Interferon (alpha/beta IFN) Pathway |
| 0.5 | 10.5 | PID CONE PATHWAY | Visual signal transduction: Cones |
| 0.5 | 15.6 | PID S1P META PATHWAY | Sphingosine 1-phosphate (S1P) pathway |
| 0.5 | 31.2 | PID RHOA REG PATHWAY | Regulation of RhoA activity |
| 0.5 | 2.3 | ST INTERFERON GAMMA PATHWAY | Interferon gamma pathway. |
| 0.4 | 5.7 | PID PDGFRA PATHWAY | PDGFR-alpha signaling pathway |
| 0.4 | 26.9 | PID HDAC CLASSII PATHWAY | Signaling events mediated by HDAC Class II |
| 0.4 | 41.1 | PID AP1 PATHWAY | AP-1 transcription factor network |
| 0.4 | 12.7 | PID TOLL ENDOGENOUS PATHWAY | Endogenous TLR signaling |
| 0.4 | 21.4 | PID ERBB1 INTERNALIZATION PATHWAY | Internalization of ErbB1 |
| 0.4 | 3.9 | SIG PIP3 SIGNALING IN CARDIAC MYOCTES | Genes related to PIP3 signaling in cardiac myocytes |
| 0.4 | 3.8 | PID S1P S1P1 PATHWAY | S1P1 pathway |
| 0.4 | 3.8 | ST G ALPHA S PATHWAY | G alpha s Pathway |
| 0.4 | 3.1 | PID MYC PATHWAY | C-MYC pathway |
| 0.4 | 29.4 | PID LKB1 PATHWAY | LKB1 signaling events |
| 0.4 | 20.2 | PID ARF6 PATHWAY | Arf6 signaling events |
| 0.4 | 6.9 | ST GA13 PATHWAY | G alpha 13 Pathway |
| 0.4 | 7.1 | PID ER NONGENOMIC PATHWAY | Plasma membrane estrogen receptor signaling |
| 0.3 | 7.9 | PID NFKAPPAB CANONICAL PATHWAY | Canonical NF-kappaB pathway |
| 0.3 | 1.5 | SA G2 AND M PHASES | Cdc25 activates the cdc2/cyclin B complex to induce the G2/M transition. |
| 0.3 | 14.6 | PID TNF PATHWAY | TNF receptor signaling pathway |
| 0.3 | 3.6 | PID IL2 PI3K PATHWAY | IL2 signaling events mediated by PI3K |
| 0.3 | 3.6 | ST GA12 PATHWAY | G alpha 12 Pathway |
| 0.2 | 6.2 | PID CD40 PATHWAY | CD40/CD40L signaling |
| 0.2 | 4.0 | PID HEDGEHOG GLI PATHWAY | Hedgehog signaling events mediated by Gli proteins |
| 0.2 | 7.5 | PID ALK1 PATHWAY | ALK1 signaling events |
| 0.2 | 0.8 | NABA CORE MATRISOME | Ensemble of genes encoding core extracellular matrix including ECM glycoproteins, collagens and proteoglycans |
| 0.2 | 1.6 | PID CXCR4 PATHWAY | CXCR4-mediated signaling events |
| 0.2 | 5.0 | PID AURORA A PATHWAY | Aurora A signaling |
| 0.2 | 7.0 | PID TELOMERASE PATHWAY | Regulation of Telomerase |
| 0.2 | 1.4 | PID ENDOTHELIN PATHWAY | Endothelins |
| 0.2 | 31.8 | NABA ECM GLYCOPROTEINS | Genes encoding structural ECM glycoproteins |
| 0.2 | 1.9 | PID EPHA FWDPATHWAY | EPHA forward signaling |
| 0.2 | 9.4 | PID FGF PATHWAY | FGF signaling pathway |
| 0.1 | 3.4 | ST JNK MAPK PATHWAY | JNK MAPK Pathway |
| 0.1 | 1.5 | PID ANTHRAX PATHWAY | Cellular roles of Anthrax toxin |
| 0.1 | 1.3 | PID CD8 TCR PATHWAY | TCR signaling in naïve CD8+ T cells |
| 0.1 | 5.8 | PID FANCONI PATHWAY | Fanconi anemia pathway |
| 0.1 | 10.6 | PID SMAD2 3NUCLEAR PATHWAY | Regulation of nuclear SMAD2/3 signaling |
| 0.1 | 2.9 | PID TRAIL PATHWAY | TRAIL signaling pathway |
| 0.1 | 8.8 | PID HNF3A PATHWAY | FOXA1 transcription factor network |
| 0.1 | 6.5 | PID NFAT TFPATHWAY | Calcineurin-regulated NFAT-dependent transcription in lymphocytes |
| 0.1 | 3.7 | ST WNT BETA CATENIN PATHWAY | Wnt/beta-catenin Pathway |
| 0.1 | 3.9 | PID ERBB NETWORK PATHWAY | ErbB receptor signaling network |
| 0.1 | 3.4 | PID WNT SIGNALING PATHWAY | Wnt signaling network |
| 0.1 | 1.8 | PID CIRCADIAN PATHWAY | Circadian rhythm pathway |
| 0.1 | 2.7 | PID INTEGRIN A4B1 PATHWAY | Alpha4 beta1 integrin signaling events |
| 0.1 | 0.8 | PID LYMPH ANGIOGENESIS PATHWAY | VEGFR3 signaling in lymphatic endothelium |
| 0.1 | 2.7 | ST T CELL SIGNAL TRANSDUCTION | T Cell Signal Transduction |
| 0.1 | 1.9 | PID A6B1 A6B4 INTEGRIN PATHWAY | a6b1 and a6b4 Integrin signaling |
| 0.1 | 1.0 | PID INTEGRIN5 PATHWAY | Beta5 beta6 beta7 and beta8 integrin cell surface interactions |
| 0.1 | 2.9 | PID RHOA PATHWAY | RhoA signaling pathway |
| 0.1 | 2.0 | PID FRA PATHWAY | Validated transcriptional targets of AP1 family members Fra1 and Fra2 |
| 0.1 | 14.6 | NABA ECM AFFILIATED | Genes encoding proteins affiliated structurally or functionally to extracellular matrix proteins |
| 0.1 | 2.8 | NABA PROTEOGLYCANS | Genes encoding proteoglycans |
| 0.1 | 19.8 | NABA ECM REGULATORS | Genes encoding enzymes and their regulators involved in the remodeling of the extracellular matrix |
| 0.1 | 1.3 | PID PTP1B PATHWAY | Signaling events mediated by PTP1B |
| 0.1 | 6.0 | PID MYC REPRESS PATHWAY | Validated targets of C-MYC transcriptional repression |
| 0.1 | 1.0 | PID NEPHRIN NEPH1 PATHWAY | Nephrin/Neph1 signaling in the kidney podocyte |
| 0.1 | 0.8 | PID RAS PATHWAY | Regulation of Ras family activation |
| 0.1 | 2.0 | PID MTOR 4PATHWAY | mTOR signaling pathway |
| 0.1 | 16.0 | NABA SECRETED FACTORS | Genes encoding secreted soluble factors |
| 0.0 | 0.9 | PID HDAC CLASSIII PATHWAY | Signaling events mediated by HDAC Class III |
| 0.0 | 0.9 | PID AR TF PATHWAY | Regulation of Androgen receptor activity |
| 0.0 | 0.3 | PID FAK PATHWAY | Signaling events mediated by focal adhesion kinase |
| 0.0 | 0.8 | PID IL12 2PATHWAY | IL12-mediated signaling events |
| 0.0 | 0.8 | PID IL4 2PATHWAY | IL4-mediated signaling events |
| 0.0 | 0.8 | PID ARF6 TRAFFICKING PATHWAY | Arf6 trafficking events |
| 0.0 | 0.3 | PID NFAT 3PATHWAY | Role of Calcineurin-dependent NFAT signaling in lymphocytes |
Gene overrepresentation in curated gene sets: REACTOME pathways category:
| Log-likelihood per target | Total log-likelihood | Term | Description |
|---|---|---|---|
| 2.7 | 8.0 | REACTOME REGULATION OF KIT SIGNALING | Genes involved in Regulation of KIT signaling |
| 2.0 | 6.0 | REACTOME MRNA CAPPING | Genes involved in mRNA Capping |
| 1.9 | 17.1 | REACTOME RNA POL III TRANSCRIPTION INITIATION FROM TYPE 3 PROMOTER | Genes involved in RNA Polymerase III Transcription Initiation From Type 3 Promoter |
| 1.9 | 30.2 | REACTOME REVERSIBLE HYDRATION OF CARBON DIOXIDE | Genes involved in Reversible Hydration of Carbon Dioxide |
| 1.7 | 50.5 | REACTOME RNA POL III TRANSCRIPTION INITIATION FROM TYPE 2 PROMOTER | Genes involved in RNA Polymerase III Transcription Initiation From Type 2 Promoter |
| 1.6 | 22.8 | REACTOME ACTIVATION OF CHAPERONE GENES BY ATF6 ALPHA | Genes involved in Activation of Chaperone Genes by ATF6-alpha |
| 1.6 | 3.2 | REACTOME ACYL CHAIN REMODELLING OF PI | Genes involved in Acyl chain remodelling of PI |
| 1.4 | 39.7 | REACTOME JNK C JUN KINASES PHOSPHORYLATION AND ACTIVATION MEDIATED BY ACTIVATED HUMAN TAK1 | Genes involved in JNK (c-Jun kinases) phosphorylation and activation mediated by activated human TAK1 |
| 1.2 | 62.1 | REACTOME MEIOTIC SYNAPSIS | Genes involved in Meiotic Synapsis |
| 1.1 | 17.3 | REACTOME SYNTHESIS OF SUBSTRATES IN N GLYCAN BIOSYTHESIS | Genes involved in Synthesis of substrates in N-glycan biosythesis |
| 1.1 | 51.5 | REACTOME SYNTHESIS OF PIPS AT THE PLASMA MEMBRANE | Genes involved in Synthesis of PIPs at the plasma membrane |
| 1.0 | 21.5 | REACTOME FACILITATIVE NA INDEPENDENT GLUCOSE TRANSPORTERS | Genes involved in Facilitative Na+-independent glucose transporters |
| 1.0 | 1.0 | REACTOME PROLONGED ERK ACTIVATION EVENTS | Genes involved in Prolonged ERK activation events |
| 1.0 | 12.8 | REACTOME NONSENSE MEDIATED DECAY ENHANCED BY THE EXON JUNCTION COMPLEX | Genes involved in Nonsense Mediated Decay Enhanced by the Exon Junction Complex |
| 0.8 | 27.8 | REACTOME GLUTAMATE NEUROTRANSMITTER RELEASE CYCLE | Genes involved in Glutamate Neurotransmitter Release Cycle |
| 0.8 | 10.8 | REACTOME PROSTANOID LIGAND RECEPTORS | Genes involved in Prostanoid ligand receptors |
| 0.8 | 20.2 | REACTOME ACYL CHAIN REMODELLING OF PC | Genes involved in Acyl chain remodelling of PC |
| 0.8 | 6.4 | REACTOME RNA POL I PROMOTER OPENING | Genes involved in RNA Polymerase I Promoter Opening |
| 0.8 | 46.1 | REACTOME VOLTAGE GATED POTASSIUM CHANNELS | Genes involved in Voltage gated Potassium channels |
| 0.7 | 11.8 | REACTOME MITOCHONDRIAL TRNA AMINOACYLATION | Genes involved in Mitochondrial tRNA aminoacylation |
| 0.7 | 6.2 | REACTOME CYTOSOLIC TRNA AMINOACYLATION | Genes involved in Cytosolic tRNA aminoacylation |
| 0.6 | 1.9 | REACTOME NOTCH HLH TRANSCRIPTION PATHWAY | Genes involved in Notch-HLH transcription pathway |
| 0.6 | 7.6 | REACTOME IL 6 SIGNALING | Genes involved in Interleukin-6 signaling |
| 0.6 | 11.2 | REACTOME ALPHA LINOLENIC ACID ALA METABOLISM | Genes involved in alpha-linolenic acid (ALA) metabolism |
| 0.5 | 3.0 | REACTOME ACETYLCHOLINE NEUROTRANSMITTER RELEASE CYCLE | Genes involved in Acetylcholine Neurotransmitter Release Cycle |
| 0.5 | 8.4 | REACTOME FANCONI ANEMIA PATHWAY | Genes involved in Fanconi Anemia pathway |
| 0.5 | 15.2 | REACTOME SPHINGOLIPID DE NOVO BIOSYNTHESIS | Genes involved in Sphingolipid de novo biosynthesis |
| 0.4 | 8.8 | REACTOME BASE FREE SUGAR PHOSPHATE REMOVAL VIA THE SINGLE NUCLEOTIDE REPLACEMENT PATHWAY | Genes involved in Base-free sugar-phosphate removal via the single-nucleotide replacement pathway |
| 0.4 | 28.4 | REACTOME COLLAGEN FORMATION | Genes involved in Collagen formation |
| 0.4 | 5.3 | REACTOME YAP1 AND WWTR1 TAZ STIMULATED GENE EXPRESSION | Genes involved in YAP1- and WWTR1 (TAZ)-stimulated gene expression |
| 0.4 | 34.9 | REACTOME NOTCH1 INTRACELLULAR DOMAIN REGULATES TRANSCRIPTION | Genes involved in NOTCH1 Intracellular Domain Regulates Transcription |
| 0.4 | 12.5 | REACTOME SIGNALING BY FGFR1 FUSION MUTANTS | Genes involved in Signaling by FGFR1 fusion mutants |
| 0.4 | 5.6 | REACTOME SEROTONIN RECEPTORS | Genes involved in Serotonin receptors |
| 0.4 | 8.7 | REACTOME SYNTHESIS OF GLYCOSYLPHOSPHATIDYLINOSITOL GPI | Genes involved in Synthesis of glycosylphosphatidylinositol (GPI) |
| 0.4 | 14.2 | REACTOME BMAL1 CLOCK NPAS2 ACTIVATES CIRCADIAN EXPRESSION | Genes involved in BMAL1:CLOCK/NPAS2 Activates Circadian Expression |
| 0.4 | 13.1 | REACTOME SMAD2 SMAD3 SMAD4 HETEROTRIMER REGULATES TRANSCRIPTION | Genes involved in SMAD2/SMAD3:SMAD4 heterotrimer regulates transcription |
| 0.4 | 4.3 | REACTOME ACTIVATION OF THE AP1 FAMILY OF TRANSCRIPTION FACTORS | Genes involved in Activation of the AP-1 family of transcription factors |
| 0.4 | 12.1 | REACTOME G0 AND EARLY G1 | Genes involved in G0 and Early G1 |
| 0.3 | 10.5 | REACTOME KERATAN SULFATE BIOSYNTHESIS | Genes involved in Keratan sulfate biosynthesis |
| 0.3 | 0.7 | REACTOME RORA ACTIVATES CIRCADIAN EXPRESSION | Genes involved in RORA Activates Circadian Expression |
| 0.3 | 11.8 | REACTOME CD28 DEPENDENT PI3K AKT SIGNALING | Genes involved in CD28 dependent PI3K/Akt signaling |
| 0.3 | 6.5 | REACTOME ANTIGEN ACTIVATES B CELL RECEPTOR LEADING TO GENERATION OF SECOND MESSENGERS | Genes involved in Antigen Activates B Cell Receptor Leading to Generation of Second Messengers |
| 0.3 | 11.6 | REACTOME REGULATION OF HYPOXIA INDUCIBLE FACTOR HIF BY OXYGEN | Genes involved in Regulation of Hypoxia-inducible Factor (HIF) by Oxygen |
| 0.3 | 3.6 | REACTOME RECRUITMENT OF NUMA TO MITOTIC CENTROSOMES | Genes involved in Recruitment of NuMA to mitotic centrosomes |
| 0.3 | 3.9 | REACTOME NCAM SIGNALING FOR NEURITE OUT GROWTH | Genes involved in NCAM signaling for neurite out-growth |
| 0.3 | 9.0 | REACTOME PKA MEDIATED PHOSPHORYLATION OF CREB | Genes involved in PKA-mediated phosphorylation of CREB |
| 0.3 | 5.6 | REACTOME PROLACTIN RECEPTOR SIGNALING | Genes involved in Prolactin receptor signaling |
| 0.3 | 4.8 | REACTOME SYNTHESIS OF PE | Genes involved in Synthesis of PE |
| 0.3 | 2.7 | REACTOME SYNTHESIS SECRETION AND INACTIVATION OF GIP | Genes involved in Synthesis, Secretion, and Inactivation of Glucose-dependent Insulinotropic Polypeptide (GIP) |
| 0.3 | 7.1 | REACTOME ACTIVATION OF RAC | Genes involved in Activation of Rac |
| 0.3 | 7.4 | REACTOME PIP3 ACTIVATES AKT SIGNALING | Genes involved in PIP3 activates AKT signaling |
| 0.3 | 11.8 | REACTOME SEMA4D INDUCED CELL MIGRATION AND GROWTH CONE COLLAPSE | Genes involved in Sema4D induced cell migration and growth-cone collapse |
| 0.3 | 45.6 | REACTOME SIGNALING BY RHO GTPASES | Genes involved in Signaling by Rho GTPases |
| 0.3 | 4.5 | REACTOME GROWTH HORMONE RECEPTOR SIGNALING | Genes involved in Growth hormone receptor signaling |
| 0.3 | 2.3 | REACTOME RAP1 SIGNALLING | Genes involved in Rap1 signalling |
| 0.3 | 3.3 | REACTOME ROLE OF DCC IN REGULATING APOPTOSIS | Genes involved in Role of DCC in regulating apoptosis |
| 0.3 | 6.9 | REACTOME SIGNALING BY BMP | Genes involved in Signaling by BMP |
| 0.3 | 5.3 | REACTOME HDL MEDIATED LIPID TRANSPORT | Genes involved in HDL-mediated lipid transport |
| 0.2 | 5.2 | REACTOME REGULATION OF IFNA SIGNALING | Genes involved in Regulation of IFNA signaling |
| 0.2 | 1.7 | REACTOME PRE NOTCH TRANSCRIPTION AND TRANSLATION | Genes involved in Pre-NOTCH Transcription and Translation |
| 0.2 | 23.3 | REACTOME MUSCLE CONTRACTION | Genes involved in Muscle contraction |
| 0.2 | 8.9 | REACTOME INTERACTION BETWEEN L1 AND ANKYRINS | Genes involved in Interaction between L1 and Ankyrins |
| 0.2 | 2.3 | REACTOME G2 M DNA DAMAGE CHECKPOINT | Genes involved in G2/M DNA damage checkpoint |
| 0.2 | 3.2 | REACTOME NEF MEDIATED DOWNREGULATION OF MHC CLASS I COMPLEX CELL SURFACE EXPRESSION | Genes involved in Nef mediated downregulation of MHC class I complex cell surface expression |
| 0.2 | 5.1 | REACTOME INTRINSIC PATHWAY | Genes involved in Intrinsic Pathway |
| 0.2 | 4.8 | REACTOME OTHER SEMAPHORIN INTERACTIONS | Genes involved in Other semaphorin interactions |
| 0.2 | 69.0 | REACTOME GENERIC TRANSCRIPTION PATHWAY | Genes involved in Generic Transcription Pathway |
| 0.2 | 5.0 | REACTOME HIGHLY CALCIUM PERMEABLE POSTSYNAPTIC NICOTINIC ACETYLCHOLINE RECEPTORS | Genes involved in Highly calcium permeable postsynaptic nicotinic acetylcholine receptors |
| 0.2 | 4.1 | REACTOME SIGNALING BY FGFR3 MUTANTS | Genes involved in Signaling by FGFR3 mutants |
| 0.2 | 4.4 | REACTOME DCC MEDIATED ATTRACTIVE SIGNALING | Genes involved in DCC mediated attractive signaling |
| 0.2 | 4.8 | REACTOME EFFECTS OF PIP2 HYDROLYSIS | Genes involved in Effects of PIP2 hydrolysis |
| 0.2 | 1.5 | REACTOME ERKS ARE INACTIVATED | Genes involved in ERKs are inactivated |
| 0.2 | 5.9 | REACTOME BRANCHED CHAIN AMINO ACID CATABOLISM | Genes involved in Branched-chain amino acid catabolism |
| 0.2 | 5.0 | REACTOME CONVERSION FROM APC C CDC20 TO APC C CDH1 IN LATE ANAPHASE | Genes involved in Conversion from APC/C:Cdc20 to APC/C:Cdh1 in late anaphase |
| 0.2 | 2.2 | REACTOME ACTIVATED POINT MUTANTS OF FGFR2 | Genes involved in Activated point mutants of FGFR2 |
| 0.2 | 1.9 | REACTOME HORMONE SENSITIVE LIPASE HSL MEDIATED TRIACYLGLYCEROL HYDROLYSIS | Genes involved in Hormone-sensitive lipase (HSL)-mediated triacylglycerol hydrolysis |
| 0.2 | 7.9 | REACTOME POTASSIUM CHANNELS | Genes involved in Potassium Channels |
| 0.2 | 2.4 | REACTOME RNA POL I TRANSCRIPTION INITIATION | Genes involved in RNA Polymerase I Transcription Initiation |
| 0.2 | 5.3 | REACTOME ACTIVATED AMPK STIMULATES FATTY ACID OXIDATION IN MUSCLE | Genes involved in Activated AMPK stimulates fatty-acid oxidation in muscle |
| 0.2 | 10.3 | REACTOME GLYCOLYSIS | Genes involved in Glycolysis |
| 0.2 | 3.2 | REACTOME P2Y RECEPTORS | Genes involved in P2Y receptors |
| 0.2 | 1.3 | REACTOME PEPTIDE CHAIN ELONGATION | Genes involved in Peptide chain elongation |
| 0.2 | 1.5 | REACTOME PHOSPHOLIPID METABOLISM | Genes involved in Phospholipid metabolism |
| 0.2 | 5.9 | REACTOME ADHERENS JUNCTIONS INTERACTIONS | Genes involved in Adherens junctions interactions |
| 0.2 | 2.1 | REACTOME THE ACTIVATION OF ARYLSULFATASES | Genes involved in The activation of arylsulfatases |
| 0.2 | 0.3 | REACTOME RESOLUTION OF AP SITES VIA THE SINGLE NUCLEOTIDE REPLACEMENT PATHWAY | Genes involved in Resolution of AP sites via the single-nucleotide replacement pathway |
| 0.2 | 3.3 | REACTOME CTNNB1 PHOSPHORYLATION CASCADE | Genes involved in Beta-catenin phosphorylation cascade |
| 0.2 | 1.5 | REACTOME GPVI MEDIATED ACTIVATION CASCADE | Genes involved in GPVI-mediated activation cascade |
| 0.1 | 3.6 | REACTOME REGULATION OF INSULIN LIKE GROWTH FACTOR IGF ACTIVITY BY INSULIN LIKE GROWTH FACTOR BINDING PROTEINS IGFBPS | Genes involved in Regulation of Insulin-like Growth Factor (IGF) Activity by Insulin-like Growth Factor Binding Proteins (IGFBPs) |
| 0.1 | 8.7 | REACTOME RNA POL II PRE TRANSCRIPTION EVENTS | Genes involved in RNA Polymerase II Pre-transcription Events |
| 0.1 | 4.7 | REACTOME REGULATION OF BETA CELL DEVELOPMENT | Genes involved in Regulation of beta-cell development |
| 0.1 | 0.9 | REACTOME TANDEM PORE DOMAIN POTASSIUM CHANNELS | Genes involved in Tandem pore domain potassium channels |
| 0.1 | 1.5 | REACTOME OPSINS | Genes involved in Opsins |
| 0.1 | 0.9 | REACTOME NUCLEOTIDE LIKE PURINERGIC RECEPTORS | Genes involved in Nucleotide-like (purinergic) receptors |
| 0.1 | 2.6 | REACTOME CLASS C 3 METABOTROPIC GLUTAMATE PHEROMONE RECEPTORS | Genes involved in Class C/3 (Metabotropic glutamate/pheromone receptors) |
| 0.1 | 2.2 | REACTOME SIGNAL TRANSDUCTION BY L1 | Genes involved in Signal transduction by L1 |
| 0.1 | 2.3 | REACTOME GAP JUNCTION ASSEMBLY | Genes involved in Gap junction assembly |
| 0.1 | 3.8 | REACTOME CHONDROITIN SULFATE BIOSYNTHESIS | Genes involved in Chondroitin sulfate biosynthesis |
| 0.1 | 6.4 | REACTOME NCAM1 INTERACTIONS | Genes involved in NCAM1 interactions |
| 0.1 | 2.6 | REACTOME AMINE DERIVED HORMONES | Genes involved in Amine-derived hormones |
| 0.1 | 2.1 | REACTOME SYNTHESIS OF PA | Genes involved in Synthesis of PA |
| 0.1 | 1.1 | REACTOME RETROGRADE NEUROTROPHIN SIGNALLING | Genes involved in Retrograde neurotrophin signalling |
| 0.1 | 1.8 | REACTOME TRAFFICKING OF GLUR2 CONTAINING AMPA RECEPTORS | Genes involved in Trafficking of GluR2-containing AMPA receptors |
| 0.1 | 0.4 | REACTOME ENERGY DEPENDENT REGULATION OF MTOR BY LKB1 AMPK | Genes involved in Energy dependent regulation of mTOR by LKB1-AMPK |
| 0.1 | 1.2 | REACTOME ETHANOL OXIDATION | Genes involved in Ethanol oxidation |
| 0.1 | 1.6 | REACTOME APOPTOTIC CLEAVAGE OF CELL ADHESION PROTEINS | Genes involved in Apoptotic cleavage of cell adhesion proteins |
| 0.1 | 3.5 | REACTOME GABA A RECEPTOR ACTIVATION | Genes involved in GABA A receptor activation |
| 0.1 | 2.9 | REACTOME AMINE LIGAND BINDING RECEPTORS | Genes involved in Amine ligand-binding receptors |
| 0.1 | 1.1 | REACTOME PLATELET CALCIUM HOMEOSTASIS | Genes involved in Platelet calcium homeostasis |
| 0.1 | 3.8 | REACTOME METABOLISM OF STEROID HORMONES AND VITAMINS A AND D | Genes involved in Metabolism of steroid hormones and vitamins A and D |
| 0.1 | 0.5 | REACTOME DOPAMINE NEUROTRANSMITTER RELEASE CYCLE | Genes involved in Dopamine Neurotransmitter Release Cycle |
| 0.1 | 3.0 | REACTOME EGFR DOWNREGULATION | Genes involved in EGFR downregulation |
| 0.1 | 2.7 | REACTOME IONOTROPIC ACTIVITY OF KAINATE RECEPTORS | Genes involved in Ionotropic activity of Kainate Receptors |
| 0.1 | 19.5 | REACTOME PEPTIDE LIGAND BINDING RECEPTORS | Genes involved in Peptide ligand-binding receptors |
| 0.1 | 4.1 | REACTOME CGMP EFFECTS | Genes involved in cGMP effects |
| 0.1 | 1.8 | REACTOME PI3K EVENTS IN ERBB4 SIGNALING | Genes involved in PI3K events in ERBB4 signaling |
| 0.1 | 1.6 | REACTOME TAK1 ACTIVATES NFKB BY PHOSPHORYLATION AND ACTIVATION OF IKKS COMPLEX | Genes involved in TAK1 activates NFkB by phosphorylation and activation of IKKs complex |
| 0.1 | 1.8 | REACTOME UNBLOCKING OF NMDA RECEPTOR GLUTAMATE BINDING AND ACTIVATION | Genes involved in Unblocking of NMDA receptor, glutamate binding and activation |
| 0.1 | 1.1 | REACTOME SIGNALING BY HIPPO | Genes involved in Signaling by Hippo |
| 0.1 | 2.2 | REACTOME IL1 SIGNALING | Genes involved in Interleukin-1 signaling |
| 0.1 | 4.0 | REACTOME ION TRANSPORT BY P TYPE ATPASES | Genes involved in Ion transport by P-type ATPases |
| 0.1 | 1.1 | REACTOME SYNTHESIS OF PC | Genes involved in Synthesis of PC |
| 0.1 | 2.3 | REACTOME CLASS B 2 SECRETIN FAMILY RECEPTORS | Genes involved in Class B/2 (Secretin family receptors) |
| 0.1 | 0.5 | REACTOME E2F ENABLED INHIBITION OF PRE REPLICATION COMPLEX FORMATION | Genes involved in E2F-enabled inhibition of pre-replication complex formation |
| 0.1 | 1.3 | REACTOME CRMPS IN SEMA3A SIGNALING | Genes involved in CRMPs in Sema3A signaling |
| 0.1 | 1.3 | REACTOME PLC BETA MEDIATED EVENTS | Genes involved in PLC beta mediated events |
| 0.0 | 1.2 | REACTOME EXTRINSIC PATHWAY FOR APOPTOSIS | Genes involved in Extrinsic Pathway for Apoptosis |
| 0.0 | 0.7 | REACTOME TERMINATION OF O GLYCAN BIOSYNTHESIS | Genes involved in Termination of O-glycan biosynthesis |
| 0.0 | 2.6 | REACTOME INTERFERON ALPHA BETA SIGNALING | Genes involved in Interferon alpha/beta signaling |
| 0.0 | 0.2 | REACTOME FRS2 MEDIATED CASCADE | Genes involved in FRS2-mediated cascade |
| 0.0 | 0.5 | REACTOME INSULIN SYNTHESIS AND PROCESSING | Genes involved in Insulin Synthesis and Processing |
| 0.0 | 0.4 | REACTOME EXTRACELLULAR MATRIX ORGANIZATION | Genes involved in Extracellular matrix organization |
| 0.0 | 0.3 | REACTOME INFLAMMASOMES | Genes involved in Inflammasomes |