Project
GNF SymAtlas + NCI-60 cancer cell lines, human (Su, 2004; Ross, 2000)
Navigation
Downloads
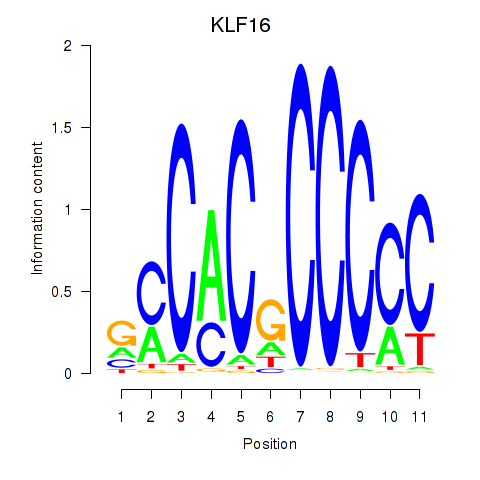
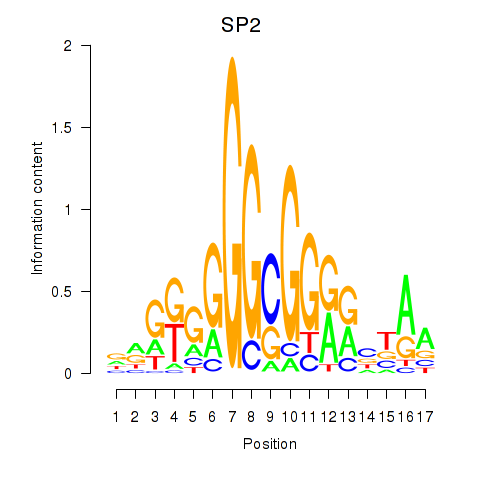
Results for KLF16_SP2
Z-value: 1.69
Motif logo
Transcription factors associated with KLF16_SP2
| Gene Symbol | Gene ID | Gene Info |
|---|---|---|
|
KLF16
|
ENSG00000129911.9 | KLF16 |
|
SP2
|
ENSG00000167182.15 | SP2 |
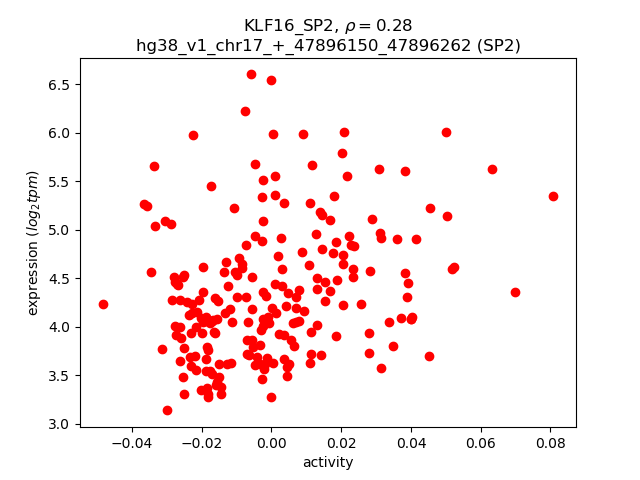
Activity-expression correlation:
| Gene | Promoter | Pearson corr. coef. | P-value | Plot |
|---|---|---|---|---|
| SP2 | hg38_v1_chr17_+_47896150_47896262 | 0.28 | 2.6e-05 | Click! |
Activity profile of KLF16_SP2 motif
Sorted Z-values of KLF16_SP2 motif
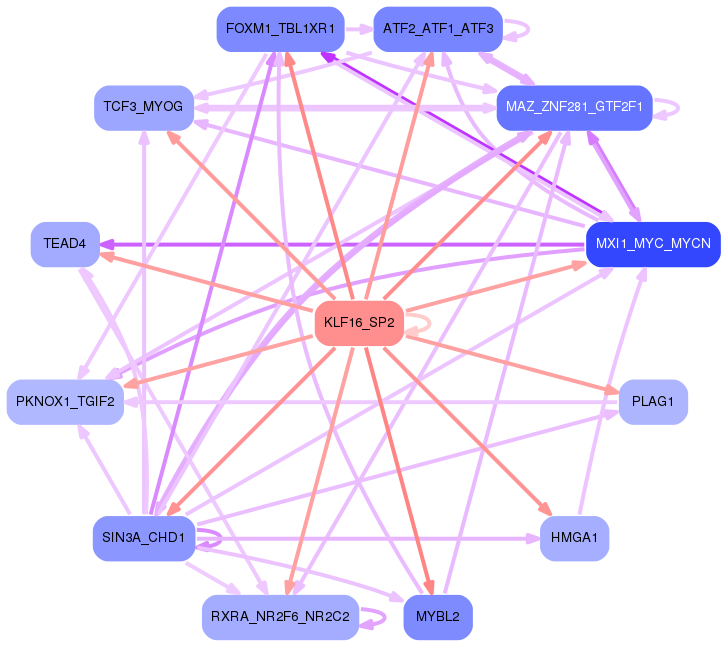
Network of associatons between targets according to the STRING database.

First level regulatory network of KLF16_SP2
Gene Ontology Analysis
Gene overrepresentation in biological process category:
| Log-likelihood per target | Total log-likelihood | Term | Description |
|---|---|---|---|
| 16.5 | 49.4 | GO:0046452 | dihydrofolate metabolic process(GO:0046452) |
| 14.6 | 43.7 | GO:0006842 | tricarboxylic acid transport(GO:0006842) citrate transport(GO:0015746) |
| 13.6 | 40.9 | GO:0090669 | telomerase RNA stabilization(GO:0090669) |
| 13.4 | 13.4 | GO:1902850 | microtubule cytoskeleton organization involved in mitosis(GO:1902850) |
| 12.0 | 59.8 | GO:0015862 | uridine transport(GO:0015862) |
| 11.7 | 46.7 | GO:2000653 | regulation of genetic imprinting(GO:2000653) |
| 10.7 | 53.5 | GO:0071163 | DNA replication preinitiation complex assembly(GO:0071163) |
| 10.6 | 117.1 | GO:0085020 | protein K6-linked ubiquitination(GO:0085020) |
| 10.1 | 40.5 | GO:0000379 | tRNA-type intron splice site recognition and cleavage(GO:0000379) |
| 10.1 | 40.4 | GO:1904154 | positive regulation of retrograde protein transport, ER to cytosol(GO:1904154) |
| 10.1 | 30.2 | GO:0051793 | medium-chain fatty acid catabolic process(GO:0051793) |
| 9.9 | 29.7 | GO:0003420 | regulation of growth plate cartilage chondrocyte proliferation(GO:0003420) |
| 9.9 | 9.9 | GO:2000819 | regulation of nucleotide-excision repair(GO:2000819) |
| 9.3 | 83.5 | GO:0034723 | DNA replication-dependent nucleosome assembly(GO:0006335) DNA replication-dependent nucleosome organization(GO:0034723) |
| 9.2 | 73.9 | GO:0016128 | phytosteroid metabolic process(GO:0016128) phytosteroid biosynthetic process(GO:0016129) |
| 9.2 | 55.3 | GO:0006021 | inositol biosynthetic process(GO:0006021) |
| 9.1 | 36.3 | GO:0090202 | transcriptional activation by promoter-enhancer looping(GO:0071733) gene looping(GO:0090202) dsDNA loop formation(GO:0090579) |
| 8.7 | 26.1 | GO:1904772 | hepatocyte homeostasis(GO:0036333) response to tetrachloromethane(GO:1904772) |
| 8.5 | 187.1 | GO:0007084 | mitotic nuclear envelope reassembly(GO:0007084) |
| 8.4 | 25.2 | GO:0006097 | glyoxylate cycle(GO:0006097) |
| 8.4 | 67.2 | GO:0006572 | tyrosine catabolic process(GO:0006572) |
| 8.0 | 40.1 | GO:0019322 | pentose biosynthetic process(GO:0019322) |
| 8.0 | 8.0 | GO:0000022 | mitotic spindle elongation(GO:0000022) |
| 7.8 | 54.5 | GO:0030421 | defecation(GO:0030421) |
| 7.8 | 23.3 | GO:0030951 | establishment or maintenance of microtubule cytoskeleton polarity(GO:0030951) |
| 7.7 | 69.6 | GO:0006167 | AMP biosynthetic process(GO:0006167) |
| 7.7 | 54.0 | GO:0006189 | 'de novo' IMP biosynthetic process(GO:0006189) |
| 7.5 | 22.6 | GO:0046292 | formaldehyde metabolic process(GO:0046292) |
| 7.5 | 104.6 | GO:0070934 | CRD-mediated mRNA stabilization(GO:0070934) |
| 7.4 | 44.4 | GO:0006226 | dUMP biosynthetic process(GO:0006226) |
| 7.2 | 28.9 | GO:0009440 | cyanate metabolic process(GO:0009439) cyanate catabolic process(GO:0009440) |
| 7.2 | 21.5 | GO:1903976 | negative regulation of glial cell migration(GO:1903976) |
| 7.1 | 21.4 | GO:0060623 | regulation of chromosome condensation(GO:0060623) |
| 7.1 | 92.4 | GO:0006265 | DNA topological change(GO:0006265) |
| 7.0 | 21.1 | GO:0007057 | spindle assembly involved in female meiosis I(GO:0007057) |
| 7.0 | 20.9 | GO:0046586 | regulation of calcium-dependent cell-cell adhesion(GO:0046586) |
| 7.0 | 104.3 | GO:0030422 | production of siRNA involved in RNA interference(GO:0030422) |
| 6.9 | 69.0 | GO:0061732 | mitochondrial acetyl-CoA biosynthetic process from pyruvate(GO:0061732) |
| 6.6 | 13.3 | GO:0006231 | dTMP biosynthetic process(GO:0006231) dTMP metabolic process(GO:0046073) |
| 6.6 | 19.7 | GO:0090402 | oncogene-induced cell senescence(GO:0090402) |
| 6.5 | 6.5 | GO:0021747 | cochlear nucleus development(GO:0021747) |
| 6.5 | 26.1 | GO:0010796 | regulation of multivesicular body size(GO:0010796) |
| 6.5 | 45.2 | GO:0043985 | histone H4-R3 methylation(GO:0043985) |
| 6.4 | 25.5 | GO:0036496 | regulation of translational initiation by eIF2 alpha dephosphorylation(GO:0036496) |
| 6.3 | 37.9 | GO:0010032 | meiotic chromosome condensation(GO:0010032) |
| 6.2 | 18.5 | GO:0090149 | mitochondrial membrane fission(GO:0090149) |
| 6.1 | 12.3 | GO:0051754 | meiotic sister chromatid cohesion, centromeric(GO:0051754) |
| 5.9 | 88.4 | GO:0070986 | left/right axis specification(GO:0070986) |
| 5.8 | 35.1 | GO:0097052 | L-kynurenine metabolic process(GO:0097052) |
| 5.8 | 11.6 | GO:1904844 | response to L-glutamine(GO:1904844) cellular response to L-glutamine(GO:1904845) |
| 5.7 | 17.1 | GO:0015920 | lipopolysaccharide transport(GO:0015920) |
| 5.7 | 17.0 | GO:2000706 | amniotic stem cell differentiation(GO:0097086) negative regulation of dense core granule biogenesis(GO:2000706) negative regulation of mesenchymal stem cell differentiation(GO:2000740) regulation of amniotic stem cell differentiation(GO:2000797) negative regulation of amniotic stem cell differentiation(GO:2000798) |
| 5.6 | 11.3 | GO:0034729 | histone H3-K79 methylation(GO:0034729) |
| 5.6 | 67.6 | GO:0051315 | attachment of mitotic spindle microtubules to kinetochore(GO:0051315) |
| 5.6 | 22.5 | GO:0007144 | female meiosis I(GO:0007144) |
| 5.6 | 28.1 | GO:0006535 | cysteine biosynthetic process from serine(GO:0006535) |
| 5.6 | 22.3 | GO:0006272 | leading strand elongation(GO:0006272) |
| 5.6 | 72.4 | GO:0000972 | transcription-dependent tethering of RNA polymerase II gene DNA at nuclear periphery(GO:0000972) |
| 5.6 | 22.2 | GO:0044210 | 'de novo' CTP biosynthetic process(GO:0044210) |
| 5.5 | 27.7 | GO:0006177 | GMP biosynthetic process(GO:0006177) |
| 5.5 | 87.2 | GO:0043248 | proteasome assembly(GO:0043248) |
| 5.4 | 16.3 | GO:1903382 | neuron intrinsic apoptotic signaling pathway in response to endoplasmic reticulum stress(GO:0036483) regulation of endoplasmic reticulum stress-induced neuron intrinsic apoptotic signaling pathway(GO:1903381) negative regulation of endoplasmic reticulum stress-induced neuron intrinsic apoptotic signaling pathway(GO:1903382) |
| 5.4 | 27.2 | GO:1902626 | assembly of large subunit precursor of preribosome(GO:1902626) |
| 5.3 | 10.6 | GO:0002840 | T cell mediated immune response to tumor cell(GO:0002424) regulation of T cell mediated immune response to tumor cell(GO:0002840) |
| 5.2 | 26.1 | GO:0014038 | regulation of Schwann cell differentiation(GO:0014038) |
| 5.2 | 15.6 | GO:0018312 | peptidyl-serine ADP-ribosylation(GO:0018312) |
| 5.2 | 15.6 | GO:0042946 | glucoside transport(GO:0042946) |
| 5.2 | 15.5 | GO:1902594 | viral penetration into host nucleus(GO:0075732) multi-organism nuclear import(GO:1902594) |
| 5.2 | 15.5 | GO:1904897 | regulation of hepatic stellate cell proliferation(GO:1904897) positive regulation of hepatic stellate cell proliferation(GO:1904899) hepatic stellate cell proliferation(GO:1990922) |
| 5.2 | 25.8 | GO:0044806 | G-quadruplex DNA unwinding(GO:0044806) |
| 5.1 | 15.2 | GO:0070901 | mitochondrial tRNA methylation(GO:0070901) |
| 5.0 | 15.0 | GO:1902445 | regulation of mitochondrial membrane permeability involved in programmed necrotic cell death(GO:1902445) |
| 5.0 | 49.9 | GO:0035865 | cellular response to potassium ion(GO:0035865) |
| 4.9 | 14.6 | GO:0060295 | regulation of cilium movement involved in cell motility(GO:0060295) regulation of cilium beat frequency involved in ciliary motility(GO:0060296) regulation of cilium-dependent cell motility(GO:1902019) |
| 4.9 | 63.2 | GO:2000622 | regulation of nuclear-transcribed mRNA catabolic process, nonsense-mediated decay(GO:2000622) negative regulation of nuclear-transcribed mRNA catabolic process, nonsense-mediated decay(GO:2000623) |
| 4.8 | 29.1 | GO:0000727 | double-strand break repair via break-induced replication(GO:0000727) |
| 4.8 | 19.3 | GO:1904637 | response to ionomycin(GO:1904636) cellular response to ionomycin(GO:1904637) |
| 4.8 | 14.5 | GO:1990022 | RNA polymerase II complex import to nucleus(GO:0044376) RNA polymerase III complex localization to nucleus(GO:1990022) |
| 4.8 | 28.8 | GO:0006398 | mRNA 3'-end processing by stem-loop binding and cleavage(GO:0006398) |
| 4.8 | 19.2 | GO:0033489 | cholesterol biosynthetic process via desmosterol(GO:0033489) cholesterol biosynthetic process via lathosterol(GO:0033490) |
| 4.8 | 9.6 | GO:0009838 | abscission(GO:0009838) |
| 4.8 | 23.8 | GO:0019464 | glycine catabolic process(GO:0006546) glycine decarboxylation via glycine cleavage system(GO:0019464) |
| 4.7 | 14.2 | GO:0070902 | mitochondrial tRNA pseudouridine synthesis(GO:0070902) |
| 4.7 | 56.8 | GO:0006268 | DNA unwinding involved in DNA replication(GO:0006268) |
| 4.7 | 18.8 | GO:0002188 | translation reinitiation(GO:0002188) |
| 4.7 | 18.8 | GO:0072186 | metanephric cap development(GO:0072185) metanephric cap morphogenesis(GO:0072186) metanephric cap mesenchymal cell proliferation involved in metanephros development(GO:0090094) regulation of metanephric cap mesenchymal cell proliferation(GO:0090095) positive regulation of metanephric cap mesenchymal cell proliferation(GO:0090096) |
| 4.7 | 4.7 | GO:0035087 | siRNA loading onto RISC involved in RNA interference(GO:0035087) |
| 4.7 | 18.7 | GO:1904117 | response to vasopressin(GO:1904116) cellular response to vasopressin(GO:1904117) |
| 4.6 | 27.7 | GO:2000254 | regulation of male germ cell proliferation(GO:2000254) |
| 4.6 | 27.7 | GO:0019264 | glycine biosynthetic process from serine(GO:0019264) |
| 4.6 | 36.7 | GO:0036444 | calcium ion transmembrane import into mitochondrion(GO:0036444) |
| 4.6 | 27.6 | GO:0033567 | DNA replication, Okazaki fragment processing(GO:0033567) |
| 4.6 | 13.8 | GO:1901301 | regulation of cargo loading into COPII-coated vesicle(GO:1901301) |
| 4.6 | 13.7 | GO:0034402 | recruitment of 3'-end processing factors to RNA polymerase II holoenzyme complex(GO:0034402) |
| 4.6 | 4.6 | GO:0010868 | negative regulation of triglyceride biosynthetic process(GO:0010868) |
| 4.6 | 22.8 | GO:0033387 | putrescine biosynthetic process from ornithine(GO:0033387) |
| 4.5 | 13.5 | GO:1902822 | regulation of late endosome to lysosome transport(GO:1902822) |
| 4.5 | 17.9 | GO:0016334 | morphogenesis of follicular epithelium(GO:0016333) establishment or maintenance of polarity of follicular epithelium(GO:0016334) establishment of planar polarity of follicular epithelium(GO:0042247) |
| 4.5 | 49.0 | GO:1902661 | positive regulation of glucose mediated signaling pathway(GO:1902661) |
| 4.5 | 31.2 | GO:0090666 | scaRNA localization to Cajal body(GO:0090666) |
| 4.4 | 13.2 | GO:0006059 | hexitol metabolic process(GO:0006059) |
| 4.4 | 17.6 | GO:0042776 | mitochondrial ATP synthesis coupled proton transport(GO:0042776) |
| 4.4 | 8.8 | GO:0006106 | fumarate metabolic process(GO:0006106) |
| 4.4 | 8.7 | GO:0000454 | snoRNA guided rRNA pseudouridine synthesis(GO:0000454) |
| 4.4 | 61.0 | GO:0001682 | tRNA 5'-leader removal(GO:0001682) |
| 4.4 | 13.1 | GO:1901993 | meiotic cell cycle phase transition(GO:0044771) regulation of meiotic cell cycle phase transition(GO:1901993) negative regulation of meiotic cell cycle phase transition(GO:1901994) |
| 4.3 | 13.0 | GO:0015798 | myo-inositol transport(GO:0015798) |
| 4.3 | 8.7 | GO:0006740 | NADPH regeneration(GO:0006740) |
| 4.3 | 21.6 | GO:0070269 | pyroptosis(GO:0070269) |
| 4.3 | 17.2 | GO:0044571 | [2Fe-2S] cluster assembly(GO:0044571) |
| 4.3 | 4.3 | GO:0048382 | mesendoderm development(GO:0048382) |
| 4.2 | 51.0 | GO:1905098 | negative regulation of guanyl-nucleotide exchange factor activity(GO:1905098) |
| 4.2 | 38.2 | GO:0031936 | negative regulation of chromatin silencing(GO:0031936) |
| 4.2 | 37.7 | GO:0031444 | slow-twitch skeletal muscle fiber contraction(GO:0031444) |
| 4.2 | 66.6 | GO:0045116 | protein neddylation(GO:0045116) |
| 4.1 | 8.3 | GO:0001732 | formation of cytoplasmic translation initiation complex(GO:0001732) |
| 4.1 | 12.4 | GO:0016344 | meiotic chromosome movement towards spindle pole(GO:0016344) |
| 4.1 | 28.8 | GO:0016584 | nucleosome positioning(GO:0016584) |
| 4.1 | 4.1 | GO:2000850 | negative regulation of steroid hormone secretion(GO:2000832) negative regulation of corticosteroid hormone secretion(GO:2000847) negative regulation of glucocorticoid secretion(GO:2000850) |
| 4.1 | 12.3 | GO:0072526 | pyridine-containing compound catabolic process(GO:0072526) |
| 4.1 | 44.9 | GO:0090435 | protein localization to nuclear envelope(GO:0090435) |
| 4.1 | 28.4 | GO:0008295 | spermidine biosynthetic process(GO:0008295) |
| 4.0 | 12.1 | GO:0044752 | response to human chorionic gonadotropin(GO:0044752) cellular response to thyroxine stimulus(GO:0097069) cellular response to L-phenylalanine derivative(GO:1904387) |
| 4.0 | 4.0 | GO:0010621 | negative regulation of transcription by transcription factor localization(GO:0010621) |
| 4.0 | 36.0 | GO:0000414 | regulation of histone H3-K36 methylation(GO:0000414) |
| 4.0 | 8.0 | GO:1902369 | negative regulation of RNA catabolic process(GO:1902369) |
| 4.0 | 4.0 | GO:0044828 | negative regulation by host of viral genome replication(GO:0044828) |
| 4.0 | 43.8 | GO:0009263 | deoxyribonucleotide biosynthetic process(GO:0009263) |
| 4.0 | 11.9 | GO:2000234 | positive regulation of ribosome biogenesis(GO:0090070) positive regulation of rRNA processing(GO:2000234) |
| 4.0 | 11.9 | GO:0035521 | monoubiquitinated histone deubiquitination(GO:0035521) monoubiquitinated histone H2A deubiquitination(GO:0035522) |
| 3.9 | 19.6 | GO:0006287 | base-excision repair, gap-filling(GO:0006287) |
| 3.9 | 11.7 | GO:1903033 | regulation of microtubule plus-end binding(GO:1903031) positive regulation of microtubule plus-end binding(GO:1903033) |
| 3.9 | 11.6 | GO:0015910 | peroxisomal long-chain fatty acid import(GO:0015910) |
| 3.8 | 15.2 | GO:1903182 | regulation of SUMO transferase activity(GO:1903182) positive regulation of SUMO transferase activity(GO:1903755) |
| 3.8 | 11.4 | GO:0090521 | glomerular visceral epithelial cell migration(GO:0090521) |
| 3.8 | 15.1 | GO:0006344 | maintenance of chromatin silencing(GO:0006344) |
| 3.8 | 64.0 | GO:0070389 | chaperone cofactor-dependent protein refolding(GO:0070389) |
| 3.7 | 37.5 | GO:0000056 | ribosomal small subunit export from nucleus(GO:0000056) |
| 3.7 | 74.4 | GO:0006228 | UTP biosynthetic process(GO:0006228) |
| 3.7 | 29.7 | GO:0055129 | proline biosynthetic process(GO:0006561) L-proline biosynthetic process(GO:0055129) |
| 3.7 | 40.5 | GO:0010756 | positive regulation of plasminogen activation(GO:0010756) |
| 3.7 | 29.4 | GO:0006307 | DNA dealkylation involved in DNA repair(GO:0006307) |
| 3.7 | 47.8 | GO:0042167 | porphyrin-containing compound catabolic process(GO:0006787) tetrapyrrole catabolic process(GO:0033015) heme catabolic process(GO:0042167) pigment catabolic process(GO:0046149) |
| 3.7 | 7.4 | GO:0070601 | centromeric sister chromatid cohesion(GO:0070601) |
| 3.7 | 11.0 | GO:0060382 | regulation of DNA strand elongation(GO:0060382) |
| 3.6 | 21.9 | GO:0030538 | embryonic genitalia morphogenesis(GO:0030538) |
| 3.6 | 10.9 | GO:0035544 | negative regulation of SNARE complex assembly(GO:0035544) |
| 3.6 | 83.6 | GO:0070979 | protein K11-linked ubiquitination(GO:0070979) |
| 3.6 | 10.9 | GO:1902498 | regulation of protein autoubiquitination(GO:1902498) |
| 3.6 | 10.9 | GO:0018364 | peptidyl-glutamine methylation(GO:0018364) |
| 3.6 | 21.7 | GO:0042997 | negative regulation of Golgi to plasma membrane protein transport(GO:0042997) |
| 3.6 | 3.6 | GO:0051177 | meiotic sister chromatid cohesion(GO:0051177) |
| 3.6 | 10.7 | GO:0018002 | N-terminal peptidyl-serine acetylation(GO:0017198) N-terminal peptidyl-glutamic acid acetylation(GO:0018002) peptidyl-serine acetylation(GO:0030920) |
| 3.6 | 10.7 | GO:2000687 | negative regulation of rubidium ion transport(GO:2000681) negative regulation of rubidium ion transmembrane transporter activity(GO:2000687) |
| 3.5 | 14.2 | GO:1902463 | protein localization to cell leading edge(GO:1902463) |
| 3.5 | 109.7 | GO:0061641 | chromatin remodeling at centromere(GO:0031055) CENP-A containing nucleosome assembly(GO:0034080) CENP-A containing chromatin organization(GO:0061641) |
| 3.5 | 10.6 | GO:0035511 | oxidative DNA demethylation(GO:0035511) |
| 3.5 | 38.8 | GO:0090343 | positive regulation of cell aging(GO:0090343) |
| 3.5 | 14.0 | GO:2000259 | positive regulation of complement activation(GO:0045917) positive regulation of protein activation cascade(GO:2000259) |
| 3.5 | 21.0 | GO:1904274 | tricellular tight junction assembly(GO:1904274) |
| 3.5 | 10.4 | GO:0070407 | oxidation-dependent protein catabolic process(GO:0070407) |
| 3.5 | 107.3 | GO:0006270 | DNA replication initiation(GO:0006270) |
| 3.4 | 10.3 | GO:0071816 | tail-anchored membrane protein insertion into ER membrane(GO:0071816) |
| 3.4 | 41.2 | GO:0019388 | galactose catabolic process(GO:0019388) |
| 3.4 | 6.8 | GO:0006166 | purine ribonucleoside salvage(GO:0006166) |
| 3.4 | 27.2 | GO:1901419 | regulation of response to alcohol(GO:1901419) |
| 3.4 | 6.8 | GO:0070914 | UV-damage excision repair(GO:0070914) |
| 3.4 | 6.8 | GO:0071681 | response to indole-3-methanol(GO:0071680) cellular response to indole-3-methanol(GO:0071681) |
| 3.4 | 30.5 | GO:0060613 | fat pad development(GO:0060613) |
| 3.4 | 3.4 | GO:0030221 | basophil differentiation(GO:0030221) |
| 3.3 | 10.0 | GO:1903352 | ornithine transport(GO:0015822) L-ornithine transmembrane transport(GO:1903352) |
| 3.3 | 23.3 | GO:0070537 | histone H2A K63-linked deubiquitination(GO:0070537) |
| 3.3 | 3.3 | GO:1902544 | regulation of DNA N-glycosylase activity(GO:1902544) |
| 3.3 | 29.7 | GO:0071578 | zinc II ion transmembrane import(GO:0071578) |
| 3.3 | 9.9 | GO:0045876 | positive regulation of sister chromatid cohesion(GO:0045876) |
| 3.3 | 9.9 | GO:2000301 | negative regulation of synaptic vesicle exocytosis(GO:2000301) |
| 3.3 | 13.2 | GO:0000961 | negative regulation of mitochondrial RNA catabolic process(GO:0000961) |
| 3.3 | 19.7 | GO:0008582 | regulation of synaptic growth at neuromuscular junction(GO:0008582) |
| 3.3 | 6.6 | GO:0005997 | xylulose metabolic process(GO:0005997) |
| 3.3 | 29.5 | GO:0045040 | protein import into mitochondrial outer membrane(GO:0045040) |
| 3.2 | 16.0 | GO:1900368 | regulation of RNA interference(GO:1900368) negative regulation of RNA interference(GO:1900369) |
| 3.2 | 28.7 | GO:0007023 | post-chaperonin tubulin folding pathway(GO:0007023) |
| 3.2 | 22.3 | GO:0044387 | negative regulation of protein kinase activity by regulation of protein phosphorylation(GO:0044387) |
| 3.2 | 22.3 | GO:0032218 | riboflavin transport(GO:0032218) |
| 3.2 | 237.7 | GO:0070125 | mitochondrial translational elongation(GO:0070125) |
| 3.2 | 19.0 | GO:0060339 | negative regulation of type I interferon-mediated signaling pathway(GO:0060339) |
| 3.2 | 12.7 | GO:0002159 | desmosome assembly(GO:0002159) |
| 3.2 | 63.1 | GO:0006337 | nucleosome disassembly(GO:0006337) |
| 3.1 | 12.6 | GO:0035407 | histone H3-T11 phosphorylation(GO:0035407) |
| 3.1 | 21.8 | GO:0010792 | DNA double-strand break processing involved in repair via single-strand annealing(GO:0010792) |
| 3.1 | 18.6 | GO:0006642 | triglyceride mobilization(GO:0006642) |
| 3.1 | 9.2 | GO:0060528 | secretory columnal luminar epithelial cell differentiation involved in prostate glandular acinus development(GO:0060528) |
| 3.1 | 6.1 | GO:0010041 | response to iron(III) ion(GO:0010041) |
| 3.1 | 3.1 | GO:0031657 | regulation of cyclin-dependent protein serine/threonine kinase activity involved in G1/S transition of mitotic cell cycle(GO:0031657) |
| 3.1 | 12.2 | GO:0036116 | medium-chain fatty-acyl-CoA catabolic process(GO:0036114) long-chain fatty-acyl-CoA catabolic process(GO:0036116) palmitic acid metabolic process(GO:1900533) palmitic acid biosynthetic process(GO:1900535) |
| 3.0 | 21.2 | GO:0043353 | enucleate erythrocyte differentiation(GO:0043353) |
| 3.0 | 9.0 | GO:1901355 | response to rapamycin(GO:1901355) |
| 3.0 | 24.0 | GO:0097039 | protein linear polyubiquitination(GO:0097039) |
| 3.0 | 8.9 | GO:0031120 | snRNA pseudouridine synthesis(GO:0031120) |
| 3.0 | 5.9 | GO:1904742 | regulation of telomeric DNA binding(GO:1904742) |
| 3.0 | 26.7 | GO:1902415 | regulation of mRNA binding(GO:1902415) |
| 3.0 | 3.0 | GO:0060066 | oviduct development(GO:0060066) |
| 3.0 | 44.3 | GO:0042276 | error-prone translesion synthesis(GO:0042276) |
| 2.9 | 26.5 | GO:0032776 | DNA methylation on cytosine(GO:0032776) |
| 2.9 | 14.7 | GO:1902896 | terminal web assembly(GO:1902896) |
| 2.9 | 11.8 | GO:0016321 | female meiosis chromosome segregation(GO:0016321) meiotic metaphase I plate congression(GO:0043060) meiotic spindle midzone assembly(GO:0051257) meiotic metaphase plate congression(GO:0051311) |
| 2.9 | 35.2 | GO:0015939 | pantothenate metabolic process(GO:0015939) |
| 2.9 | 14.7 | GO:2000035 | regulation of stem cell division(GO:2000035) |
| 2.9 | 8.8 | GO:1903719 | regulation of I-kappaB phosphorylation(GO:1903719) positive regulation of I-kappaB phosphorylation(GO:1903721) |
| 2.9 | 11.7 | GO:0099640 | axo-dendritic protein transport(GO:0099640) |
| 2.9 | 2.9 | GO:0030656 | regulation of vitamin metabolic process(GO:0030656) |
| 2.9 | 2.9 | GO:1903751 | regulation of intrinsic apoptotic signaling pathway in response to hydrogen peroxide(GO:1903750) negative regulation of intrinsic apoptotic signaling pathway in response to hydrogen peroxide(GO:1903751) |
| 2.9 | 40.3 | GO:0042769 | DNA damage response, detection of DNA damage(GO:0042769) |
| 2.9 | 22.8 | GO:0072553 | terminal button organization(GO:0072553) |
| 2.8 | 116.7 | GO:0000291 | nuclear-transcribed mRNA catabolic process, exonucleolytic(GO:0000291) |
| 2.8 | 17.1 | GO:0015680 | intracellular copper ion transport(GO:0015680) |
| 2.8 | 25.5 | GO:0000710 | meiotic mismatch repair(GO:0000710) |
| 2.8 | 63.8 | GO:0033540 | fatty acid beta-oxidation using acyl-CoA oxidase(GO:0033540) |
| 2.8 | 5.5 | GO:0098904 | regulation of AV node cell action potential(GO:0098904) |
| 2.8 | 8.3 | GO:0098905 | regulation of bundle of His cell action potential(GO:0098905) |
| 2.8 | 8.3 | GO:0018171 | peptidyl-cysteine oxidation(GO:0018171) |
| 2.8 | 2.8 | GO:0010587 | miRNA catabolic process(GO:0010587) |
| 2.7 | 16.4 | GO:0097460 | ferrous iron import into cell(GO:0097460) ferrous iron import across plasma membrane(GO:0098707) |
| 2.7 | 8.2 | GO:0070086 | ubiquitin-dependent endocytosis(GO:0070086) regulation of ubiquitin-dependent endocytosis(GO:2000395) positive regulation of ubiquitin-dependent endocytosis(GO:2000397) |
| 2.7 | 8.2 | GO:1900063 | regulation of peroxisome organization(GO:1900063) |
| 2.7 | 10.8 | GO:0061484 | hematopoietic stem cell homeostasis(GO:0061484) |
| 2.7 | 5.4 | GO:0010225 | response to UV-C(GO:0010225) |
| 2.7 | 5.4 | GO:0008078 | mesodermal cell migration(GO:0008078) |
| 2.7 | 2.7 | GO:1903826 | arginine transmembrane transport(GO:1903826) |
| 2.7 | 2.7 | GO:0039019 | pronephric nephron development(GO:0039019) |
| 2.7 | 8.0 | GO:0006391 | transcription initiation from mitochondrial promoter(GO:0006391) |
| 2.6 | 63.5 | GO:2000188 | regulation of cholesterol homeostasis(GO:2000188) |
| 2.6 | 10.6 | GO:0046121 | deoxyribonucleoside catabolic process(GO:0046121) |
| 2.6 | 248.7 | GO:0051436 | negative regulation of ubiquitin-protein ligase activity involved in mitotic cell cycle(GO:0051436) regulation of ubiquitin-protein ligase activity involved in mitotic cell cycle(GO:0051439) |
| 2.6 | 26.2 | GO:2001032 | regulation of double-strand break repair via nonhomologous end joining(GO:2001032) |
| 2.6 | 2.6 | GO:0045047 | protein targeting to ER(GO:0045047) |
| 2.6 | 28.4 | GO:0031145 | anaphase-promoting complex-dependent catabolic process(GO:0031145) |
| 2.6 | 18.1 | GO:1903377 | negative regulation of oxidative stress-induced neuron intrinsic apoptotic signaling pathway(GO:1903377) |
| 2.6 | 5.2 | GO:0009051 | pentose-phosphate shunt, oxidative branch(GO:0009051) |
| 2.6 | 7.7 | GO:0000472 | endonucleolytic cleavage to generate mature 5'-end of SSU-rRNA from (SSU-rRNA, 5.8S rRNA, LSU-rRNA)(GO:0000472) rRNA 5'-end processing(GO:0000967) ncRNA 5'-end processing(GO:0034471) |
| 2.6 | 15.3 | GO:2000371 | regulation of DNA topoisomerase (ATP-hydrolyzing) activity(GO:2000371) positive regulation of DNA topoisomerase (ATP-hydrolyzing) activity(GO:2000373) |
| 2.5 | 20.3 | GO:0000492 | box C/D snoRNP assembly(GO:0000492) |
| 2.5 | 2.5 | GO:0051088 | PMA-inducible membrane protein ectodomain proteolysis(GO:0051088) |
| 2.5 | 7.4 | GO:0001839 | neural plate morphogenesis(GO:0001839) |
| 2.4 | 9.8 | GO:0009438 | methylglyoxal metabolic process(GO:0009438) |
| 2.4 | 44.1 | GO:0048026 | positive regulation of mRNA splicing, via spliceosome(GO:0048026) |
| 2.4 | 9.8 | GO:0046900 | tetrahydrofolylpolyglutamate metabolic process(GO:0046900) |
| 2.4 | 7.3 | GO:1903333 | negative regulation of protein folding(GO:1903333) |
| 2.4 | 21.9 | GO:0048387 | negative regulation of retinoic acid receptor signaling pathway(GO:0048387) |
| 2.4 | 7.3 | GO:0090118 | receptor-mediated endocytosis of low-density lipoprotein particle involved in cholesterol transport(GO:0090118) |
| 2.4 | 16.9 | GO:0002326 | B cell lineage commitment(GO:0002326) |
| 2.4 | 4.8 | GO:2000048 | negative regulation of cell-cell adhesion mediated by cadherin(GO:2000048) |
| 2.4 | 16.9 | GO:0097680 | double-strand break repair via classical nonhomologous end joining(GO:0097680) |
| 2.4 | 9.6 | GO:0046833 | positive regulation of RNA export from nucleus(GO:0046833) |
| 2.4 | 14.4 | GO:2000781 | positive regulation of double-strand break repair(GO:2000781) |
| 2.4 | 4.8 | GO:1903069 | regulation of ER-associated ubiquitin-dependent protein catabolic process(GO:1903069) |
| 2.4 | 16.7 | GO:0015760 | hexose phosphate transport(GO:0015712) glucose-6-phosphate transport(GO:0015760) |
| 2.4 | 2.4 | GO:0015917 | aminophospholipid transport(GO:0015917) |
| 2.4 | 4.8 | GO:1904751 | positive regulation of protein localization to nucleolus(GO:1904751) |
| 2.4 | 2.4 | GO:2001168 | regulation of histone H2B ubiquitination(GO:2001166) positive regulation of histone H2B ubiquitination(GO:2001168) |
| 2.4 | 25.9 | GO:0038203 | TORC2 signaling(GO:0038203) |
| 2.3 | 25.7 | GO:0018206 | peptidyl-methionine modification(GO:0018206) |
| 2.3 | 4.6 | GO:0032911 | negative regulation of transforming growth factor beta1 production(GO:0032911) |
| 2.3 | 9.2 | GO:0070981 | L-asparagine biosynthetic process(GO:0070981) L-asparagine metabolic process(GO:0070982) |
| 2.3 | 16.1 | GO:0001522 | pseudouridine synthesis(GO:0001522) |
| 2.3 | 13.8 | GO:0061197 | fungiform papilla morphogenesis(GO:0061197) fungiform papilla formation(GO:0061198) |
| 2.3 | 39.0 | GO:0006002 | fructose 6-phosphate metabolic process(GO:0006002) |
| 2.3 | 38.8 | GO:0034349 | glial cell apoptotic process(GO:0034349) |
| 2.3 | 9.1 | GO:1903265 | positive regulation of tumor necrosis factor-mediated signaling pathway(GO:1903265) |
| 2.3 | 15.9 | GO:1900045 | negative regulation of histone ubiquitination(GO:0033183) negative regulation of protein K63-linked ubiquitination(GO:1900045) regulation of histone H2A K63-linked ubiquitination(GO:1901314) negative regulation of histone H2A K63-linked ubiquitination(GO:1901315) negative regulation of protein polyubiquitination(GO:1902915) |
| 2.3 | 25.0 | GO:1900029 | positive regulation of ruffle assembly(GO:1900029) |
| 2.3 | 49.9 | GO:0032786 | positive regulation of DNA-templated transcription, elongation(GO:0032786) |
| 2.3 | 6.8 | GO:0045338 | farnesyl diphosphate metabolic process(GO:0045338) |
| 2.3 | 115.3 | GO:0050434 | positive regulation of viral transcription(GO:0050434) |
| 2.3 | 15.8 | GO:0046726 | positive regulation by virus of viral protein levels in host cell(GO:0046726) |
| 2.3 | 6.8 | GO:0003064 | regulation of heart rate by hormone(GO:0003064) |
| 2.2 | 20.2 | GO:0097264 | self proteolysis(GO:0097264) |
| 2.2 | 2.2 | GO:0003342 | proepicardium development(GO:0003342) septum transversum development(GO:0003343) |
| 2.2 | 9.0 | GO:0050917 | sensory perception of umami taste(GO:0050917) |
| 2.2 | 4.4 | GO:0003162 | atrioventricular node development(GO:0003162) |
| 2.2 | 17.8 | GO:0000076 | DNA replication checkpoint(GO:0000076) |
| 2.2 | 11.1 | GO:0032929 | negative regulation of superoxide anion generation(GO:0032929) |
| 2.2 | 46.5 | GO:0006415 | translational termination(GO:0006415) |
| 2.2 | 37.4 | GO:0006107 | oxaloacetate metabolic process(GO:0006107) |
| 2.2 | 17.6 | GO:0042262 | DNA protection(GO:0042262) |
| 2.2 | 65.3 | GO:0070911 | global genome nucleotide-excision repair(GO:0070911) |
| 2.2 | 13.1 | GO:0070933 | histone H4 deacetylation(GO:0070933) |
| 2.2 | 2.2 | GO:1900262 | regulation of DNA-directed DNA polymerase activity(GO:1900262) positive regulation of DNA-directed DNA polymerase activity(GO:1900264) |
| 2.1 | 27.9 | GO:0030150 | protein import into mitochondrial matrix(GO:0030150) |
| 2.1 | 8.6 | GO:0044837 | assembly of actomyosin apparatus involved in cytokinesis(GO:0000912) actomyosin contractile ring assembly(GO:0000915) actomyosin contractile ring organization(GO:0044837) |
| 2.1 | 4.3 | GO:0009133 | nucleoside diphosphate biosynthetic process(GO:0009133) |
| 2.1 | 23.3 | GO:0060252 | positive regulation of glial cell proliferation(GO:0060252) |
| 2.1 | 160.9 | GO:0006369 | termination of RNA polymerase II transcription(GO:0006369) |
| 2.1 | 10.6 | GO:1902267 | polyamine transmembrane transport(GO:1902047) regulation of polyamine transmembrane transport(GO:1902267) negative regulation of polyamine transmembrane transport(GO:1902268) |
| 2.1 | 8.3 | GO:0042450 | arginine biosynthetic process via ornithine(GO:0042450) |
| 2.1 | 35.1 | GO:1902455 | negative regulation of stem cell population maintenance(GO:1902455) |
| 2.1 | 8.2 | GO:0000212 | meiotic spindle organization(GO:0000212) |
| 2.0 | 8.2 | GO:1904045 | cellular response to aldosterone(GO:1904045) |
| 2.0 | 6.1 | GO:0043490 | malate-aspartate shuttle(GO:0043490) |
| 2.0 | 6.1 | GO:0002378 | immunoglobulin biosynthetic process(GO:0002378) |
| 2.0 | 16.2 | GO:0008635 | activation of cysteine-type endopeptidase activity involved in apoptotic process by cytochrome c(GO:0008635) |
| 2.0 | 8.0 | GO:0030961 | peptidyl-arginine hydroxylation(GO:0030961) |
| 2.0 | 2.0 | GO:0033184 | positive regulation of histone ubiquitination(GO:0033184) |
| 2.0 | 6.0 | GO:0034241 | macrophage fusion(GO:0034238) regulation of macrophage fusion(GO:0034239) positive regulation of macrophage fusion(GO:0034241) |
| 2.0 | 12.0 | GO:0002943 | tRNA dihydrouridine synthesis(GO:0002943) |
| 2.0 | 9.9 | GO:0009052 | pentose-phosphate shunt, non-oxidative branch(GO:0009052) |
| 2.0 | 13.9 | GO:0006662 | glycerol ether metabolic process(GO:0006662) |
| 2.0 | 9.8 | GO:0002934 | desmosome organization(GO:0002934) |
| 2.0 | 7.8 | GO:1904924 | negative regulation of mitophagy in response to mitochondrial depolarization(GO:1904924) |
| 2.0 | 49.0 | GO:0006353 | DNA-templated transcription, termination(GO:0006353) |
| 2.0 | 2.0 | GO:1904868 | telomerase catalytic core complex assembly(GO:1904868) regulation of telomerase catalytic core complex assembly(GO:1904882) positive regulation of telomerase catalytic core complex assembly(GO:1904884) |
| 1.9 | 9.7 | GO:0061635 | regulation of protein complex stability(GO:0061635) |
| 1.9 | 17.4 | GO:1904869 | protein localization to nuclear body(GO:1903405) protein localization to Cajal body(GO:1904867) regulation of protein localization to Cajal body(GO:1904869) positive regulation of protein localization to Cajal body(GO:1904871) |
| 1.9 | 9.6 | GO:0051383 | kinetochore assembly(GO:0051382) kinetochore organization(GO:0051383) |
| 1.9 | 44.3 | GO:0043968 | histone H2A acetylation(GO:0043968) |
| 1.9 | 1.9 | GO:0061034 | olfactory bulb mitral cell layer development(GO:0061034) |
| 1.9 | 9.6 | GO:1901091 | regulation of protein tetramerization(GO:1901090) negative regulation of protein tetramerization(GO:1901091) regulation of protein homotetramerization(GO:1901093) negative regulation of protein homotetramerization(GO:1901094) |
| 1.9 | 5.7 | GO:0023016 | signal transduction by trans-phosphorylation(GO:0023016) |
| 1.9 | 95.3 | GO:0006656 | phosphatidylcholine biosynthetic process(GO:0006656) |
| 1.9 | 13.3 | GO:0032417 | positive regulation of sodium:proton antiporter activity(GO:0032417) |
| 1.9 | 9.4 | GO:0070345 | negative regulation of fat cell proliferation(GO:0070345) |
| 1.9 | 18.8 | GO:0000463 | maturation of LSU-rRNA from tricistronic rRNA transcript (SSU-rRNA, 5.8S rRNA, LSU-rRNA)(GO:0000463) |
| 1.9 | 5.6 | GO:0046603 | negative regulation of mitotic centrosome separation(GO:0046603) |
| 1.9 | 5.6 | GO:0002949 | tRNA threonylcarbamoyladenosine modification(GO:0002949) |
| 1.9 | 5.6 | GO:0015785 | UDP-galactose transport(GO:0015785) UDP-galactose transmembrane transport(GO:0072334) |
| 1.9 | 3.7 | GO:0046271 | phenylpropanoid catabolic process(GO:0046271) |
| 1.8 | 7.4 | GO:0002268 | follicular dendritic cell differentiation(GO:0002268) |
| 1.8 | 7.4 | GO:0000460 | maturation of 5.8S rRNA(GO:0000460) |
| 1.8 | 7.3 | GO:0045839 | negative regulation of mitotic nuclear division(GO:0045839) |
| 1.8 | 11.0 | GO:1903435 | positive regulation of constitutive secretory pathway(GO:1903435) |
| 1.8 | 16.5 | GO:0089700 | protein kinase D signaling(GO:0089700) |
| 1.8 | 5.5 | GO:1902527 | positive regulation of protein monoubiquitination(GO:1902527) |
| 1.8 | 7.3 | GO:0006987 | activation of signaling protein activity involved in unfolded protein response(GO:0006987) |
| 1.8 | 7.3 | GO:1902570 | protein localization to nucleolus(GO:1902570) |
| 1.8 | 27.2 | GO:0006105 | succinate metabolic process(GO:0006105) |
| 1.8 | 1.8 | GO:0072425 | signal transduction involved in G2 DNA damage checkpoint(GO:0072425) signal transduction involved in mitotic G2 DNA damage checkpoint(GO:0072434) |
| 1.8 | 8.9 | GO:0046490 | isopentenyl diphosphate biosynthetic process(GO:0009240) isopentenyl diphosphate metabolic process(GO:0046490) |
| 1.8 | 3.6 | GO:0072144 | mesangial cell development(GO:0072143) glomerular mesangial cell development(GO:0072144) |
| 1.8 | 1.8 | GO:0032954 | regulation of cytokinetic process(GO:0032954) regulation of mitotic cytokinetic process(GO:1903436) positive regulation of mitotic cytokinetic process(GO:1903438) positive regulation of mitotic cytokinesis(GO:1903490) |
| 1.8 | 5.3 | GO:0042823 | pyridoxal phosphate metabolic process(GO:0042822) pyridoxal phosphate biosynthetic process(GO:0042823) |
| 1.8 | 26.3 | GO:0021670 | lateral ventricle development(GO:0021670) |
| 1.8 | 17.5 | GO:1902857 | positive regulation of nonmotile primary cilium assembly(GO:1902857) |
| 1.7 | 3.5 | GO:0032240 | negative regulation of nucleobase-containing compound transport(GO:0032240) negative regulation of RNA export from nucleus(GO:0046832) |
| 1.7 | 1.7 | GO:0045658 | regulation of neutrophil differentiation(GO:0045658) negative regulation of neutrophil differentiation(GO:0045659) |
| 1.7 | 10.2 | GO:0050668 | cellular response to phosphate starvation(GO:0016036) positive regulation of sulfur amino acid metabolic process(GO:0031337) positive regulation of homocysteine metabolic process(GO:0050668) |
| 1.7 | 8.4 | GO:0032532 | regulation of microvillus length(GO:0032532) |
| 1.7 | 16.7 | GO:1904380 | endoplasmic reticulum mannose trimming(GO:1904380) |
| 1.7 | 5.0 | GO:0000738 | DNA catabolic process, exonucleolytic(GO:0000738) |
| 1.7 | 14.9 | GO:0075713 | establishment of integrated proviral latency(GO:0075713) |
| 1.7 | 29.8 | GO:0006527 | arginine catabolic process(GO:0006527) |
| 1.7 | 16.6 | GO:0006621 | protein retention in ER lumen(GO:0006621) |
| 1.7 | 5.0 | GO:0021943 | formation of radial glial scaffolds(GO:0021943) |
| 1.6 | 4.9 | GO:0042418 | epinephrine metabolic process(GO:0042414) epinephrine biosynthetic process(GO:0042418) |
| 1.6 | 4.9 | GO:1902568 | positive regulation of eosinophil degranulation(GO:0043311) positive regulation of eosinophil activation(GO:1902568) |
| 1.6 | 11.5 | GO:0000389 | mRNA 3'-splice site recognition(GO:0000389) |
| 1.6 | 118.3 | GO:0097031 | NADH dehydrogenase complex assembly(GO:0010257) mitochondrial respiratory chain complex I assembly(GO:0032981) mitochondrial respiratory chain complex I biogenesis(GO:0097031) |
| 1.6 | 42.7 | GO:0043631 | mRNA polyadenylation(GO:0006378) RNA polyadenylation(GO:0043631) |
| 1.6 | 1.6 | GO:2000224 | regulation of testosterone biosynthetic process(GO:2000224) |
| 1.6 | 18.0 | GO:0046689 | response to mercury ion(GO:0046689) |
| 1.6 | 45.8 | GO:0006465 | signal peptide processing(GO:0006465) |
| 1.6 | 19.6 | GO:0043983 | histone H4-K12 acetylation(GO:0043983) |
| 1.6 | 3.3 | GO:0046166 | glyceraldehyde-3-phosphate biosynthetic process(GO:0046166) |
| 1.6 | 11.4 | GO:0098734 | macromolecule depalmitoylation(GO:0098734) |
| 1.6 | 3.3 | GO:0002681 | somatic diversification of T cell receptor genes(GO:0002568) somatic recombination of T cell receptor gene segments(GO:0002681) T cell receptor V(D)J recombination(GO:0033153) |
| 1.6 | 8.1 | GO:0031291 | Ran protein signal transduction(GO:0031291) |
| 1.6 | 4.9 | GO:1901389 | regulation of transforming growth factor beta activation(GO:1901388) negative regulation of transforming growth factor beta activation(GO:1901389) |
| 1.6 | 6.5 | GO:0034670 | chemotaxis to arachidonic acid(GO:0034670) response to arachidonic acid(GO:1904550) |
| 1.6 | 6.5 | GO:0010452 | histone H3-K36 methylation(GO:0010452) |
| 1.6 | 4.8 | GO:0061086 | negative regulation of histone H3-K27 methylation(GO:0061086) |
| 1.6 | 11.3 | GO:0000447 | endonucleolytic cleavage in ITS1 to separate SSU-rRNA from 5.8S rRNA and LSU-rRNA from tricistronic rRNA transcript (SSU-rRNA, 5.8S rRNA, LSU-rRNA)(GO:0000447) |
| 1.6 | 98.8 | GO:0042273 | ribosomal large subunit biogenesis(GO:0042273) |
| 1.6 | 7.9 | GO:0097021 | lymphocyte migration into lymphoid organs(GO:0097021) |
| 1.6 | 14.3 | GO:0016446 | somatic hypermutation of immunoglobulin genes(GO:0016446) |
| 1.6 | 33.2 | GO:1902165 | regulation of intrinsic apoptotic signaling pathway in response to DNA damage by p53 class mediator(GO:1902165) |
| 1.6 | 4.7 | GO:0042727 | flavin-containing compound biosynthetic process(GO:0042727) |
| 1.6 | 7.9 | GO:0060215 | primitive hemopoiesis(GO:0060215) |
| 1.6 | 3.2 | GO:0043418 | homocysteine catabolic process(GO:0043418) |
| 1.6 | 9.5 | GO:0030581 | intracellular transport of viral protein in host cell(GO:0019060) symbiont intracellular protein transport in host(GO:0030581) intracellular protein transport in other organism involved in symbiotic interaction(GO:0051708) |
| 1.6 | 7.9 | GO:0014886 | transition between slow and fast fiber(GO:0014886) |
| 1.6 | 49.8 | GO:0045737 | positive regulation of cyclin-dependent protein serine/threonine kinase activity(GO:0045737) |
| 1.6 | 4.7 | GO:1901252 | regulation of intracellular transport of viral material(GO:1901252) negative regulation of intracellular transport of viral material(GO:1901253) |
| 1.5 | 6.2 | GO:0046654 | tetrahydrofolate biosynthetic process(GO:0046654) |
| 1.5 | 26.2 | GO:0061157 | mRNA destabilization(GO:0061157) |
| 1.5 | 33.9 | GO:0006283 | transcription-coupled nucleotide-excision repair(GO:0006283) |
| 1.5 | 4.6 | GO:0002296 | T-helper 1 cell lineage commitment(GO:0002296) |
| 1.5 | 1.5 | GO:1902037 | negative regulation of hematopoietic stem cell differentiation(GO:1902037) |
| 1.5 | 9.2 | GO:1903677 | regulation of cap-independent translational initiation(GO:1903677) positive regulation of cap-independent translational initiation(GO:1903679) regulation of cytoplasmic translational initiation(GO:1904688) positive regulation of cytoplasmic translational initiation(GO:1904690) |
| 1.5 | 36.7 | GO:0043574 | protein targeting to peroxisome(GO:0006625) peroxisomal transport(GO:0043574) protein localization to peroxisome(GO:0072662) establishment of protein localization to peroxisome(GO:0072663) |
| 1.5 | 1.5 | GO:0033313 | meiotic cell cycle checkpoint(GO:0033313) |
| 1.5 | 7.6 | GO:2000980 | regulation of auditory receptor cell differentiation(GO:0045607) regulation of mechanoreceptor differentiation(GO:0045631) regulation of inner ear receptor cell differentiation(GO:2000980) |
| 1.5 | 1.5 | GO:0048739 | cardiac muscle fiber development(GO:0048739) |
| 1.5 | 7.6 | GO:0033277 | abortive mitotic cell cycle(GO:0033277) |
| 1.5 | 4.5 | GO:2000619 | negative regulation of histone H4-K16 acetylation(GO:2000619) |
| 1.5 | 12.1 | GO:0051988 | regulation of attachment of spindle microtubules to kinetochore(GO:0051988) |
| 1.5 | 3.0 | GO:1990928 | response to amino acid starvation(GO:1990928) |
| 1.5 | 4.5 | GO:0014810 | positive regulation of skeletal muscle contraction by regulation of release of sequestered calcium ion(GO:0014810) |
| 1.5 | 25.6 | GO:0048025 | negative regulation of mRNA splicing, via spliceosome(GO:0048025) |
| 1.5 | 6.0 | GO:0006620 | posttranslational protein targeting to membrane(GO:0006620) |
| 1.5 | 4.5 | GO:0071963 | establishment or maintenance of cell polarity regulating cell shape(GO:0071963) |
| 1.5 | 3.0 | GO:0060620 | negative regulation of very-low-density lipoprotein particle remodeling(GO:0010903) regulation of cholesterol import(GO:0060620) negative regulation of cholesterol import(GO:0060621) regulation of sterol import(GO:2000909) negative regulation of sterol import(GO:2000910) |
| 1.5 | 1.5 | GO:0090187 | positive regulation of pancreatic juice secretion(GO:0090187) |
| 1.5 | 3.0 | GO:0030854 | positive regulation of granulocyte differentiation(GO:0030854) |
| 1.5 | 13.4 | GO:0035092 | sperm chromatin condensation(GO:0035092) |
| 1.5 | 10.4 | GO:0006499 | N-terminal protein myristoylation(GO:0006499) |
| 1.5 | 3.0 | GO:0033211 | adiponectin-activated signaling pathway(GO:0033211) |
| 1.5 | 2.9 | GO:1904732 | regulation of electron carrier activity(GO:1904732) |
| 1.5 | 17.5 | GO:0043486 | histone exchange(GO:0043486) |
| 1.4 | 4.3 | GO:0072683 | T cell extravasation(GO:0072683) |
| 1.4 | 20.2 | GO:0006851 | mitochondrial calcium ion transport(GO:0006851) |
| 1.4 | 2.9 | GO:0040031 | snRNA modification(GO:0040031) |
| 1.4 | 14.3 | GO:0034498 | early endosome to Golgi transport(GO:0034498) |
| 1.4 | 29.9 | GO:0016578 | histone deubiquitination(GO:0016578) |
| 1.4 | 8.5 | GO:0015853 | adenine transport(GO:0015853) |
| 1.4 | 4.2 | GO:0007077 | mitotic nuclear envelope disassembly(GO:0007077) |
| 1.4 | 7.0 | GO:0070561 | vitamin D receptor signaling pathway(GO:0070561) |
| 1.4 | 1.4 | GO:0006296 | nucleotide-excision repair, DNA incision, 5'-to lesion(GO:0006296) |
| 1.4 | 11.2 | GO:0044351 | macropinocytosis(GO:0044351) |
| 1.4 | 5.6 | GO:1903756 | regulation of transcription from RNA polymerase II promoter by histone modification(GO:1903756) negative regulation of transcription from RNA polymerase II promoter by histone modification(GO:1903758) |
| 1.4 | 19.5 | GO:0042761 | fatty acid elongation(GO:0030497) very long-chain fatty acid biosynthetic process(GO:0042761) |
| 1.4 | 6.9 | GO:0010193 | response to ozone(GO:0010193) |
| 1.4 | 4.2 | GO:0060743 | epithelial cell maturation involved in prostate gland development(GO:0060743) |
| 1.4 | 4.2 | GO:1902524 | positive regulation of protein K48-linked ubiquitination(GO:1902524) |
| 1.4 | 13.8 | GO:0051451 | myoblast migration(GO:0051451) |
| 1.4 | 34.6 | GO:0060148 | positive regulation of posttranscriptional gene silencing(GO:0060148) positive regulation of gene silencing by miRNA(GO:2000637) |
| 1.4 | 4.1 | GO:0050689 | negative regulation of defense response to virus by host(GO:0050689) |
| 1.4 | 8.2 | GO:0007076 | mitotic chromosome condensation(GO:0007076) |
| 1.4 | 2.7 | GO:0003221 | right ventricular cardiac muscle tissue morphogenesis(GO:0003221) |
| 1.4 | 5.5 | GO:0035733 | hepatic stellate cell activation(GO:0035733) |
| 1.4 | 2.7 | GO:1902101 | positive regulation of mitotic metaphase/anaphase transition(GO:0045842) positive regulation of mitotic sister chromatid separation(GO:1901970) positive regulation of metaphase/anaphase transition of cell cycle(GO:1902101) |
| 1.4 | 31.4 | GO:0097341 | inhibition of cysteine-type endopeptidase activity(GO:0097340) zymogen inhibition(GO:0097341) |
| 1.4 | 2.7 | GO:0010989 | negative regulation of low-density lipoprotein particle clearance(GO:0010989) |
| 1.4 | 2.7 | GO:0000965 | mitochondrial RNA 3'-end processing(GO:0000965) |
| 1.4 | 8.1 | GO:0009209 | pyrimidine ribonucleoside triphosphate biosynthetic process(GO:0009209) |
| 1.4 | 9.5 | GO:0042407 | cristae formation(GO:0042407) |
| 1.3 | 4.0 | GO:2000616 | negative regulation of histone H3-K9 acetylation(GO:2000616) |
| 1.3 | 1.3 | GO:0080009 | mRNA methylation(GO:0080009) |
| 1.3 | 73.7 | GO:0000079 | regulation of cyclin-dependent protein serine/threonine kinase activity(GO:0000079) |
| 1.3 | 18.7 | GO:0031053 | primary miRNA processing(GO:0031053) |
| 1.3 | 2.7 | GO:1905064 | negative regulation of vascular smooth muscle cell differentiation(GO:1905064) |
| 1.3 | 2.6 | GO:0008614 | pyridoxine metabolic process(GO:0008614) pyridoxine biosynthetic process(GO:0008615) vitamin B6 biosynthetic process(GO:0042819) |
| 1.3 | 10.5 | GO:0060753 | regulation of mast cell chemotaxis(GO:0060753) |
| 1.3 | 11.8 | GO:0044598 | polyketide metabolic process(GO:0030638) aminoglycoside antibiotic metabolic process(GO:0030647) daunorubicin metabolic process(GO:0044597) doxorubicin metabolic process(GO:0044598) |
| 1.3 | 20.9 | GO:0090503 | RNA phosphodiester bond hydrolysis, exonucleolytic(GO:0090503) |
| 1.3 | 2.6 | GO:0006121 | mitochondrial electron transport, succinate to ubiquinone(GO:0006121) |
| 1.3 | 5.2 | GO:0034773 | histone H4-K20 trimethylation(GO:0034773) |
| 1.3 | 6.5 | GO:0006388 | tRNA splicing, via endonucleolytic cleavage and ligation(GO:0006388) |
| 1.3 | 9.1 | GO:0030579 | ubiquitin-dependent SMAD protein catabolic process(GO:0030579) |
| 1.3 | 16.8 | GO:0016180 | snRNA processing(GO:0016180) |
| 1.3 | 5.2 | GO:0090481 | pyrimidine nucleotide-sugar transmembrane transport(GO:0090481) |
| 1.3 | 6.4 | GO:0009099 | branched-chain amino acid biosynthetic process(GO:0009082) leucine biosynthetic process(GO:0009098) valine biosynthetic process(GO:0009099) |
| 1.3 | 2.6 | GO:0006404 | RNA import into nucleus(GO:0006404) |
| 1.3 | 14.0 | GO:0006646 | phosphatidylethanolamine biosynthetic process(GO:0006646) |
| 1.3 | 2.5 | GO:0002277 | myeloid dendritic cell activation involved in immune response(GO:0002277) |
| 1.3 | 5.0 | GO:0006617 | SRP-dependent cotranslational protein targeting to membrane, signal sequence recognition(GO:0006617) |
| 1.3 | 6.3 | GO:0040016 | embryonic cleavage(GO:0040016) |
| 1.3 | 31.4 | GO:0007080 | mitotic metaphase plate congression(GO:0007080) |
| 1.3 | 18.8 | GO:0000028 | ribosomal small subunit assembly(GO:0000028) |
| 1.3 | 6.3 | GO:1903588 | negative regulation of blood vessel endothelial cell proliferation involved in sprouting angiogenesis(GO:1903588) |
| 1.3 | 5.0 | GO:0070295 | renal water absorption(GO:0070295) |
| 1.2 | 8.7 | GO:0060261 | positive regulation of transcription initiation from RNA polymerase II promoter(GO:0060261) |
| 1.2 | 5.0 | GO:0006596 | polyamine biosynthetic process(GO:0006596) |
| 1.2 | 24.8 | GO:0033234 | negative regulation of protein sumoylation(GO:0033234) |
| 1.2 | 8.7 | GO:0007619 | courtship behavior(GO:0007619) |
| 1.2 | 9.8 | GO:0090151 | establishment of protein localization to mitochondrial membrane(GO:0090151) |
| 1.2 | 8.5 | GO:0060336 | negative regulation of response to interferon-gamma(GO:0060331) negative regulation of interferon-gamma-mediated signaling pathway(GO:0060336) regulation of cholesterol transporter activity(GO:0060694) response to metformin(GO:1901558) negative regulation of pancreatic stellate cell proliferation(GO:2000230) |
| 1.2 | 2.4 | GO:0032804 | negative regulation of low-density lipoprotein particle receptor catabolic process(GO:0032804) |
| 1.2 | 3.6 | GO:0010693 | negative regulation of alkaline phosphatase activity(GO:0010693) |
| 1.2 | 4.8 | GO:0031339 | negative regulation of vesicle fusion(GO:0031339) |
| 1.2 | 10.7 | GO:0045292 | mRNA cis splicing, via spliceosome(GO:0045292) |
| 1.2 | 6.0 | GO:0071894 | histone H2B conserved C-terminal lysine ubiquitination(GO:0071894) |
| 1.2 | 4.8 | GO:0006556 | S-adenosylmethionine biosynthetic process(GO:0006556) |
| 1.2 | 2.4 | GO:0006447 | regulation of translational initiation by iron(GO:0006447) |
| 1.2 | 4.7 | GO:0070973 | protein localization to endoplasmic reticulum exit site(GO:0070973) |
| 1.2 | 1.2 | GO:0006679 | glucosylceramide biosynthetic process(GO:0006679) |
| 1.2 | 3.5 | GO:0006421 | asparaginyl-tRNA aminoacylation(GO:0006421) |
| 1.2 | 4.7 | GO:0019673 | GDP-mannose metabolic process(GO:0019673) |
| 1.2 | 2.3 | GO:0060061 | Spemann organizer formation(GO:0060061) |
| 1.2 | 18.7 | GO:0042023 | DNA endoreduplication(GO:0042023) |
| 1.2 | 5.8 | GO:0023035 | CD40 signaling pathway(GO:0023035) |
| 1.2 | 1.2 | GO:0002625 | regulation of T cell antigen processing and presentation(GO:0002625) |
| 1.2 | 1.2 | GO:1902512 | positive regulation of apoptotic DNA fragmentation(GO:1902512) |
| 1.2 | 2.3 | GO:0042178 | xenobiotic catabolic process(GO:0042178) |
| 1.2 | 2.3 | GO:2000643 | positive regulation of early endosome to late endosome transport(GO:2000643) |
| 1.2 | 42.8 | GO:0034314 | Arp2/3 complex-mediated actin nucleation(GO:0034314) |
| 1.2 | 8.1 | GO:0045079 | negative regulation of chemokine biosynthetic process(GO:0045079) |
| 1.1 | 13.8 | GO:0010529 | regulation of transposition(GO:0010528) negative regulation of transposition(GO:0010529) |
| 1.1 | 4.6 | GO:0032972 | regulation of muscle filament sliding speed(GO:0032972) |
| 1.1 | 12.5 | GO:0060340 | positive regulation of type I interferon-mediated signaling pathway(GO:0060340) |
| 1.1 | 3.4 | GO:0002415 | immunoglobulin transcytosis in epithelial cells mediated by polymeric immunoglobulin receptor(GO:0002415) |
| 1.1 | 9.0 | GO:0051599 | response to hydrostatic pressure(GO:0051599) |
| 1.1 | 36.1 | GO:0030490 | maturation of SSU-rRNA(GO:0030490) |
| 1.1 | 5.6 | GO:0090385 | phagosome-lysosome fusion(GO:0090385) |
| 1.1 | 6.7 | GO:0060356 | leucine import(GO:0060356) |
| 1.1 | 3.4 | GO:0016240 | autophagosome docking(GO:0016240) |
| 1.1 | 13.4 | GO:0090110 | cargo loading into COPII-coated vesicle(GO:0090110) |
| 1.1 | 15.6 | GO:0006517 | protein deglycosylation(GO:0006517) |
| 1.1 | 2.2 | GO:0098902 | regulation of membrane depolarization during action potential(GO:0098902) |
| 1.1 | 3.3 | GO:0035425 | autocrine signaling(GO:0035425) |
| 1.1 | 23.2 | GO:0072350 | tricarboxylic acid metabolic process(GO:0072350) |
| 1.1 | 75.7 | GO:0045454 | cell redox homeostasis(GO:0045454) |
| 1.1 | 158.9 | GO:0006364 | rRNA processing(GO:0006364) |
| 1.1 | 4.4 | GO:0033634 | positive regulation of cell-cell adhesion mediated by integrin(GO:0033634) |
| 1.1 | 1.1 | GO:0045048 | protein insertion into ER membrane(GO:0045048) |
| 1.1 | 5.4 | GO:1902766 | skeletal muscle satellite cell migration(GO:1902766) |
| 1.1 | 24.9 | GO:1904707 | positive regulation of vascular smooth muscle cell proliferation(GO:1904707) |
| 1.1 | 4.3 | GO:0072718 | response to cisplatin(GO:0072718) |
| 1.1 | 4.3 | GO:0060023 | soft palate development(GO:0060023) |
| 1.1 | 4.3 | GO:0031507 | heterochromatin assembly(GO:0031507) |
| 1.1 | 88.0 | GO:0051225 | spindle assembly(GO:0051225) |
| 1.1 | 73.1 | GO:0043488 | regulation of mRNA stability(GO:0043488) |
| 1.1 | 5.3 | GO:1901029 | negative regulation of mitochondrial outer membrane permeabilization involved in apoptotic signaling pathway(GO:1901029) |
| 1.1 | 8.4 | GO:0072513 | positive regulation of secondary heart field cardioblast proliferation(GO:0072513) |
| 1.0 | 3.1 | GO:0090158 | endoplasmic reticulum membrane organization(GO:0090158) |
| 1.0 | 5.2 | GO:0019348 | dolichol metabolic process(GO:0019348) |
| 1.0 | 4.1 | GO:1903803 | glutamine secretion(GO:0010585) L-glutamine import(GO:0036229) L-glutamine import into cell(GO:1903803) |
| 1.0 | 3.1 | GO:0060706 | cell differentiation involved in embryonic placenta development(GO:0060706) |
| 1.0 | 12.4 | GO:0070327 | thyroid hormone transport(GO:0070327) |
| 1.0 | 11.2 | GO:0002183 | cytoplasmic translational initiation(GO:0002183) |
| 1.0 | 6.1 | GO:0051958 | methotrexate transport(GO:0051958) reduced folate transmembrane transport(GO:0098838) |
| 1.0 | 1.0 | GO:1901074 | regulation of engulfment of apoptotic cell(GO:1901074) |
| 1.0 | 7.1 | GO:0071243 | cellular response to arsenic-containing substance(GO:0071243) |
| 1.0 | 2.0 | GO:1903778 | protein localization to vacuolar membrane(GO:1903778) |
| 1.0 | 17.0 | GO:0043153 | entrainment of circadian clock by photoperiod(GO:0043153) |
| 1.0 | 7.0 | GO:0031017 | exocrine pancreas development(GO:0031017) |
| 1.0 | 4.0 | GO:0006264 | mitochondrial DNA replication(GO:0006264) |
| 1.0 | 2.0 | GO:0051795 | positive regulation of catagen(GO:0051795) |
| 1.0 | 3.0 | GO:0060448 | dichotomous subdivision of terminal units involved in lung branching(GO:0060448) |
| 1.0 | 1.0 | GO:0031536 | positive regulation of exit from mitosis(GO:0031536) |
| 1.0 | 3.9 | GO:2000210 | positive regulation of anoikis(GO:2000210) |
| 1.0 | 12.6 | GO:0033630 | positive regulation of cell adhesion mediated by integrin(GO:0033630) |
| 1.0 | 6.8 | GO:0031468 | nuclear envelope reassembly(GO:0031468) |
| 1.0 | 3.9 | GO:0010835 | regulation of protein ADP-ribosylation(GO:0010835) |
| 1.0 | 2.9 | GO:0033504 | floor plate development(GO:0033504) |
| 1.0 | 18.3 | GO:0051031 | tRNA export from nucleus(GO:0006409) tRNA transport(GO:0051031) tRNA-containing ribonucleoprotein complex export from nucleus(GO:0071431) |
| 1.0 | 2.9 | GO:0046831 | regulation of RNA export from nucleus(GO:0046831) |
| 1.0 | 10.5 | GO:0006551 | leucine metabolic process(GO:0006551) |
| 1.0 | 8.6 | GO:1901642 | nucleoside transmembrane transport(GO:1901642) |
| 1.0 | 1.0 | GO:2000670 | positive regulation of dendritic cell apoptotic process(GO:2000670) |
| 1.0 | 3.8 | GO:1904923 | regulation of mitophagy in response to mitochondrial depolarization(GO:1904923) |
| 1.0 | 1.9 | GO:0010825 | positive regulation of centrosome duplication(GO:0010825) |
| 0.9 | 4.7 | GO:0044375 | regulation of peroxisome size(GO:0044375) |
| 0.9 | 3.8 | GO:0035965 | cardiolipin acyl-chain remodeling(GO:0035965) |
| 0.9 | 0.9 | GO:1903093 | regulation of protein K48-linked deubiquitination(GO:1903093) negative regulation of protein K48-linked deubiquitination(GO:1903094) negative regulation of ubiquitin-specific protease activity(GO:2000157) |
| 0.9 | 8.5 | GO:0007093 | mitotic cell cycle checkpoint(GO:0007093) |
| 0.9 | 4.7 | GO:2001270 | regulation of cysteine-type endopeptidase activity involved in execution phase of apoptosis(GO:2001270) |
| 0.9 | 0.9 | GO:0030043 | actin filament fragmentation(GO:0030043) |
| 0.9 | 2.8 | GO:0048280 | vesicle fusion with Golgi apparatus(GO:0048280) |
| 0.9 | 1.9 | GO:0072733 | response to staurosporine(GO:0072733) cellular response to staurosporine(GO:0072734) |
| 0.9 | 27.1 | GO:0051123 | RNA polymerase II transcriptional preinitiation complex assembly(GO:0051123) |
| 0.9 | 3.7 | GO:0051697 | protein delipidation(GO:0051697) |
| 0.9 | 0.9 | GO:0035771 | interleukin-4-mediated signaling pathway(GO:0035771) |
| 0.9 | 3.7 | GO:0042796 | snRNA transcription from RNA polymerase III promoter(GO:0042796) |
| 0.9 | 11.1 | GO:0030261 | chromosome condensation(GO:0030261) |
| 0.9 | 0.9 | GO:0021539 | subthalamus development(GO:0021539) |
| 0.9 | 1.8 | GO:0009972 | cytidine catabolic process(GO:0006216) cytidine deamination(GO:0009972) cytidine metabolic process(GO:0046087) |
| 0.9 | 6.3 | GO:0051176 | positive regulation of sulfur metabolic process(GO:0051176) |
| 0.9 | 1.8 | GO:0007352 | zygotic specification of dorsal/ventral axis(GO:0007352) |
| 0.9 | 1.8 | GO:0015868 | purine nucleotide transport(GO:0015865) purine ribonucleotide transport(GO:0015868) |
| 0.9 | 2.7 | GO:0048200 | COPI-coated vesicle budding(GO:0035964) Golgi transport vesicle coating(GO:0048200) COPI coating of Golgi vesicle(GO:0048205) |
| 0.9 | 1.8 | GO:0038162 | erythropoietin-mediated signaling pathway(GO:0038162) |
| 0.9 | 3.6 | GO:0046946 | hydroxylysine metabolic process(GO:0046946) hydroxylysine biosynthetic process(GO:0046947) |
| 0.9 | 2.7 | GO:1903595 | positive regulation of histamine secretion by mast cell(GO:1903595) |
| 0.9 | 3.6 | GO:0019418 | sulfide oxidation(GO:0019418) sulfide oxidation, using sulfide:quinone oxidoreductase(GO:0070221) |
| 0.9 | 2.7 | GO:0090155 | negative regulation of sphingolipid biosynthetic process(GO:0090155) negative regulation of ceramide biosynthetic process(GO:1900060) |
| 0.9 | 2.7 | GO:0006564 | L-serine biosynthetic process(GO:0006564) |
| 0.9 | 2.6 | GO:0035720 | intraciliary anterograde transport(GO:0035720) |
| 0.9 | 5.2 | GO:0018916 | nitrobenzene metabolic process(GO:0018916) |
| 0.9 | 2.6 | GO:0036233 | glycine import(GO:0036233) |
| 0.9 | 13.0 | GO:0007253 | cytoplasmic sequestering of NF-kappaB(GO:0007253) |
| 0.9 | 5.2 | GO:0051574 | positive regulation of histone H3-K9 methylation(GO:0051574) |
| 0.9 | 0.9 | GO:0003150 | muscular septum morphogenesis(GO:0003150) |
| 0.9 | 1.7 | GO:0015866 | ADP transport(GO:0015866) |
| 0.9 | 2.6 | GO:0006566 | threonine metabolic process(GO:0006566) |
| 0.9 | 1.7 | GO:0008216 | spermidine metabolic process(GO:0008216) |
| 0.9 | 6.0 | GO:0046459 | short-chain fatty acid metabolic process(GO:0046459) |
| 0.8 | 4.2 | GO:2000271 | positive regulation of fibroblast apoptotic process(GO:2000271) |
| 0.8 | 4.2 | GO:0046940 | nucleoside monophosphate phosphorylation(GO:0046940) |
| 0.8 | 9.3 | GO:0060712 | spongiotrophoblast layer development(GO:0060712) |
| 0.8 | 3.4 | GO:0045948 | positive regulation of translational initiation(GO:0045948) |
| 0.8 | 5.9 | GO:0021902 | commitment of neuronal cell to specific neuron type in forebrain(GO:0021902) |
| 0.8 | 4.2 | GO:0075525 | viral translational termination-reinitiation(GO:0075525) |
| 0.8 | 3.3 | GO:2000354 | regulation of ovarian follicle development(GO:2000354) |
| 0.8 | 2.5 | GO:0045556 | TRAIL biosynthetic process(GO:0045553) regulation of TRAIL biosynthetic process(GO:0045554) positive regulation of TRAIL biosynthetic process(GO:0045556) |
| 0.8 | 6.6 | GO:2000270 | negative regulation of fibroblast apoptotic process(GO:2000270) |
| 0.8 | 0.8 | GO:0070857 | regulation of bile acid biosynthetic process(GO:0070857) |
| 0.8 | 8.3 | GO:0014870 | response to muscle inactivity(GO:0014870) |
| 0.8 | 3.3 | GO:1904502 | lipophagy(GO:0061724) regulation of lipophagy(GO:1904502) positive regulation of lipophagy(GO:1904504) |
| 0.8 | 3.3 | GO:0010643 | cell communication by chemical coupling(GO:0010643) |
| 0.8 | 2.5 | GO:0030327 | prenylated protein catabolic process(GO:0030327) |
| 0.8 | 3.3 | GO:2000825 | positive regulation of androgen receptor activity(GO:2000825) |
| 0.8 | 8.1 | GO:0045820 | negative regulation of glycolytic process(GO:0045820) negative regulation of cofactor metabolic process(GO:0051195) negative regulation of coenzyme metabolic process(GO:0051198) |
| 0.8 | 14.6 | GO:0008340 | determination of adult lifespan(GO:0008340) |
| 0.8 | 1.6 | GO:0021558 | trochlear nerve development(GO:0021558) |
| 0.8 | 11.1 | GO:0051084 | 'de novo' posttranslational protein folding(GO:0051084) |
| 0.8 | 3.2 | GO:0097428 | protein maturation by iron-sulfur cluster transfer(GO:0097428) |
| 0.8 | 34.0 | GO:0006334 | nucleosome assembly(GO:0006334) |
| 0.8 | 4.0 | GO:0006065 | UDP-glucuronate biosynthetic process(GO:0006065) |
| 0.8 | 3.2 | GO:0002318 | myeloid progenitor cell differentiation(GO:0002318) |
| 0.8 | 10.2 | GO:0045911 | positive regulation of isotype switching(GO:0045830) positive regulation of DNA recombination(GO:0045911) |
| 0.8 | 7.8 | GO:0034975 | protein folding in endoplasmic reticulum(GO:0034975) |
| 0.8 | 3.9 | GO:0042256 | mature ribosome assembly(GO:0042256) |
| 0.8 | 3.9 | GO:0000012 | single strand break repair(GO:0000012) |
| 0.8 | 2.3 | GO:0070103 | regulation of interleukin-6-mediated signaling pathway(GO:0070103) |
| 0.8 | 2.3 | GO:0045065 | cytotoxic T cell differentiation(GO:0045065) |
| 0.8 | 0.8 | GO:0072173 | metanephric tubule morphogenesis(GO:0072173) |
| 0.8 | 6.1 | GO:0006122 | mitochondrial electron transport, ubiquinol to cytochrome c(GO:0006122) |
| 0.8 | 1.5 | GO:0033563 | dorsal/ventral axon guidance(GO:0033563) |
| 0.7 | 12.0 | GO:0051983 | regulation of chromosome segregation(GO:0051983) |
| 0.7 | 6.0 | GO:0060120 | auditory receptor cell fate commitment(GO:0009912) inner ear receptor cell fate commitment(GO:0060120) |
| 0.7 | 1.5 | GO:0016999 | antibiotic metabolic process(GO:0016999) |
| 0.7 | 7.4 | GO:0007031 | peroxisome organization(GO:0007031) |
| 0.7 | 5.2 | GO:0007379 | segment specification(GO:0007379) |
| 0.7 | 24.3 | GO:0015804 | neutral amino acid transport(GO:0015804) |
| 0.7 | 9.6 | GO:0016024 | CDP-diacylglycerol biosynthetic process(GO:0016024) |
| 0.7 | 2.9 | GO:0086048 | membrane depolarization during bundle of His cell action potential(GO:0086048) |
| 0.7 | 19.9 | GO:0097284 | hepatocyte apoptotic process(GO:0097284) |
| 0.7 | 2.2 | GO:0010592 | positive regulation of lamellipodium assembly(GO:0010592) |
| 0.7 | 2.9 | GO:0035459 | cargo loading into vesicle(GO:0035459) |
| 0.7 | 1.4 | GO:0009794 | regulation of mitotic cell cycle, embryonic(GO:0009794) mitotic cell cycle, embryonic(GO:0045448) |
| 0.7 | 5.8 | GO:1901798 | positive regulation of DNA damage response, signal transduction by p53 class mediator(GO:0043517) positive regulation of signal transduction by p53 class mediator(GO:1901798) |
| 0.7 | 2.2 | GO:0070681 | glutaminyl-tRNAGln biosynthesis via transamidation(GO:0070681) |
| 0.7 | 1.4 | GO:0030917 | midbrain-hindbrain boundary development(GO:0030917) |
| 0.7 | 15.1 | GO:0070534 | protein K63-linked ubiquitination(GO:0070534) |
| 0.7 | 14.2 | GO:0032486 | Rap protein signal transduction(GO:0032486) |
| 0.7 | 6.4 | GO:0042789 | mRNA transcription from RNA polymerase II promoter(GO:0042789) |
| 0.7 | 15.5 | GO:0046339 | diacylglycerol metabolic process(GO:0046339) |
| 0.7 | 2.1 | GO:0036079 | GDP-fucose transport(GO:0015783) purine nucleotide-sugar transport(GO:0036079) |
| 0.7 | 0.7 | GO:0060585 | regulation of prostaglandin-endoperoxide synthase activity(GO:0060584) positive regulation of prostaglandin-endoperoxide synthase activity(GO:0060585) |
| 0.7 | 19.6 | GO:0000281 | mitotic cytokinesis(GO:0000281) |
| 0.7 | 1.4 | GO:1903937 | response to acrylamide(GO:1903937) |
| 0.7 | 8.4 | GO:0006613 | cotranslational protein targeting to membrane(GO:0006613) |
| 0.7 | 2.1 | GO:1902460 | regulation of mesenchymal stem cell proliferation(GO:1902460) positive regulation of mesenchymal stem cell proliferation(GO:1902462) |
| 0.7 | 2.8 | GO:0010624 | regulation of Schwann cell proliferation(GO:0010624) negative regulation of Schwann cell proliferation(GO:0010626) |
| 0.7 | 13.0 | GO:0016254 | preassembly of GPI anchor in ER membrane(GO:0016254) |
| 0.7 | 0.7 | GO:1902959 | regulation of aspartic-type endopeptidase activity involved in amyloid precursor protein catabolic process(GO:1902959) positive regulation of aspartic-type endopeptidase activity involved in amyloid precursor protein catabolic process(GO:1902961) regulation of aspartic-type peptidase activity(GO:1905245) positive regulation of aspartic-type peptidase activity(GO:1905247) |
| 0.7 | 0.7 | GO:0006771 | riboflavin metabolic process(GO:0006771) |
| 0.7 | 4.8 | GO:0045163 | clustering of voltage-gated potassium channels(GO:0045163) |
| 0.7 | 3.4 | GO:0010764 | negative regulation of fibroblast migration(GO:0010764) |
| 0.7 | 8.8 | GO:0033689 | negative regulation of osteoblast proliferation(GO:0033689) |
| 0.7 | 5.3 | GO:0030473 | nucleokinesis involved in cell motility in cerebral cortex radial glia guided migration(GO:0021817) nuclear migration along microtubule(GO:0030473) |
| 0.7 | 9.3 | GO:0071803 | positive regulation of podosome assembly(GO:0071803) |
| 0.7 | 2.0 | GO:1904048 | regulation of spontaneous neurotransmitter secretion(GO:1904048) |
| 0.7 | 14.4 | GO:0010824 | regulation of centrosome duplication(GO:0010824) |
| 0.7 | 2.0 | GO:1900383 | regulation of synaptic plasticity by receptor localization to synapse(GO:1900383) |
| 0.7 | 11.1 | GO:0002076 | osteoblast development(GO:0002076) |
| 0.7 | 2.0 | GO:0071316 | cellular response to nicotine(GO:0071316) |
| 0.6 | 1.9 | GO:2000174 | regulation of pro-T cell differentiation(GO:2000174) positive regulation of pro-T cell differentiation(GO:2000176) |
| 0.6 | 3.9 | GO:0033564 | anterior/posterior axon guidance(GO:0033564) |
| 0.6 | 7.1 | GO:0007095 | mitotic G2 DNA damage checkpoint(GO:0007095) |
| 0.6 | 4.5 | GO:0000244 | spliceosomal tri-snRNP complex assembly(GO:0000244) |
| 0.6 | 9.0 | GO:0034497 | protein localization to pre-autophagosomal structure(GO:0034497) |
| 0.6 | 3.2 | GO:0006574 | valine catabolic process(GO:0006574) |
| 0.6 | 1.9 | GO:0055011 | atrial cardiac muscle cell differentiation(GO:0055011) atrial cardiac muscle cell development(GO:0055014) |
| 0.6 | 5.7 | GO:1904424 | regulation of GTP binding(GO:1904424) |
| 0.6 | 2.5 | GO:0050893 | sensory processing(GO:0050893) |
| 0.6 | 42.7 | GO:0006901 | vesicle coating(GO:0006901) vesicle targeting, rough ER to cis-Golgi(GO:0048207) COPII vesicle coating(GO:0048208) |
| 0.6 | 1.3 | GO:1904339 | negative regulation of dopaminergic neuron differentiation(GO:1904339) |
| 0.6 | 3.1 | GO:0046498 | S-adenosylhomocysteine metabolic process(GO:0046498) |
| 0.6 | 1.8 | GO:0034436 | glycoprotein transport(GO:0034436) |
| 0.6 | 3.7 | GO:0006777 | Mo-molybdopterin cofactor biosynthetic process(GO:0006777) Mo-molybdopterin cofactor metabolic process(GO:0019720) |
| 0.6 | 3.0 | GO:0050915 | sensory perception of sour taste(GO:0050915) |
| 0.6 | 1.2 | GO:0046341 | CDP-diacylglycerol metabolic process(GO:0046341) |
| 0.6 | 11.4 | GO:0046501 | protoporphyrinogen IX metabolic process(GO:0046501) |
| 0.6 | 2.4 | GO:0070816 | phosphorylation of RNA polymerase II C-terminal domain(GO:0070816) |
| 0.6 | 0.6 | GO:0051459 | regulation of corticotropin secretion(GO:0051459) positive regulation of corticotropin secretion(GO:0051461) |
| 0.6 | 14.7 | GO:1903959 | regulation of anion transmembrane transport(GO:1903959) |
| 0.6 | 5.3 | GO:1902035 | positive regulation of hematopoietic stem cell proliferation(GO:1902035) |
| 0.6 | 119.8 | GO:0000375 | RNA splicing, via transesterification reactions(GO:0000375) |
| 0.6 | 1.7 | GO:0018211 | protein C-linked glycosylation(GO:0018103) peptidyl-tryptophan modification(GO:0018211) protein C-linked glycosylation via tryptophan(GO:0018317) protein C-linked glycosylation via 2'-alpha-mannosyl-L-tryptophan(GO:0018406) |
| 0.6 | 7.5 | GO:0071397 | cellular response to cholesterol(GO:0071397) |
| 0.6 | 0.6 | GO:0034759 | regulation of iron ion transport(GO:0034756) regulation of iron ion transmembrane transport(GO:0034759) response to iron ion starvation(GO:1990641) |
| 0.6 | 1.1 | GO:0042255 | ribosome assembly(GO:0042255) |
| 0.6 | 1.1 | GO:0016075 | rRNA catabolic process(GO:0016075) |
| 0.6 | 1.1 | GO:0097278 | complement-dependent cytotoxicity(GO:0097278) |
| 0.6 | 8.0 | GO:1902036 | regulation of hematopoietic stem cell differentiation(GO:1902036) |
| 0.6 | 2.3 | GO:0035606 | peptidyl-cysteine S-trans-nitrosylation(GO:0035606) |
| 0.6 | 1.7 | GO:0030047 | actin modification(GO:0030047) |
| 0.6 | 2.8 | GO:0071501 | response to sterol depletion(GO:0006991) SREBP signaling pathway(GO:0032933) cellular response to sterol depletion(GO:0071501) |
| 0.6 | 26.3 | GO:0008033 | tRNA processing(GO:0008033) |
| 0.6 | 11.7 | GO:0042254 | ribosome biogenesis(GO:0042254) |
| 0.6 | 7.8 | GO:0030214 | hyaluronan catabolic process(GO:0030214) |
| 0.6 | 9.9 | GO:0015937 | coenzyme A biosynthetic process(GO:0015937) |
| 0.5 | 2.7 | GO:2000645 | negative regulation of receptor catabolic process(GO:2000645) |
| 0.5 | 34.4 | GO:0032436 | positive regulation of proteasomal ubiquitin-dependent protein catabolic process(GO:0032436) |
| 0.5 | 9.8 | GO:0006123 | mitochondrial electron transport, cytochrome c to oxygen(GO:0006123) |
| 0.5 | 0.5 | GO:0048537 | mucosal-associated lymphoid tissue development(GO:0048537) Peyer's patch development(GO:0048541) Peyer's patch morphogenesis(GO:0061146) |
| 0.5 | 3.8 | GO:0071425 | hematopoietic stem cell proliferation(GO:0071425) |
| 0.5 | 1.6 | GO:0000183 | chromatin silencing at rDNA(GO:0000183) |
| 0.5 | 2.7 | GO:0043249 | erythrocyte maturation(GO:0043249) |
| 0.5 | 0.5 | GO:0061074 | regulation of neural retina development(GO:0061074) regulation of retina development in camera-type eye(GO:1902866) |
| 0.5 | 2.1 | GO:0007206 | phospholipase C-activating G-protein coupled glutamate receptor signaling pathway(GO:0007206) |
| 0.5 | 0.5 | GO:0060278 | regulation of ovulation(GO:0060278) positive regulation of ovulation(GO:0060279) |
| 0.5 | 0.5 | GO:0021603 | cranial nerve formation(GO:0021603) |
| 0.5 | 1.6 | GO:0046040 | IMP metabolic process(GO:0046040) |
| 0.5 | 2.6 | GO:1903361 | protein localization to basolateral plasma membrane(GO:1903361) |
| 0.5 | 5.8 | GO:2000144 | positive regulation of DNA-templated transcription, initiation(GO:2000144) |
| 0.5 | 6.8 | GO:1903753 | negative regulation of p38MAPK cascade(GO:1903753) |
| 0.5 | 13.0 | GO:0060216 | definitive hemopoiesis(GO:0060216) |
| 0.5 | 27.0 | GO:0006413 | translational initiation(GO:0006413) |
| 0.5 | 5.2 | GO:0035162 | embryonic hemopoiesis(GO:0035162) |
| 0.5 | 3.1 | GO:1904293 | negative regulation of ERAD pathway(GO:1904293) |
| 0.5 | 2.0 | GO:0002925 | positive regulation of humoral immune response mediated by circulating immunoglobulin(GO:0002925) |
| 0.5 | 2.5 | GO:0002034 | regulation of blood vessel size by renin-angiotensin(GO:0002034) renal control of peripheral vascular resistance involved in regulation of systemic arterial blood pressure(GO:0003072) |
| 0.5 | 8.6 | GO:0040015 | negative regulation of multicellular organism growth(GO:0040015) |
| 0.5 | 1.5 | GO:0021569 | rhombomere 3 development(GO:0021569) |
| 0.5 | 0.5 | GO:0010728 | regulation of hydrogen peroxide biosynthetic process(GO:0010728) |
| 0.5 | 0.5 | GO:1903630 | regulation of aminoacyl-tRNA ligase activity(GO:1903630) |
| 0.5 | 2.0 | GO:0051547 | regulation of keratinocyte migration(GO:0051547) |
| 0.5 | 5.5 | GO:0090084 | negative regulation of inclusion body assembly(GO:0090084) |
| 0.5 | 1.0 | GO:0097211 | response to gonadotropin-releasing hormone(GO:0097210) cellular response to gonadotropin-releasing hormone(GO:0097211) |
| 0.5 | 2.9 | GO:0031274 | positive regulation of pseudopodium assembly(GO:0031274) |
| 0.5 | 2.0 | GO:0048627 | myoblast development(GO:0048627) |
| 0.5 | 1.5 | GO:0045198 | establishment of epithelial cell apical/basal polarity(GO:0045198) |
| 0.5 | 1.0 | GO:0043335 | protein unfolding(GO:0043335) |
| 0.5 | 3.4 | GO:0034205 | beta-amyloid formation(GO:0034205) |
| 0.5 | 1.4 | GO:0006474 | N-terminal protein amino acid acetylation(GO:0006474) |
| 0.5 | 1.9 | GO:0032815 | negative regulation of natural killer cell activation(GO:0032815) |
| 0.5 | 2.9 | GO:0031133 | regulation of axon diameter(GO:0031133) |
| 0.5 | 1.0 | GO:1900126 | negative regulation of hyaluronan biosynthetic process(GO:1900126) |
| 0.5 | 7.1 | GO:0036342 | post-anal tail morphogenesis(GO:0036342) |
| 0.5 | 2.4 | GO:0045329 | carnitine biosynthetic process(GO:0045329) |
| 0.5 | 10.9 | GO:0000185 | activation of MAPKKK activity(GO:0000185) |
| 0.5 | 0.9 | GO:2000059 | negative regulation of protein ubiquitination involved in ubiquitin-dependent protein catabolic process(GO:2000059) |
| 0.5 | 4.7 | GO:0071550 | death-inducing signaling complex assembly(GO:0071550) |
| 0.5 | 0.5 | GO:0061316 | canonical Wnt signaling pathway involved in heart development(GO:0061316) |
| 0.5 | 1.9 | GO:0016973 | poly(A)+ mRNA export from nucleus(GO:0016973) |
| 0.5 | 0.5 | GO:0007343 | egg activation(GO:0007343) |
| 0.5 | 7.4 | GO:0032508 | DNA duplex unwinding(GO:0032508) |
| 0.5 | 3.2 | GO:0035799 | ureter maturation(GO:0035799) |
| 0.5 | 9.2 | GO:0009954 | proximal/distal pattern formation(GO:0009954) |
| 0.5 | 1.8 | GO:1904977 | lymphatic endothelial cell migration(GO:1904977) |
| 0.5 | 2.3 | GO:0015742 | alpha-ketoglutarate transport(GO:0015742) |
| 0.5 | 1.4 | GO:0006103 | 2-oxoglutarate metabolic process(GO:0006103) |
| 0.5 | 3.6 | GO:0016576 | histone dephosphorylation(GO:0016576) |
| 0.5 | 2.3 | GO:0032020 | ISG15-protein conjugation(GO:0032020) |
| 0.4 | 1.8 | GO:0015801 | aromatic amino acid transport(GO:0015801) |
| 0.4 | 3.1 | GO:0006568 | tryptophan metabolic process(GO:0006568) |
| 0.4 | 0.4 | GO:0032304 | negative regulation of icosanoid secretion(GO:0032304) |
| 0.4 | 0.4 | GO:0021562 | vestibulocochlear nerve development(GO:0021562) |
| 0.4 | 1.3 | GO:0035995 | detection of muscle stretch(GO:0035995) |
| 0.4 | 1.7 | GO:0009437 | carnitine metabolic process(GO:0009437) |
| 0.4 | 1.7 | GO:0021622 | oculomotor nerve morphogenesis(GO:0021622) oculomotor nerve formation(GO:0021623) |
| 0.4 | 1.3 | GO:0042939 | glutathione transport(GO:0034635) tripeptide transport(GO:0042939) |
| 0.4 | 1.3 | GO:1903028 | positive regulation of opsonization(GO:1903028) |
| 0.4 | 0.4 | GO:0060769 | positive regulation of epithelial cell proliferation involved in prostate gland development(GO:0060769) |
| 0.4 | 1.7 | GO:0045218 | zonula adherens maintenance(GO:0045218) |
| 0.4 | 0.4 | GO:0045144 | meiotic sister chromatid segregation(GO:0045144) |
| 0.4 | 2.1 | GO:0015692 | lead ion transport(GO:0015692) |
| 0.4 | 0.4 | GO:0036022 | limb joint morphogenesis(GO:0036022) embryonic skeletal limb joint morphogenesis(GO:0036023) |
| 0.4 | 1.3 | GO:1903565 | negative regulation of protein localization to cilium(GO:1903565) regulation of protein localization to ciliary membrane(GO:1903567) negative regulation of protein localization to ciliary membrane(GO:1903568) |
| 0.4 | 2.5 | GO:0048743 | positive regulation of skeletal muscle fiber development(GO:0048743) |
| 0.4 | 1.3 | GO:0035063 | nuclear speck organization(GO:0035063) |
| 0.4 | 5.4 | GO:0031648 | protein destabilization(GO:0031648) |
| 0.4 | 2.9 | GO:0035518 | histone H2A monoubiquitination(GO:0035518) |
| 0.4 | 17.4 | GO:0043484 | regulation of RNA splicing(GO:0043484) |
| 0.4 | 2.5 | GO:2000346 | negative regulation of hepatocyte proliferation(GO:2000346) |
| 0.4 | 1.6 | GO:0048388 | endosomal lumen acidification(GO:0048388) |
| 0.4 | 1.2 | GO:0009080 | alanine metabolic process(GO:0006522) alanine catabolic process(GO:0006524) pyruvate family amino acid metabolic process(GO:0009078) pyruvate family amino acid catabolic process(GO:0009080) |
| 0.4 | 0.8 | GO:0034165 | positive regulation of toll-like receptor 9 signaling pathway(GO:0034165) |
| 0.4 | 1.2 | GO:0006741 | NADP biosynthetic process(GO:0006741) |
| 0.4 | 0.8 | GO:0051182 | coenzyme transport(GO:0051182) |
| 0.4 | 0.4 | GO:0070093 | negative regulation of glucagon secretion(GO:0070093) |
| 0.4 | 2.4 | GO:0098704 | fructose transport(GO:0015755) fructose import(GO:0032445) carbohydrate import into cell(GO:0097319) carbohydrate import across plasma membrane(GO:0098704) fructose import across plasma membrane(GO:1990539) |
| 0.4 | 11.1 | GO:0031581 | hemidesmosome assembly(GO:0031581) |
| 0.4 | 0.4 | GO:0003218 | cardiac left ventricle formation(GO:0003218) |
| 0.4 | 2.7 | GO:0003360 | brainstem development(GO:0003360) |
| 0.4 | 6.2 | GO:0007020 | microtubule nucleation(GO:0007020) |
| 0.4 | 1.2 | GO:0014707 | branchiomeric skeletal muscle development(GO:0014707) |
| 0.4 | 7.7 | GO:0009812 | flavonoid metabolic process(GO:0009812) |
| 0.4 | 0.4 | GO:0003180 | aortic valve development(GO:0003176) aortic valve morphogenesis(GO:0003180) |
| 0.4 | 0.8 | GO:0006659 | phosphatidylserine biosynthetic process(GO:0006659) |
| 0.4 | 6.1 | GO:1902894 | negative regulation of pri-miRNA transcription from RNA polymerase II promoter(GO:1902894) |
| 0.4 | 1.5 | GO:0060544 | regulation of necroptotic process(GO:0060544) |
| 0.4 | 1.9 | GO:0010533 | regulation of activation of Janus kinase activity(GO:0010533) |
| 0.4 | 6.0 | GO:0043555 | regulation of translation in response to stress(GO:0043555) |
| 0.4 | 2.2 | GO:0019532 | oxalate transport(GO:0019532) |
| 0.4 | 1.5 | GO:0046016 | positive regulation of transcription by glucose(GO:0046016) |
| 0.4 | 4.1 | GO:0050855 | regulation of B cell receptor signaling pathway(GO:0050855) |
| 0.4 | 0.7 | GO:0060166 | olfactory pit development(GO:0060166) |
| 0.4 | 6.6 | GO:0008299 | isoprenoid biosynthetic process(GO:0008299) |
| 0.4 | 2.2 | GO:0045723 | positive regulation of fatty acid biosynthetic process(GO:0045723) |
| 0.4 | 3.3 | GO:0019375 | galactosylceramide biosynthetic process(GO:0006682) galactolipid biosynthetic process(GO:0019375) |
| 0.4 | 8.4 | GO:0008209 | androgen metabolic process(GO:0008209) |
| 0.4 | 1.8 | GO:0008628 | hormone-mediated apoptotic signaling pathway(GO:0008628) |
| 0.4 | 0.7 | GO:0019853 | L-ascorbic acid biosynthetic process(GO:0019853) |
| 0.4 | 0.7 | GO:0061386 | closure of optic fissure(GO:0061386) |
| 0.4 | 4.0 | GO:0097421 | liver regeneration(GO:0097421) |
| 0.4 | 1.1 | GO:0070092 | glucagon secretion(GO:0070091) regulation of glucagon secretion(GO:0070092) |
| 0.4 | 0.4 | GO:1901187 | regulation of ephrin receptor signaling pathway(GO:1901187) |
| 0.4 | 0.4 | GO:0061153 | trachea submucosa development(GO:0061152) trachea gland development(GO:0061153) |
| 0.4 | 3.6 | GO:0060576 | intestinal epithelial cell development(GO:0060576) |
| 0.4 | 0.7 | GO:0002018 | renin-angiotensin regulation of aldosterone production(GO:0002018) |
| 0.4 | 2.1 | GO:1902031 | regulation of NADP metabolic process(GO:1902031) |
| 0.4 | 5.0 | GO:0048935 | peripheral nervous system neuron differentiation(GO:0048934) peripheral nervous system neuron development(GO:0048935) |
| 0.4 | 0.7 | GO:0048733 | sebaceous gland development(GO:0048733) |
| 0.4 | 3.5 | GO:0006903 | vesicle targeting(GO:0006903) |
| 0.4 | 2.1 | GO:0046541 | saliva secretion(GO:0046541) |
| 0.3 | 5.2 | GO:0006491 | N-glycan processing(GO:0006491) |
| 0.3 | 1.7 | GO:0001575 | globoside metabolic process(GO:0001575) |
| 0.3 | 1.4 | GO:0034334 | adherens junction maintenance(GO:0034334) |
| 0.3 | 0.3 | GO:0036302 | atrioventricular canal development(GO:0036302) |
| 0.3 | 1.0 | GO:0048250 | mitochondrial iron ion transport(GO:0048250) |
| 0.3 | 2.7 | GO:0045059 | positive thymic T cell selection(GO:0045059) |
| 0.3 | 0.7 | GO:0036518 | chemorepulsion of dopaminergic neuron axon(GO:0036518) chemorepulsion of axon(GO:0061643) |
| 0.3 | 0.7 | GO:0002933 | lipid hydroxylation(GO:0002933) |
| 0.3 | 1.0 | GO:0045654 | positive regulation of megakaryocyte differentiation(GO:0045654) |
| 0.3 | 0.7 | GO:0043461 | proton-transporting ATP synthase complex assembly(GO:0043461) proton-transporting ATP synthase complex biogenesis(GO:0070272) |
| 0.3 | 3.3 | GO:0006309 | apoptotic DNA fragmentation(GO:0006309) |
| 0.3 | 0.7 | GO:0060044 | negative regulation of cardiac muscle cell proliferation(GO:0060044) |
| 0.3 | 1.3 | GO:0001777 | T cell homeostatic proliferation(GO:0001777) regulation of T cell homeostatic proliferation(GO:0046013) |
| 0.3 | 1.0 | GO:0051444 | negative regulation of ubiquitin-protein transferase activity(GO:0051444) |
| 0.3 | 1.6 | GO:0035246 | peptidyl-arginine N-methylation(GO:0035246) |
| 0.3 | 9.7 | GO:0000188 | inactivation of MAPK activity(GO:0000188) |
| 0.3 | 1.3 | GO:0090190 | positive regulation of branching involved in ureteric bud morphogenesis(GO:0090190) |
| 0.3 | 3.2 | GO:0043536 | positive regulation of blood vessel endothelial cell migration(GO:0043536) |
| 0.3 | 1.3 | GO:0009950 | dorsal/ventral axis specification(GO:0009950) |
| 0.3 | 1.2 | GO:1902081 | regulation of calcium ion import into sarcoplasmic reticulum(GO:1902080) negative regulation of calcium ion import into sarcoplasmic reticulum(GO:1902081) |
| 0.3 | 1.5 | GO:0032483 | regulation of Rab protein signal transduction(GO:0032483) |
| 0.3 | 0.3 | GO:2001027 | negative regulation of endothelial cell chemotaxis(GO:2001027) |
| 0.3 | 1.2 | GO:0060644 | mammary gland epithelial cell differentiation(GO:0060644) |
| 0.3 | 3.0 | GO:0031397 | negative regulation of protein ubiquitination(GO:0031397) |
| 0.3 | 8.7 | GO:0015893 | drug transport(GO:0015893) |
| 0.3 | 2.1 | GO:0006610 | ribosomal protein import into nucleus(GO:0006610) |
| 0.3 | 0.3 | GO:0032687 | negative regulation of interferon-alpha production(GO:0032687) |
| 0.3 | 1.8 | GO:1904996 | positive regulation of leukocyte adhesion to vascular endothelial cell(GO:1904996) |
| 0.3 | 0.6 | GO:0043652 | engulfment of apoptotic cell(GO:0043652) |
| 0.3 | 0.3 | GO:0071169 | establishment of protein localization to chromatin(GO:0071169) |
| 0.3 | 2.0 | GO:1902956 | regulation of mitochondrial electron transport, NADH to ubiquinone(GO:1902956) negative regulation of mitochondrial electron transport, NADH to ubiquinone(GO:1902957) |
| 0.3 | 0.6 | GO:0046532 | regulation of photoreceptor cell differentiation(GO:0046532) |
| 0.3 | 0.9 | GO:1902161 | positive regulation of cyclic nucleotide-gated ion channel activity(GO:1902161) |
| 0.3 | 1.2 | GO:2000563 | positive regulation of CD4-positive, alpha-beta T cell proliferation(GO:2000563) |
| 0.3 | 7.2 | GO:0050850 | positive regulation of calcium-mediated signaling(GO:0050850) |
| 0.3 | 0.6 | GO:0021892 | interneuron migration from the subpallium to the cortex(GO:0021830) cerebral cortex GABAergic interneuron migration(GO:0021853) cerebral cortex GABAergic interneuron differentiation(GO:0021892) GABAergic neuron differentiation(GO:0097154) interneuron migration(GO:1904936) |
| 0.3 | 0.6 | GO:0002032 | desensitization of G-protein coupled receptor protein signaling pathway by arrestin(GO:0002032) |
| 0.3 | 1.1 | GO:1903385 | regulation of homophilic cell adhesion(GO:1903385) |
| 0.3 | 14.2 | GO:0038128 | ERBB2 signaling pathway(GO:0038128) |
| 0.3 | 0.8 | GO:0048339 | paraxial mesoderm development(GO:0048339) |
| 0.3 | 0.8 | GO:0072709 | cellular response to sorbitol(GO:0072709) |
| 0.3 | 1.1 | GO:0051437 | positive regulation of ubiquitin-protein ligase activity involved in regulation of mitotic cell cycle transition(GO:0051437) |
| 0.3 | 5.5 | GO:0043101 | purine-containing compound salvage(GO:0043101) |
| 0.3 | 0.5 | GO:1904478 | regulation of intestinal absorption(GO:1904478) |
| 0.3 | 1.6 | GO:0035860 | glial cell-derived neurotrophic factor receptor signaling pathway(GO:0035860) |
| 0.3 | 0.3 | GO:0071630 | nucleus-associated proteasomal ubiquitin-dependent protein catabolic process(GO:0071630) |
| 0.3 | 0.5 | GO:0045617 | negative regulation of keratinocyte differentiation(GO:0045617) |
| 0.3 | 0.5 | GO:0090656 | t-circle formation(GO:0090656) |
| 0.3 | 1.1 | GO:2000741 | positive regulation of mesenchymal stem cell differentiation(GO:2000741) |
| 0.3 | 0.8 | GO:0097201 | negative regulation of transcription from RNA polymerase II promoter in response to stress(GO:0097201) |
| 0.3 | 0.8 | GO:0060671 | epithelial cell differentiation involved in embryonic placenta development(GO:0060671) epithelial cell morphogenesis involved in placental branching(GO:0060672) |
| 0.3 | 2.8 | GO:1901072 | glucosamine-containing compound catabolic process(GO:1901072) |
| 0.3 | 2.6 | GO:0044786 | cell cycle DNA replication(GO:0044786) |
| 0.3 | 3.3 | GO:0001825 | blastocyst formation(GO:0001825) |
| 0.3 | 1.5 | GO:0070673 | response to interleukin-18(GO:0070673) |
| 0.3 | 1.8 | GO:0035331 | negative regulation of hippo signaling(GO:0035331) |
| 0.3 | 0.8 | GO:0009048 | dosage compensation(GO:0007549) dosage compensation by inactivation of X chromosome(GO:0009048) |
| 0.3 | 0.8 | GO:0060745 | mammary gland branching involved in pregnancy(GO:0060745) |
| 0.3 | 0.8 | GO:0051151 | negative regulation of smooth muscle cell differentiation(GO:0051151) |
| 0.2 | 3.7 | GO:0007213 | G-protein coupled acetylcholine receptor signaling pathway(GO:0007213) |
| 0.2 | 0.5 | GO:0034378 | chylomicron assembly(GO:0034378) |
| 0.2 | 1.9 | GO:0003084 | positive regulation of systemic arterial blood pressure(GO:0003084) |
| 0.2 | 1.2 | GO:0001834 | trophectodermal cell proliferation(GO:0001834) |
| 0.2 | 1.0 | GO:0015677 | copper ion import(GO:0015677) |
| 0.2 | 1.9 | GO:0006825 | copper ion transport(GO:0006825) |
| 0.2 | 0.7 | GO:0060282 | positive regulation of oocyte development(GO:0060282) |
| 0.2 | 1.4 | GO:0033088 | negative regulation of immature T cell proliferation(GO:0033087) negative regulation of immature T cell proliferation in thymus(GO:0033088) |
| 0.2 | 0.7 | GO:0060830 | ciliary receptor clustering involved in smoothened signaling pathway(GO:0060830) |
| 0.2 | 0.7 | GO:0046952 | ketone body catabolic process(GO:0046952) |
| 0.2 | 0.5 | GO:0006295 | nucleotide-excision repair, DNA incision, 3'-to lesion(GO:0006295) |
| 0.2 | 4.2 | GO:0010259 | multicellular organism aging(GO:0010259) |
| 0.2 | 0.7 | GO:2000036 | regulation of stem cell population maintenance(GO:2000036) |
| 0.2 | 0.5 | GO:0010760 | negative regulation of macrophage chemotaxis(GO:0010760) |
| 0.2 | 1.6 | GO:0042797 | 5S class rRNA transcription from RNA polymerase III type 1 promoter(GO:0042791) tRNA transcription from RNA polymerase III promoter(GO:0042797) |
| 0.2 | 1.8 | GO:0034384 | high-density lipoprotein particle clearance(GO:0034384) |
| 0.2 | 0.2 | GO:0019230 | proprioception(GO:0019230) |
| 0.2 | 0.2 | GO:0009957 | epidermal cell fate specification(GO:0009957) |
| 0.2 | 8.3 | GO:0050690 | regulation of defense response to virus by virus(GO:0050690) |
| 0.2 | 1.1 | GO:1903236 | regulation of leukocyte tethering or rolling(GO:1903236) negative regulation of leukocyte tethering or rolling(GO:1903237) |
| 0.2 | 0.2 | GO:0015842 | aminergic neurotransmitter loading into synaptic vesicle(GO:0015842) |
| 0.2 | 5.0 | GO:0034142 | toll-like receptor 4 signaling pathway(GO:0034142) |
| 0.2 | 4.3 | GO:0033139 | regulation of peptidyl-serine phosphorylation of STAT protein(GO:0033139) |
| 0.2 | 1.3 | GO:0061624 | fructose catabolic process(GO:0006001) fructose catabolic process to hydroxyacetone phosphate and glyceraldehyde-3-phosphate(GO:0061624) |
| 0.2 | 1.1 | GO:0046146 | tetrahydrobiopterin biosynthetic process(GO:0006729) tetrahydrobiopterin metabolic process(GO:0046146) |
| 0.2 | 0.7 | GO:0046391 | 5-phosphoribose 1-diphosphate biosynthetic process(GO:0006015) 5-phosphoribose 1-diphosphate metabolic process(GO:0046391) |
| 0.2 | 0.9 | GO:0003415 | chondrocyte hypertrophy(GO:0003415) |
| 0.2 | 0.2 | GO:0070213 | protein auto-ADP-ribosylation(GO:0070213) |
| 0.2 | 3.1 | GO:0031034 | myosin filament assembly(GO:0031034) |
| 0.2 | 0.4 | GO:0051458 | corticotropin secretion(GO:0051458) |
| 0.2 | 8.8 | GO:0006635 | fatty acid beta-oxidation(GO:0006635) |
| 0.2 | 1.1 | GO:0051389 | inactivation of MAPKK activity(GO:0051389) |
| 0.2 | 0.6 | GO:0036112 | medium-chain fatty-acyl-CoA metabolic process(GO:0036112) |
| 0.2 | 3.5 | GO:0040032 | post-embryonic body morphogenesis(GO:0040032) |
| 0.2 | 0.2 | GO:1990637 | response to prolactin(GO:1990637) |
| 0.2 | 0.9 | GO:0001880 | Mullerian duct regression(GO:0001880) |
| 0.2 | 9.1 | GO:0031640 | killing of cells of other organism(GO:0031640) disruption of cells of other organism(GO:0044364) |
| 0.2 | 1.7 | GO:0036120 | cellular response to platelet-derived growth factor stimulus(GO:0036120) |
| 0.2 | 0.8 | GO:0035750 | protein localization to myelin sheath abaxonal region(GO:0035750) |
| 0.2 | 0.6 | GO:0048194 | Golgi vesicle budding(GO:0048194) |
| 0.2 | 4.4 | GO:0017144 | drug metabolic process(GO:0017144) |
| 0.2 | 1.2 | GO:0048536 | spleen development(GO:0048536) |
| 0.2 | 3.5 | GO:0060612 | adipose tissue development(GO:0060612) |
| 0.2 | 0.8 | GO:0021764 | amygdala development(GO:0021764) |
| 0.2 | 0.2 | GO:0046619 | optic placode formation involved in camera-type eye formation(GO:0046619) |
| 0.2 | 0.2 | GO:0016103 | diterpenoid catabolic process(GO:0016103) retinoic acid catabolic process(GO:0034653) |
| 0.2 | 0.6 | GO:0033299 | secretion of lysosomal enzymes(GO:0033299) |
| 0.2 | 2.3 | GO:0035095 | behavioral response to nicotine(GO:0035095) |
| 0.2 | 2.6 | GO:0038003 | opioid receptor signaling pathway(GO:0038003) |
| 0.2 | 0.2 | GO:0030222 | eosinophil differentiation(GO:0030222) |
| 0.2 | 1.4 | GO:0010578 | regulation of adenylate cyclase activity involved in G-protein coupled receptor signaling pathway(GO:0010578) positive regulation of adenylate cyclase activity involved in G-protein coupled receptor signaling pathway(GO:0010579) |
| 0.2 | 0.9 | GO:0036438 | maintenance of lens transparency(GO:0036438) |
| 0.2 | 1.8 | GO:0051016 | barbed-end actin filament capping(GO:0051016) |
| 0.2 | 1.6 | GO:0007168 | receptor guanylyl cyclase signaling pathway(GO:0007168) |
| 0.2 | 0.7 | GO:0010867 | positive regulation of triglyceride biosynthetic process(GO:0010867) |
| 0.2 | 0.3 | GO:1904526 | regulation of microtubule binding(GO:1904526) |
| 0.2 | 0.5 | GO:0051026 | chiasma assembly(GO:0051026) |
| 0.2 | 1.2 | GO:0007171 | activation of transmembrane receptor protein tyrosine kinase activity(GO:0007171) |
| 0.2 | 2.2 | GO:2000659 | regulation of interleukin-1-mediated signaling pathway(GO:2000659) |
| 0.2 | 0.2 | GO:2000110 | negative regulation of macrophage apoptotic process(GO:2000110) |
| 0.2 | 1.5 | GO:1902230 | negative regulation of intrinsic apoptotic signaling pathway in response to DNA damage(GO:1902230) |
| 0.2 | 7.6 | GO:0006695 | cholesterol biosynthetic process(GO:0006695) secondary alcohol biosynthetic process(GO:1902653) |
| 0.2 | 0.2 | GO:0021937 | cerebellar Purkinje cell-granule cell precursor cell signaling involved in regulation of granule cell precursor cell proliferation(GO:0021937) |
| 0.2 | 0.2 | GO:0046078 | dUMP metabolic process(GO:0046078) |
| 0.2 | 1.0 | GO:0000038 | very long-chain fatty acid metabolic process(GO:0000038) |
| 0.2 | 1.9 | GO:0016574 | histone ubiquitination(GO:0016574) |
| 0.2 | 0.3 | GO:0043385 | mycotoxin metabolic process(GO:0043385) aflatoxin metabolic process(GO:0046222) organic heteropentacyclic compound metabolic process(GO:1901376) |
| 0.2 | 0.5 | GO:0001923 | B-1 B cell differentiation(GO:0001923) |
| 0.2 | 0.6 | GO:0002371 | dendritic cell cytokine production(GO:0002371) |
| 0.2 | 2.7 | GO:0006884 | cell volume homeostasis(GO:0006884) |
| 0.2 | 1.7 | GO:0000732 | strand displacement(GO:0000732) |
| 0.1 | 0.4 | GO:0060281 | regulation of oocyte development(GO:0060281) |
| 0.1 | 8.3 | GO:1902807 | negative regulation of cell cycle G1/S phase transition(GO:1902807) |
| 0.1 | 0.4 | GO:0001994 | norepinephrine-epinephrine vasoconstriction involved in regulation of systemic arterial blood pressure(GO:0001994) |
| 0.1 | 2.4 | GO:0050435 | beta-amyloid metabolic process(GO:0050435) |
| 0.1 | 3.6 | GO:0006414 | translational elongation(GO:0006414) |
| 0.1 | 0.3 | GO:0060335 | positive regulation of response to interferon-gamma(GO:0060332) positive regulation of interferon-gamma-mediated signaling pathway(GO:0060335) |
| 0.1 | 0.5 | GO:0002158 | osteoclast proliferation(GO:0002158) |
| 0.1 | 0.3 | GO:0097156 | fasciculation of motor neuron axon(GO:0097156) |
| 0.1 | 0.4 | GO:1990785 | initiation of primordial ovarian follicle growth(GO:0001544) response to water-immersion restraint stress(GO:1990785) |
| 0.1 | 2.5 | GO:0046949 | fatty-acyl-CoA biosynthetic process(GO:0046949) |
| 0.1 | 0.2 | GO:0061502 | early endosome to recycling endosome transport(GO:0061502) |
| 0.1 | 0.4 | GO:0035048 | splicing factor protein import into nucleus(GO:0035048) |
| 0.1 | 1.4 | GO:0048305 | immunoglobulin secretion(GO:0048305) |
| 0.1 | 1.2 | GO:0048312 | intracellular distribution of mitochondria(GO:0048312) |
| 0.1 | 1.1 | GO:0045668 | negative regulation of osteoblast differentiation(GO:0045668) |
| 0.1 | 0.4 | GO:0055026 | negative regulation of cardiac muscle tissue development(GO:0055026) |
| 0.1 | 0.2 | GO:0003199 | endocardial cushion to mesenchymal transition involved in heart valve formation(GO:0003199) |
| 0.1 | 1.0 | GO:0021785 | branchiomotor neuron axon guidance(GO:0021785) |
| 0.1 | 0.8 | GO:0002480 | antigen processing and presentation of exogenous peptide antigen via MHC class I, TAP-independent(GO:0002480) |
| 0.1 | 0.2 | GO:0071421 | manganese ion transmembrane transport(GO:0071421) |
| 0.1 | 0.4 | GO:0002644 | negative regulation of tolerance induction(GO:0002644) |
| 0.1 | 0.4 | GO:0051660 | establishment of centrosome localization(GO:0051660) |
| 0.1 | 0.7 | GO:0006824 | cobalt ion transport(GO:0006824) |
| 0.1 | 0.5 | GO:0060017 | parathyroid gland development(GO:0060017) |
| 0.1 | 0.2 | GO:0032912 | negative regulation of transforming growth factor beta2 production(GO:0032912) |
| 0.1 | 0.3 | GO:0071635 | negative regulation of transforming growth factor beta production(GO:0071635) |
| 0.1 | 0.3 | GO:0003433 | chondrocyte development involved in endochondral bone morphogenesis(GO:0003433) |
| 0.1 | 0.8 | GO:2000010 | positive regulation of protein localization to cell surface(GO:2000010) |
| 0.1 | 0.3 | GO:1902237 | positive regulation of endoplasmic reticulum stress-induced intrinsic apoptotic signaling pathway(GO:1902237) |
| 0.1 | 0.8 | GO:0014722 | regulation of skeletal muscle contraction by calcium ion signaling(GO:0014722) |
| 0.1 | 0.7 | GO:1901741 | positive regulation of myoblast fusion(GO:1901741) |
| 0.1 | 0.4 | GO:0035754 | B cell chemotaxis(GO:0035754) |
| 0.1 | 0.3 | GO:0042090 | interleukin-12 biosynthetic process(GO:0042090) regulation of interleukin-12 biosynthetic process(GO:0045075) |
| 0.1 | 0.7 | GO:0032435 | negative regulation of proteasomal ubiquitin-dependent protein catabolic process(GO:0032435) |
| 0.1 | 1.4 | GO:0030252 | growth hormone secretion(GO:0030252) |
| 0.1 | 0.3 | GO:0008063 | Toll signaling pathway(GO:0008063) |
| 0.1 | 0.1 | GO:0002232 | leukocyte chemotaxis involved in inflammatory response(GO:0002232) |
| 0.1 | 0.8 | GO:1900017 | positive regulation of cytokine production involved in inflammatory response(GO:1900017) |
| 0.1 | 0.1 | GO:0046642 | negative regulation of alpha-beta T cell proliferation(GO:0046642) |
| 0.1 | 0.8 | GO:0072348 | sulfur compound transport(GO:0072348) |
| 0.1 | 0.4 | GO:0098735 | positive regulation of the force of heart contraction(GO:0098735) |
| 0.1 | 0.6 | GO:0051044 | positive regulation of membrane protein ectodomain proteolysis(GO:0051044) |
| 0.1 | 2.0 | GO:0016338 | calcium-independent cell-cell adhesion via plasma membrane cell-adhesion molecules(GO:0016338) |
| 0.1 | 0.3 | GO:1901202 | negative regulation of extracellular matrix assembly(GO:1901202) |
| 0.1 | 2.1 | GO:1901224 | positive regulation of NIK/NF-kappaB signaling(GO:1901224) |
| 0.1 | 0.1 | GO:2000330 | positive regulation of T-helper 17 cell lineage commitment(GO:2000330) |
| 0.1 | 0.1 | GO:2000615 | regulation of histone H3-K9 acetylation(GO:2000615) |
| 0.1 | 0.1 | GO:0034392 | negative regulation of smooth muscle cell apoptotic process(GO:0034392) |
| 0.1 | 0.1 | GO:0097168 | mesenchymal stem cell proliferation(GO:0097168) positive regulation of chondrocyte proliferation(GO:1902732) |
| 0.1 | 0.4 | GO:0017182 | peptidyl-diphthamide metabolic process(GO:0017182) peptidyl-diphthamide biosynthetic process from peptidyl-histidine(GO:0017183) |
| 0.1 | 0.8 | GO:0002407 | dendritic cell chemotaxis(GO:0002407) |
| 0.0 | 1.3 | GO:0048384 | retinoic acid receptor signaling pathway(GO:0048384) |
| 0.0 | 0.5 | GO:0016126 | sterol biosynthetic process(GO:0016126) |
| 0.0 | 0.1 | GO:0051835 | positive regulation of synapse structural plasticity(GO:0051835) |
| 0.0 | 0.3 | GO:0036109 | alpha-linolenic acid metabolic process(GO:0036109) |
| 0.0 | 0.4 | GO:0006301 | postreplication repair(GO:0006301) |
| 0.0 | 0.2 | GO:1904779 | regulation of protein localization to centrosome(GO:1904779) |
| 0.0 | 0.1 | GO:0072205 | metanephric collecting duct development(GO:0072205) |
| 0.0 | 0.3 | GO:0006089 | lactate metabolic process(GO:0006089) |
| 0.0 | 0.9 | GO:0031100 | organ regeneration(GO:0031100) |
| 0.0 | 0.1 | GO:0060482 | lobar bronchus development(GO:0060482) |
| 0.0 | 0.1 | GO:0003164 | His-Purkinje system development(GO:0003164) cardiac pacemaker cell differentiation(GO:0060920) cardiac pacemaker cell development(GO:0060926) |
| 0.0 | 0.2 | GO:0090085 | regulation of protein deubiquitination(GO:0090085) |
| 0.0 | 0.4 | GO:0098911 | regulation of ventricular cardiac muscle cell action potential(GO:0098911) |
| 0.0 | 0.2 | GO:0003417 | growth plate cartilage development(GO:0003417) |
| 0.0 | 0.1 | GO:0071941 | nitrogen cycle metabolic process(GO:0071941) |
| 0.0 | 0.1 | GO:0042359 | vitamin D metabolic process(GO:0042359) |
| 0.0 | 0.1 | GO:1901053 | sarcosine metabolic process(GO:1901052) sarcosine catabolic process(GO:1901053) |
| 0.0 | 0.1 | GO:0048012 | hepatocyte growth factor receptor signaling pathway(GO:0048012) |
| 0.0 | 0.2 | GO:0015695 | organic cation transport(GO:0015695) |
| 0.0 | 0.1 | GO:0035879 | plasma membrane lactate transport(GO:0035879) |
| 0.0 | 0.1 | GO:0016255 | attachment of GPI anchor to protein(GO:0016255) |
| 0.0 | 0.0 | GO:0030860 | regulation of polarized epithelial cell differentiation(GO:0030860) |
| 0.0 | 0.1 | GO:0000821 | regulation of arginine metabolic process(GO:0000821) |
| 0.0 | 0.1 | GO:2000696 | regulation of epithelial cell differentiation involved in kidney development(GO:2000696) |
| 0.0 | 0.0 | GO:0042363 | fat-soluble vitamin catabolic process(GO:0042363) |
| 0.0 | 0.0 | GO:0002384 | hepatic immune response(GO:0002384) |
| 0.0 | 0.0 | GO:0060940 | epithelial to mesenchymal transition involved in cardiac fibroblast development(GO:0060940) |
| 0.0 | 0.0 | GO:0003095 | pressure natriuresis(GO:0003095) |
Gene overrepresentation in cellular component category:
| Log-likelihood per target | Total log-likelihood | Term | Description |
|---|---|---|---|
| 19.1 | 95.3 | GO:0031436 | BRCA1-BARD1 complex(GO:0031436) |
| 13.9 | 55.7 | GO:0008537 | proteasome activator complex(GO:0008537) |
| 11.8 | 35.4 | GO:0036284 | tubulobulbar complex(GO:0036284) |
| 9.9 | 39.5 | GO:0002189 | ribose phosphate diphosphokinase complex(GO:0002189) |
| 9.4 | 103.9 | GO:0071204 | histone pre-mRNA 3'end processing complex(GO:0071204) |
| 9.0 | 45.2 | GO:0000214 | tRNA-intron endonuclease complex(GO:0000214) |
| 9.0 | 44.8 | GO:0031523 | Myb complex(GO:0031523) |
| 8.5 | 34.0 | GO:0097125 | cyclin B1-CDK1 complex(GO:0097125) |
| 7.7 | 54.1 | GO:0090661 | box H/ACA snoRNP complex(GO:0031429) box H/ACA RNP complex(GO:0072588) box H/ACA scaRNP complex(GO:0072589) box H/ACA telomerase RNP complex(GO:0090661) |
| 7.5 | 44.8 | GO:0005784 | Sec61 translocon complex(GO:0005784) translocon complex(GO:0071256) |
| 7.4 | 29.8 | GO:0033186 | CAF-1 complex(GO:0033186) |
| 7.1 | 28.6 | GO:0005971 | ribonucleoside-diphosphate reductase complex(GO:0005971) |
| 7.1 | 63.7 | GO:0042382 | paraspeckles(GO:0042382) |
| 7.0 | 56.1 | GO:0000796 | condensin complex(GO:0000796) |
| 6.6 | 39.7 | GO:0017101 | aminoacyl-tRNA synthetase multienzyme complex(GO:0017101) |
| 6.5 | 6.5 | GO:0034750 | Scrib-APC-beta-catenin complex(GO:0034750) |
| 6.2 | 56.1 | GO:0031298 | replication fork protection complex(GO:0031298) |
| 6.2 | 49.4 | GO:0061700 | GATOR2 complex(GO:0061700) |
| 6.0 | 17.9 | GO:0005745 | m-AAA complex(GO:0005745) |
| 6.0 | 23.9 | GO:0005960 | glycine cleavage complex(GO:0005960) |
| 5.8 | 40.9 | GO:0032021 | NELF complex(GO:0032021) |
| 5.8 | 29.1 | GO:0043625 | delta DNA polymerase complex(GO:0043625) |
| 5.7 | 11.5 | GO:0030981 | cortical microtubule cytoskeleton(GO:0030981) |
| 5.6 | 27.8 | GO:0005726 | perichromatin fibrils(GO:0005726) |
| 5.4 | 26.8 | GO:0008622 | epsilon DNA polymerase complex(GO:0008622) |
| 5.3 | 58.4 | GO:0072357 | PTW/PP1 phosphatase complex(GO:0072357) |
| 5.3 | 15.9 | GO:0031262 | Ndc80 complex(GO:0031262) |
| 5.1 | 40.4 | GO:0032541 | cortical endoplasmic reticulum(GO:0032541) |
| 5.0 | 25.0 | GO:0033503 | HULC complex(GO:0033503) |
| 4.9 | 34.1 | GO:0005663 | DNA replication factor C complex(GO:0005663) |
| 4.9 | 43.7 | GO:0005787 | signal peptidase complex(GO:0005787) |
| 4.7 | 28.4 | GO:0000172 | ribonuclease MRP complex(GO:0000172) |
| 4.7 | 23.7 | GO:0005749 | mitochondrial respiratory chain complex II, succinate dehydrogenase complex (ubiquinone)(GO:0005749) succinate dehydrogenase complex (ubiquinone)(GO:0045257) respiratory chain complex II(GO:0045273) succinate dehydrogenase complex(GO:0045281) fumarate reductase complex(GO:0045283) |
| 4.7 | 32.7 | GO:0030677 | ribonuclease P complex(GO:0030677) |
| 4.6 | 88.2 | GO:0033202 | Ino80 complex(GO:0031011) DNA helicase complex(GO:0033202) |
| 4.6 | 27.6 | GO:0071797 | LUBAC complex(GO:0071797) |
| 4.6 | 55.3 | GO:0030015 | CCR4-NOT core complex(GO:0030015) |
| 4.6 | 27.6 | GO:0009368 | endopeptidase Clp complex(GO:0009368) |
| 4.5 | 36.2 | GO:0000015 | phosphopyruvate hydratase complex(GO:0000015) |
| 4.5 | 13.4 | GO:1990723 | cytoplasmic periphery of the nuclear pore complex(GO:1990723) |
| 4.4 | 21.8 | GO:0097149 | centralspindlin complex(GO:0097149) |
| 4.3 | 26.0 | GO:0097422 | tubular endosome(GO:0097422) |
| 4.3 | 30.1 | GO:0005956 | protein kinase CK2 complex(GO:0005956) |
| 4.3 | 51.3 | GO:0019773 | proteasome core complex, alpha-subunit complex(GO:0019773) |
| 4.3 | 4.3 | GO:0030915 | Smc5-Smc6 complex(GO:0030915) |
| 4.2 | 4.2 | GO:0048787 | presynaptic active zone membrane(GO:0048787) |
| 4.2 | 21.0 | GO:0043564 | Ku70:Ku80 complex(GO:0043564) |
| 4.2 | 12.6 | GO:0044611 | nuclear pore inner ring(GO:0044611) |
| 4.2 | 66.6 | GO:0070578 | RISC-loading complex(GO:0070578) |
| 4.1 | 16.5 | GO:0030905 | retromer, tubulation complex(GO:0030905) |
| 4.0 | 12.1 | GO:0017109 | glutamate-cysteine ligase complex(GO:0017109) |
| 4.0 | 16.0 | GO:0071817 | MMXD complex(GO:0071817) |
| 4.0 | 111.3 | GO:0005763 | organellar small ribosomal subunit(GO:0000314) mitochondrial small ribosomal subunit(GO:0005763) |
| 4.0 | 19.8 | GO:0016589 | NURF complex(GO:0016589) |
| 4.0 | 19.8 | GO:0098837 | postsynaptic recycling endosome(GO:0098837) |
| 4.0 | 11.9 | GO:0030312 | external encapsulating structure(GO:0030312) |
| 4.0 | 11.9 | GO:0035517 | PR-DUB complex(GO:0035517) |
| 3.9 | 51.2 | GO:0042555 | MCM complex(GO:0042555) |
| 3.9 | 11.7 | GO:0035525 | NF-kappaB p50/p65 complex(GO:0035525) |
| 3.8 | 45.8 | GO:0045254 | pyruvate dehydrogenase complex(GO:0045254) |
| 3.8 | 38.1 | GO:0071541 | eukaryotic translation initiation factor 3 complex, eIF3m(GO:0071541) |
| 3.8 | 15.2 | GO:1990356 | sumoylated E2 ligase complex(GO:1990356) |
| 3.8 | 3.8 | GO:0032807 | DNA ligase IV complex(GO:0032807) |
| 3.8 | 37.8 | GO:0031595 | nuclear proteasome complex(GO:0031595) |
| 3.8 | 86.4 | GO:0030992 | intraciliary transport particle B(GO:0030992) |
| 3.6 | 18.0 | GO:0042643 | actomyosin, actin portion(GO:0042643) |
| 3.6 | 18.0 | GO:0045272 | plasma membrane respiratory chain complex I(GO:0045272) plasma membrane respiratory chain(GO:0070470) |
| 3.6 | 17.8 | GO:0008274 | gamma-tubulin large complex(GO:0000931) gamma-tubulin ring complex(GO:0008274) |
| 3.6 | 39.2 | GO:0016593 | Cdc73/Paf1 complex(GO:0016593) |
| 3.5 | 38.8 | GO:0005638 | lamin filament(GO:0005638) |
| 3.5 | 6.9 | GO:0005732 | small nucleolar ribonucleoprotein complex(GO:0005732) |
| 3.5 | 38.0 | GO:0044666 | MLL3/4 complex(GO:0044666) |
| 3.4 | 34.4 | GO:0070552 | BRISC complex(GO:0070552) |
| 3.4 | 10.3 | GO:0072379 | BAT3 complex(GO:0071818) ER membrane insertion complex(GO:0072379) |
| 3.4 | 34.1 | GO:0000506 | glycosylphosphatidylinositol-N-acetylglucosaminyltransferase (GPI-GnT) complex(GO:0000506) |
| 3.4 | 50.9 | GO:0034663 | endoplasmic reticulum chaperone complex(GO:0034663) |
| 3.4 | 70.9 | GO:0035098 | ESC/E(Z) complex(GO:0035098) |
| 3.3 | 53.6 | GO:0005736 | DNA-directed RNA polymerase I complex(GO:0005736) |
| 3.3 | 33.5 | GO:0008541 | proteasome regulatory particle, lid subcomplex(GO:0008541) |
| 3.3 | 3.3 | GO:0071159 | NF-kappaB complex(GO:0071159) |
| 3.3 | 6.6 | GO:0071598 | neuronal ribonucleoprotein granule(GO:0071598) |
| 3.2 | 22.7 | GO:0044530 | supraspliceosomal complex(GO:0044530) |
| 3.2 | 12.9 | GO:0030014 | CCR4-NOT complex(GO:0030014) |
| 3.2 | 22.4 | GO:0070761 | pre-snoRNP complex(GO:0070761) |
| 3.2 | 124.5 | GO:0000315 | organellar large ribosomal subunit(GO:0000315) mitochondrial large ribosomal subunit(GO:0005762) |
| 3.2 | 22.3 | GO:0035985 | senescence-associated heterochromatin focus(GO:0035985) |
| 3.2 | 12.7 | GO:0071942 | XPC complex(GO:0071942) |
| 3.2 | 25.4 | GO:0019907 | cyclin-dependent protein kinase activating kinase holoenzyme complex(GO:0019907) |
| 3.2 | 91.8 | GO:0005680 | anaphase-promoting complex(GO:0005680) |
| 3.1 | 15.6 | GO:0001651 | dense fibrillar component(GO:0001651) |
| 3.1 | 77.7 | GO:0005719 | nuclear euchromatin(GO:0005719) |
| 3.1 | 46.5 | GO:0034709 | methylosome(GO:0034709) |
| 3.1 | 52.6 | GO:0005665 | DNA-directed RNA polymerase II, core complex(GO:0005665) |
| 3.1 | 24.7 | GO:0070937 | CRD-mediated mRNA stability complex(GO:0070937) |
| 3.1 | 39.7 | GO:0045275 | mitochondrial respiratory chain complex III(GO:0005750) respiratory chain complex III(GO:0045275) |
| 3.1 | 12.2 | GO:0097255 | R2TP complex(GO:0097255) |
| 3.0 | 12.1 | GO:0044614 | nuclear pore cytoplasmic filaments(GO:0044614) |
| 3.0 | 21.2 | GO:0031415 | NatA complex(GO:0031415) |
| 3.0 | 3.0 | GO:0031428 | box C/D snoRNP complex(GO:0031428) |
| 3.0 | 99.4 | GO:0071564 | npBAF complex(GO:0071564) |
| 2.9 | 11.8 | GO:0005715 | late recombination nodule(GO:0005715) |
| 2.9 | 14.4 | GO:0032301 | MutSalpha complex(GO:0032301) |
| 2.9 | 11.5 | GO:0070531 | BRCA1-A complex(GO:0070531) |
| 2.8 | 42.3 | GO:0005642 | annulate lamellae(GO:0005642) |
| 2.8 | 8.4 | GO:0097135 | cyclin E2-CDK2 complex(GO:0097135) |
| 2.8 | 47.2 | GO:0070822 | Sin3-type complex(GO:0070822) |
| 2.7 | 8.1 | GO:0044393 | microspike(GO:0044393) |
| 2.7 | 2.7 | GO:0005943 | phosphatidylinositol 3-kinase complex, class IA(GO:0005943) |
| 2.7 | 29.3 | GO:0016600 | flotillin complex(GO:0016600) |
| 2.6 | 29.1 | GO:0033588 | Elongator holoenzyme complex(GO:0033588) |
| 2.6 | 44.9 | GO:0005885 | Arp2/3 protein complex(GO:0005885) |
| 2.6 | 15.7 | GO:0002178 | palmitoyltransferase complex(GO:0002178) |
| 2.6 | 33.6 | GO:0002199 | zona pellucida receptor complex(GO:0002199) |
| 2.5 | 17.8 | GO:0001520 | outer dense fiber(GO:0001520) |
| 2.5 | 10.1 | GO:0031510 | SUMO activating enzyme complex(GO:0031510) |
| 2.5 | 15.2 | GO:0042824 | MHC class I peptide loading complex(GO:0042824) |
| 2.5 | 45.4 | GO:0005852 | eukaryotic translation initiation factor 3 complex(GO:0005852) |
| 2.5 | 32.6 | GO:0005688 | U6 snRNP(GO:0005688) |
| 2.5 | 82.3 | GO:0030687 | preribosome, large subunit precursor(GO:0030687) |
| 2.5 | 61.9 | GO:1990124 | messenger ribonucleoprotein complex(GO:1990124) |
| 2.5 | 64.3 | GO:0031304 | intrinsic component of mitochondrial inner membrane(GO:0031304) integral component of mitochondrial inner membrane(GO:0031305) |
| 2.5 | 7.4 | GO:0097441 | basilar dendrite(GO:0097441) |
| 2.5 | 17.2 | GO:0030121 | AP-1 adaptor complex(GO:0030121) |
| 2.4 | 4.9 | GO:0042575 | DNA polymerase complex(GO:0042575) |
| 2.4 | 14.4 | GO:0097129 | cyclin D2-CDK4 complex(GO:0097129) |
| 2.4 | 2.4 | GO:0000805 | X chromosome(GO:0000805) |
| 2.4 | 33.3 | GO:1990712 | HFE-transferrin receptor complex(GO:1990712) |
| 2.4 | 4.7 | GO:0000939 | condensed chromosome inner kinetochore(GO:0000939) |
| 2.4 | 21.3 | GO:0070652 | HAUS complex(GO:0070652) |
| 2.3 | 100.5 | GO:0000307 | cyclin-dependent protein kinase holoenzyme complex(GO:0000307) |
| 2.3 | 9.3 | GO:0001405 | presequence translocase-associated import motor(GO:0001405) |
| 2.3 | 25.6 | GO:0071004 | U2-type prespliceosome(GO:0071004) |
| 2.3 | 18.5 | GO:0061689 | tricellular tight junction(GO:0061689) |
| 2.3 | 18.4 | GO:0033276 | transcription factor TFTC complex(GO:0033276) |
| 2.2 | 22.1 | GO:0005664 | origin recognition complex(GO:0000808) nuclear origin of replication recognition complex(GO:0005664) |
| 2.2 | 6.6 | GO:0030289 | protein phosphatase 4 complex(GO:0030289) |
| 2.2 | 24.2 | GO:0090544 | BAF-type complex(GO:0090544) |
| 2.2 | 11.0 | GO:0000408 | EKC/KEOPS complex(GO:0000408) |
| 2.2 | 13.1 | GO:0000125 | PCAF complex(GO:0000125) |
| 2.2 | 100.4 | GO:0009295 | nucleoid(GO:0009295) mitochondrial nucleoid(GO:0042645) |
| 2.2 | 26.2 | GO:0090543 | Flemming body(GO:0090543) |
| 2.2 | 6.5 | GO:0034515 | proteasome storage granule(GO:0034515) |
| 2.2 | 41.2 | GO:0005641 | nuclear envelope lumen(GO:0005641) |
| 2.1 | 25.5 | GO:0030008 | TRAPP complex(GO:0030008) |
| 2.1 | 8.5 | GO:0001940 | male pronucleus(GO:0001940) |
| 2.1 | 14.6 | GO:1990635 | proximal dendrite(GO:1990635) |
| 2.1 | 14.5 | GO:0005742 | mitochondrial outer membrane translocase complex(GO:0005742) |
| 2.1 | 6.2 | GO:0031010 | ISWI-type complex(GO:0031010) |
| 2.1 | 6.2 | GO:0000798 | nuclear cohesin complex(GO:0000798) |
| 2.0 | 11.9 | GO:0000940 | condensed chromosome outer kinetochore(GO:0000940) |
| 2.0 | 5.9 | GO:0071001 | U4/U6 snRNP(GO:0071001) |
| 2.0 | 35.3 | GO:0000177 | cytoplasmic exosome (RNase complex)(GO:0000177) |
| 1.9 | 7.8 | GO:0071986 | Ragulator complex(GO:0071986) |
| 1.9 | 11.6 | GO:0000313 | organellar ribosome(GO:0000313) mitochondrial ribosome(GO:0005761) |
| 1.9 | 29.0 | GO:0044613 | nuclear pore central transport channel(GO:0044613) |
| 1.9 | 105.9 | GO:0005782 | peroxisomal matrix(GO:0005782) microbody lumen(GO:0031907) |
| 1.9 | 36.6 | GO:0097431 | mitotic spindle pole(GO:0097431) |
| 1.9 | 15.2 | GO:0071664 | catenin-TCF7L2 complex(GO:0071664) |
| 1.9 | 3.8 | GO:0031390 | Ctf18 RFC-like complex(GO:0031390) |
| 1.9 | 20.8 | GO:0005666 | DNA-directed RNA polymerase III complex(GO:0005666) |
| 1.9 | 5.7 | GO:0018444 | translation release factor complex(GO:0018444) |
| 1.9 | 28.2 | GO:0000346 | transcription export complex(GO:0000346) |
| 1.9 | 11.2 | GO:0031332 | RISC complex(GO:0016442) RNAi effector complex(GO:0031332) |
| 1.9 | 111.1 | GO:0005876 | spindle microtubule(GO:0005876) |
| 1.8 | 7.4 | GO:0033257 | Bcl3/NF-kappaB2 complex(GO:0033257) |
| 1.8 | 180.1 | GO:0071013 | catalytic step 2 spliceosome(GO:0071013) |
| 1.8 | 18.1 | GO:0097197 | tetraspanin-enriched microdomain(GO:0097197) |
| 1.8 | 12.6 | GO:0016272 | prefoldin complex(GO:0016272) |
| 1.8 | 8.9 | GO:1990907 | beta-catenin-TCF complex(GO:1990907) |
| 1.8 | 21.0 | GO:0031464 | Cul4A-RING E3 ubiquitin ligase complex(GO:0031464) |
| 1.7 | 3.5 | GO:0070939 | Dsl1p complex(GO:0070939) |
| 1.7 | 13.9 | GO:1905202 | 3-methylcrotonyl-CoA carboxylase complex, mitochondrial(GO:0002169) methylcrotonoyl-CoA carboxylase complex(GO:1905202) |
| 1.7 | 3.5 | GO:0044615 | nuclear pore nuclear basket(GO:0044615) |
| 1.7 | 10.3 | GO:0032389 | MutLalpha complex(GO:0032389) |
| 1.7 | 21.8 | GO:0097038 | perinuclear endoplasmic reticulum(GO:0097038) |
| 1.7 | 10.0 | GO:0031371 | ubiquitin conjugating enzyme complex(GO:0031371) |
| 1.7 | 5.0 | GO:0098799 | outer mitochondrial membrane protein complex(GO:0098799) |
| 1.7 | 5.0 | GO:0034677 | integrin alpha7-beta1 complex(GO:0034677) |
| 1.6 | 4.9 | GO:1990917 | sperm head plasma membrane(GO:1990913) ooplasm(GO:1990917) |
| 1.6 | 13.0 | GO:0005838 | proteasome regulatory particle(GO:0005838) |
| 1.6 | 6.4 | GO:1990357 | terminal web(GO:1990357) |
| 1.6 | 8.0 | GO:0032044 | DSIF complex(GO:0032044) |
| 1.6 | 4.8 | GO:0048269 | methionine adenosyltransferase complex(GO:0048269) |
| 1.6 | 17.3 | GO:0042105 | alpha-beta T cell receptor complex(GO:0042105) |
| 1.6 | 15.7 | GO:0031080 | nuclear pore outer ring(GO:0031080) |
| 1.6 | 157.2 | GO:0000776 | kinetochore(GO:0000776) |
| 1.5 | 17.0 | GO:0032039 | integrator complex(GO:0032039) |
| 1.5 | 154.6 | GO:0031970 | mitochondrial intermembrane space(GO:0005758) organelle envelope lumen(GO:0031970) |
| 1.5 | 6.1 | GO:1990730 | VCP-NSFL1C complex(GO:1990730) |
| 1.5 | 6.0 | GO:0005846 | nuclear cap binding complex(GO:0005846) |
| 1.5 | 11.7 | GO:0070522 | ERCC4-ERCC1 complex(GO:0070522) |
| 1.5 | 1.5 | GO:0097342 | ripoptosome(GO:0097342) |
| 1.4 | 28.7 | GO:0031932 | TORC2 complex(GO:0031932) |
| 1.4 | 7.2 | GO:0005682 | U5 snRNP(GO:0005682) |
| 1.4 | 8.6 | GO:0000322 | storage vacuole(GO:0000322) |
| 1.4 | 55.0 | GO:0000159 | protein phosphatase type 2A complex(GO:0000159) |
| 1.4 | 136.3 | GO:0022625 | cytosolic large ribosomal subunit(GO:0022625) |
| 1.4 | 2.8 | GO:0089701 | U2AF(GO:0089701) |
| 1.4 | 6.9 | GO:0034388 | Pwp2p-containing subcomplex of 90S preribosome(GO:0034388) |
| 1.3 | 8.1 | GO:0072669 | tRNA-splicing ligase complex(GO:0072669) |
| 1.3 | 18.6 | GO:0005662 | DNA replication factor A complex(GO:0005662) |
| 1.3 | 5.2 | GO:0032937 | SREBP-SCAP-Insig complex(GO:0032937) |
| 1.3 | 39.5 | GO:0005640 | nuclear outer membrane(GO:0005640) |
| 1.3 | 5.1 | GO:0042765 | GPI-anchor transamidase complex(GO:0042765) |
| 1.3 | 5.1 | GO:0036502 | Derlin-1-VIMP complex(GO:0036502) |
| 1.3 | 10.1 | GO:0098559 | cytoplasmic side of early endosome membrane(GO:0098559) |
| 1.2 | 9.9 | GO:0005689 | U12-type spliceosomal complex(GO:0005689) |
| 1.2 | 1.2 | GO:1990597 | AIP1-IRE1 complex(GO:1990597) |
| 1.2 | 1.2 | GO:0071920 | cleavage body(GO:0071920) |
| 1.2 | 49.6 | GO:0000502 | proteasome complex(GO:0000502) |
| 1.2 | 25.7 | GO:0005861 | troponin complex(GO:0005861) |
| 1.2 | 12.9 | GO:0000124 | SAGA complex(GO:0000124) |
| 1.1 | 1.1 | GO:0034665 | integrin alpha1-beta1 complex(GO:0034665) |
| 1.1 | 10.0 | GO:0001673 | male germ cell nucleus(GO:0001673) |
| 1.1 | 2.2 | GO:0038201 | TOR complex(GO:0038201) |
| 1.1 | 3.3 | GO:0035032 | phosphatidylinositol 3-kinase complex, class III(GO:0035032) |
| 1.1 | 4.3 | GO:0035061 | interchromatin granule(GO:0035061) |
| 1.1 | 4.3 | GO:0005845 | mRNA cap binding complex(GO:0005845) |
| 1.1 | 8.6 | GO:0070187 | telosome(GO:0070187) |
| 1.1 | 12.9 | GO:0008250 | oligosaccharyltransferase complex(GO:0008250) |
| 1.1 | 4.3 | GO:0005850 | eukaryotic translation initiation factor 2 complex(GO:0005850) |
| 1.1 | 7.4 | GO:0070765 | gamma-secretase complex(GO:0070765) |
| 1.0 | 7.3 | GO:0031465 | Cul4B-RING E3 ubiquitin ligase complex(GO:0031465) |
| 1.0 | 3.1 | GO:0034455 | t-UTP complex(GO:0034455) |
| 1.0 | 12.2 | GO:0070938 | contractile ring(GO:0070938) |
| 1.0 | 12.1 | GO:0030532 | small nuclear ribonucleoprotein complex(GO:0030532) |
| 1.0 | 28.3 | GO:0070971 | endoplasmic reticulum exit site(GO:0070971) |
| 1.0 | 6.0 | GO:0020016 | ciliary pocket(GO:0020016) ciliary pocket membrane(GO:0020018) |
| 1.0 | 13.0 | GO:0017119 | Golgi transport complex(GO:0017119) |
| 1.0 | 10.8 | GO:0005853 | eukaryotic translation elongation factor 1 complex(GO:0005853) |
| 1.0 | 10.7 | GO:0070449 | elongin complex(GO:0070449) |
| 1.0 | 20.2 | GO:0044453 | integral component of nuclear inner membrane(GO:0005639) intrinsic component of nuclear inner membrane(GO:0031229) nuclear membrane part(GO:0044453) |
| 1.0 | 6.7 | GO:0030686 | 90S preribosome(GO:0030686) |
| 0.9 | 77.9 | GO:0000793 | condensed chromosome(GO:0000793) |
| 0.9 | 37.3 | GO:0010494 | cytoplasmic stress granule(GO:0010494) |
| 0.9 | 11.2 | GO:0032433 | filopodium tip(GO:0032433) |
| 0.9 | 4.6 | GO:0032299 | ribonuclease H2 complex(GO:0032299) |
| 0.9 | 8.3 | GO:1990909 | Wnt signalosome(GO:1990909) |
| 0.9 | 3.7 | GO:0097059 | CNTFR-CLCF1 complex(GO:0097059) |
| 0.9 | 7.3 | GO:0005672 | transcription factor TFIIA complex(GO:0005672) |
| 0.9 | 1.8 | GO:0045323 | interleukin-1 receptor complex(GO:0045323) |
| 0.9 | 0.9 | GO:0036194 | muscle cell projection(GO:0036194) muscle cell projection membrane(GO:0036195) |
| 0.9 | 0.9 | GO:1903349 | omegasome membrane(GO:1903349) |
| 0.9 | 4.5 | GO:0005658 | alpha DNA polymerase:primase complex(GO:0005658) |
| 0.9 | 8.1 | GO:0030127 | COPII vesicle coat(GO:0030127) |
| 0.9 | 49.3 | GO:0022627 | cytosolic small ribosomal subunit(GO:0022627) |
| 0.9 | 8.1 | GO:0097550 | transcriptional preinitiation complex(GO:0097550) |
| 0.9 | 8.9 | GO:0016602 | CCAAT-binding factor complex(GO:0016602) |
| 0.9 | 0.9 | GO:0034518 | RNA cap binding complex(GO:0034518) |
| 0.9 | 35.7 | GO:0005844 | polysome(GO:0005844) |
| 0.8 | 35.3 | GO:0045095 | keratin filament(GO:0045095) |
| 0.8 | 2.5 | GO:0097136 | Bcl-2 family protein complex(GO:0097136) |
| 0.8 | 49.6 | GO:0005681 | spliceosomal complex(GO:0005681) |
| 0.8 | 246.7 | GO:0005743 | mitochondrial inner membrane(GO:0005743) |
| 0.8 | 1.6 | GO:0000438 | core TFIIH complex portion of holo TFIIH complex(GO:0000438) |
| 0.8 | 7.4 | GO:0044233 | ER-mitochondrion membrane contact site(GO:0044233) |
| 0.8 | 13.0 | GO:0030663 | COPI-coated vesicle membrane(GO:0030663) |
| 0.8 | 87.4 | GO:0042579 | peroxisome(GO:0005777) microbody(GO:0042579) |
| 0.8 | 8.7 | GO:0005671 | Ada2/Gcn5/Ada3 transcription activator complex(GO:0005671) |
| 0.8 | 5.5 | GO:0005832 | chaperonin-containing T-complex(GO:0005832) |
| 0.8 | 3.9 | GO:0036513 | Derlin-1 retrotranslocation complex(GO:0036513) |
| 0.8 | 14.6 | GO:0045009 | melanosome membrane(GO:0033162) chitosome(GO:0045009) |
| 0.8 | 5.4 | GO:0000930 | gamma-tubulin complex(GO:0000930) |
| 0.8 | 2.3 | GO:0097452 | GAIT complex(GO:0097452) |
| 0.8 | 0.8 | GO:0000788 | nuclear nucleosome(GO:0000788) |
| 0.7 | 3.7 | GO:0001739 | sex chromatin(GO:0001739) |
| 0.7 | 15.6 | GO:0030867 | rough endoplasmic reticulum membrane(GO:0030867) |
| 0.7 | 43.6 | GO:0005643 | nuclear pore(GO:0005643) |
| 0.7 | 36.8 | GO:0000784 | nuclear chromosome, telomeric region(GO:0000784) |
| 0.7 | 14.0 | GO:0005790 | smooth endoplasmic reticulum(GO:0005790) |
| 0.7 | 4.4 | GO:0030688 | preribosome, small subunit precursor(GO:0030688) |
| 0.7 | 3.6 | GO:0000439 | core TFIIH complex(GO:0000439) |
| 0.7 | 2.2 | GO:0030956 | glutamyl-tRNA(Gln) amidotransferase complex(GO:0030956) |
| 0.7 | 6.4 | GO:0002193 | MAML1-RBP-Jkappa- ICN1 complex(GO:0002193) |
| 0.7 | 4.9 | GO:0061574 | ASAP complex(GO:0061574) |
| 0.7 | 6.3 | GO:0035749 | myelin sheath adaxonal region(GO:0035749) |
| 0.7 | 17.4 | GO:0090545 | NuRD complex(GO:0016581) CHD-type complex(GO:0090545) |
| 0.7 | 2.1 | GO:0097414 | glial cytoplasmic inclusion(GO:0097409) classical Lewy body(GO:0097414) Lewy neurite(GO:0097462) Lewy body corona(GO:1990038) |
| 0.7 | 44.2 | GO:0017053 | transcriptional repressor complex(GO:0017053) |
| 0.7 | 17.6 | GO:0031264 | death-inducing signaling complex(GO:0031264) |
| 0.7 | 2.0 | GO:0005592 | collagen type XI trimer(GO:0005592) |
| 0.7 | 2.0 | GO:0001652 | granular component(GO:0001652) |
| 0.7 | 2.0 | GO:0002081 | outer acrosomal membrane(GO:0002081) |
| 0.7 | 14.5 | GO:0031528 | microvillus membrane(GO:0031528) |
| 0.7 | 2.6 | GO:0033553 | rDNA heterochromatin(GO:0033553) |
| 0.6 | 2.6 | GO:0044307 | dendritic branch(GO:0044307) |
| 0.6 | 3.2 | GO:1902937 | inward rectifier potassium channel complex(GO:1902937) |
| 0.6 | 4.4 | GO:0042587 | glycogen granule(GO:0042587) |
| 0.6 | 5.0 | GO:0005786 | signal recognition particle, endoplasmic reticulum targeting(GO:0005786) signal recognition particle(GO:0048500) |
| 0.6 | 2.4 | GO:0005863 | striated muscle myosin thick filament(GO:0005863) |
| 0.6 | 6.6 | GO:0071339 | MLL1/2 complex(GO:0044665) MLL1 complex(GO:0071339) |
| 0.6 | 12.6 | GO:0030122 | AP-2 adaptor complex(GO:0030122) |
| 0.6 | 7.1 | GO:0045239 | tricarboxylic acid cycle enzyme complex(GO:0045239) |
| 0.6 | 1.8 | GO:0005873 | plus-end kinesin complex(GO:0005873) |
| 0.6 | 3.5 | GO:0000153 | cytoplasmic ubiquitin ligase complex(GO:0000153) |
| 0.6 | 7.6 | GO:0030056 | hemidesmosome(GO:0030056) |
| 0.6 | 64.6 | GO:0035578 | azurophil granule lumen(GO:0035578) |
| 0.6 | 6.4 | GO:0005847 | mRNA cleavage and polyadenylation specificity factor complex(GO:0005847) |
| 0.6 | 0.6 | GO:0045179 | apical cortex(GO:0045179) |
| 0.6 | 20.0 | GO:0000118 | histone deacetylase complex(GO:0000118) |
| 0.5 | 4.8 | GO:0035861 | site of double-strand break(GO:0035861) |
| 0.5 | 60.0 | GO:0090575 | RNA polymerase II transcription factor complex(GO:0090575) |
| 0.5 | 2.6 | GO:0097025 | MPP7-DLG1-LIN7 complex(GO:0097025) |
| 0.5 | 6.8 | GO:0035327 | transcriptionally active chromatin(GO:0035327) |
| 0.5 | 1.5 | GO:0031088 | platelet dense granule membrane(GO:0031088) |
| 0.5 | 4.4 | GO:0032059 | bleb(GO:0032059) |
| 0.5 | 5.1 | GO:0000164 | protein phosphatase type 1 complex(GO:0000164) |
| 0.5 | 56.3 | GO:0042470 | melanosome(GO:0042470) pigment granule(GO:0048770) |
| 0.5 | 5.1 | GO:0005833 | hemoglobin complex(GO:0005833) |
| 0.5 | 8.1 | GO:0030057 | desmosome(GO:0030057) |
| 0.5 | 3.2 | GO:0042405 | nuclear inclusion body(GO:0042405) |
| 0.4 | 11.1 | GO:0001891 | phagocytic cup(GO:0001891) |
| 0.4 | 24.4 | GO:0045171 | intercellular bridge(GO:0045171) |
| 0.4 | 0.4 | GO:0032280 | symmetric synapse(GO:0032280) |
| 0.4 | 1.3 | GO:0070195 | growth hormone receptor complex(GO:0070195) |
| 0.4 | 2.6 | GO:0032279 | asymmetric synapse(GO:0032279) |
| 0.4 | 2.1 | GO:0070826 | paraferritin complex(GO:0070826) |
| 0.4 | 0.8 | GO:0030895 | apolipoprotein B mRNA editing enzyme complex(GO:0030895) |
| 0.4 | 6.2 | GO:0008180 | COP9 signalosome(GO:0008180) |
| 0.4 | 3.2 | GO:0072559 | NLRP3 inflammasome complex(GO:0072559) |
| 0.4 | 0.8 | GO:0034657 | GID complex(GO:0034657) |
| 0.4 | 3.6 | GO:0016281 | eukaryotic translation initiation factor 4F complex(GO:0016281) |
| 0.4 | 2.3 | GO:0035867 | alphav-beta3 integrin-IGF-1-IGF1R complex(GO:0035867) |
| 0.4 | 0.8 | GO:0034686 | integrin alphav-beta8 complex(GO:0034686) |
| 0.4 | 11.1 | GO:0000775 | chromosome, centromeric region(GO:0000775) |
| 0.4 | 4.1 | GO:0032045 | guanyl-nucleotide exchange factor complex(GO:0032045) |
| 0.4 | 2.5 | GO:0005851 | eukaryotic translation initiation factor 2B complex(GO:0005851) |
| 0.4 | 3.2 | GO:0097524 | sperm plasma membrane(GO:0097524) |
| 0.3 | 2.1 | GO:0005945 | 6-phosphofructokinase complex(GO:0005945) |
| 0.3 | 6.4 | GO:0098573 | intrinsic component of mitochondrial membrane(GO:0098573) |
| 0.3 | 3.3 | GO:0043240 | Fanconi anaemia nuclear complex(GO:0043240) |
| 0.3 | 1.6 | GO:0031466 | Cul5-RING ubiquitin ligase complex(GO:0031466) |
| 0.3 | 4.8 | GO:0016327 | apicolateral plasma membrane(GO:0016327) |
| 0.3 | 1.0 | GO:0036024 | protein C inhibitor-TMPRSS7 complex(GO:0036024) protein C inhibitor-TMPRSS11E complex(GO:0036025) protein C inhibitor-PLAT complex(GO:0036026) protein C inhibitor-PLAU complex(GO:0036027) protein C inhibitor-thrombin complex(GO:0036028) protein C inhibitor-KLK3 complex(GO:0036029) protein C inhibitor-plasma kallikrein complex(GO:0036030) protease inhibitor complex(GO:0097179) serine protease inhibitor complex(GO:0097180) protein C inhibitor-coagulation factor V complex(GO:0097181) protein C inhibitor-coagulation factor Xa complex(GO:0097182) protein C inhibitor-coagulation factor XI complex(GO:0097183) |
| 0.3 | 13.9 | GO:0005605 | basal lamina(GO:0005605) |
| 0.3 | 45.5 | GO:0031965 | nuclear membrane(GO:0031965) |
| 0.3 | 2.0 | GO:0043196 | varicosity(GO:0043196) |
| 0.3 | 15.1 | GO:0031526 | brush border membrane(GO:0031526) |
| 0.3 | 1.7 | GO:0070554 | synaptobrevin 2-SNAP-25-syntaxin-3-complexin complex(GO:0070554) |
| 0.3 | 1.1 | GO:0043541 | UDP-N-acetylglucosamine transferase complex(GO:0043541) |
| 0.3 | 72.3 | GO:0005759 | mitochondrial matrix(GO:0005759) |
| 0.3 | 2.6 | GO:0070852 | cell body fiber(GO:0070852) |
| 0.3 | 13.7 | GO:0005891 | voltage-gated calcium channel complex(GO:0005891) |
| 0.3 | 1.8 | GO:0008290 | F-actin capping protein complex(GO:0008290) |
| 0.2 | 1.2 | GO:0033018 | sarcoplasmic reticulum lumen(GO:0033018) |
| 0.2 | 10.3 | GO:0019866 | organelle inner membrane(GO:0019866) |
| 0.2 | 0.7 | GO:0033565 | ESCRT-0 complex(GO:0033565) |
| 0.2 | 2.4 | GO:0032040 | small-subunit processome(GO:0032040) |
| 0.2 | 9.2 | GO:0030670 | phagocytic vesicle membrane(GO:0030670) |
| 0.2 | 3.4 | GO:0034045 | pre-autophagosomal structure membrane(GO:0034045) |
| 0.2 | 1.2 | GO:0043291 | RAVE complex(GO:0043291) |
| 0.2 | 1.2 | GO:0031313 | extrinsic component of endosome membrane(GO:0031313) |
| 0.2 | 1.6 | GO:0000127 | transcription factor TFIIIC complex(GO:0000127) |
| 0.2 | 6.2 | GO:0033176 | proton-transporting V-type ATPase complex(GO:0033176) |
| 0.2 | 8.7 | GO:0009925 | basal plasma membrane(GO:0009925) |
| 0.2 | 2.5 | GO:0000815 | ESCRT III complex(GO:0000815) |
| 0.2 | 611.4 | GO:0005654 | nucleoplasm(GO:0005654) |
| 0.2 | 0.4 | GO:0036398 | TCR signalosome(GO:0036398) |
| 0.2 | 3.4 | GO:0005868 | cytoplasmic dynein complex(GO:0005868) |
| 0.2 | 16.5 | GO:0070160 | occluding junction(GO:0070160) |
| 0.2 | 1.1 | GO:0097451 | glial limiting end-foot(GO:0097451) |
| 0.2 | 11.8 | GO:0032580 | Golgi cisterna membrane(GO:0032580) |
| 0.2 | 5.1 | GO:0005892 | acetylcholine-gated channel complex(GO:0005892) |
| 0.2 | 9.7 | GO:0000922 | spindle pole(GO:0000922) |
| 0.2 | 0.7 | GO:0019815 | B cell receptor complex(GO:0019815) |
| 0.2 | 9.0 | GO:0033116 | endoplasmic reticulum-Golgi intermediate compartment membrane(GO:0033116) |
| 0.2 | 0.5 | GO:1990393 | 3M complex(GO:1990393) |
| 0.2 | 7.3 | GO:0036464 | cytoplasmic ribonucleoprotein granule(GO:0036464) |
| 0.2 | 4.2 | GO:0031941 | filamentous actin(GO:0031941) |
| 0.1 | 2.9 | GO:0005921 | gap junction(GO:0005921) |
| 0.1 | 0.8 | GO:0000813 | ESCRT I complex(GO:0000813) |
| 0.1 | 0.3 | GO:0048237 | rough endoplasmic reticulum lumen(GO:0048237) |
| 0.1 | 2.4 | GO:0097381 | photoreceptor disc membrane(GO:0097381) |
| 0.1 | 0.2 | GO:0097539 | ciliary transition fiber(GO:0097539) |
| 0.1 | 0.4 | GO:1902560 | GMP reductase complex(GO:1902560) |
| 0.1 | 0.3 | GO:0035841 | new growing cell tip(GO:0035841) |
| 0.1 | 0.1 | GO:0098536 | deuterosome(GO:0098536) |
| 0.1 | 0.3 | GO:0098554 | cytoplasmic side of endoplasmic reticulum membrane(GO:0098554) |
| 0.1 | 0.5 | GO:0036020 | endolysosome membrane(GO:0036020) |
| 0.0 | 0.1 | GO:0005600 | collagen type XIII trimer(GO:0005600) transmembrane collagen trimer(GO:0030936) |
| 0.0 | 13.7 | GO:0016324 | apical plasma membrane(GO:0016324) |
| 0.0 | 0.1 | GO:0072536 | interleukin-23 receptor complex(GO:0072536) |
| 0.0 | 0.5 | GO:0032391 | photoreceptor connecting cilium(GO:0032391) |
| 0.0 | 0.4 | GO:0017146 | NMDA selective glutamate receptor complex(GO:0017146) |
| 0.0 | 0.1 | GO:0031905 | early endosome lumen(GO:0031905) |
| 0.0 | 0.1 | GO:0071754 | IgM immunoglobulin complex(GO:0071753) IgM immunoglobulin complex, circulating(GO:0071754) pentameric IgM immunoglobulin complex(GO:0071756) |
| 0.0 | 0.1 | GO:0005577 | fibrinogen complex(GO:0005577) |
Gene overrepresentation in molecular function category:
| Log-likelihood per target | Total log-likelihood | Term | Description |
|---|---|---|---|
| 22.2 | 66.7 | GO:0016822 | hydrolase activity, acting on acid carbon-carbon bonds(GO:0016822) hydrolase activity, acting on acid carbon-carbon bonds, in ketonic substances(GO:0016823) |
| 20.9 | 62.8 | GO:0004165 | dodecenoyl-CoA delta-isomerase activity(GO:0004165) |
| 20.2 | 101.2 | GO:0047179 | platelet-activating factor acetyltransferase activity(GO:0047179) |
| 15.4 | 61.7 | GO:0044378 | non-sequence-specific DNA binding, bending(GO:0044378) |
| 14.6 | 43.7 | GO:0015142 | citrate transmembrane transporter activity(GO:0015137) tricarboxylic acid transmembrane transporter activity(GO:0015142) |
| 12.5 | 37.4 | GO:0004639 | phosphoribosylaminoimidazole carboxylase activity(GO:0004638) phosphoribosylaminoimidazolesuccinocarboxamide synthase activity(GO:0004639) |
| 12.4 | 49.7 | GO:0004074 | biliverdin reductase activity(GO:0004074) |
| 11.8 | 47.3 | GO:0001512 | dihydronicotinamide riboside quinone reductase activity(GO:0001512) melatonin binding(GO:1904408) |
| 11.8 | 35.4 | GO:0003974 | UDP-N-acetylglucosamine 4-epimerase activity(GO:0003974) UDP-glucose 4-epimerase activity(GO:0003978) |
| 11.5 | 34.4 | GO:0004998 | transferrin receptor activity(GO:0004998) |
| 10.7 | 32.2 | GO:0047315 | kynurenine-glyoxylate transaminase activity(GO:0047315) |
| 10.5 | 31.5 | GO:0098808 | mRNA cap binding(GO:0098808) |
| 10.1 | 70.9 | GO:0061133 | endopeptidase activator activity(GO:0061133) |
| 10.1 | 40.5 | GO:0000213 | tRNA-intron endonuclease activity(GO:0000213) |
| 10.1 | 30.2 | GO:0070991 | medium-chain-acyl-CoA dehydrogenase activity(GO:0070991) |
| 8.8 | 35.4 | GO:0071208 | histone pre-mRNA DCP binding(GO:0071208) |
| 8.7 | 52.0 | GO:0061575 | cyclin-dependent protein serine/threonine kinase activator activity(GO:0061575) |
| 8.6 | 25.7 | GO:0004047 | aminomethyltransferase activity(GO:0004047) |
| 8.4 | 25.2 | GO:0004450 | isocitrate dehydrogenase (NADP+) activity(GO:0004450) |
| 8.1 | 32.4 | GO:0004146 | dihydrofolate reductase activity(GO:0004146) |
| 7.9 | 23.8 | GO:0016784 | 3-mercaptopyruvate sulfurtransferase activity(GO:0016784) |
| 7.8 | 46.8 | GO:0051996 | farnesyl-diphosphate farnesyltransferase activity(GO:0004310) squalene synthase activity(GO:0051996) |
| 7.7 | 54.1 | GO:0034513 | box H/ACA snoRNA binding(GO:0034513) |
| 7.7 | 46.0 | GO:0044020 | histone methyltransferase activity (H4-R3 specific)(GO:0044020) |
| 7.6 | 22.7 | GO:0004132 | dCMP deaminase activity(GO:0004132) |
| 7.4 | 37.2 | GO:0008332 | low voltage-gated calcium channel activity(GO:0008332) |
| 7.3 | 21.8 | GO:0030337 | DNA polymerase processivity factor activity(GO:0030337) |
| 7.2 | 28.8 | GO:0004360 | glutamine-fructose-6-phosphate transaminase (isomerizing) activity(GO:0004360) |
| 7.2 | 21.6 | GO:0004170 | dUTP diphosphatase activity(GO:0004170) |
| 7.1 | 28.6 | GO:0016728 | ribonucleoside-diphosphate reductase activity, thioredoxin disulfide as acceptor(GO:0004748) oxidoreductase activity, acting on CH or CH2 groups, disulfide as acceptor(GO:0016728) ribonucleoside-diphosphate reductase activity(GO:0061731) |
| 7.0 | 28.0 | GO:0032767 | copper-dependent protein binding(GO:0032767) |
| 6.9 | 41.7 | GO:0004749 | ribose phosphate diphosphokinase activity(GO:0004749) |
| 6.8 | 27.1 | GO:0004001 | adenosine kinase activity(GO:0004001) |
| 6.2 | 62.0 | GO:0070883 | pre-miRNA binding(GO:0070883) |
| 6.2 | 24.8 | GO:0036310 | annealing helicase activity(GO:0036310) annealing activity(GO:0097617) |
| 6.2 | 18.5 | GO:0000247 | C-8 sterol isomerase activity(GO:0000247) |
| 6.1 | 18.2 | GO:0005046 | KDEL sequence binding(GO:0005046) |
| 6.0 | 18.1 | GO:0008426 | protein kinase C inhibitor activity(GO:0008426) |
| 5.8 | 46.4 | GO:0034604 | pyruvate dehydrogenase activity(GO:0004738) pyruvate dehydrogenase [NAD(P)+] activity(GO:0034603) pyruvate dehydrogenase (NAD+) activity(GO:0034604) |
| 5.8 | 17.4 | GO:0098809 | oxidoreductase activity, acting on other nitrogenous compounds as donors, cytochrome as acceptor(GO:0016662) nitrite reductase (NO-forming) activity(GO:0050421) carbon monoxide binding(GO:0070025) nitrite reductase activity(GO:0098809) |
| 5.6 | 22.2 | GO:0003883 | CTP synthase activity(GO:0003883) |
| 5.4 | 21.8 | GO:0008177 | succinate dehydrogenase (ubiquinone) activity(GO:0008177) |
| 5.4 | 10.8 | GO:0016418 | S-acetyltransferase activity(GO:0016418) |
| 5.4 | 26.8 | GO:0047134 | protein-disulfide reductase activity(GO:0047134) |
| 5.3 | 26.7 | GO:0043141 | ATP-dependent 5'-3' DNA helicase activity(GO:0043141) |
| 5.3 | 10.7 | GO:0004122 | cystathionine beta-synthase activity(GO:0004122) |
| 5.3 | 15.9 | GO:1990050 | phosphatidic acid transporter activity(GO:1990050) |
| 5.2 | 21.0 | GO:0070644 | vitamin D response element binding(GO:0070644) |
| 5.2 | 15.6 | GO:0042947 | glucoside transmembrane transporter activity(GO:0042947) |
| 5.1 | 15.4 | GO:0004766 | spermidine synthase activity(GO:0004766) |
| 5.1 | 30.7 | GO:0034186 | apolipoprotein A-I binding(GO:0034186) |
| 5.0 | 55.3 | GO:0001135 | transcription factor activity, RNA polymerase II transcription factor recruiting(GO:0001135) |
| 4.9 | 14.7 | GO:0050613 | delta14-sterol reductase activity(GO:0050613) |
| 4.8 | 29.0 | GO:0019238 | cyclohydrolase activity(GO:0019238) |
| 4.7 | 14.2 | GO:0004730 | pseudouridylate synthase activity(GO:0004730) |
| 4.7 | 37.6 | GO:0015288 | porin activity(GO:0015288) |
| 4.6 | 27.7 | GO:0008732 | glycine hydroxymethyltransferase activity(GO:0004372) threonine aldolase activity(GO:0004793) L-allo-threonine aldolase activity(GO:0008732) |
| 4.6 | 50.2 | GO:0047429 | nucleoside-triphosphate diphosphatase activity(GO:0047429) |
| 4.5 | 40.7 | GO:1990226 | histone methyltransferase binding(GO:1990226) |
| 4.5 | 36.2 | GO:0004634 | phosphopyruvate hydratase activity(GO:0004634) |
| 4.5 | 13.4 | GO:0003918 | DNA topoisomerase type II (ATP-hydrolyzing) activity(GO:0003918) DNA topoisomerase II activity(GO:0061505) |
| 4.4 | 30.8 | GO:0016403 | dimethylargininase activity(GO:0016403) |
| 4.3 | 21.4 | GO:0008469 | histone-arginine N-methyltransferase activity(GO:0008469) |
| 4.2 | 25.4 | GO:0043023 | ribosomal large subunit binding(GO:0043023) |
| 4.2 | 25.3 | GO:0004735 | pyrroline-5-carboxylate reductase activity(GO:0004735) |
| 4.2 | 50.6 | GO:0004526 | ribonuclease P activity(GO:0004526) |
| 4.2 | 74.9 | GO:0004535 | poly(A)-specific ribonuclease activity(GO:0004535) |
| 4.1 | 99.5 | GO:0070628 | proteasome binding(GO:0070628) |
| 4.1 | 16.4 | GO:0002060 | purine nucleobase binding(GO:0002060) |
| 4.1 | 28.4 | GO:0010997 | anaphase-promoting complex binding(GO:0010997) |
| 4.0 | 12.1 | GO:0004357 | glutamate-cysteine ligase activity(GO:0004357) |
| 4.0 | 20.2 | GO:0042296 | ISG15 transferase activity(GO:0042296) |
| 4.0 | 16.1 | GO:1990189 | peptide-serine-N-acetyltransferase activity(GO:1990189) |
| 4.0 | 12.0 | GO:0004613 | phosphoenolpyruvate carboxykinase activity(GO:0004611) phosphoenolpyruvate carboxykinase (GTP) activity(GO:0004613) |
| 4.0 | 12.0 | GO:0004616 | phosphogluconate dehydrogenase (decarboxylating) activity(GO:0004616) |
| 4.0 | 190.0 | GO:0031492 | nucleosomal DNA binding(GO:0031492) |
| 3.9 | 23.6 | GO:0043138 | 3'-5' DNA helicase activity(GO:0043138) |
| 3.9 | 31.2 | GO:0008379 | thioredoxin peroxidase activity(GO:0008379) |
| 3.9 | 15.5 | GO:0003938 | IMP dehydrogenase activity(GO:0003938) |
| 3.9 | 11.6 | GO:0004345 | glucose-6-phosphate dehydrogenase activity(GO:0004345) |
| 3.9 | 30.9 | GO:0050833 | pyruvate transmembrane transporter activity(GO:0050833) |
| 3.8 | 19.2 | GO:1990460 | leptin receptor binding(GO:1990460) |
| 3.8 | 34.4 | GO:0036402 | proteasome-activating ATPase activity(GO:0036402) |
| 3.8 | 7.6 | GO:0008330 | protein tyrosine/threonine phosphatase activity(GO:0008330) |
| 3.8 | 34.3 | GO:0033592 | RNA strand annealing activity(GO:0033592) |
| 3.8 | 15.2 | GO:0061656 | SUMO conjugating enzyme activity(GO:0061656) |
| 3.8 | 11.3 | GO:0071535 | RING-like zinc finger domain binding(GO:0071535) |
| 3.8 | 146.6 | GO:0008143 | poly(A) binding(GO:0008143) |
| 3.7 | 11.2 | GO:0010698 | acetyltransferase activator activity(GO:0010698) |
| 3.7 | 22.2 | GO:0042392 | sphingosine-1-phosphate phosphatase activity(GO:0042392) |
| 3.7 | 14.8 | GO:0015119 | hexose phosphate transmembrane transporter activity(GO:0015119) organophosphate:inorganic phosphate antiporter activity(GO:0015315) hexose-phosphate:inorganic phosphate antiporter activity(GO:0015526) glucose 6-phosphate:inorganic phosphate antiporter activity(GO:0061513) |
| 3.7 | 11.0 | GO:0003860 | 3-hydroxyisobutyryl-CoA hydrolase activity(GO:0003860) |
| 3.6 | 36.5 | GO:0097100 | supercoiled DNA binding(GO:0097100) |
| 3.6 | 72.8 | GO:0005337 | nucleoside transmembrane transporter activity(GO:0005337) |
| 3.6 | 29.0 | GO:1990825 | sequence-specific mRNA binding(GO:1990825) |
| 3.6 | 25.3 | GO:0046912 | transferase activity, transferring acyl groups, acyl groups converted into alkyl on transfer(GO:0046912) |
| 3.6 | 36.0 | GO:0070087 | chromo shadow domain binding(GO:0070087) |
| 3.6 | 10.7 | GO:0009041 | uridylate kinase activity(GO:0009041) |
| 3.5 | 10.6 | GO:0000252 | C-3 sterol dehydrogenase (C-4 sterol decarboxylase) activity(GO:0000252) sterol-4-alpha-carboxylate 3-dehydrogenase (decarboxylating) activity(GO:0047012) |
| 3.5 | 10.6 | GO:0043739 | G/U mismatch-specific uracil-DNA glycosylase activity(GO:0043739) |
| 3.5 | 56.5 | GO:1901612 | cardiolipin binding(GO:1901612) |
| 3.5 | 14.1 | GO:0070363 | mitochondrial light strand promoter sense binding(GO:0070363) |
| 3.5 | 10.5 | GO:0043035 | chromatin insulator sequence binding(GO:0043035) |
| 3.5 | 45.0 | GO:0004726 | non-membrane spanning protein tyrosine phosphatase activity(GO:0004726) |
| 3.4 | 20.5 | GO:0019237 | centromeric DNA binding(GO:0019237) |
| 3.4 | 40.8 | GO:0097157 | pre-mRNA intronic binding(GO:0097157) |
| 3.4 | 16.8 | GO:0050220 | prostaglandin-E synthase activity(GO:0050220) |
| 3.4 | 20.1 | GO:0004301 | epoxide hydrolase activity(GO:0004301) |
| 3.3 | 53.6 | GO:0001054 | RNA polymerase I activity(GO:0001054) |
| 3.3 | 30.0 | GO:0017176 | phosphatidylinositol N-acetylglucosaminyltransferase activity(GO:0017176) |
| 3.3 | 10.0 | GO:0000064 | L-ornithine transmembrane transporter activity(GO:0000064) |
| 3.3 | 99.3 | GO:0042288 | MHC class I protein binding(GO:0042288) |
| 3.3 | 13.2 | GO:0004142 | diacylglycerol cholinephosphotransferase activity(GO:0004142) |
| 3.2 | 12.8 | GO:0004306 | ethanolamine-phosphate cytidylyltransferase activity(GO:0004306) |
| 3.2 | 22.3 | GO:0032217 | riboflavin transporter activity(GO:0032217) |
| 3.1 | 12.6 | GO:0035402 | histone kinase activity (H3-T11 specific)(GO:0035402) |
| 3.1 | 9.3 | GO:0070336 | flap-structured DNA binding(GO:0070336) |
| 3.0 | 9.1 | GO:0045131 | pre-mRNA branch point binding(GO:0045131) |
| 3.0 | 9.1 | GO:0080101 | phosphatidyl-N-methylethanolamine N-methyltransferase activity(GO:0000773) phosphatidylethanolamine N-methyltransferase activity(GO:0004608) phosphatidyl-N-dimethylethanolamine N-methyltransferase activity(GO:0080101) |
| 3.0 | 21.1 | GO:0019788 | NEDD8 transferase activity(GO:0019788) |
| 3.0 | 20.9 | GO:0051575 | 5'-deoxyribose-5-phosphate lyase activity(GO:0051575) |
| 2.9 | 14.7 | GO:0047844 | deoxycytidine deaminase activity(GO:0047844) |
| 2.9 | 5.8 | GO:0016401 | palmitoyl-CoA oxidase activity(GO:0016401) |
| 2.9 | 2.9 | GO:0004045 | aminoacyl-tRNA hydrolase activity(GO:0004045) |
| 2.9 | 14.4 | GO:0032143 | single thymine insertion binding(GO:0032143) |
| 2.9 | 28.8 | GO:1990948 | ligase inhibitor activity(GO:0055104) ubiquitin ligase inhibitor activity(GO:1990948) |
| 2.9 | 28.6 | GO:0042975 | peroxisome proliferator activated receptor binding(GO:0042975) |
| 2.9 | 79.9 | GO:0070577 | lysine-acetylated histone binding(GO:0070577) |
| 2.8 | 19.9 | GO:0004514 | nicotinate-nucleotide diphosphorylase (carboxylating) activity(GO:0004514) |
| 2.8 | 14.0 | GO:0004161 | dimethylallyltranstransferase activity(GO:0004161) geranyltranstransferase activity(GO:0004337) |
| 2.8 | 36.2 | GO:0000774 | adenyl-nucleotide exchange factor activity(GO:0000774) |
| 2.8 | 8.3 | GO:0004056 | argininosuccinate lyase activity(GO:0004056) |
| 2.8 | 8.3 | GO:0000400 | four-way junction DNA binding(GO:0000400) |
| 2.8 | 38.6 | GO:0031386 | protein tag(GO:0031386) |
| 2.7 | 13.6 | GO:0030620 | U2 snRNA binding(GO:0030620) |
| 2.7 | 2.7 | GO:0004549 | tRNA-specific ribonuclease activity(GO:0004549) |
| 2.7 | 121.0 | GO:0061631 | ubiquitin conjugating enzyme activity(GO:0061631) |
| 2.7 | 8.0 | GO:0004534 | 5'-3' exoribonuclease activity(GO:0004534) |
| 2.7 | 2.7 | GO:0015181 | arginine transmembrane transporter activity(GO:0015181) |
| 2.6 | 7.9 | GO:0008988 | rRNA (adenine-N6-)-methyltransferase activity(GO:0008988) |
| 2.6 | 34.3 | GO:0003857 | 3-hydroxyacyl-CoA dehydrogenase activity(GO:0003857) |
| 2.6 | 7.8 | GO:0010521 | telomerase inhibitor activity(GO:0010521) |
| 2.6 | 5.2 | GO:0004792 | thiosulfate sulfurtransferase activity(GO:0004792) |
| 2.6 | 5.2 | GO:0017057 | 6-phosphogluconolactonase activity(GO:0017057) |
| 2.6 | 2.6 | GO:0004307 | ethanolaminephosphotransferase activity(GO:0004307) |
| 2.6 | 46.3 | GO:0017070 | U6 snRNA binding(GO:0017070) |
| 2.5 | 25.3 | GO:0010859 | calcium-dependent cysteine-type endopeptidase inhibitor activity(GO:0010859) |
| 2.5 | 7.6 | GO:0008523 | sodium-dependent multivitamin transmembrane transporter activity(GO:0008523) |
| 2.5 | 10.1 | GO:0043515 | kinetochore binding(GO:0043515) |
| 2.5 | 17.6 | GO:0015450 | P-P-bond-hydrolysis-driven protein transmembrane transporter activity(GO:0015450) |
| 2.5 | 10.0 | GO:0033897 | ribonuclease T2 activity(GO:0033897) |
| 2.5 | 27.4 | GO:0016861 | intramolecular oxidoreductase activity, interconverting aldoses and ketoses(GO:0016861) |
| 2.5 | 14.7 | GO:0004839 | ubiquitin activating enzyme activity(GO:0004839) |
| 2.5 | 19.6 | GO:0015349 | thyroid hormone transmembrane transporter activity(GO:0015349) |
| 2.4 | 39.1 | GO:0097602 | cullin family protein binding(GO:0097602) |
| 2.4 | 75.5 | GO:0004003 | ATP-dependent DNA helicase activity(GO:0004003) |
| 2.4 | 19.4 | GO:0086083 | cell adhesive protein binding involved in bundle of His cell-Purkinje myocyte communication(GO:0086083) |
| 2.4 | 7.3 | GO:0031403 | lithium ion binding(GO:0031403) |
| 2.4 | 7.2 | GO:0043139 | 5'-3' DNA helicase activity(GO:0043139) |
| 2.4 | 12.0 | GO:0016744 | transferase activity, transferring aldehyde or ketonic groups(GO:0016744) |
| 2.4 | 9.5 | GO:0070180 | large ribosomal subunit rRNA binding(GO:0070180) |
| 2.4 | 26.0 | GO:0001075 | transcription factor activity, RNA polymerase II core promoter sequence-specific binding involved in preinitiation complex assembly(GO:0001075) |
| 2.4 | 25.9 | GO:0005049 | nuclear export signal receptor activity(GO:0005049) |
| 2.3 | 9.4 | GO:0000026 | alpha-1,2-mannosyltransferase activity(GO:0000026) |
| 2.3 | 18.4 | GO:0001055 | RNA polymerase II activity(GO:0001055) |
| 2.3 | 9.2 | GO:0004466 | long-chain-acyl-CoA dehydrogenase activity(GO:0004466) |
| 2.3 | 16.1 | GO:0009982 | pseudouridine synthase activity(GO:0009982) |
| 2.3 | 63.4 | GO:0003887 | DNA-directed DNA polymerase activity(GO:0003887) |
| 2.3 | 42.9 | GO:0051537 | 2 iron, 2 sulfur cluster binding(GO:0051537) |
| 2.2 | 4.5 | GO:0016774 | phosphotransferase activity, carboxyl group as acceptor(GO:0016774) |
| 2.2 | 22.1 | GO:1904264 | ubiquitin protein ligase activity involved in ERAD pathway(GO:1904264) |
| 2.2 | 15.4 | GO:0008934 | inositol monophosphate 1-phosphatase activity(GO:0008934) inositol monophosphate 3-phosphatase activity(GO:0052832) inositol monophosphate 4-phosphatase activity(GO:0052833) inositol monophosphate phosphatase activity(GO:0052834) |
| 2.2 | 6.6 | GO:0004758 | serine C-palmitoyltransferase activity(GO:0004758) C-palmitoyltransferase activity(GO:0016454) |
| 2.2 | 15.2 | GO:0003689 | DNA clamp loader activity(GO:0003689) protein-DNA loading ATPase activity(GO:0033170) |
| 2.2 | 6.5 | GO:0051920 | peroxiredoxin activity(GO:0051920) |
| 2.2 | 2.2 | GO:0032558 | adenyl deoxyribonucleotide binding(GO:0032558) dATP binding(GO:0032564) |
| 2.1 | 4.3 | GO:0008263 | pyrimidine-specific mismatch base pair DNA N-glycosylase activity(GO:0008263) |
| 2.1 | 2.1 | GO:0004694 | eukaryotic translation initiation factor 2alpha kinase activity(GO:0004694) |
| 2.1 | 14.8 | GO:0004844 | uracil DNA N-glycosylase activity(GO:0004844) deaminated base DNA N-glycosylase activity(GO:0097506) |
| 2.1 | 12.7 | GO:0070513 | death domain binding(GO:0070513) |
| 2.1 | 10.6 | GO:0008073 | ornithine decarboxylase inhibitor activity(GO:0008073) |
| 2.1 | 10.6 | GO:0031871 | proteinase activated receptor binding(GO:0031871) |
| 2.1 | 14.8 | GO:0035613 | RNA stem-loop binding(GO:0035613) |
| 2.1 | 6.3 | GO:0017077 | oxidative phosphorylation uncoupler activity(GO:0017077) |
| 2.1 | 12.5 | GO:0071532 | ankyrin repeat binding(GO:0071532) |
| 2.1 | 8.3 | GO:0008508 | bile acid:sodium symporter activity(GO:0008508) |
| 2.1 | 12.4 | GO:0015166 | polyol transmembrane transporter activity(GO:0015166) |
| 2.1 | 10.3 | GO:0043183 | vascular endothelial growth factor receptor 1 binding(GO:0043183) |
| 2.1 | 22.6 | GO:0098599 | palmitoyl-(protein) hydrolase activity(GO:0008474) palmitoyl hydrolase activity(GO:0098599) |
| 2.1 | 10.3 | GO:0003988 | acetyl-CoA C-acyltransferase activity(GO:0003988) |
| 2.0 | 61.5 | GO:0017056 | structural constituent of nuclear pore(GO:0017056) |
| 2.0 | 57.1 | GO:0070003 | threonine-type endopeptidase activity(GO:0004298) threonine-type peptidase activity(GO:0070003) |
| 2.0 | 6.1 | GO:0033981 | D-dopachrome decarboxylase activity(GO:0033981) |
| 2.0 | 6.1 | GO:0015140 | malate transmembrane transporter activity(GO:0015140) |
| 2.0 | 48.2 | GO:0003899 | DNA-directed RNA polymerase activity(GO:0003899) |
| 2.0 | 2.0 | GO:0034648 | histone demethylase activity (H3-dimethyl-K4 specific)(GO:0034648) |
| 2.0 | 12.0 | GO:0017150 | tRNA dihydrouridine synthase activity(GO:0017150) |
| 2.0 | 6.0 | GO:0036033 | mediator complex binding(GO:0036033) |
| 2.0 | 29.6 | GO:0015245 | fatty acid transporter activity(GO:0015245) |
| 2.0 | 7.9 | GO:0032810 | sterol response element binding(GO:0032810) |
| 2.0 | 29.5 | GO:0016884 | carbon-nitrogen ligase activity, with glutamine as amido-N-donor(GO:0016884) |
| 2.0 | 2.0 | GO:0032407 | MutSalpha complex binding(GO:0032407) |
| 2.0 | 7.8 | GO:0004853 | uroporphyrinogen decarboxylase activity(GO:0004853) |
| 1.9 | 58.5 | GO:0008157 | protein phosphatase 1 binding(GO:0008157) |
| 1.9 | 29.2 | GO:0000175 | 3'-5'-exoribonuclease activity(GO:0000175) |
| 1.9 | 17.4 | GO:0043024 | ribosomal small subunit binding(GO:0043024) |
| 1.9 | 32.6 | GO:0015037 | peptide disulfide oxidoreductase activity(GO:0015037) |
| 1.9 | 26.7 | GO:0031014 | troponin T binding(GO:0031014) |
| 1.9 | 11.3 | GO:0019826 | oxygen sensor activity(GO:0019826) |
| 1.9 | 1.9 | GO:0000104 | succinate dehydrogenase activity(GO:0000104) |
| 1.9 | 15.0 | GO:0003910 | DNA ligase (ATP) activity(GO:0003910) |
| 1.9 | 7.5 | GO:0043274 | phospholipase binding(GO:0043274) |
| 1.9 | 11.3 | GO:0016863 | intramolecular oxidoreductase activity, transposing C=C bonds(GO:0016863) |
| 1.9 | 16.8 | GO:0036042 | long-chain fatty acyl-CoA binding(GO:0036042) |
| 1.9 | 5.6 | GO:0005459 | UDP-galactose transmembrane transporter activity(GO:0005459) |
| 1.9 | 7.4 | GO:0035184 | histone threonine kinase activity(GO:0035184) |
| 1.8 | 5.5 | GO:0034046 | poly(G) binding(GO:0034046) |
| 1.8 | 12.8 | GO:0001225 | RNA polymerase II transcription coactivator binding(GO:0001225) |
| 1.8 | 7.3 | GO:0051734 | ATP-dependent polydeoxyribonucleotide 5'-hydroxyl-kinase activity(GO:0046404) polydeoxyribonucleotide kinase activity(GO:0051733) ATP-dependent polynucleotide kinase activity(GO:0051734) |
| 1.8 | 21.8 | GO:0003688 | DNA replication origin binding(GO:0003688) |
| 1.8 | 7.3 | GO:0015307 | drug:proton antiporter activity(GO:0015307) |
| 1.8 | 7.3 | GO:0042799 | histone methyltransferase activity (H4-K20 specific)(GO:0042799) |
| 1.8 | 17.9 | GO:0005487 | nucleocytoplasmic transporter activity(GO:0005487) |
| 1.8 | 14.3 | GO:0001222 | transcription corepressor binding(GO:0001222) |
| 1.8 | 14.3 | GO:0018812 | 3-hydroxyacyl-CoA dehydratase activity(GO:0018812) |
| 1.8 | 28.4 | GO:0009931 | calcium-dependent protein serine/threonine kinase activity(GO:0009931) |
| 1.8 | 24.7 | GO:0046976 | histone methyltransferase activity (H3-K27 specific)(GO:0046976) |
| 1.8 | 14.1 | GO:0003726 | double-stranded RNA adenosine deaminase activity(GO:0003726) |
| 1.8 | 5.3 | GO:0031753 | endothelial differentiation G-protein coupled receptor binding(GO:0031753) Edg-2 lysophosphatidic acid receptor binding(GO:0031755) |
| 1.8 | 5.3 | GO:0000014 | single-stranded DNA endodeoxyribonuclease activity(GO:0000014) |
| 1.8 | 8.8 | GO:0038025 | reelin receptor activity(GO:0038025) |
| 1.8 | 14.0 | GO:0050733 | RS domain binding(GO:0050733) |
| 1.7 | 8.7 | GO:0004809 | tRNA (guanine-N2-)-methyltransferase activity(GO:0004809) |
| 1.7 | 13.9 | GO:0004485 | methylcrotonoyl-CoA carboxylase activity(GO:0004485) |
| 1.7 | 17.1 | GO:0001094 | TFIID-class transcription factor binding(GO:0001094) |
| 1.7 | 18.6 | GO:0033691 | sialic acid binding(GO:0033691) |
| 1.7 | 6.8 | GO:0004335 | galactokinase activity(GO:0004335) |
| 1.7 | 8.3 | GO:0061649 | ubiquitinated histone binding(GO:0061649) |
| 1.7 | 339.5 | GO:0003735 | structural constituent of ribosome(GO:0003735) |
| 1.7 | 102.5 | GO:0003743 | translation initiation factor activity(GO:0003743) |
| 1.6 | 37.8 | GO:0048156 | tau protein binding(GO:0048156) |
| 1.6 | 8.1 | GO:0008641 | small protein activating enzyme activity(GO:0008641) |
| 1.6 | 1.6 | GO:0002134 | pyrimidine nucleoside binding(GO:0001884) UTP binding(GO:0002134) pyrimidine ribonucleoside binding(GO:0032551) |
| 1.6 | 9.7 | GO:0004594 | pantothenate kinase activity(GO:0004594) |
| 1.6 | 3.2 | GO:0070717 | poly-purine tract binding(GO:0070717) |
| 1.6 | 44.2 | GO:0070064 | proline-rich region binding(GO:0070064) |
| 1.6 | 4.7 | GO:0034512 | box C/D snoRNA binding(GO:0034512) |
| 1.6 | 6.3 | GO:0050815 | phosphoserine binding(GO:0050815) |
| 1.6 | 6.3 | GO:0052901 | polyamine oxidase activity(GO:0046592) spermine:oxygen oxidoreductase (spermidine-forming) activity(GO:0052901) |
| 1.6 | 11.0 | GO:0005497 | androgen binding(GO:0005497) |
| 1.6 | 7.8 | GO:0070576 | vitamin D 24-hydroxylase activity(GO:0070576) |
| 1.5 | 4.6 | GO:0071987 | WD40-repeat domain binding(GO:0071987) |
| 1.5 | 10.7 | GO:0001849 | complement component C1q binding(GO:0001849) |
| 1.5 | 7.6 | GO:0010340 | carboxyl-O-methyltransferase activity(GO:0010340) protein carboxyl O-methyltransferase activity(GO:0051998) |
| 1.5 | 1.5 | GO:0034739 | histone deacetylase activity (H4-K16 specific)(GO:0034739) |
| 1.5 | 3.0 | GO:0051717 | inositol-1,3,4,5-tetrakisphosphate 3-phosphatase activity(GO:0051717) |
| 1.5 | 9.0 | GO:0016886 | ligase activity, forming phosphoric ester bonds(GO:0016886) |
| 1.5 | 7.5 | GO:0033857 | diphosphoinositol-pentakisphosphate kinase activity(GO:0033857) |
| 1.5 | 15.0 | GO:0001162 | RNA polymerase II intronic transcription regulatory region sequence-specific DNA binding(GO:0001162) |
| 1.5 | 232.9 | GO:0042393 | histone binding(GO:0042393) |
| 1.5 | 8.8 | GO:0003886 | DNA (cytosine-5-)-methyltransferase activity(GO:0003886) |
| 1.5 | 2.9 | GO:0036137 | kynurenine-oxoglutarate transaminase activity(GO:0016212) kynurenine aminotransferase activity(GO:0036137) |
| 1.5 | 16.1 | GO:0035173 | histone kinase activity(GO:0035173) |
| 1.4 | 15.9 | GO:0004128 | cytochrome-b5 reductase activity, acting on NAD(P)H(GO:0004128) |
| 1.4 | 17.3 | GO:0070034 | telomerase RNA binding(GO:0070034) |
| 1.4 | 4.3 | GO:0001665 | alpha-N-acetylgalactosaminide alpha-2,6-sialyltransferase activity(GO:0001665) |
| 1.4 | 4.3 | GO:0016531 | metallochaperone activity(GO:0016530) copper chaperone activity(GO:0016531) |
| 1.4 | 11.4 | GO:0000340 | RNA 7-methylguanosine cap binding(GO:0000340) |
| 1.4 | 39.5 | GO:0004407 | histone deacetylase activity(GO:0004407) |
| 1.4 | 1.4 | GO:0000702 | oxidized base lesion DNA N-glycosylase activity(GO:0000702) oxidized purine nucleobase lesion DNA N-glycosylase activity(GO:0008534) |
| 1.4 | 23.7 | GO:0043495 | protein anchor(GO:0043495) |
| 1.4 | 22.3 | GO:0016004 | phospholipase activator activity(GO:0016004) |
| 1.4 | 8.4 | GO:0008853 | exodeoxyribonuclease III activity(GO:0008853) |
| 1.4 | 4.2 | GO:0004563 | beta-N-acetylhexosaminidase activity(GO:0004563) |
| 1.4 | 8.3 | GO:0050291 | sphingosine N-acyltransferase activity(GO:0050291) |
| 1.4 | 19.3 | GO:0031491 | nucleosome binding(GO:0031491) |
| 1.4 | 41.3 | GO:0070410 | co-SMAD binding(GO:0070410) |
| 1.4 | 12.4 | GO:0089720 | caspase binding(GO:0089720) |
| 1.4 | 2.7 | GO:0043142 | single-stranded DNA-dependent ATPase activity(GO:0043142) |
| 1.4 | 2.7 | GO:0048256 | flap endonuclease activity(GO:0048256) |
| 1.4 | 4.1 | GO:0004582 | dolichyl-phosphate beta-D-mannosyltransferase activity(GO:0004582) |
| 1.4 | 2.7 | GO:0044547 | DNA topoisomerase binding(GO:0044547) |
| 1.4 | 5.4 | GO:1990381 | ubiquitin-specific protease binding(GO:1990381) |
| 1.4 | 4.1 | GO:0004566 | beta-glucuronidase activity(GO:0004566) |
| 1.4 | 8.1 | GO:0004849 | uridine kinase activity(GO:0004849) |
| 1.4 | 5.4 | GO:0004102 | choline O-acetyltransferase activity(GO:0004102) |
| 1.3 | 31.0 | GO:0016628 | oxidoreductase activity, acting on the CH-CH group of donors, NAD or NADP as acceptor(GO:0016628) |
| 1.3 | 1.3 | GO:0008174 | mRNA methyltransferase activity(GO:0008174) |
| 1.3 | 28.0 | GO:0005385 | zinc ion transmembrane transporter activity(GO:0005385) |
| 1.3 | 3.9 | GO:0071074 | eukaryotic initiation factor eIF2 binding(GO:0071074) |
| 1.3 | 3.9 | GO:0005010 | insulin-like growth factor-activated receptor activity(GO:0005010) |
| 1.3 | 3.9 | GO:0033699 | DNA 5'-adenosine monophosphate hydrolase activity(GO:0033699) |
| 1.3 | 6.4 | GO:0052655 | branched-chain-amino-acid transaminase activity(GO:0004084) L-leucine transaminase activity(GO:0052654) L-valine transaminase activity(GO:0052655) L-isoleucine transaminase activity(GO:0052656) |
| 1.3 | 30.7 | GO:0098641 | cadherin binding involved in cell-cell adhesion(GO:0098641) |
| 1.3 | 5.1 | GO:0003923 | GPI-anchor transamidase activity(GO:0003923) |
| 1.3 | 7.6 | GO:0004300 | enoyl-CoA hydratase activity(GO:0004300) |
| 1.2 | 3.7 | GO:0004382 | guanosine-diphosphatase activity(GO:0004382) |
| 1.2 | 7.4 | GO:0016842 | amidine-lyase activity(GO:0016842) |
| 1.2 | 4.9 | GO:0004439 | phosphatidylinositol-4,5-bisphosphate 5-phosphatase activity(GO:0004439) |
| 1.2 | 7.3 | GO:0008190 | eukaryotic initiation factor 4E binding(GO:0008190) |
| 1.2 | 82.0 | GO:0004177 | aminopeptidase activity(GO:0004177) |
| 1.2 | 8.4 | GO:0004459 | lactate dehydrogenase activity(GO:0004457) L-lactate dehydrogenase activity(GO:0004459) |
| 1.2 | 3.6 | GO:0005519 | cytoskeletal regulatory protein binding(GO:0005519) |
| 1.2 | 8.4 | GO:0008454 | alpha-1,3-mannosylglycoprotein 4-beta-N-acetylglucosaminyltransferase activity(GO:0008454) |
| 1.2 | 21.3 | GO:0044183 | protein binding involved in protein folding(GO:0044183) |
| 1.2 | 7.1 | GO:0032453 | histone demethylase activity (H3-K4 specific)(GO:0032453) |
| 1.2 | 2.4 | GO:0010484 | H3 histone acetyltransferase activity(GO:0010484) |
| 1.2 | 1.2 | GO:0016979 | lipoate-protein ligase activity(GO:0016979) |
| 1.2 | 5.9 | GO:0005052 | peroxisome matrix targeting signal-1 binding(GO:0005052) |
| 1.2 | 44.3 | GO:0048487 | beta-tubulin binding(GO:0048487) |
| 1.2 | 3.5 | GO:0046975 | histone methyltransferase activity (H3-K36 specific)(GO:0046975) |
| 1.1 | 17.2 | GO:0070182 | DNA polymerase binding(GO:0070182) |
| 1.1 | 28.5 | GO:0000993 | RNA polymerase II core binding(GO:0000993) |
| 1.1 | 53.5 | GO:0050699 | WW domain binding(GO:0050699) |
| 1.1 | 19.3 | GO:0008301 | DNA binding, bending(GO:0008301) |
| 1.1 | 6.8 | GO:0004699 | calcium-independent protein kinase C activity(GO:0004699) |
| 1.1 | 12.5 | GO:0031078 | histone deacetylase activity (H3-K14 specific)(GO:0031078) NAD-dependent histone deacetylase activity (H3-K14 specific)(GO:0032041) |
| 1.1 | 42.9 | GO:0046966 | thyroid hormone receptor binding(GO:0046966) |
| 1.1 | 35.0 | GO:0016538 | cyclin-dependent protein serine/threonine kinase regulator activity(GO:0016538) |
| 1.1 | 19.1 | GO:0051400 | BH domain binding(GO:0051400) |
| 1.1 | 5.6 | GO:0004991 | parathyroid hormone receptor activity(GO:0004991) |
| 1.1 | 3.4 | GO:0034511 | U3 snoRNA binding(GO:0034511) |
| 1.1 | 111.7 | GO:0003697 | single-stranded DNA binding(GO:0003697) |
| 1.1 | 10.0 | GO:0050692 | DBD domain binding(GO:0050692) |
| 1.1 | 3.3 | GO:0052723 | inositol-1,3,4,5,6-pentakisphosphate kinase activity(GO:0000827) inositol hexakisphosphate kinase activity(GO:0000828) inositol heptakisphosphate kinase activity(GO:0000829) inositol hexakisphosphate 5-kinase activity(GO:0000832) inositol hexakisphosphate 1-kinase activity(GO:0052723) inositol hexakisphosphate 3-kinase activity(GO:0052724) inositol 5-diphosphate pentakisphosphate 5-kinase activity(GO:0052836) inositol diphosphate tetrakisphosphate kinase activity(GO:0052839) |
| 1.1 | 6.6 | GO:0030274 | LIM domain binding(GO:0030274) |
| 1.1 | 6.6 | GO:0003960 | NADPH:quinone reductase activity(GO:0003960) |
| 1.1 | 8.7 | GO:1990247 | N6-methyladenosine-containing RNA binding(GO:1990247) |
| 1.1 | 23.8 | GO:0008242 | omega peptidase activity(GO:0008242) |
| 1.1 | 9.6 | GO:0004727 | prenylated protein tyrosine phosphatase activity(GO:0004727) |
| 1.1 | 22.5 | GO:0070273 | phosphatidylinositol-4-phosphate binding(GO:0070273) |
| 1.1 | 3.2 | GO:0050510 | N-acetylgalactosaminyl-proteoglycan 3-beta-glucuronosyltransferase activity(GO:0050510) |
| 1.1 | 7.4 | GO:0016668 | oxidoreductase activity, acting on a sulfur group of donors, NAD(P) as acceptor(GO:0016668) |
| 1.1 | 9.5 | GO:0008320 | protein transmembrane transporter activity(GO:0008320) |
| 1.1 | 5.3 | GO:0030197 | extracellular matrix constituent, lubricant activity(GO:0030197) |
| 1.1 | 33.6 | GO:0030544 | Hsp70 protein binding(GO:0030544) |
| 1.0 | 2.1 | GO:0070039 | rRNA (guanosine-2'-O-)-methyltransferase activity(GO:0070039) |
| 1.0 | 10.4 | GO:0008525 | phosphatidylcholine transporter activity(GO:0008525) |
| 1.0 | 12.4 | GO:0017049 | GTP-Rho binding(GO:0017049) |
| 1.0 | 5.2 | GO:0015165 | pyrimidine nucleotide-sugar transmembrane transporter activity(GO:0015165) |
| 1.0 | 6.1 | GO:0015350 | reduced folate carrier activity(GO:0008518) methotrexate transporter activity(GO:0015350) |
| 1.0 | 5.1 | GO:0016936 | galactoside binding(GO:0016936) |
| 1.0 | 10.2 | GO:0004579 | dolichyl-diphosphooligosaccharide-protein glycotransferase activity(GO:0004579) |
| 1.0 | 3.0 | GO:0030060 | L-malate dehydrogenase activity(GO:0030060) |
| 1.0 | 4.0 | GO:0098770 | FBXO family protein binding(GO:0098770) |
| 1.0 | 2.0 | GO:0000033 | alpha-1,3-mannosyltransferase activity(GO:0000033) |
| 1.0 | 14.0 | GO:0030515 | snoRNA binding(GO:0030515) |
| 1.0 | 8.0 | GO:0003872 | 6-phosphofructokinase activity(GO:0003872) |
| 1.0 | 8.0 | GO:0005094 | Rho GDP-dissociation inhibitor activity(GO:0005094) |
| 1.0 | 5.9 | GO:0016748 | succinyltransferase activity(GO:0016748) |
| 1.0 | 7.9 | GO:0016875 | aminoacyl-tRNA ligase activity(GO:0004812) ligase activity, forming carbon-oxygen bonds(GO:0016875) ligase activity, forming aminoacyl-tRNA and related compounds(GO:0016876) |
| 1.0 | 3.0 | GO:0055100 | adiponectin binding(GO:0055100) |
| 1.0 | 14.7 | GO:0008094 | DNA-dependent ATPase activity(GO:0008094) |
| 1.0 | 2.9 | GO:0000253 | 3-keto sterol reductase activity(GO:0000253) |
| 1.0 | 2.9 | GO:0031208 | POZ domain binding(GO:0031208) |
| 1.0 | 4.8 | GO:0017161 | phosphatidylinositol-3,4-bisphosphate 4-phosphatase activity(GO:0016316) inositol-1,3,4-trisphosphate 4-phosphatase activity(GO:0017161) phosphatidylinositol-4,5-bisphosphate 4-phosphatase activity(GO:0034597) inositol-3,4-bisphosphate 4-phosphatase activity(GO:0052828) |
| 1.0 | 4.8 | GO:0016433 | rRNA (adenine) methyltransferase activity(GO:0016433) |
| 1.0 | 7.7 | GO:0008569 | ATP-dependent microtubule motor activity, minus-end-directed(GO:0008569) |
| 1.0 | 13.4 | GO:0051287 | NAD binding(GO:0051287) |
| 1.0 | 5.7 | GO:0004046 | aminoacylase activity(GO:0004046) |
| 1.0 | 19.0 | GO:0045505 | dynein intermediate chain binding(GO:0045505) |
| 0.9 | 1.9 | GO:0030628 | pre-mRNA 3'-splice site binding(GO:0030628) |
| 0.9 | 4.7 | GO:0015183 | L-aspartate transmembrane transporter activity(GO:0015183) C4-dicarboxylate transmembrane transporter activity(GO:0015556) |
| 0.9 | 5.6 | GO:0051032 | nucleic acid transmembrane transporter activity(GO:0051032) RNA transmembrane transporter activity(GO:0051033) |
| 0.9 | 3.8 | GO:0000822 | inositol hexakisphosphate binding(GO:0000822) |
| 0.9 | 18.7 | GO:0035615 | clathrin adaptor activity(GO:0035615) endocytic adaptor activity(GO:0098748) |
| 0.9 | 3.7 | GO:0050211 | procollagen galactosyltransferase activity(GO:0050211) |
| 0.9 | 11.1 | GO:0008187 | poly-pyrimidine tract binding(GO:0008187) |
| 0.9 | 4.6 | GO:0004095 | carnitine O-palmitoyltransferase activity(GO:0004095) |
| 0.9 | 6.4 | GO:0016721 | superoxide dismutase activity(GO:0004784) oxidoreductase activity, acting on superoxide radicals as acceptor(GO:0016721) |
| 0.9 | 6.4 | GO:0030267 | hydroxypyruvate reductase activity(GO:0016618) glyoxylate reductase (NADP) activity(GO:0030267) |
| 0.9 | 32.8 | GO:0008536 | Ran GTPase binding(GO:0008536) |
| 0.9 | 2.7 | GO:0001069 | regulatory region RNA binding(GO:0001069) |
| 0.9 | 7.3 | GO:0016174 | NAD(P)H oxidase activity(GO:0016174) |
| 0.9 | 89.8 | GO:0043130 | ubiquitin binding(GO:0043130) |
| 0.9 | 1.8 | GO:0005280 | hydrogen:amino acid symporter activity(GO:0005280) |
| 0.9 | 2.7 | GO:0052739 | phosphatidylserine 1-acylhydrolase activity(GO:0052739) |
| 0.9 | 12.5 | GO:0004653 | polypeptide N-acetylgalactosaminyltransferase activity(GO:0004653) |
| 0.9 | 3.5 | GO:0019107 | glycylpeptide N-tetradecanoyltransferase activity(GO:0004379) myristoyltransferase activity(GO:0019107) |
| 0.9 | 2.6 | GO:0030158 | protein xylosyltransferase activity(GO:0030158) |
| 0.9 | 7.8 | GO:0004969 | histamine receptor activity(GO:0004969) |
| 0.9 | 6.9 | GO:0102336 | fatty acid elongase activity(GO:0009922) 3-oxo-arachidoyl-CoA synthase activity(GO:0102336) 3-oxo-cerotoyl-CoA synthase activity(GO:0102337) 3-oxo-lignoceronyl-CoA synthase activity(GO:0102338) |
| 0.9 | 6.8 | GO:0086007 | voltage-gated calcium channel activity involved in cardiac muscle cell action potential(GO:0086007) |
| 0.9 | 4.3 | GO:0019776 | Atg8 ligase activity(GO:0019776) |
| 0.8 | 6.8 | GO:0004523 | RNA-DNA hybrid ribonuclease activity(GO:0004523) |
| 0.8 | 16.0 | GO:0004887 | thyroid hormone receptor activity(GO:0004887) |
| 0.8 | 5.0 | GO:0030942 | endoplasmic reticulum signal peptide binding(GO:0030942) |
| 0.8 | 2.5 | GO:0047756 | chondroitin 4-sulfotransferase activity(GO:0047756) |
| 0.8 | 13.4 | GO:0052629 | phosphatidylinositol-3,5-bisphosphate 3-phosphatase activity(GO:0052629) |
| 0.8 | 35.2 | GO:0015175 | neutral amino acid transmembrane transporter activity(GO:0015175) |
| 0.8 | 2.5 | GO:0001034 | RNA polymerase III transcription factor activity, sequence-specific DNA binding(GO:0001034) |
| 0.8 | 4.2 | GO:0047066 | phospholipid-hydroperoxide glutathione peroxidase activity(GO:0047066) |
| 0.8 | 3.3 | GO:0004743 | pyruvate kinase activity(GO:0004743) |
| 0.8 | 3.3 | GO:0016274 | arginine N-methyltransferase activity(GO:0016273) protein-arginine N-methyltransferase activity(GO:0016274) |
| 0.8 | 7.4 | GO:0050700 | CARD domain binding(GO:0050700) |
| 0.8 | 9.8 | GO:0042974 | retinoic acid receptor binding(GO:0042974) |
| 0.8 | 6.5 | GO:0008353 | RNA polymerase II carboxy-terminal domain kinase activity(GO:0008353) |
| 0.8 | 26.8 | GO:0019212 | phosphatase inhibitor activity(GO:0019212) |
| 0.8 | 6.5 | GO:0070567 | cytidylyltransferase activity(GO:0070567) |
| 0.8 | 25.9 | GO:0005123 | death receptor binding(GO:0005123) |
| 0.8 | 1.6 | GO:0005055 | laminin receptor activity(GO:0005055) |
| 0.8 | 4.8 | GO:0046923 | ER retention sequence binding(GO:0046923) |
| 0.8 | 24.1 | GO:0043027 | cysteine-type endopeptidase inhibitor activity involved in apoptotic process(GO:0043027) |
| 0.8 | 4.0 | GO:0034452 | dynactin binding(GO:0034452) |
| 0.8 | 2.4 | GO:0070984 | SET domain binding(GO:0070984) |
| 0.8 | 19.1 | GO:0043021 | ribonucleoprotein complex binding(GO:0043021) |
| 0.8 | 1.6 | GO:0031369 | translation initiation factor binding(GO:0031369) |
| 0.8 | 6.3 | GO:0016423 | tRNA (guanine) methyltransferase activity(GO:0016423) |
| 0.8 | 19.0 | GO:0044390 | ubiquitin-like protein conjugating enzyme binding(GO:0044390) |
| 0.8 | 6.3 | GO:0071253 | connexin binding(GO:0071253) |
| 0.8 | 3.2 | GO:0047685 | amine sulfotransferase activity(GO:0047685) |
| 0.8 | 0.8 | GO:0032089 | NACHT domain binding(GO:0032089) |
| 0.8 | 15.7 | GO:0071837 | HMG box domain binding(GO:0071837) |
| 0.8 | 2.3 | GO:0003845 | 11-beta-hydroxysteroid dehydrogenase [NAD(P)] activity(GO:0003845) |
| 0.8 | 40.6 | GO:0016655 | oxidoreductase activity, acting on NAD(P)H, quinone or similar compound as acceptor(GO:0016655) |
| 0.8 | 2.3 | GO:0030898 | actin-dependent ATPase activity(GO:0030898) |
| 0.8 | 5.5 | GO:0042979 | ornithine decarboxylase regulator activity(GO:0042979) |
| 0.8 | 2.3 | GO:0004967 | glucagon receptor activity(GO:0004967) |
| 0.8 | 0.8 | GO:0003678 | DNA helicase activity(GO:0003678) |
| 0.8 | 7.6 | GO:0034594 | phosphatidylinositol trisphosphate phosphatase activity(GO:0034594) |
| 0.8 | 8.4 | GO:0035381 | extracellular ATP-gated cation channel activity(GO:0004931) ATP-gated ion channel activity(GO:0035381) |
| 0.8 | 2.3 | GO:0035605 | peptidyl-cysteine S-nitrosylase activity(GO:0035605) |
| 0.8 | 2.3 | GO:0016435 | rRNA (guanine) methyltransferase activity(GO:0016435) |
| 0.8 | 3.8 | GO:0004140 | dephospho-CoA kinase activity(GO:0004140) |
| 0.7 | 14.8 | GO:0008349 | MAP kinase kinase kinase kinase activity(GO:0008349) |
| 0.7 | 57.1 | GO:0000979 | RNA polymerase II core promoter sequence-specific DNA binding(GO:0000979) |
| 0.7 | 2.2 | GO:0005173 | stem cell factor receptor binding(GO:0005173) |
| 0.7 | 7.3 | GO:0004596 | peptide alpha-N-acetyltransferase activity(GO:0004596) |
| 0.7 | 5.8 | GO:0046703 | natural killer cell lectin-like receptor binding(GO:0046703) |
| 0.7 | 3.5 | GO:0070653 | high-density lipoprotein particle receptor binding(GO:0070653) |
| 0.7 | 1.4 | GO:0003858 | 3-hydroxybutyrate dehydrogenase activity(GO:0003858) |
| 0.7 | 2.8 | GO:0004775 | succinate-CoA ligase (ADP-forming) activity(GO:0004775) |
| 0.7 | 2.1 | GO:0005338 | nucleotide-sugar transmembrane transporter activity(GO:0005338) |
| 0.7 | 13.9 | GO:0003727 | single-stranded RNA binding(GO:0003727) |
| 0.7 | 9.0 | GO:0046527 | glucosyltransferase activity(GO:0046527) |
| 0.7 | 7.6 | GO:0004673 | protein histidine kinase activity(GO:0004673) |
| 0.7 | 8.9 | GO:0043295 | glutathione binding(GO:0043295) |
| 0.7 | 0.7 | GO:0034041 | sterol-transporting ATPase activity(GO:0034041) |
| 0.7 | 6.1 | GO:0039706 | co-receptor binding(GO:0039706) |
| 0.7 | 18.3 | GO:0000049 | tRNA binding(GO:0000049) |
| 0.7 | 1.4 | GO:0019834 | phospholipase A2 inhibitor activity(GO:0019834) |
| 0.7 | 2.7 | GO:0004647 | phosphoserine phosphatase activity(GO:0004647) |
| 0.7 | 2.6 | GO:0004609 | phosphatidylserine decarboxylase activity(GO:0004609) |
| 0.7 | 7.2 | GO:0042800 | histone methyltransferase activity (H3-K4 specific)(GO:0042800) |
| 0.7 | 2.0 | GO:0071933 | Arp2/3 complex binding(GO:0071933) |
| 0.7 | 2.0 | GO:0004346 | glucose-6-phosphatase activity(GO:0004346) sugar-terminal-phosphatase activity(GO:0050309) |
| 0.6 | 7.1 | GO:0004022 | alcohol dehydrogenase (NAD) activity(GO:0004022) |
| 0.6 | 3.9 | GO:0004000 | adenosine deaminase activity(GO:0004000) |
| 0.6 | 8.3 | GO:0015036 | disulfide oxidoreductase activity(GO:0015036) |
| 0.6 | 3.2 | GO:0004905 | type I interferon receptor activity(GO:0004905) |
| 0.6 | 10.8 | GO:0004143 | diacylglycerol kinase activity(GO:0004143) |
| 0.6 | 2.5 | GO:0005111 | type 2 fibroblast growth factor receptor binding(GO:0005111) |
| 0.6 | 4.4 | GO:0016421 | CoA carboxylase activity(GO:0016421) |
| 0.6 | 5.6 | GO:0055106 | ubiquitin-protein transferase regulator activity(GO:0055106) |
| 0.6 | 2.5 | GO:0016404 | 15-hydroxyprostaglandin dehydrogenase (NAD+) activity(GO:0016404) |
| 0.6 | 3.7 | GO:0008479 | queuine tRNA-ribosyltransferase activity(GO:0008479) |
| 0.6 | 49.0 | GO:0047485 | protein N-terminus binding(GO:0047485) |
| 0.6 | 41.6 | GO:0070491 | repressing transcription factor binding(GO:0070491) |
| 0.6 | 3.0 | GO:0033906 | hyaluronoglucuronidase activity(GO:0033906) |
| 0.6 | 1.8 | GO:0008511 | sodium:potassium:chloride symporter activity(GO:0008511) |
| 0.6 | 0.6 | GO:0035033 | histone deacetylase regulator activity(GO:0035033) |
| 0.6 | 3.6 | GO:0032038 | myosin II heavy chain binding(GO:0032038) |
| 0.6 | 2.4 | GO:0000339 | RNA cap binding(GO:0000339) |
| 0.6 | 14.2 | GO:0032451 | demethylase activity(GO:0032451) |
| 0.6 | 12.8 | GO:0005537 | mannose binding(GO:0005537) |
| 0.6 | 2.9 | GO:0004966 | galanin receptor activity(GO:0004966) |
| 0.6 | 1.7 | GO:0031626 | beta-endorphin binding(GO:0031626) |
| 0.6 | 1.7 | GO:0033878 | hormone-sensitive lipase activity(GO:0033878) |
| 0.6 | 10.2 | GO:0005095 | GTPase inhibitor activity(GO:0005095) |
| 0.6 | 2.8 | GO:0008097 | 5S rRNA binding(GO:0008097) |
| 0.6 | 2.8 | GO:0033743 | peptide-methionine (R)-S-oxide reductase activity(GO:0033743) |
| 0.6 | 2.2 | GO:0004448 | isocitrate dehydrogenase activity(GO:0004448) |
| 0.6 | 1.7 | GO:0030229 | very-low-density lipoprotein particle receptor activity(GO:0030229) |
| 0.6 | 0.6 | GO:0016453 | C-acetyltransferase activity(GO:0016453) |
| 0.6 | 10.5 | GO:0051539 | 4 iron, 4 sulfur cluster binding(GO:0051539) |
| 0.5 | 7.7 | GO:0004697 | protein kinase C activity(GO:0004697) |
| 0.5 | 16.9 | GO:0016831 | carboxy-lyase activity(GO:0016831) |
| 0.5 | 8.1 | GO:0004985 | opioid receptor activity(GO:0004985) |
| 0.5 | 1.6 | GO:0052810 | 1-phosphatidylinositol-5-kinase activity(GO:0052810) |
| 0.5 | 35.3 | GO:0003725 | double-stranded RNA binding(GO:0003725) |
| 0.5 | 1.6 | GO:0050146 | nucleoside phosphotransferase activity(GO:0050146) |
| 0.5 | 8.4 | GO:0017128 | phospholipid scramblase activity(GO:0017128) |
| 0.5 | 1.6 | GO:0008169 | C-methyltransferase activity(GO:0008169) |
| 0.5 | 9.4 | GO:0097016 | L27 domain binding(GO:0097016) |
| 0.5 | 10.4 | GO:0031418 | L-ascorbic acid binding(GO:0031418) |
| 0.5 | 2.6 | GO:0004126 | cytidine deaminase activity(GO:0004126) |
| 0.5 | 7.3 | GO:0015926 | glucosidase activity(GO:0015926) |
| 0.5 | 17.7 | GO:0004364 | glutathione transferase activity(GO:0004364) |
| 0.5 | 1.5 | GO:0005042 | netrin receptor activity(GO:0005042) |
| 0.5 | 16.4 | GO:0043531 | ADP binding(GO:0043531) |
| 0.5 | 4.1 | GO:0008269 | JAK pathway signal transduction adaptor activity(GO:0008269) |
| 0.5 | 2.5 | GO:0001165 | RNA polymerase I upstream control element sequence-specific DNA binding(GO:0001165) |
| 0.5 | 5.6 | GO:0042609 | CD4 receptor binding(GO:0042609) |
| 0.5 | 0.5 | GO:0031432 | titin binding(GO:0031432) |
| 0.5 | 2.0 | GO:0004768 | stearoyl-CoA 9-desaturase activity(GO:0004768) acyl-CoA desaturase activity(GO:0016215) |
| 0.5 | 13.1 | GO:0016765 | transferase activity, transferring alkyl or aryl (other than methyl) groups(GO:0016765) |
| 0.5 | 1.0 | GO:0046979 | TAP2 binding(GO:0046979) |
| 0.5 | 1.0 | GO:0043891 | glyceraldehyde-3-phosphate dehydrogenase (NAD+) (phosphorylating) activity(GO:0004365) glyceraldehyde-3-phosphate dehydrogenase (NAD(P)+) (phosphorylating) activity(GO:0043891) |
| 0.5 | 0.5 | GO:0047718 | geranylgeranyl reductase activity(GO:0045550) indanol dehydrogenase activity(GO:0047718) |
| 0.5 | 10.4 | GO:0016505 | peptidase activator activity involved in apoptotic process(GO:0016505) |
| 0.5 | 16.3 | GO:0005164 | tumor necrosis factor receptor binding(GO:0005164) |
| 0.5 | 2.4 | GO:0016846 | carbon-sulfur lyase activity(GO:0016846) |
| 0.5 | 8.3 | GO:0090484 | drug transporter activity(GO:0090484) |
| 0.5 | 1.5 | GO:1904928 | coreceptor activity involved in canonical Wnt signaling pathway(GO:1904928) |
| 0.5 | 1.4 | GO:0033265 | choline binding(GO:0033265) |
| 0.5 | 2.9 | GO:0047894 | flavonol 3-sulfotransferase activity(GO:0047894) |
| 0.5 | 1.4 | GO:0004531 | deoxyribonuclease II activity(GO:0004531) |
| 0.5 | 1.0 | GO:0048030 | disaccharide binding(GO:0048030) |
| 0.5 | 2.4 | GO:0070878 | primary miRNA binding(GO:0070878) |
| 0.5 | 0.9 | GO:0032422 | purine-rich negative regulatory element binding(GO:0032422) |
| 0.5 | 3.3 | GO:0016679 | ubiquinol-cytochrome-c reductase activity(GO:0008121) oxidoreductase activity, acting on diphenols and related substances as donors(GO:0016679) oxidoreductase activity, acting on diphenols and related substances as donors, cytochrome as acceptor(GO:0016681) |
| 0.5 | 3.2 | GO:0016783 | sulfurtransferase activity(GO:0016783) |
| 0.5 | 36.1 | GO:0008565 | protein transporter activity(GO:0008565) |
| 0.5 | 521.6 | GO:0003723 | RNA binding(GO:0003723) |
| 0.4 | 4.0 | GO:0004340 | glucokinase activity(GO:0004340) hexokinase activity(GO:0004396) fructokinase activity(GO:0008865) mannokinase activity(GO:0019158) |
| 0.4 | 10.2 | GO:0019213 | deacetylase activity(GO:0019213) |
| 0.4 | 2.2 | GO:0018479 | benzaldehyde dehydrogenase (NAD+) activity(GO:0018479) |
| 0.4 | 1.3 | GO:0003954 | NADH dehydrogenase activity(GO:0003954) |
| 0.4 | 6.1 | GO:1901682 | sulfur compound transmembrane transporter activity(GO:1901682) |
| 0.4 | 2.6 | GO:0045545 | syndecan binding(GO:0045545) |
| 0.4 | 2.1 | GO:0032795 | heterotrimeric G-protein binding(GO:0032795) |
| 0.4 | 2.1 | GO:0015639 | cadmium ion transmembrane transporter activity(GO:0015086) cobalt ion transmembrane transporter activity(GO:0015087) lead ion transmembrane transporter activity(GO:0015094) ferrous iron uptake transmembrane transporter activity(GO:0015639) |
| 0.4 | 8.0 | GO:0080025 | phosphatidylinositol-3,5-bisphosphate binding(GO:0080025) |
| 0.4 | 0.8 | GO:0046848 | hydroxyapatite binding(GO:0046848) |
| 0.4 | 2.4 | GO:0001758 | retinal dehydrogenase activity(GO:0001758) |
| 0.4 | 2.4 | GO:0005353 | fructose transmembrane transporter activity(GO:0005353) |
| 0.4 | 73.7 | GO:0051015 | actin filament binding(GO:0051015) |
| 0.4 | 3.1 | GO:0030883 | lipid antigen binding(GO:0030882) endogenous lipid antigen binding(GO:0030883) exogenous lipid antigen binding(GO:0030884) |
| 0.4 | 3.4 | GO:0032190 | acrosin binding(GO:0032190) |
| 0.4 | 12.7 | GO:0004198 | calcium-dependent cysteine-type endopeptidase activity(GO:0004198) |
| 0.4 | 2.6 | GO:0071936 | coreceptor activity involved in Wnt signaling pathway(GO:0071936) coreceptor activity involved in Wnt signaling pathway, planar cell polarity pathway(GO:1904929) |
| 0.4 | 2.5 | GO:0005160 | transforming growth factor beta receptor binding(GO:0005160) |
| 0.3 | 10.8 | GO:0005109 | frizzled binding(GO:0005109) |
| 0.3 | 1.4 | GO:0033829 | O-fucosylpeptide 3-beta-N-acetylglucosaminyltransferase activity(GO:0033829) |
| 0.3 | 1.4 | GO:0005219 | ryanodine-sensitive calcium-release channel activity(GO:0005219) |
| 0.3 | 2.0 | GO:0019863 | IgE binding(GO:0019863) |
| 0.3 | 3.7 | GO:0008253 | 5'-nucleotidase activity(GO:0008253) |
| 0.3 | 8.5 | GO:0003684 | damaged DNA binding(GO:0003684) |
| 0.3 | 3.4 | GO:0016814 | hydrolase activity, acting on carbon-nitrogen (but not peptide) bonds, in cyclic amidines(GO:0016814) |
| 0.3 | 3.0 | GO:0003831 | beta-N-acetylglucosaminylglycopeptide beta-1,4-galactosyltransferase activity(GO:0003831) |
| 0.3 | 1.0 | GO:0035650 | AP-1 adaptor complex binding(GO:0035650) |
| 0.3 | 13.3 | GO:0004843 | thiol-dependent ubiquitin-specific protease activity(GO:0004843) |
| 0.3 | 11.2 | GO:0003755 | peptidyl-prolyl cis-trans isomerase activity(GO:0003755) |
| 0.3 | 3.0 | GO:0035005 | 1-phosphatidylinositol-4-phosphate 3-kinase activity(GO:0035005) |
| 0.3 | 12.3 | GO:0004693 | cyclin-dependent protein serine/threonine kinase activity(GO:0004693) |
| 0.3 | 1.2 | GO:0017169 | CDP-alcohol phosphatidyltransferase activity(GO:0017169) |
| 0.3 | 2.4 | GO:0019960 | C-X3-C chemokine binding(GO:0019960) |
| 0.3 | 2.1 | GO:0004873 | asialoglycoprotein receptor activity(GO:0004873) |
| 0.3 | 2.0 | GO:0034617 | tetrahydrobiopterin binding(GO:0034617) |
| 0.3 | 0.9 | GO:0005260 | channel-conductance-controlling ATPase activity(GO:0005260) |
| 0.3 | 1.1 | GO:0019976 | interleukin-2 receptor activity(GO:0004911) interleukin-2 binding(GO:0019976) |
| 0.3 | 3.1 | GO:0001106 | RNA polymerase II transcription corepressor activity(GO:0001106) |
| 0.3 | 1.7 | GO:0003993 | acid phosphatase activity(GO:0003993) |
| 0.3 | 0.6 | GO:0031691 | alpha-1A adrenergic receptor binding(GO:0031691) alpha-1B adrenergic receptor binding(GO:0031692) follicle-stimulating hormone receptor binding(GO:0031762) |
| 0.3 | 10.1 | GO:0042165 | neurotransmitter binding(GO:0042165) |
| 0.3 | 6.6 | GO:0043539 | protein serine/threonine kinase activator activity(GO:0043539) |
| 0.3 | 2.9 | GO:0016881 | acid-amino acid ligase activity(GO:0016881) |
| 0.3 | 8.6 | GO:0016811 | hydrolase activity, acting on carbon-nitrogen (but not peptide) bonds, in linear amides(GO:0016811) |
| 0.3 | 2.3 | GO:0005005 | transmembrane-ephrin receptor activity(GO:0005005) |
| 0.3 | 15.7 | GO:0031072 | heat shock protein binding(GO:0031072) |
| 0.3 | 1.5 | GO:0000293 | ferric-chelate reductase activity(GO:0000293) |
| 0.3 | 0.5 | GO:0004090 | carbonyl reductase (NADPH) activity(GO:0004090) |
| 0.3 | 0.8 | GO:1990430 | extracellular matrix protein binding(GO:1990430) |
| 0.2 | 0.7 | GO:0004937 | alpha1-adrenergic receptor activity(GO:0004937) |
| 0.2 | 0.7 | GO:0002046 | opsin binding(GO:0002046) |
| 0.2 | 1.0 | GO:0052851 | cupric reductase activity(GO:0008823) ferric-chelate reductase (NADPH) activity(GO:0052851) |
| 0.2 | 1.6 | GO:0016167 | glial cell-derived neurotrophic factor receptor activity(GO:0016167) |
| 0.2 | 0.2 | GO:0015222 | serotonin transmembrane transporter activity(GO:0015222) |
| 0.2 | 2.1 | GO:0004897 | ciliary neurotrophic factor receptor activity(GO:0004897) |
| 0.2 | 1.1 | GO:0016882 | cyclo-ligase activity(GO:0016882) |
| 0.2 | 0.2 | GO:0005169 | neurotrophin TRKB receptor binding(GO:0005169) |
| 0.2 | 14.1 | GO:0009055 | electron carrier activity(GO:0009055) |
| 0.2 | 0.9 | GO:0044736 | acid-sensing ion channel activity(GO:0044736) |
| 0.2 | 0.2 | GO:0016723 | oxidoreductase activity, oxidizing metal ions, NAD or NADP as acceptor(GO:0016723) |
| 0.2 | 0.4 | GO:0034481 | chondroitin sulfotransferase activity(GO:0034481) |
| 0.2 | 2.0 | GO:0016286 | small conductance calcium-activated potassium channel activity(GO:0016286) |
| 0.2 | 0.8 | GO:0097108 | smoothened binding(GO:0005119) hedgehog family protein binding(GO:0097108) |
| 0.2 | 1.4 | GO:0050543 | icosanoid binding(GO:0050542) icosatetraenoic acid binding(GO:0050543) arachidonic acid binding(GO:0050544) fatty acid derivative binding(GO:1901567) |
| 0.2 | 1.6 | GO:0003756 | protein disulfide isomerase activity(GO:0003756) intramolecular oxidoreductase activity, transposing S-S bonds(GO:0016864) |
| 0.2 | 1.4 | GO:0030976 | thiamine pyrophosphate binding(GO:0030976) |
| 0.2 | 2.7 | GO:0030215 | semaphorin receptor binding(GO:0030215) |
| 0.2 | 1.2 | GO:0001161 | intronic transcription regulatory region sequence-specific DNA binding(GO:0001161) intronic transcription regulatory region DNA binding(GO:0044213) |
| 0.2 | 2.1 | GO:0038132 | neuregulin binding(GO:0038132) |
| 0.2 | 8.3 | GO:0042826 | histone deacetylase binding(GO:0042826) |
| 0.2 | 1.3 | GO:0003810 | protein-glutamine gamma-glutamyltransferase activity(GO:0003810) |
| 0.2 | 0.2 | GO:0090555 | phosphatidylethanolamine-translocating ATPase activity(GO:0090555) |
| 0.2 | 0.7 | GO:0016725 | oxidoreductase activity, acting on CH or CH2 groups(GO:0016725) |
| 0.2 | 1.1 | GO:0004565 | beta-galactosidase activity(GO:0004565) |
| 0.2 | 1.4 | GO:0008046 | axon guidance receptor activity(GO:0008046) |
| 0.2 | 0.5 | GO:0004958 | prostaglandin F receptor activity(GO:0004958) |
| 0.2 | 1.6 | GO:0019136 | deoxynucleoside kinase activity(GO:0019136) |
| 0.2 | 2.0 | GO:0001190 | transcriptional activator activity, RNA polymerase II transcription factor binding(GO:0001190) transcriptional repressor activity, RNA polymerase II activating transcription factor binding(GO:0098811) |
| 0.2 | 0.9 | GO:0005166 | neurotrophin p75 receptor binding(GO:0005166) |
| 0.2 | 0.5 | GO:0016838 | carbon-oxygen lyase activity, acting on phosphates(GO:0016838) |
| 0.2 | 0.5 | GO:0016717 | oxidoreductase activity, acting on paired donors, with oxidation of a pair of donors resulting in the reduction of molecular oxygen to two molecules of water(GO:0016717) |
| 0.2 | 0.5 | GO:0004060 | arylamine N-acetyltransferase activity(GO:0004060) |
| 0.2 | 5.6 | GO:0016836 | hydro-lyase activity(GO:0016836) |
| 0.2 | 0.8 | GO:0003835 | beta-galactoside alpha-2,6-sialyltransferase activity(GO:0003835) |
| 0.2 | 11.2 | GO:0019003 | GDP binding(GO:0019003) |
| 0.2 | 2.1 | GO:0008527 | taste receptor activity(GO:0008527) |
| 0.2 | 1.3 | GO:0015643 | toxic substance binding(GO:0015643) |
| 0.2 | 0.5 | GO:0008336 | gamma-butyrobetaine dioxygenase activity(GO:0008336) |
| 0.2 | 0.3 | GO:0016661 | oxidoreductase activity, acting on other nitrogenous compounds as donors(GO:0016661) |
| 0.2 | 1.1 | GO:0008093 | cytoskeletal adaptor activity(GO:0008093) |
| 0.2 | 4.2 | GO:0001105 | RNA polymerase II transcription coactivator activity(GO:0001105) |
| 0.1 | 0.6 | GO:0008158 | hedgehog receptor activity(GO:0008158) |
| 0.1 | 0.4 | GO:0005026 | transforming growth factor beta receptor activity, type II(GO:0005026) |
| 0.1 | 0.4 | GO:0016208 | AMP binding(GO:0016208) |
| 0.1 | 5.2 | GO:0001047 | core promoter binding(GO:0001047) |
| 0.1 | 0.3 | GO:0009008 | DNA-methyltransferase activity(GO:0009008) |
| 0.1 | 0.8 | GO:0031735 | CCR10 chemokine receptor binding(GO:0031735) |
| 0.1 | 2.8 | GO:0071889 | 14-3-3 protein binding(GO:0071889) |
| 0.1 | 0.6 | GO:0050436 | microfibril binding(GO:0050436) |
| 0.1 | 0.2 | GO:0097371 | MDM2/MDM4 family protein binding(GO:0097371) |
| 0.1 | 0.4 | GO:0047783 | steroid 11-beta-monooxygenase activity(GO:0004507) corticosterone 18-monooxygenase activity(GO:0047783) |
| 0.1 | 5.9 | GO:0017112 | Rab guanyl-nucleotide exchange factor activity(GO:0017112) |
| 0.1 | 0.5 | GO:0047676 | arachidonate-CoA ligase activity(GO:0047676) |
| 0.1 | 4.8 | GO:0008138 | protein tyrosine/serine/threonine phosphatase activity(GO:0008138) |
| 0.1 | 4.3 | GO:0004385 | guanylate kinase activity(GO:0004385) |
| 0.1 | 1.3 | GO:0016500 | protein-hormone receptor activity(GO:0016500) |
| 0.1 | 1.8 | GO:0016790 | thiolester hydrolase activity(GO:0016790) |
| 0.1 | 2.7 | GO:0008308 | voltage-gated anion channel activity(GO:0008308) |
| 0.1 | 0.7 | GO:0008420 | CTD phosphatase activity(GO:0008420) |
| 0.1 | 0.4 | GO:0015129 | lactate transmembrane transporter activity(GO:0015129) |
| 0.1 | 2.5 | GO:0004467 | long-chain fatty acid-CoA ligase activity(GO:0004467) |
| 0.1 | 1.5 | GO:0031702 | type 1 angiotensin receptor binding(GO:0031702) |
| 0.1 | 0.4 | GO:0099580 | ion antiporter activity involved in regulation of postsynaptic membrane potential(GO:0099580) |
| 0.1 | 0.4 | GO:0015215 | nucleotide transmembrane transporter activity(GO:0015215) |
| 0.1 | 0.4 | GO:0086089 | voltage-gated potassium channel activity involved in atrial cardiac muscle cell action potential repolarization(GO:0086089) |
| 0.1 | 1.2 | GO:0004185 | serine-type carboxypeptidase activity(GO:0004185) |
| 0.1 | 0.2 | GO:0031996 | thioesterase binding(GO:0031996) |
| 0.1 | 1.6 | GO:0005024 | transforming growth factor beta-activated receptor activity(GO:0005024) |
| 0.1 | 0.7 | GO:0016713 | oxidoreductase activity, acting on paired donors, with incorporation or reduction of molecular oxygen, reduced iron-sulfur protein as one donor, and incorporation of one atom of oxygen(GO:0016713) |
| 0.1 | 0.9 | GO:0047760 | butyrate-CoA ligase activity(GO:0047760) |
| 0.1 | 2.3 | GO:0001972 | retinoic acid binding(GO:0001972) |
| 0.1 | 0.4 | GO:0003920 | GMP reductase activity(GO:0003920) oxidoreductase activity, acting on NAD(P)H, nitrogenous group as acceptor(GO:0016657) |
| 0.1 | 0.3 | GO:0004920 | interleukin-10 receptor activity(GO:0004920) |
| 0.1 | 0.6 | GO:0043225 | anion transmembrane-transporting ATPase activity(GO:0043225) |
| 0.1 | 0.2 | GO:0016176 | superoxide-generating NADPH oxidase activator activity(GO:0016176) |
| 0.1 | 1.8 | GO:0031698 | beta-2 adrenergic receptor binding(GO:0031698) |
| 0.1 | 0.5 | GO:0034056 | estrogen response element binding(GO:0034056) |
| 0.1 | 0.3 | GO:0004427 | inorganic diphosphatase activity(GO:0004427) |
| 0.1 | 0.1 | GO:0060229 | lipase activator activity(GO:0060229) |
| 0.1 | 0.3 | GO:0004692 | cGMP-dependent protein kinase activity(GO:0004692) |
| 0.1 | 0.7 | GO:0097200 | cysteine-type endopeptidase activity involved in execution phase of apoptosis(GO:0097200) |
| 0.1 | 0.2 | GO:0050508 | glucuronosyl-N-acetylglucosaminyl-proteoglycan 4-alpha-N-acetylglucosaminyltransferase activity(GO:0050508) |
| 0.1 | 0.5 | GO:0070569 | uridylyltransferase activity(GO:0070569) |
| 0.1 | 0.4 | GO:0004972 | NMDA glutamate receptor activity(GO:0004972) |
| 0.1 | 0.4 | GO:0034450 | ubiquitin-ubiquitin ligase activity(GO:0034450) |
| 0.0 | 0.2 | GO:0008553 | hydrogen-exporting ATPase activity, phosphorylative mechanism(GO:0008553) |
| 0.0 | 0.3 | GO:0032050 | clathrin heavy chain binding(GO:0032050) |
| 0.0 | 0.9 | GO:0008510 | sodium:bicarbonate symporter activity(GO:0008510) |
| 0.0 | 0.4 | GO:0060072 | large conductance calcium-activated potassium channel activity(GO:0060072) |
| 0.0 | 0.1 | GO:0042020 | interleukin-23 binding(GO:0042019) interleukin-23 receptor activity(GO:0042020) |
| 0.0 | 7.9 | GO:0008083 | growth factor activity(GO:0008083) |
| 0.0 | 0.6 | GO:0004386 | helicase activity(GO:0004386) |
| 0.0 | 0.2 | GO:0001013 | RNA polymerase I regulatory region DNA binding(GO:0001013) RNA polymerase I regulatory region sequence-specific DNA binding(GO:0001163) RNA polymerase I CORE element sequence-specific DNA binding(GO:0001164) |
| 0.0 | 0.3 | GO:0015464 | acetylcholine receptor activity(GO:0015464) |
| 0.0 | 0.2 | GO:0008970 | phosphatidylcholine 1-acylhydrolase activity(GO:0008970) |
| 0.0 | 0.1 | GO:0030021 | extracellular matrix structural constituent conferring compression resistance(GO:0030021) structural constituent of tooth enamel(GO:0030345) |
| 0.0 | 0.1 | GO:0003680 | AT DNA binding(GO:0003680) |
| 0.0 | 0.1 | GO:0005499 | vitamin D binding(GO:0005499) |
| 0.0 | 0.4 | GO:0030306 | ADP-ribosylation factor binding(GO:0030306) |
| 0.0 | 0.1 | GO:0015277 | kainate selective glutamate receptor activity(GO:0015277) |
| 0.0 | 0.1 | GO:0008480 | sarcosine dehydrogenase activity(GO:0008480) oxidoreductase activity, acting on the CH-NH group of donors, flavin as acceptor(GO:0046997) |
| 0.0 | 0.1 | GO:0019150 | D-ribulokinase activity(GO:0019150) |
| 0.0 | 0.1 | GO:0008106 | alcohol dehydrogenase (NADP+) activity(GO:0008106) |
| 0.0 | 0.5 | GO:0019956 | chemokine binding(GO:0019956) |
| 0.0 | 0.2 | GO:0030280 | structural constituent of epidermis(GO:0030280) |
| 0.0 | 5.7 | GO:0003712 | transcription cofactor activity(GO:0003712) |
| 0.0 | 3.3 | GO:0003924 | GTPase activity(GO:0003924) |
| 0.0 | 0.1 | GO:0042015 | interleukin-20 binding(GO:0042015) |
| 0.0 | 0.0 | GO:0019239 | deaminase activity(GO:0019239) |
Gene overrepresentation in curated gene sets: canonical pathways category:
| Log-likelihood per target | Total log-likelihood | Term | Description |
|---|---|---|---|
| 4.8 | 4.8 | PID ERBB1 RECEPTOR PROXIMAL PATHWAY | EGF receptor (ErbB1) signaling pathway |
| 4.5 | 228.3 | PID BARD1 PATHWAY | BARD1 signaling events |
| 3.7 | 25.8 | SA REG CASCADE OF CYCLIN EXPR | Expression of cyclins regulates progression through the cell cycle by activating cyclin-dependent kinases. |
| 3.4 | 48.2 | SA G2 AND M PHASES | Cdc25 activates the cdc2/cyclin B complex to induce the G2/M transition. |
| 3.1 | 72.3 | PID RANBP2 PATHWAY | Sumoylation by RanBP2 regulates transcriptional repression |
| 2.8 | 33.8 | PID FANCONI PATHWAY | Fanconi anemia pathway |
| 2.8 | 98.4 | PID ATM PATHWAY | ATM pathway |
| 2.7 | 5.3 | PID IL8 CXCR2 PATHWAY | IL8- and CXCR2-mediated signaling events |
| 2.6 | 52.8 | PID DNA PK PATHWAY | DNA-PK pathway in nonhomologous end joining |
| 2.5 | 88.3 | PID ATR PATHWAY | ATR signaling pathway |
| 2.4 | 117.9 | PID AURORA B PATHWAY | Aurora B signaling |
| 2.3 | 265.5 | PID E2F PATHWAY | E2F transcription factor network |
| 2.2 | 143.1 | PID PLK1 PATHWAY | PLK1 signaling events |
| 2.2 | 2.2 | PID PI3KCI AKT PATHWAY | Class I PI3K signaling events mediated by Akt |
| 2.1 | 10.7 | PID THROMBIN PAR1 PATHWAY | PAR1-mediated thrombin signaling events |
| 2.1 | 82.8 | PID LIS1 PATHWAY | Lissencephaly gene (LIS1) in neuronal migration and development |
| 2.1 | 237.8 | PID MYC ACTIV PATHWAY | Validated targets of C-MYC transcriptional activation |
| 1.9 | 54.0 | PID ERB GENOMIC PATHWAY | Validated nuclear estrogen receptor beta network |
| 1.8 | 53.5 | PID SMAD2 3PATHWAY | Regulation of cytoplasmic and nuclear SMAD2/3 signaling |
| 1.7 | 56.6 | PID P38 MK2 PATHWAY | p38 signaling mediated by MAPKAP kinases |
| 1.5 | 4.5 | PID FAS PATHWAY | FAS (CD95) signaling pathway |
| 1.5 | 9.0 | PID BETA CATENIN DEG PATHWAY | Degradation of beta catenin |
| 1.3 | 47.2 | PID FOXM1 PATHWAY | FOXM1 transcription factor network |
| 1.3 | 2.5 | PID S1P S1P1 PATHWAY | S1P1 pathway |
| 1.2 | 76.5 | PID TELOMERASE PATHWAY | Regulation of Telomerase |
| 1.2 | 80.0 | PID RAC1 PATHWAY | RAC1 signaling pathway |
| 1.1 | 11.4 | SA G1 AND S PHASES | Cdk2, 4, and 6 bind cyclin D in G1, while cdk2/cyclin E promotes the G1/S transition. |
| 1.1 | 16.8 | PID CIRCADIAN PATHWAY | Circadian rhythm pathway |
| 1.0 | 48.1 | ST ERK1 ERK2 MAPK PATHWAY | ERK1/ERK2 MAPK Pathway |
| 1.0 | 58.1 | PID AR TF PATHWAY | Regulation of Androgen receptor activity |
| 0.9 | 17.9 | PID ARF6 DOWNSTREAM PATHWAY | Arf6 downstream pathway |
| 0.9 | 17.4 | PID NFKAPPAB ATYPICAL PATHWAY | Atypical NF-kappaB pathway |
| 0.9 | 19.2 | PID EPHA2 FWD PATHWAY | EPHA2 forward signaling |
| 0.9 | 8.1 | PID NOTCH PATHWAY | Notch signaling pathway |
| 0.8 | 18.3 | PID ARF 3PATHWAY | Arf1 pathway |
| 0.8 | 3.3 | SA CASPASE CASCADE | Apoptosis is mediated by caspases, cysteine proteases arranged in a proteolytic cascade. |
| 0.8 | 68.9 | PID CASPASE PATHWAY | Caspase cascade in apoptosis |
| 0.8 | 33.9 | PID P53 REGULATION PATHWAY | p53 pathway |
| 0.8 | 49.4 | PID ILK PATHWAY | Integrin-linked kinase signaling |
| 0.8 | 56.9 | PID TGFBR PATHWAY | TGF-beta receptor signaling |
| 0.7 | 55.6 | PID AR PATHWAY | Coregulation of Androgen receptor activity |
| 0.7 | 32.3 | PID SYNDECAN 4 PATHWAY | Syndecan-4-mediated signaling events |
| 0.7 | 42.0 | PID HNF3B PATHWAY | FOXA2 and FOXA3 transcription factor networks |
| 0.7 | 25.1 | PID HDAC CLASSII PATHWAY | Signaling events mediated by HDAC Class II |
| 0.7 | 1.3 | PID TCR RAS PATHWAY | Ras signaling in the CD4+ TCR pathway |
| 0.6 | 39.9 | PID TAP63 PATHWAY | Validated transcriptional targets of TAp63 isoforms |
| 0.6 | 8.3 | PID ECADHERIN KERATINOCYTE PATHWAY | E-cadherin signaling in keratinocytes |
| 0.6 | 40.4 | PID PTP1B PATHWAY | Signaling events mediated by PTP1B |
| 0.6 | 16.2 | PID RHOA PATHWAY | RhoA signaling pathway |
| 0.5 | 16.3 | PID ECADHERIN STABILIZATION PATHWAY | Stabilization and expansion of the E-cadherin adherens junction |
| 0.5 | 22.8 | PID RB 1PATHWAY | Regulation of retinoblastoma protein |
| 0.5 | 24.5 | PID DELTA NP63 PATHWAY | Validated transcriptional targets of deltaNp63 isoforms |
| 0.5 | 19.9 | PID CERAMIDE PATHWAY | Ceramide signaling pathway |
| 0.5 | 21.8 | PID KIT PATHWAY | Signaling events mediated by Stem cell factor receptor (c-Kit) |
| 0.5 | 40.6 | PID BETA CATENIN NUC PATHWAY | Regulation of nuclear beta catenin signaling and target gene transcription |
| 0.5 | 3.2 | PID HDAC CLASSIII PATHWAY | Signaling events mediated by HDAC Class III |
| 0.5 | 9.0 | PID HIF1A PATHWAY | Hypoxic and oxygen homeostasis regulation of HIF-1-alpha |
| 0.4 | 10.7 | PID MAPK TRK PATHWAY | Trk receptor signaling mediated by the MAPK pathway |
| 0.4 | 4.7 | PID VEGFR1 PATHWAY | VEGFR1 specific signals |
| 0.4 | 14.9 | PID VEGFR1 2 PATHWAY | Signaling events mediated by VEGFR1 and VEGFR2 |
| 0.4 | 10.0 | PID ANGIOPOIETIN RECEPTOR PATHWAY | Angiopoietin receptor Tie2-mediated signaling |
| 0.4 | 8.6 | PID PRL SIGNALING EVENTS PATHWAY | Signaling events mediated by PRL |
| 0.4 | 11.6 | PID HIF2PATHWAY | HIF-2-alpha transcription factor network |
| 0.3 | 9.6 | PID HES HEY PATHWAY | Notch-mediated HES/HEY network |
| 0.3 | 3.9 | PID IL2 1PATHWAY | IL2-mediated signaling events |
| 0.3 | 4.2 | ST DIFFERENTIATION PATHWAY IN PC12 CELLS | Differentiation Pathway in PC12 Cells; this is a specific case of PAC1 Receptor Pathway. |
| 0.3 | 2.8 | PID WNT NONCANONICAL PATHWAY | Noncanonical Wnt signaling pathway |
| 0.3 | 1.5 | PID IL5 PATHWAY | IL5-mediated signaling events |
| 0.2 | 9.4 | PID SMAD2 3NUCLEAR PATHWAY | Regulation of nuclear SMAD2/3 signaling |
| 0.2 | 1.0 | SA B CELL RECEPTOR COMPLEXES | Antigen binding to B cell receptors activates protein tyrosine kinases, such as the Src family, which ultimate activate MAP kinases. |
| 0.2 | 2.7 | SA FAS SIGNALING | The TNF-type receptor Fas induces apoptosis on ligand binding. |
| 0.2 | 2.5 | PID RETINOIC ACID PATHWAY | Retinoic acid receptors-mediated signaling |
| 0.2 | 4.6 | PID TOLL ENDOGENOUS PATHWAY | Endogenous TLR signaling |
| 0.2 | 1.2 | PID CD8 TCR DOWNSTREAM PATHWAY | Downstream signaling in naïve CD8+ T cells |
| 0.1 | 2.4 | PID ALK2 PATHWAY | ALK2 signaling events |
| 0.1 | 1.0 | SA PROGRAMMED CELL DEATH | Programmed cell death, or apoptosis, eliminates damaged or unneeded cells. |
| 0.1 | 1.3 | PID FOXO PATHWAY | FoxO family signaling |
| 0.1 | 0.4 | PID IL2 PI3K PATHWAY | IL2 signaling events mediated by PI3K |
| 0.1 | 5.9 | PID ERA GENOMIC PATHWAY | Validated nuclear estrogen receptor alpha network |
| 0.1 | 0.3 | PID P38 ALPHA BETA PATHWAY | Regulation of p38-alpha and p38-beta |
| 0.1 | 2.0 | PID PS1 PATHWAY | Presenilin action in Notch and Wnt signaling |
| 0.1 | 0.9 | PID TRAIL PATHWAY | TRAIL signaling pathway |
| 0.1 | 0.7 | PID HIV NEF PATHWAY | HIV-1 Nef: Negative effector of Fas and TNF-alpha |
| 0.1 | 0.5 | SIG PIP3 SIGNALING IN B LYMPHOCYTES | Genes related to PIP3 signaling in B lymphocytes |
| 0.0 | 0.3 | ST G ALPHA S PATHWAY | G alpha s Pathway |
| 0.0 | 0.9 | PID CD8 TCR PATHWAY | TCR signaling in naïve CD8+ T cells |
Gene overrepresentation in curated gene sets: REACTOME pathways category:
| Log-likelihood per target | Total log-likelihood | Term | Description |
|---|---|---|---|
| 12.6 | 12.6 | REACTOME INTERACTIONS OF VPR WITH HOST CELLULAR PROTEINS | Genes involved in Interactions of Vpr with host cellular proteins |
| 7.6 | 113.4 | REACTOME PURINE RIBONUCLEOSIDE MONOPHOSPHATE BIOSYNTHESIS | Genes involved in Purine ribonucleoside monophosphate biosynthesis |
| 6.3 | 94.3 | REACTOME APOPTOSIS INDUCED DNA FRAGMENTATION | Genes involved in Apoptosis induced DNA fragmentation |
| 5.8 | 63.5 | REACTOME APOBEC3G MEDIATED RESISTANCE TO HIV1 INFECTION | Genes involved in APOBEC3G mediated resistance to HIV-1 infection |
| 5.6 | 83.8 | REACTOME UNWINDING OF DNA | Genes involved in Unwinding of DNA |
| 5.5 | 163.9 | REACTOME G1 S SPECIFIC TRANSCRIPTION | Genes involved in G1/S-Specific Transcription |
| 4.6 | 105.9 | REACTOME CYCLIN A B1 ASSOCIATED EVENTS DURING G2 M TRANSITION | Genes involved in Cyclin A/B1 associated events during G2/M transition |
| 4.6 | 164.5 | REACTOME DEADENYLATION OF MRNA | Genes involved in Deadenylation of mRNA |
| 4.5 | 157.3 | REACTOME EXTENSION OF TELOMERES | Genes involved in Extension of Telomeres |
| 4.5 | 147.6 | REACTOME TRANSPORT OF RIBONUCLEOPROTEINS INTO THE HOST NUCLEUS | Genes involved in Transport of Ribonucleoproteins into the Host Nucleus |
| 4.3 | 91.2 | REACTOME DEPOSITION OF NEW CENPA CONTAINING NUCLEOSOMES AT THE CENTROMERE | Genes involved in Deposition of New CENPA-containing Nucleosomes at the Centromere |
| 4.0 | 161.6 | REACTOME CHOLESTEROL BIOSYNTHESIS | Genes involved in Cholesterol biosynthesis |
| 4.0 | 68.2 | REACTOME MITOCHONDRIAL FATTY ACID BETA OXIDATION | Genes involved in Mitochondrial Fatty Acid Beta-Oxidation |
| 3.9 | 3.9 | REACTOME NEP NS2 INTERACTS WITH THE CELLULAR EXPORT MACHINERY | Genes involved in NEP/NS2 Interacts with the Cellular Export Machinery |
| 3.7 | 108.5 | REACTOME APC C CDC20 MEDIATED DEGRADATION OF MITOTIC PROTEINS | Genes involved in APC/C:Cdc20 mediated degradation of mitotic proteins |
| 3.7 | 33.3 | REACTOME CYTOSOLIC TRNA AMINOACYLATION | Genes involved in Cytosolic tRNA aminoacylation |
| 3.6 | 106.9 | REACTOME SYNTHESIS AND INTERCONVERSION OF NUCLEOTIDE DI AND TRIPHOSPHATES | Genes involved in Synthesis and interconversion of nucleotide di- and triphosphates |
| 3.4 | 68.7 | REACTOME METABOLISM OF POLYAMINES | Genes involved in Metabolism of polyamines |
| 3.4 | 65.0 | REACTOME G0 AND EARLY G1 | Genes involved in G0 and Early G1 |
| 3.3 | 277.3 | REACTOME M G1 TRANSITION | Genes involved in M/G1 Transition |
| 3.3 | 6.6 | REACTOME VIF MEDIATED DEGRADATION OF APOBEC3G | Genes involved in Vif-mediated degradation of APOBEC3G |
| 3.2 | 3.2 | REACTOME GLUCAGON SIGNALING IN METABOLIC REGULATION | Genes involved in Glucagon signaling in metabolic regulation |
| 3.2 | 25.5 | REACTOME REGULATION OF ORNITHINE DECARBOXYLASE ODC | Genes involved in Regulation of ornithine decarboxylase (ODC) |
| 3.0 | 63.4 | REACTOME RNA POL III CHAIN ELONGATION | Genes involved in RNA Polymerase III Chain Elongation |
| 2.9 | 38.3 | REACTOME VIRAL MESSENGER RNA SYNTHESIS | Genes involved in Viral Messenger RNA Synthesis |
| 2.9 | 102.8 | REACTOME DOWNREGULATION OF SMAD2 3 SMAD4 TRANSCRIPTIONAL ACTIVITY | Genes involved in Downregulation of SMAD2/3:SMAD4 transcriptional activity |
| 2.9 | 157.8 | REACTOME MITOTIC G1 G1 S PHASES | Genes involved in Mitotic G1-G1/S phases |
| 2.9 | 55.5 | REACTOME MRNA SPLICING MINOR PATHWAY | Genes involved in mRNA Splicing - Minor Pathway |
| 2.9 | 63.1 | REACTOME CITRIC ACID CYCLE TCA CYCLE | Genes involved in Citric acid cycle (TCA cycle) |
| 2.7 | 65.6 | REACTOME PURINE SALVAGE | Genes involved in Purine salvage |
| 2.7 | 67.7 | REACTOME SIGNALING BY NODAL | Genes involved in Signaling by NODAL |
| 2.6 | 156.3 | REACTOME MITOCHONDRIAL PROTEIN IMPORT | Genes involved in Mitochondrial Protein Import |
| 2.6 | 94.8 | REACTOME DOWNREGULATION OF TGF BETA RECEPTOR SIGNALING | Genes involved in Downregulation of TGF-beta receptor signaling |
| 2.6 | 41.3 | REACTOME VITAMIN B5 PANTOTHENATE METABOLISM | Genes involved in Vitamin B5 (pantothenate) metabolism |
| 2.6 | 38.5 | REACTOME SLBP DEPENDENT PROCESSING OF REPLICATION DEPENDENT HISTONE PRE MRNAS | Genes involved in SLBP Dependent Processing of Replication-Dependent Histone Pre-mRNAs |
| 2.5 | 28.0 | REACTOME COPI MEDIATED TRANSPORT | Genes involved in COPI Mediated Transport |
| 2.3 | 7.0 | REACTOME TRANSPORT OF MATURE MRNA DERIVED FROM AN INTRONLESS TRANSCRIPT | Genes involved in Transport of Mature mRNA Derived from an Intronless Transcript |
| 2.3 | 252.6 | REACTOME MRNA SPLICING | Genes involved in mRNA Splicing |
| 2.2 | 94.9 | REACTOME TRANSPORT OF VITAMINS NUCLEOSIDES AND RELATED MOLECULES | Genes involved in Transport of vitamins, nucleosides, and related molecules |
| 2.2 | 2.2 | REACTOME APC CDC20 MEDIATED DEGRADATION OF NEK2A | Genes involved in APC-Cdc20 mediated degradation of Nek2A |
| 2.2 | 2.2 | REACTOME APC C CDH1 MEDIATED DEGRADATION OF CDC20 AND OTHER APC C CDH1 TARGETED PROTEINS IN LATE MITOSIS EARLY G1 | Genes involved in APC/C:Cdh1 mediated degradation of Cdc20 and other APC/C:Cdh1 targeted proteins in late mitosis/early G1 |
| 2.1 | 79.6 | REACTOME FATTY ACYL COA BIOSYNTHESIS | Genes involved in Fatty Acyl-CoA Biosynthesis |
| 2.0 | 28.6 | REACTOME ELONGATION ARREST AND RECOVERY | Genes involved in Elongation arrest and recovery |
| 2.0 | 59.9 | REACTOME METABOLISM OF PORPHYRINS | Genes involved in Metabolism of porphyrins |
| 2.0 | 145.2 | REACTOME MITOTIC PROMETAPHASE | Genes involved in Mitotic Prometaphase |
| 2.0 | 19.5 | REACTOME RECYCLING OF BILE ACIDS AND SALTS | Genes involved in Recycling of bile acids and salts |
| 1.9 | 40.0 | REACTOME ACTIVATION OF BH3 ONLY PROTEINS | Genes involved in Activation of BH3-only proteins |
| 1.8 | 14.8 | REACTOME MICRORNA MIRNA BIOGENESIS | Genes involved in MicroRNA (miRNA) Biogenesis |
| 1.8 | 34.1 | REACTOME SYNTHESIS SECRETION AND DEACYLATION OF GHRELIN | Genes involved in Synthesis, Secretion, and Deacylation of Ghrelin |
| 1.7 | 56.7 | REACTOME RORA ACTIVATES CIRCADIAN EXPRESSION | Genes involved in RORA Activates Circadian Expression |
| 1.7 | 125.0 | REACTOME FORMATION OF THE TERNARY COMPLEX AND SUBSEQUENTLY THE 43S COMPLEX | Genes involved in Formation of the ternary complex, and subsequently, the 43S complex |
| 1.7 | 46.0 | REACTOME AMINO ACID SYNTHESIS AND INTERCONVERSION TRANSAMINATION | Genes involved in Amino acid synthesis and interconversion (transamination) |
| 1.7 | 58.6 | REACTOME PYRUVATE METABOLISM AND CITRIC ACID TCA CYCLE | Genes involved in Pyruvate metabolism and Citric Acid (TCA) cycle |
| 1.7 | 6.6 | REACTOME FGFR1 LIGAND BINDING AND ACTIVATION | Genes involved in FGFR1 ligand binding and activation |
| 1.6 | 49.3 | REACTOME PYRIMIDINE METABOLISM | Genes involved in Pyrimidine metabolism |
| 1.6 | 52.3 | REACTOME FORMATION OF TUBULIN FOLDING INTERMEDIATES BY CCT TRIC | Genes involved in Formation of tubulin folding intermediates by CCT/TriC |
| 1.6 | 8.1 | REACTOME ARMS MEDIATED ACTIVATION | Genes involved in ARMS-mediated activation |
| 1.6 | 6.5 | REACTOME PKA MEDIATED PHOSPHORYLATION OF CREB | Genes involved in PKA-mediated phosphorylation of CREB |
| 1.6 | 14.4 | REACTOME INTEGRATION OF PROVIRUS | Genes involved in Integration of provirus |
| 1.6 | 159.2 | REACTOME INFLUENZA VIRAL RNA TRANSCRIPTION AND REPLICATION | Genes involved in Influenza Viral RNA Transcription and Replication |
| 1.5 | 31.7 | REACTOME RNA POL I TRANSCRIPTION | Genes involved in RNA Polymerase I Transcription |
| 1.5 | 3.0 | REACTOME ACTIVATION OF THE MRNA UPON BINDING OF THE CAP BINDING COMPLEX AND EIFS AND SUBSEQUENT BINDING TO 43S | Genes involved in Activation of the mRNA upon binding of the cap-binding complex and eIFs, and subsequent binding to 43S |
| 1.5 | 26.6 | REACTOME MRNA DECAY BY 5 TO 3 EXORIBONUCLEASE | Genes involved in mRNA Decay by 5' to 3' Exoribonuclease |
| 1.5 | 26.3 | REACTOME ZINC TRANSPORTERS | Genes involved in Zinc transporters |
| 1.5 | 35.0 | REACTOME SULFUR AMINO ACID METABOLISM | Genes involved in Sulfur amino acid metabolism |
| 1.4 | 7.0 | REACTOME MITOTIC M M G1 PHASES | Genes involved in Mitotic M-M/G1 phases |
| 1.3 | 11.9 | REACTOME ACTIVATION OF ATR IN RESPONSE TO REPLICATION STRESS | Genes involved in Activation of ATR in response to replication stress |
| 1.3 | 24.7 | REACTOME SYNTHESIS OF PC | Genes involved in Synthesis of PC |
| 1.3 | 11.6 | REACTOME POST CHAPERONIN TUBULIN FOLDING PATHWAY | Genes involved in Post-chaperonin tubulin folding pathway |
| 1.3 | 16.4 | REACTOME METABOLISM OF NON CODING RNA | Genes involved in Metabolism of non-coding RNA |
| 1.2 | 31.1 | REACTOME FORMATION OF INCISION COMPLEX IN GG NER | Genes involved in Formation of incision complex in GG-NER |
| 1.2 | 2.5 | REACTOME ACYL CHAIN REMODELLING OF PG | Genes involved in Acyl chain remodelling of PG |
| 1.2 | 8.7 | REACTOME MEMBRANE BINDING AND TARGETTING OF GAG PROTEINS | Genes involved in Membrane binding and targetting of GAG proteins |
| 1.2 | 42.1 | REACTOME SIGNALING BY FGFR1 FUSION MUTANTS | Genes involved in Signaling by FGFR1 fusion mutants |
| 1.2 | 17.5 | REACTOME GAMMA CARBOXYLATION TRANSPORT AND AMINO TERMINAL CLEAVAGE OF PROTEINS | Genes involved in Gamma-carboxylation, transport, and amino-terminal cleavage of proteins |
| 1.1 | 57.0 | REACTOME AMINO ACID TRANSPORT ACROSS THE PLASMA MEMBRANE | Genes involved in Amino acid transport across the plasma membrane |
| 1.1 | 14.8 | REACTOME P75NTR SIGNALS VIA NFKB | Genes involved in p75NTR signals via NF-kB |
| 1.1 | 23.7 | REACTOME SIGNALLING TO P38 VIA RIT AND RIN | Genes involved in Signalling to p38 via RIT and RIN |
| 1.1 | 15.3 | REACTOME ALPHA LINOLENIC ACID ALA METABOLISM | Genes involved in alpha-linolenic acid (ALA) metabolism |
| 1.1 | 8.6 | REACTOME TELOMERE MAINTENANCE | Genes involved in Telomere Maintenance |
| 1.1 | 14.0 | REACTOME SIGNALING BY NOTCH4 | Genes involved in Signaling by NOTCH4 |
| 1.1 | 1.1 | REACTOME PROCESSING OF CAPPED INTRON CONTAINING PRE MRNA | Genes involved in Processing of Capped Intron-Containing Pre-mRNA |
| 1.0 | 9.3 | REACTOME ELEVATION OF CYTOSOLIC CA2 LEVELS | Genes involved in Elevation of cytosolic Ca2+ levels |
| 1.0 | 16.5 | REACTOME SYNTHESIS OF PE | Genes involved in Synthesis of PE |
| 1.0 | 2.0 | REACTOME DEADENYLATION DEPENDENT MRNA DECAY | Genes involved in Deadenylation-dependent mRNA decay |
| 1.0 | 27.4 | REACTOME PD1 SIGNALING | Genes involved in PD-1 signaling |
| 1.0 | 83.0 | REACTOME RESPIRATORY ELECTRON TRANSPORT ATP SYNTHESIS BY CHEMIOSMOTIC COUPLING AND HEAT PRODUCTION BY UNCOUPLING PROTEINS | Genes involved in Respiratory electron transport, ATP synthesis by chemiosmotic coupling, and heat production by uncoupling proteins. |
| 0.9 | 11.2 | REACTOME MRNA PROCESSING | Genes involved in mRNA Processing |
| 0.9 | 14.8 | REACTOME ER PHAGOSOME PATHWAY | Genes involved in ER-Phagosome pathway |
| 0.9 | 11.8 | REACTOME YAP1 AND WWTR1 TAZ STIMULATED GENE EXPRESSION | Genes involved in YAP1- and WWTR1 (TAZ)-stimulated gene expression |
| 0.9 | 7.1 | REACTOME DESTABILIZATION OF MRNA BY AUF1 HNRNP D0 | Genes involved in Destabilization of mRNA by AUF1 (hnRNP D0) |
| 0.9 | 4.4 | REACTOME SPRY REGULATION OF FGF SIGNALING | Genes involved in Spry regulation of FGF signaling |
| 0.9 | 6.1 | REACTOME REGULATION OF THE FANCONI ANEMIA PATHWAY | Genes involved in Regulation of the Fanconi anemia pathway |
| 0.8 | 19.4 | REACTOME SYNTHESIS OF GLYCOSYLPHOSPHATIDYLINOSITOL GPI | Genes involved in Synthesis of glycosylphosphatidylinositol (GPI) |
| 0.8 | 9.2 | REACTOME TRANSCRIPTIONAL ACTIVITY OF SMAD2 SMAD3 SMAD4 HETEROTRIMER | Genes involved in Transcriptional activity of SMAD2/SMAD3:SMAD4 heterotrimer |
| 0.8 | 19.8 | REACTOME RNA POL II TRANSCRIPTION PRE INITIATION AND PROMOTER OPENING | Genes involved in RNA Polymerase II Transcription Pre-Initiation And Promoter Opening |
| 0.8 | 55.9 | REACTOME ACTIVATION OF CHAPERONE GENES BY XBP1S | Genes involved in Activation of Chaperone Genes by XBP1(S) |
| 0.8 | 5.7 | REACTOME HOMOLOGOUS RECOMBINATION REPAIR OF REPLICATION INDEPENDENT DOUBLE STRAND BREAKS | Genes involved in Homologous recombination repair of replication-independent double-strand breaks |
| 0.8 | 9.8 | REACTOME SIGNALING BY HIPPO | Genes involved in Signaling by Hippo |
| 0.8 | 15.0 | REACTOME TRAF3 DEPENDENT IRF ACTIVATION PATHWAY | Genes involved in TRAF3-dependent IRF activation pathway |
| 0.8 | 15.7 | REACTOME RESOLUTION OF AP SITES VIA THE MULTIPLE NUCLEOTIDE PATCH REPLACEMENT PATHWAY | Genes involved in Resolution of AP sites via the multiple-nucleotide patch replacement pathway |
| 0.8 | 97.5 | REACTOME METABOLISM OF AMINO ACIDS AND DERIVATIVES | Genes involved in Metabolism of amino acids and derivatives |
| 0.8 | 12.2 | REACTOME ANTIGEN PRESENTATION FOLDING ASSEMBLY AND PEPTIDE LOADING OF CLASS I MHC | Genes involved in Antigen Presentation: Folding, assembly and peptide loading of class I MHC |
| 0.8 | 17.5 | REACTOME DESTABILIZATION OF MRNA BY KSRP | Genes involved in Destabilization of mRNA by KSRP |
| 0.7 | 6.7 | REACTOME LATE PHASE OF HIV LIFE CYCLE | Genes involved in Late Phase of HIV Life Cycle |
| 0.7 | 19.4 | REACTOME MEIOTIC RECOMBINATION | Genes involved in Meiotic Recombination |
| 0.7 | 119.2 | REACTOME ANTIGEN PROCESSING UBIQUITINATION PROTEASOME DEGRADATION | Genes involved in Antigen processing: Ubiquitination & Proteasome degradation |
| 0.7 | 12.8 | REACTOME REGULATION OF MRNA STABILITY BY PROTEINS THAT BIND AU RICH ELEMENTS | Genes involved in Regulation of mRNA Stability by Proteins that Bind AU-rich Elements |
| 0.7 | 4.9 | REACTOME PLATELET SENSITIZATION BY LDL | Genes involved in Platelet sensitization by LDL |
| 0.7 | 32.2 | REACTOME TRANSLATION | Genes involved in Translation |
| 0.7 | 6.0 | REACTOME NUCLEAR EVENTS KINASE AND TRANSCRIPTION FACTOR ACTIVATION | Genes involved in Nuclear Events (kinase and transcription factor activation) |
| 0.7 | 31.5 | REACTOME GLYCOLYSIS | Genes involved in Glycolysis |
| 0.6 | 15.4 | REACTOME HYALURONAN UPTAKE AND DEGRADATION | Genes involved in Hyaluronan uptake and degradation |
| 0.6 | 40.3 | REACTOME LOSS OF NLP FROM MITOTIC CENTROSOMES | Genes involved in Loss of Nlp from mitotic centrosomes |
| 0.6 | 6.7 | REACTOME REGULATION OF KIT SIGNALING | Genes involved in Regulation of KIT signaling |
| 0.6 | 11.2 | REACTOME DNA REPAIR | Genes involved in DNA Repair |
| 0.6 | 11.3 | REACTOME GENERATION OF SECOND MESSENGER MOLECULES | Genes involved in Generation of second messenger molecules |
| 0.6 | 14.5 | REACTOME NEF MEDIATES DOWN MODULATION OF CELL SURFACE RECEPTORS BY RECRUITING THEM TO CLATHRIN ADAPTERS | Genes involved in Nef-mediates down modulation of cell surface receptors by recruiting them to clathrin adapters |
| 0.5 | 8.7 | REACTOME ENDOSOMAL SORTING COMPLEX REQUIRED FOR TRANSPORT ESCRT | Genes involved in Endosomal Sorting Complex Required For Transport (ESCRT) |
| 0.5 | 5.2 | REACTOME PREFOLDIN MEDIATED TRANSFER OF SUBSTRATE TO CCT TRIC | Genes involved in Prefoldin mediated transfer of substrate to CCT/TriC |
| 0.5 | 10.8 | REACTOME APOPTOTIC CLEAVAGE OF CELL ADHESION PROTEINS | Genes involved in Apoptotic cleavage of cell adhesion proteins |
| 0.5 | 12.3 | REACTOME N GLYCAN ANTENNAE ELONGATION | Genes involved in N-Glycan antennae elongation |
| 0.5 | 1.0 | REACTOME TRAF6 MEDIATED NFKB ACTIVATION | Genes involved in TRAF6 mediated NF-kB activation |
| 0.5 | 11.4 | REACTOME PTM GAMMA CARBOXYLATION HYPUSINE FORMATION AND ARYLSULFATASE ACTIVATION | Genes involved in PTM: gamma carboxylation, hypusine formation and arylsulfatase activation |
| 0.5 | 13.2 | REACTOME TRANSFERRIN ENDOCYTOSIS AND RECYCLING | Genes involved in Transferrin endocytosis and recycling |
| 0.5 | 3.8 | REACTOME NFKB ACTIVATION THROUGH FADD RIP1 PATHWAY MEDIATED BY CASPASE 8 AND10 | Genes involved in NF-kB activation through FADD/RIP-1 pathway mediated by caspase-8 and -10 |
| 0.5 | 31.0 | REACTOME APOPTOTIC EXECUTION PHASE | Genes involved in Apoptotic execution phase |
| 0.5 | 5.5 | REACTOME SIGNALING BY CONSTITUTIVELY ACTIVE EGFR | Genes involved in Signaling by constitutively active EGFR |
| 0.5 | 14.0 | REACTOME SPHINGOLIPID DE NOVO BIOSYNTHESIS | Genes involved in Sphingolipid de novo biosynthesis |
| 0.4 | 3.6 | REACTOME P130CAS LINKAGE TO MAPK SIGNALING FOR INTEGRINS | Genes involved in p130Cas linkage to MAPK signaling for integrins |
| 0.4 | 1.7 | REACTOME HIV INFECTION | Genes involved in HIV Infection |
| 0.4 | 5.5 | REACTOME VEGF LIGAND RECEPTOR INTERACTIONS | Genes involved in VEGF ligand-receptor interactions |
| 0.4 | 1.2 | REACTOME BINDING AND ENTRY OF HIV VIRION | Genes involved in Binding and entry of HIV virion |
| 0.4 | 24.8 | REACTOME STRIATED MUSCLE CONTRACTION | Genes involved in Striated Muscle Contraction |
| 0.4 | 20.4 | REACTOME SIGNAL TRANSDUCTION BY L1 | Genes involved in Signal transduction by L1 |
| 0.4 | 10.1 | REACTOME HS GAG DEGRADATION | Genes involved in HS-GAG degradation |
| 0.4 | 13.1 | REACTOME O LINKED GLYCOSYLATION OF MUCINS | Genes involved in O-linked glycosylation of mucins |
| 0.4 | 13.8 | REACTOME REGULATION OF WATER BALANCE BY RENAL AQUAPORINS | Genes involved in Regulation of Water Balance by Renal Aquaporins |
| 0.4 | 2.6 | REACTOME ROLE OF SECOND MESSENGERS IN NETRIN1 SIGNALING | Genes involved in Role of second messengers in netrin-1 signaling |
| 0.4 | 3.6 | REACTOME POST TRANSLATIONAL MODIFICATION SYNTHESIS OF GPI ANCHORED PROTEINS | Genes involved in Post-translational modification: synthesis of GPI-anchored proteins |
| 0.4 | 8.6 | REACTOME G BETA GAMMA SIGNALLING THROUGH PLC BETA | Genes involved in G beta:gamma signalling through PLC beta |
| 0.4 | 1.8 | REACTOME CROSS PRESENTATION OF SOLUBLE EXOGENOUS ANTIGENS ENDOSOMES | Genes involved in Cross-presentation of soluble exogenous antigens (endosomes) |
| 0.3 | 1.7 | REACTOME HORMONE SENSITIVE LIPASE HSL MEDIATED TRIACYLGLYCEROL HYDROLYSIS | Genes involved in Hormone-sensitive lipase (HSL)-mediated triacylglycerol hydrolysis |
| 0.3 | 6.5 | REACTOME GLUCURONIDATION | Genes involved in Glucuronidation |
| 0.3 | 2.2 | REACTOME METABOLISM OF NUCLEOTIDES | Genes involved in Metabolism of nucleotides |
| 0.3 | 4.9 | REACTOME ORGANIC CATION ANION ZWITTERION TRANSPORT | Genes involved in Organic cation/anion/zwitterion transport |
| 0.3 | 1.3 | REACTOME NOD1 2 SIGNALING PATHWAY | Genes involved in NOD1/2 Signaling Pathway |
| 0.3 | 7.1 | REACTOME ACETYLCHOLINE BINDING AND DOWNSTREAM EVENTS | Genes involved in Acetylcholine Binding And Downstream Events |
| 0.3 | 2.8 | REACTOME N GLYCAN TRIMMING IN THE ER AND CALNEXIN CALRETICULIN CYCLE | Genes involved in N-glycan trimming in the ER and Calnexin/Calreticulin cycle |
| 0.3 | 4.0 | REACTOME TIE2 SIGNALING | Genes involved in Tie2 Signaling |
| 0.2 | 4.0 | REACTOME INTRINSIC PATHWAY FOR APOPTOSIS | Genes involved in Intrinsic Pathway for Apoptosis |
| 0.2 | 30.3 | REACTOME FACTORS INVOLVED IN MEGAKARYOCYTE DEVELOPMENT AND PLATELET PRODUCTION | Genes involved in Factors involved in megakaryocyte development and platelet production |
| 0.2 | 3.3 | REACTOME TRNA AMINOACYLATION | Genes involved in tRNA Aminoacylation |
| 0.2 | 3.3 | REACTOME GLUCOSE TRANSPORT | Genes involved in Glucose transport |
| 0.2 | 0.2 | REACTOME PROLONGED ERK ACTIVATION EVENTS | Genes involved in Prolonged ERK activation events |
| 0.2 | 2.6 | REACTOME SYNTHESIS OF PIPS AT THE LATE ENDOSOME MEMBRANE | Genes involved in Synthesis of PIPs at the late endosome membrane |
| 0.2 | 3.3 | REACTOME RIP MEDIATED NFKB ACTIVATION VIA DAI | Genes involved in RIP-mediated NFkB activation via DAI |
| 0.2 | 3.2 | REACTOME XENOBIOTICS | Genes involved in Xenobiotics |
| 0.2 | 0.5 | REACTOME IRON UPTAKE AND TRANSPORT | Genes involved in Iron uptake and transport |
| 0.2 | 1.6 | REACTOME CA DEPENDENT EVENTS | Genes involved in Ca-dependent events |
| 0.1 | 2.3 | REACTOME TETRAHYDROBIOPTERIN BH4 SYNTHESIS RECYCLING SALVAGE AND REGULATION | Genes involved in Tetrahydrobiopterin (BH4) synthesis, recycling, salvage and regulation |
| 0.1 | 2.1 | REACTOME NOTCH HLH TRANSCRIPTION PATHWAY | Genes involved in Notch-HLH transcription pathway |
| 0.1 | 1.7 | REACTOME THE NLRP3 INFLAMMASOME | Genes involved in The NLRP3 inflammasome |
| 0.1 | 4.0 | REACTOME GLUCOSE METABOLISM | Genes involved in Glucose metabolism |
| 0.1 | 13.7 | REACTOME METABOLISM OF CARBOHYDRATES | Genes involved in Metabolism of carbohydrates |
| 0.1 | 1.3 | REACTOME PROLACTIN RECEPTOR SIGNALING | Genes involved in Prolactin receptor signaling |
| 0.1 | 1.5 | REACTOME ACTIVATED TAK1 MEDIATES P38 MAPK ACTIVATION | Genes involved in activated TAK1 mediates p38 MAPK activation |
| 0.1 | 2.9 | REACTOME NETRIN1 SIGNALING | Genes involved in Netrin-1 signaling |
| 0.1 | 5.9 | REACTOME CELL DEATH SIGNALLING VIA NRAGE NRIF AND NADE | Genes involved in Cell death signalling via NRAGE, NRIF and NADE |
| 0.1 | 1.2 | REACTOME ENOS ACTIVATION AND REGULATION | Genes involved in eNOS activation and regulation |
| 0.1 | 0.3 | REACTOME SIGNALING BY SCF KIT | Genes involved in Signaling by SCF-KIT |
| 0.1 | 0.6 | REACTOME ANDROGEN BIOSYNTHESIS | Genes involved in Androgen biosynthesis |
| 0.1 | 0.6 | REACTOME REGULATION OF SIGNALING BY CBL | Genes involved in Regulation of signaling by CBL |
| 0.1 | 0.3 | REACTOME ANTIGEN ACTIVATES B CELL RECEPTOR LEADING TO GENERATION OF SECOND MESSENGERS | Genes involved in Antigen Activates B Cell Receptor Leading to Generation of Second Messengers |
| 0.0 | 0.6 | REACTOME LATENT INFECTION OF HOMO SAPIENS WITH MYCOBACTERIUM TUBERCULOSIS | Genes involved in Latent infection of Homo sapiens with Mycobacterium tuberculosis |
| 0.0 | 0.1 | REACTOME TGF BETA RECEPTOR SIGNALING ACTIVATES SMADS | Genes involved in TGF-beta receptor signaling activates SMADs |
| 0.0 | 0.1 | REACTOME METAL ION SLC TRANSPORTERS | Genes involved in Metal ion SLC transporters |
| 0.0 | 0.2 | REACTOME NEPHRIN INTERACTIONS | Genes involved in Nephrin interactions |
| 0.0 | 0.2 | REACTOME FGFR4 LIGAND BINDING AND ACTIVATION | Genes involved in FGFR4 ligand binding and activation |