Project
GNF SymAtlas + NCI-60 cancer cell lines, human (Su, 2004; Ross, 2000)
Navigation
Downloads
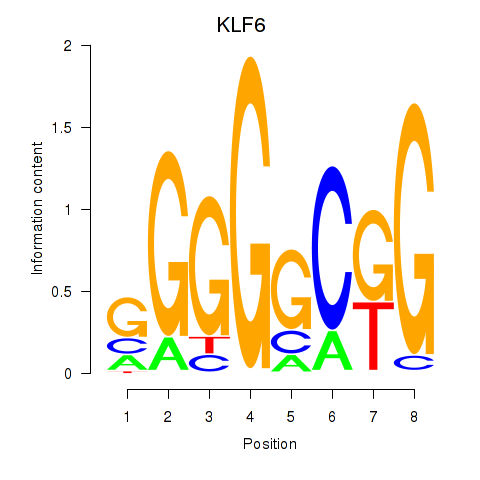
Results for KLF6
Z-value: 1.35
Motif logo
Transcription factors associated with KLF6
| Gene Symbol | Gene ID | Gene Info |
|---|---|---|
|
KLF6
|
ENSG00000067082.15 | KLF6 |
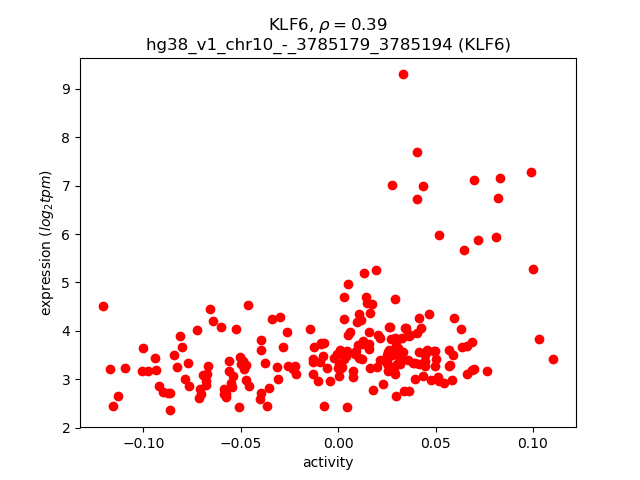
Activity-expression correlation:
| Gene | Promoter | Pearson corr. coef. | P-value | Plot |
|---|---|---|---|---|
| KLF6 | hg38_v1_chr10_-_3785179_3785194 | 0.39 | 3.9e-09 | Click! |
Activity profile of KLF6 motif
Sorted Z-values of KLF6 motif
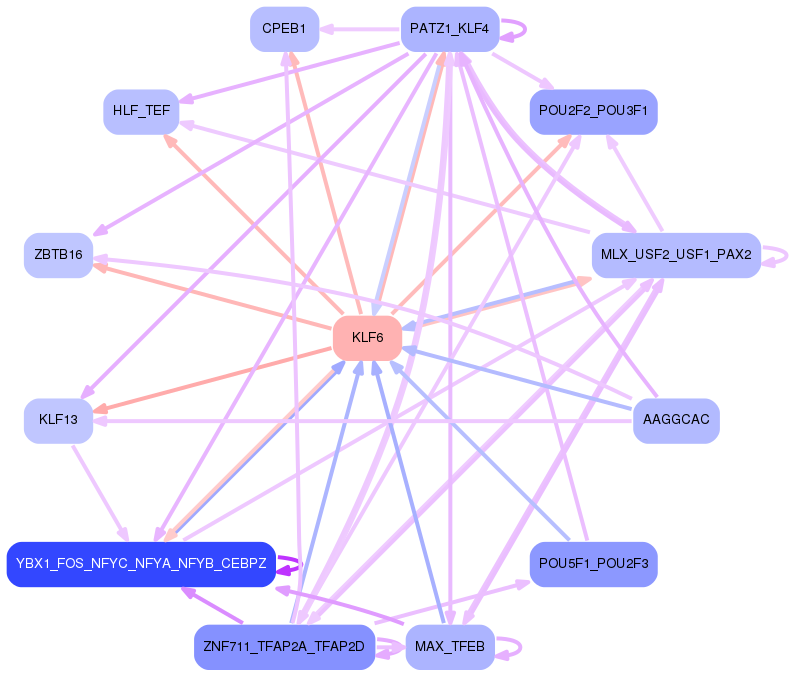
Network of associatons between targets according to the STRING database.

First level regulatory network of KLF6
Gene Ontology Analysis
Gene overrepresentation in biological process category:
| Log-likelihood per target | Total log-likelihood | Term | Description |
|---|---|---|---|
| 17.9 | 71.5 | GO:0006542 | glutamine biosynthetic process(GO:0006542) |
| 9.8 | 29.5 | GO:0001869 | regulation of complement activation, lectin pathway(GO:0001868) negative regulation of complement activation, lectin pathway(GO:0001869) |
| 6.7 | 26.8 | GO:0019074 | viral genome packaging(GO:0019072) viral RNA genome packaging(GO:0019074) |
| 5.0 | 15.0 | GO:1904017 | cellular response to Thyroglobulin triiodothyronine(GO:1904017) |
| 4.4 | 13.3 | GO:0098582 | innate vocalization behavior(GO:0098582) |
| 4.4 | 13.1 | GO:0009720 | detection of hormone stimulus(GO:0009720) |
| 4.4 | 13.1 | GO:0060988 | lipid tube assembly(GO:0060988) |
| 4.3 | 13.0 | GO:1900195 | positive regulation of oocyte maturation(GO:1900195) negative regulation of NLRP3 inflammasome complex assembly(GO:1900226) positive regulation of proteasomal ubiquitin-dependent protein catabolic process involved in cellular response to hypoxia(GO:2000777) |
| 4.1 | 12.4 | GO:1905064 | negative regulation of vascular smooth muscle cell differentiation(GO:1905064) |
| 3.9 | 11.7 | GO:0090155 | glucosylceramide biosynthetic process(GO:0006679) negative regulation of sphingolipid biosynthetic process(GO:0090155) negative regulation of ceramide biosynthetic process(GO:1900060) |
| 3.8 | 22.9 | GO:0051138 | positive regulation of NK T cell differentiation(GO:0051138) |
| 3.7 | 11.0 | GO:0014740 | negative regulation of muscle hyperplasia(GO:0014740) |
| 3.7 | 22.1 | GO:0090116 | C-5 methylation of cytosine(GO:0090116) |
| 3.5 | 66.0 | GO:1901897 | regulation of relaxation of cardiac muscle(GO:1901897) |
| 3.4 | 10.2 | GO:0070846 | misfolded protein transport(GO:0070843) polyubiquitinated protein transport(GO:0070844) polyubiquitinated misfolded protein transport(GO:0070845) Hsp90 deacetylation(GO:0070846) |
| 3.4 | 10.1 | GO:1900239 | phenotypic switching(GO:0036166) regulation of phenotypic switching(GO:1900239) |
| 3.2 | 12.7 | GO:2000325 | regulation of ligand-dependent nuclear receptor transcription coactivator activity(GO:2000325) positive regulation of ligand-dependent nuclear receptor transcription coactivator activity(GO:2000327) |
| 3.0 | 9.1 | GO:0043974 | histone H3-K27 acetylation(GO:0043974) regulation of histone H3-K27 acetylation(GO:1901674) |
| 3.0 | 3.0 | GO:1901078 | negative regulation of relaxation of muscle(GO:1901078) |
| 3.0 | 23.7 | GO:0046604 | positive regulation of mitotic centrosome separation(GO:0046604) |
| 2.9 | 20.0 | GO:0010961 | cellular magnesium ion homeostasis(GO:0010961) |
| 2.6 | 10.5 | GO:2001034 | positive regulation of double-strand break repair via nonhomologous end joining(GO:2001034) |
| 2.6 | 10.3 | GO:2000820 | negative regulation of transcription from RNA polymerase II promoter involved in smooth muscle cell differentiation(GO:2000820) |
| 2.4 | 7.2 | GO:0050720 | regulation of interleukin-1 biosynthetic process(GO:0045360) positive regulation of interleukin-1 biosynthetic process(GO:0045362) interleukin-1 beta biosynthetic process(GO:0050720) response to interleukin-8(GO:0098758) cellular response to interleukin-8(GO:0098759) regulation of progesterone biosynthetic process(GO:2000182) |
| 2.4 | 7.2 | GO:0048633 | positive regulation of skeletal muscle tissue growth(GO:0048633) |
| 2.4 | 9.6 | GO:0035625 | negative regulation of epinephrine secretion(GO:0032811) epidermal growth factor-activated receptor transactivation by G-protein coupled receptor signaling pathway(GO:0035625) |
| 2.3 | 9.4 | GO:0044467 | glial cell-derived neurotrophic factor secretion(GO:0044467) positive regulation of dopamine uptake involved in synaptic transmission(GO:0051586) positive regulation of catecholamine uptake involved in synaptic transmission(GO:0051944) regulation of glial cell-derived neurotrophic factor secretion(GO:1900166) positive regulation of glial cell-derived neurotrophic factor secretion(GO:1900168) |
| 2.3 | 7.0 | GO:1904933 | regulation of cell proliferation in midbrain(GO:1904933) |
| 2.3 | 23.0 | GO:0001574 | ganglioside biosynthetic process(GO:0001574) |
| 2.2 | 8.7 | GO:1904428 | negative regulation of tubulin deacetylation(GO:1904428) |
| 2.1 | 6.3 | GO:0035574 | histone H4-K20 demethylation(GO:0035574) |
| 2.0 | 8.2 | GO:0000430 | carbon catabolite regulation of transcription from RNA polymerase II promoter(GO:0000429) regulation of transcription from RNA polymerase II promoter by glucose(GO:0000430) positive regulation of transcription from RNA polymerase II promoter by glucose(GO:0000432) carbon catabolite activation of transcription from RNA polymerase II promoter(GO:0000436) late viral transcription(GO:0019086) |
| 2.0 | 14.1 | GO:0070127 | tRNA aminoacylation for mitochondrial protein translation(GO:0070127) |
| 2.0 | 4.0 | GO:1904693 | midbrain morphogenesis(GO:1904693) |
| 2.0 | 10.0 | GO:0030070 | insulin processing(GO:0030070) |
| 2.0 | 5.9 | GO:1901857 | neuron intrinsic apoptotic signaling pathway in response to hydrogen peroxide(GO:0036482) positive regulation of cellular respiration(GO:1901857) positive regulation of mitochondrial electron transport, NADH to ubiquinone(GO:1902958) regulation of hydrogen peroxide-induced neuron intrinsic apoptotic signaling pathway(GO:1903383) negative regulation of hydrogen peroxide-induced neuron intrinsic apoptotic signaling pathway(GO:1903384) |
| 2.0 | 11.7 | GO:1900454 | positive regulation of long term synaptic depression(GO:1900454) |
| 1.9 | 1.9 | GO:0097374 | sensory neuron axon guidance(GO:0097374) |
| 1.9 | 3.8 | GO:0036515 | serotonergic neuron axon guidance(GO:0036515) |
| 1.9 | 7.7 | GO:1900169 | regulation of glucocorticoid mediated signaling pathway(GO:1900169) |
| 1.9 | 11.3 | GO:0030644 | cellular chloride ion homeostasis(GO:0030644) |
| 1.9 | 7.4 | GO:0018231 | peptidyl-L-cysteine S-palmitoylation(GO:0018230) peptidyl-S-diacylglycerol-L-cysteine biosynthetic process from peptidyl-cysteine(GO:0018231) |
| 1.9 | 5.6 | GO:1990166 | protein localization to site of double-strand break(GO:1990166) |
| 1.8 | 5.5 | GO:0048073 | regulation of eye pigmentation(GO:0048073) |
| 1.8 | 10.6 | GO:1904628 | response to phorbol 13-acetate 12-myristate(GO:1904627) cellular response to phorbol 13-acetate 12-myristate(GO:1904628) |
| 1.7 | 5.2 | GO:2000118 | regulation of sodium-dependent phosphate transport(GO:2000118) |
| 1.7 | 6.7 | GO:0097411 | hypoxia-inducible factor-1alpha signaling pathway(GO:0097411) |
| 1.7 | 6.7 | GO:0003219 | cardiac right ventricle formation(GO:0003219) |
| 1.6 | 19.3 | GO:0045647 | negative regulation of erythrocyte differentiation(GO:0045647) |
| 1.6 | 4.8 | GO:1902263 | apoptotic process involved in embryonic digit morphogenesis(GO:1902263) |
| 1.6 | 4.8 | GO:0018125 | peptidyl-cysteine methylation(GO:0018125) |
| 1.6 | 4.8 | GO:0008078 | mesodermal cell migration(GO:0008078) corticotropin hormone secreting cell differentiation(GO:0060128) |
| 1.6 | 4.8 | GO:1904395 | positive regulation of skeletal muscle acetylcholine-gated channel clustering(GO:1904395) |
| 1.6 | 22.3 | GO:0021942 | radial glia guided migration of Purkinje cell(GO:0021942) |
| 1.6 | 6.2 | GO:0043375 | negative regulation of cellular pH reduction(GO:0032848) CD8-positive, alpha-beta T cell lineage commitment(GO:0043375) negative regulation of retinal cell programmed cell death(GO:0046671) |
| 1.5 | 4.5 | GO:0097534 | lymphoid lineage cell migration(GO:0097534) lymphoid lineage cell migration into thymus(GO:0097535) |
| 1.5 | 3.0 | GO:0003308 | negative regulation of Wnt signaling pathway involved in heart development(GO:0003308) |
| 1.5 | 7.5 | GO:0048105 | establishment of body hair or bristle planar orientation(GO:0048104) establishment of body hair planar orientation(GO:0048105) |
| 1.5 | 13.3 | GO:1902527 | hypothalamus gonadotrophin-releasing hormone neuron differentiation(GO:0021886) hypothalamus gonadotrophin-releasing hormone neuron development(GO:0021888) fat pad development(GO:0060613) positive regulation of protein monoubiquitination(GO:1902527) |
| 1.4 | 4.3 | GO:0015871 | choline transport(GO:0015871) |
| 1.4 | 5.8 | GO:0060010 | Sertoli cell fate commitment(GO:0060010) |
| 1.4 | 2.8 | GO:0036486 | trunk segmentation(GO:0035290) trunk neural crest cell migration(GO:0036484) ventral trunk neural crest cell migration(GO:0036486) |
| 1.4 | 11.2 | GO:0002741 | positive regulation of cytokine secretion involved in immune response(GO:0002741) |
| 1.4 | 5.5 | GO:0034773 | histone H4-K20 trimethylation(GO:0034773) |
| 1.4 | 4.1 | GO:0001839 | neural plate morphogenesis(GO:0001839) neural plate elongation(GO:0014022) convergent extension involved in neural plate elongation(GO:0022007) |
| 1.4 | 5.4 | GO:0072137 | cell migration involved in endocardial cushion formation(GO:0003273) condensed mesenchymal cell proliferation(GO:0072137) |
| 1.3 | 4.0 | GO:2000417 | negative regulation of eosinophil migration(GO:2000417) |
| 1.3 | 4.0 | GO:0090038 | negative regulation of protein kinase C signaling(GO:0090038) |
| 1.3 | 4.0 | GO:0035544 | negative regulation of SNARE complex assembly(GO:0035544) |
| 1.3 | 3.9 | GO:0019075 | virus maturation(GO:0019075) |
| 1.3 | 3.9 | GO:0071486 | response to high light intensity(GO:0009644) cellular response to light intensity(GO:0071484) cellular response to high light intensity(GO:0071486) retinal rod cell apoptotic process(GO:0097473) retinal cell apoptotic process(GO:1990009) |
| 1.3 | 5.2 | GO:0060741 | prostate gland stromal morphogenesis(GO:0060741) |
| 1.3 | 2.5 | GO:0035990 | tendon cell differentiation(GO:0035990) tendon formation(GO:0035992) |
| 1.2 | 18.6 | GO:0045721 | negative regulation of gluconeogenesis(GO:0045721) |
| 1.2 | 13.4 | GO:1904262 | negative regulation of TORC1 signaling(GO:1904262) |
| 1.2 | 6.1 | GO:1902613 | regulation of anti-Mullerian hormone signaling pathway(GO:1902612) negative regulation of anti-Mullerian hormone signaling pathway(GO:1902613) anti-Mullerian hormone signaling pathway(GO:1990262) |
| 1.2 | 2.4 | GO:2001274 | negative regulation of glucose import in response to insulin stimulus(GO:2001274) |
| 1.2 | 9.6 | GO:0070164 | negative regulation of adiponectin secretion(GO:0070164) |
| 1.2 | 3.6 | GO:1900194 | negative regulation of oocyte maturation(GO:1900194) |
| 1.2 | 7.1 | GO:0033129 | positive regulation of histone phosphorylation(GO:0033129) positive regulation of mRNA binding(GO:1902416) |
| 1.2 | 5.9 | GO:2000382 | positive regulation of mesoderm development(GO:2000382) |
| 1.2 | 4.7 | GO:1990737 | regulation of endoplasmic reticulum stress-induced eIF2 alpha phosphorylation(GO:0060734) response to manganese-induced endoplasmic reticulum stress(GO:1990737) |
| 1.1 | 3.3 | GO:0044805 | late nucleophagy(GO:0044805) |
| 1.1 | 5.5 | GO:0033133 | positive regulation of glucokinase activity(GO:0033133) |
| 1.1 | 4.4 | GO:2000170 | positive regulation of peptidyl-cysteine S-nitrosylation(GO:2000170) |
| 1.1 | 6.5 | GO:0032483 | regulation of Rab protein signal transduction(GO:0032483) |
| 1.1 | 11.8 | GO:2000427 | positive regulation of apoptotic cell clearance(GO:2000427) |
| 1.1 | 4.3 | GO:0033159 | negative regulation of protein import into nucleus, translocation(GO:0033159) |
| 1.1 | 5.3 | GO:0030950 | establishment or maintenance of actin cytoskeleton polarity(GO:0030950) |
| 1.1 | 4.2 | GO:1900019 | regulation of protein kinase C activity(GO:1900019) positive regulation of protein kinase C activity(GO:1900020) |
| 1.0 | 7.3 | GO:0033029 | regulation of neutrophil apoptotic process(GO:0033029) |
| 1.0 | 6.2 | GO:0035616 | histone H2B conserved C-terminal lysine deubiquitination(GO:0035616) |
| 1.0 | 11.4 | GO:1902746 | regulation of lens fiber cell differentiation(GO:1902746) |
| 1.0 | 10.4 | GO:2000766 | negative regulation of cytoplasmic translation(GO:2000766) |
| 1.0 | 3.1 | GO:0021979 | hypothalamus cell differentiation(GO:0021979) |
| 1.0 | 9.2 | GO:1903748 | negative regulation of establishment of protein localization to mitochondrion(GO:1903748) |
| 1.0 | 4.0 | GO:1904327 | protein localization to cytosolic proteasome complex(GO:1904327) protein localization to cytosolic proteasome complex involved in ERAD pathway(GO:1904379) |
| 1.0 | 11.0 | GO:0097116 | gephyrin clustering involved in postsynaptic density assembly(GO:0097116) |
| 1.0 | 3.0 | GO:0021779 | spinal cord oligodendrocyte cell differentiation(GO:0021529) spinal cord oligodendrocyte cell fate specification(GO:0021530) oligodendrocyte cell fate specification(GO:0021778) oligodendrocyte cell fate commitment(GO:0021779) glial cell fate specification(GO:0021780) |
| 1.0 | 4.8 | GO:0060718 | chorionic trophoblast cell differentiation(GO:0060718) |
| 1.0 | 8.7 | GO:0060075 | regulation of resting membrane potential(GO:0060075) |
| 0.9 | 8.5 | GO:1905232 | cellular response to L-glutamate(GO:1905232) |
| 0.9 | 16.9 | GO:0050966 | detection of mechanical stimulus involved in sensory perception of pain(GO:0050966) |
| 0.9 | 6.6 | GO:0015870 | acetylcholine transport(GO:0015870) |
| 0.9 | 3.7 | GO:0050893 | sensory processing(GO:0050893) |
| 0.9 | 4.6 | GO:0008063 | Toll signaling pathway(GO:0008063) |
| 0.9 | 9.0 | GO:2000786 | positive regulation of autophagosome assembly(GO:2000786) |
| 0.9 | 4.5 | GO:0042986 | positive regulation of amyloid precursor protein biosynthetic process(GO:0042986) |
| 0.9 | 7.9 | GO:2000821 | regulation of grooming behavior(GO:2000821) |
| 0.8 | 5.9 | GO:0060235 | lens induction in camera-type eye(GO:0060235) |
| 0.8 | 8.2 | GO:0031053 | primary miRNA processing(GO:0031053) |
| 0.8 | 26.1 | GO:0045187 | regulation of circadian sleep/wake cycle, sleep(GO:0045187) |
| 0.8 | 7.3 | GO:0042670 | retinal cone cell differentiation(GO:0042670) retinal cone cell development(GO:0046549) |
| 0.8 | 6.4 | GO:0045955 | negative regulation of calcium ion-dependent exocytosis(GO:0045955) |
| 0.8 | 3.9 | GO:0042754 | negative regulation of circadian rhythm(GO:0042754) |
| 0.8 | 8.6 | GO:0006346 | methylation-dependent chromatin silencing(GO:0006346) |
| 0.8 | 7.8 | GO:0001731 | formation of translation preinitiation complex(GO:0001731) |
| 0.8 | 3.1 | GO:0035948 | positive regulation of gluconeogenesis by positive regulation of transcription from RNA polymerase II promoter(GO:0035948) |
| 0.8 | 6.1 | GO:0061368 | behavioral response to chemical pain(GO:0061366) behavioral response to formalin induced pain(GO:0061368) |
| 0.7 | 3.0 | GO:0007440 | foregut morphogenesis(GO:0007440) embryonic foregut morphogenesis(GO:0048617) |
| 0.7 | 9.7 | GO:0051823 | regulation of synapse structural plasticity(GO:0051823) |
| 0.7 | 3.0 | GO:0086021 | SA node cell to atrial cardiac muscle cell communication by electrical coupling(GO:0086021) AV node cell to bundle of His cell communication by electrical coupling(GO:0086053) |
| 0.7 | 17.0 | GO:0006895 | Golgi to endosome transport(GO:0006895) |
| 0.7 | 2.2 | GO:0051230 | mitotic spindle disassembly(GO:0051228) spindle disassembly(GO:0051230) |
| 0.7 | 4.4 | GO:0045079 | negative regulation of chemokine biosynthetic process(GO:0045079) |
| 0.7 | 2.9 | GO:0036269 | swimming behavior(GO:0036269) |
| 0.7 | 2.9 | GO:0015910 | peroxisomal long-chain fatty acid import(GO:0015910) |
| 0.7 | 12.2 | GO:0042753 | positive regulation of circadian rhythm(GO:0042753) |
| 0.7 | 9.1 | GO:0033617 | mitochondrial respiratory chain complex IV assembly(GO:0033617) |
| 0.7 | 9.0 | GO:0060992 | response to fungicide(GO:0060992) |
| 0.7 | 2.1 | GO:0060028 | somatic muscle development(GO:0007525) convergent extension involved in axis elongation(GO:0060028) |
| 0.7 | 2.1 | GO:0010746 | regulation of plasma membrane long-chain fatty acid transport(GO:0010746) negative regulation of plasma membrane long-chain fatty acid transport(GO:0010748) |
| 0.7 | 1.3 | GO:0097676 | histone H3-K36 dimethylation(GO:0097676) |
| 0.7 | 4.0 | GO:1902075 | cellular response to salt(GO:1902075) |
| 0.7 | 10.6 | GO:0038092 | nodal signaling pathway(GO:0038092) |
| 0.7 | 17.1 | GO:0031167 | rRNA methylation(GO:0031167) |
| 0.6 | 5.2 | GO:0051152 | positive regulation of smooth muscle cell differentiation(GO:0051152) |
| 0.6 | 5.8 | GO:1904684 | negative regulation of metalloendopeptidase activity(GO:1904684) |
| 0.6 | 13.4 | GO:0060272 | embryonic skeletal joint morphogenesis(GO:0060272) |
| 0.6 | 8.2 | GO:0039536 | negative regulation of RIG-I signaling pathway(GO:0039536) |
| 0.6 | 7.6 | GO:0001675 | acrosome assembly(GO:0001675) |
| 0.6 | 3.2 | GO:0032525 | somite rostral/caudal axis specification(GO:0032525) |
| 0.6 | 3.7 | GO:1990504 | dense core granule exocytosis(GO:1990504) |
| 0.6 | 11.0 | GO:0043984 | histone H4-K16 acetylation(GO:0043984) |
| 0.6 | 2.4 | GO:0035582 | sequestering of BMP in extracellular matrix(GO:0035582) |
| 0.6 | 4.8 | GO:0045054 | constitutive secretory pathway(GO:0045054) |
| 0.6 | 10.2 | GO:0098828 | positive regulation of inhibitory postsynaptic potential(GO:0097151) modulation of inhibitory postsynaptic potential(GO:0098828) |
| 0.6 | 9.5 | GO:0051014 | actin filament severing(GO:0051014) |
| 0.6 | 7.1 | GO:0042373 | vitamin K metabolic process(GO:0042373) |
| 0.6 | 4.1 | GO:0007549 | dosage compensation(GO:0007549) dosage compensation by inactivation of X chromosome(GO:0009048) |
| 0.6 | 5.2 | GO:0051045 | negative regulation of membrane protein ectodomain proteolysis(GO:0051045) |
| 0.6 | 9.8 | GO:1900103 | positive regulation of endoplasmic reticulum unfolded protein response(GO:1900103) |
| 0.6 | 3.4 | GO:0090166 | Golgi disassembly(GO:0090166) |
| 0.6 | 4.5 | GO:0006390 | transcription from mitochondrial promoter(GO:0006390) |
| 0.6 | 5.0 | GO:0090650 | response to oxygen-glucose deprivation(GO:0090649) cellular response to oxygen-glucose deprivation(GO:0090650) |
| 0.5 | 4.4 | GO:0006013 | mannose metabolic process(GO:0006013) |
| 0.5 | 4.4 | GO:0016188 | synaptic vesicle maturation(GO:0016188) |
| 0.5 | 2.7 | GO:0007197 | adenylate cyclase-inhibiting G-protein coupled acetylcholine receptor signaling pathway(GO:0007197) |
| 0.5 | 7.0 | GO:0021670 | lateral ventricle development(GO:0021670) |
| 0.5 | 46.7 | GO:0043966 | histone H3 acetylation(GO:0043966) |
| 0.5 | 2.6 | GO:0086048 | regulation of ventricular cardiac muscle cell membrane depolarization(GO:0060373) membrane depolarization during bundle of His cell action potential(GO:0086048) |
| 0.5 | 4.2 | GO:0031340 | positive regulation of vesicle fusion(GO:0031340) |
| 0.5 | 2.1 | GO:0048861 | leukemia inhibitory factor signaling pathway(GO:0048861) |
| 0.5 | 5.5 | GO:0003263 | cardioblast proliferation(GO:0003263) regulation of cardioblast proliferation(GO:0003264) |
| 0.5 | 12.3 | GO:0032703 | negative regulation of interleukin-2 production(GO:0032703) |
| 0.5 | 4.4 | GO:0060068 | vagina development(GO:0060068) |
| 0.5 | 10.7 | GO:0045109 | intermediate filament organization(GO:0045109) |
| 0.5 | 5.8 | GO:1990118 | sodium ion import across plasma membrane(GO:0098719) sodium ion import into cell(GO:1990118) |
| 0.5 | 1.4 | GO:0021558 | trochlear nerve development(GO:0021558) |
| 0.4 | 1.8 | GO:0002541 | activation of plasma proteins involved in acute inflammatory response(GO:0002541) |
| 0.4 | 4.9 | GO:0048671 | negative regulation of collateral sprouting(GO:0048671) |
| 0.4 | 11.2 | GO:0032515 | negative regulation of phosphoprotein phosphatase activity(GO:0032515) |
| 0.4 | 3.5 | GO:0060052 | neurofilament cytoskeleton organization(GO:0060052) |
| 0.4 | 2.6 | GO:1902949 | positive regulation of tau-protein kinase activity(GO:1902949) |
| 0.4 | 2.1 | GO:1901090 | regulation of protein tetramerization(GO:1901090) negative regulation of protein tetramerization(GO:1901091) regulation of protein homotetramerization(GO:1901093) negative regulation of protein homotetramerization(GO:1901094) |
| 0.4 | 1.3 | GO:2000463 | positive regulation of excitatory postsynaptic potential(GO:2000463) |
| 0.4 | 1.7 | GO:0060023 | soft palate development(GO:0060023) |
| 0.4 | 2.4 | GO:0070829 | response to vitamin B2(GO:0033274) heterochromatin maintenance(GO:0070829) |
| 0.4 | 0.8 | GO:0038162 | erythropoietin-mediated signaling pathway(GO:0038162) |
| 0.4 | 2.0 | GO:0015961 | diadenosine polyphosphate catabolic process(GO:0015961) diphosphoinositol polyphosphate metabolic process(GO:0071543) diadenosine pentaphosphate metabolic process(GO:1901906) diadenosine pentaphosphate catabolic process(GO:1901907) diadenosine hexaphosphate metabolic process(GO:1901908) diadenosine hexaphosphate catabolic process(GO:1901909) adenosine 5'-(hexahydrogen pentaphosphate) metabolic process(GO:1901910) adenosine 5'-(hexahydrogen pentaphosphate) catabolic process(GO:1901911) |
| 0.4 | 6.8 | GO:0003323 | type B pancreatic cell development(GO:0003323) |
| 0.4 | 37.9 | GO:0071277 | cellular response to calcium ion(GO:0071277) |
| 0.4 | 1.6 | GO:0003309 | type B pancreatic cell differentiation(GO:0003309) |
| 0.4 | 16.6 | GO:0050885 | neuromuscular process controlling balance(GO:0050885) |
| 0.4 | 1.9 | GO:0060971 | embryonic heart tube left/right pattern formation(GO:0060971) fasciculation of sensory neuron axon(GO:0097155) |
| 0.4 | 1.8 | GO:0035865 | cellular response to potassium ion(GO:0035865) |
| 0.4 | 19.0 | GO:0036465 | synaptic vesicle recycling(GO:0036465) |
| 0.4 | 3.6 | GO:0070544 | histone H3-K36 demethylation(GO:0070544) |
| 0.4 | 3.6 | GO:0010764 | negative regulation of fibroblast migration(GO:0010764) |
| 0.4 | 3.2 | GO:0036066 | protein O-linked fucosylation(GO:0036066) |
| 0.4 | 11.4 | GO:0009083 | branched-chain amino acid catabolic process(GO:0009083) |
| 0.4 | 2.8 | GO:0006452 | translational frameshifting(GO:0006452) positive regulation of translational termination(GO:0045905) |
| 0.4 | 5.3 | GO:1904152 | regulation of retrograde protein transport, ER to cytosol(GO:1904152) |
| 0.4 | 9.2 | GO:0043666 | regulation of phosphoprotein phosphatase activity(GO:0043666) |
| 0.3 | 2.7 | GO:2000507 | positive regulation of energy homeostasis(GO:2000507) |
| 0.3 | 9.0 | GO:0032012 | regulation of ARF protein signal transduction(GO:0032012) |
| 0.3 | 3.9 | GO:0060689 | cell differentiation involved in salivary gland development(GO:0060689) |
| 0.3 | 7.6 | GO:0036152 | phosphatidylethanolamine acyl-chain remodeling(GO:0036152) |
| 0.3 | 12.6 | GO:0007099 | centriole replication(GO:0007099) |
| 0.3 | 2.4 | GO:0044351 | macropinocytosis(GO:0044351) |
| 0.3 | 3.6 | GO:0048670 | regulation of collateral sprouting(GO:0048670) |
| 0.3 | 0.9 | GO:0034499 | late endosome to Golgi transport(GO:0034499) |
| 0.3 | 1.8 | GO:0001714 | endodermal cell fate specification(GO:0001714) |
| 0.3 | 5.9 | GO:0035728 | response to hepatocyte growth factor(GO:0035728) |
| 0.3 | 4.7 | GO:0018345 | protein palmitoylation(GO:0018345) |
| 0.3 | 4.9 | GO:1903543 | positive regulation of exosomal secretion(GO:1903543) |
| 0.3 | 4.6 | GO:0003376 | sphingosine-1-phosphate signaling pathway(GO:0003376) |
| 0.3 | 1.4 | GO:0055059 | asymmetric neuroblast division(GO:0055059) |
| 0.3 | 2.3 | GO:0070257 | positive regulation of synaptic transmission, GABAergic(GO:0032230) regulation of mucus secretion(GO:0070255) positive regulation of mucus secretion(GO:0070257) |
| 0.3 | 7.4 | GO:0032098 | regulation of appetite(GO:0032098) |
| 0.3 | 2.5 | GO:0060452 | positive regulation of cardiac muscle contraction(GO:0060452) |
| 0.3 | 4.3 | GO:0045199 | maintenance of apical/basal cell polarity(GO:0035090) maintenance of epithelial cell apical/basal polarity(GO:0045199) |
| 0.3 | 7.2 | GO:0022011 | myelination in peripheral nervous system(GO:0022011) peripheral nervous system axon ensheathment(GO:0032292) |
| 0.3 | 10.9 | GO:0006699 | bile acid biosynthetic process(GO:0006699) |
| 0.3 | 6.3 | GO:0045332 | lipid translocation(GO:0034204) phospholipid translocation(GO:0045332) |
| 0.3 | 2.1 | GO:0032534 | regulation of microvillus assembly(GO:0032534) |
| 0.3 | 1.3 | GO:2001271 | negative regulation of cysteine-type endopeptidase activity involved in execution phase of apoptosis(GO:2001271) |
| 0.3 | 1.6 | GO:0021999 | neural plate anterior/posterior regionalization(GO:0021999) |
| 0.3 | 3.3 | GO:0033235 | positive regulation of protein sumoylation(GO:0033235) |
| 0.3 | 2.8 | GO:0043249 | erythrocyte maturation(GO:0043249) |
| 0.3 | 0.3 | GO:0060266 | negative regulation of respiratory burst involved in inflammatory response(GO:0060266) negative regulation of respiratory burst(GO:0060268) |
| 0.2 | 5.0 | GO:0070816 | phosphorylation of RNA polymerase II C-terminal domain(GO:0070816) |
| 0.2 | 2.5 | GO:0042985 | negative regulation of amyloid precursor protein biosynthetic process(GO:0042985) |
| 0.2 | 3.7 | GO:0007258 | JUN phosphorylation(GO:0007258) |
| 0.2 | 3.6 | GO:2001286 | regulation of caveolin-mediated endocytosis(GO:2001286) |
| 0.2 | 4.0 | GO:0007289 | spermatid nucleus differentiation(GO:0007289) |
| 0.2 | 4.0 | GO:0033539 | fatty acid beta-oxidation using acyl-CoA dehydrogenase(GO:0033539) |
| 0.2 | 2.8 | GO:1902894 | negative regulation of pri-miRNA transcription from RNA polymerase II promoter(GO:1902894) |
| 0.2 | 3.0 | GO:0015986 | energy coupled proton transport, down electrochemical gradient(GO:0015985) ATP synthesis coupled proton transport(GO:0015986) |
| 0.2 | 3.2 | GO:0060716 | labyrinthine layer blood vessel development(GO:0060716) |
| 0.2 | 3.4 | GO:0045475 | locomotor rhythm(GO:0045475) |
| 0.2 | 4.5 | GO:0016254 | preassembly of GPI anchor in ER membrane(GO:0016254) |
| 0.2 | 4.9 | GO:0006884 | cell volume homeostasis(GO:0006884) |
| 0.2 | 0.7 | GO:0001831 | trophectodermal cellular morphogenesis(GO:0001831) |
| 0.2 | 1.3 | GO:0006651 | diacylglycerol biosynthetic process(GO:0006651) |
| 0.2 | 2.5 | GO:2000574 | regulation of microtubule motor activity(GO:2000574) |
| 0.2 | 1.4 | GO:0060219 | camera-type eye photoreceptor cell differentiation(GO:0060219) |
| 0.2 | 2.0 | GO:0060124 | positive regulation of growth hormone secretion(GO:0060124) |
| 0.2 | 3.7 | GO:1901522 | positive regulation of transcription from RNA polymerase II promoter involved in cellular response to chemical stimulus(GO:1901522) |
| 0.2 | 4.6 | GO:0050995 | negative regulation of lipid catabolic process(GO:0050995) |
| 0.2 | 1.9 | GO:0045163 | clustering of voltage-gated potassium channels(GO:0045163) |
| 0.2 | 1.1 | GO:1901727 | positive regulation of histone deacetylase activity(GO:1901727) |
| 0.2 | 0.6 | GO:1903288 | positive regulation of potassium ion import(GO:1903288) |
| 0.2 | 2.8 | GO:0060122 | inner ear receptor stereocilium organization(GO:0060122) |
| 0.2 | 3.9 | GO:0000042 | protein targeting to Golgi(GO:0000042) |
| 0.2 | 1.8 | GO:0030252 | growth hormone secretion(GO:0030252) |
| 0.2 | 3.4 | GO:0006012 | galactose metabolic process(GO:0006012) |
| 0.2 | 2.6 | GO:0051567 | histone H3-K9 methylation(GO:0051567) |
| 0.2 | 2.4 | GO:0032957 | inositol trisphosphate metabolic process(GO:0032957) |
| 0.2 | 4.0 | GO:0043011 | myeloid dendritic cell differentiation(GO:0043011) |
| 0.2 | 1.7 | GO:0060117 | auditory receptor cell development(GO:0060117) |
| 0.2 | 1.0 | GO:0048170 | positive regulation of long-term neuronal synaptic plasticity(GO:0048170) |
| 0.2 | 3.1 | GO:0034656 | nucleobase-containing small molecule catabolic process(GO:0034656) |
| 0.2 | 1.5 | GO:0034427 | nuclear-transcribed mRNA catabolic process, exonucleolytic, 3'-5'(GO:0034427) |
| 0.2 | 0.6 | GO:0033564 | anterior/posterior axon guidance(GO:0033564) |
| 0.2 | 0.3 | GO:0070459 | prolactin secretion(GO:0070459) |
| 0.2 | 3.0 | GO:0070914 | UV-damage excision repair(GO:0070914) |
| 0.2 | 3.8 | GO:0007616 | long-term memory(GO:0007616) |
| 0.2 | 5.3 | GO:0007194 | negative regulation of adenylate cyclase activity(GO:0007194) |
| 0.2 | 0.8 | GO:0003069 | age-dependent response to oxidative stress(GO:0001306) age-dependent response to reactive oxygen species(GO:0001315) regulation of systemic arterial blood pressure by acetylcholine(GO:0003068) vasodilation by acetylcholine involved in regulation of systemic arterial blood pressure(GO:0003069) regulation of systemic arterial blood pressure by neurotransmitter(GO:0003070) age-dependent general metabolic decline(GO:0007571) |
| 0.2 | 4.1 | GO:0043518 | negative regulation of DNA damage response, signal transduction by p53 class mediator(GO:0043518) |
| 0.2 | 3.9 | GO:0090200 | positive regulation of release of cytochrome c from mitochondria(GO:0090200) |
| 0.1 | 8.5 | GO:0032465 | regulation of cytokinesis(GO:0032465) |
| 0.1 | 8.3 | GO:0030490 | maturation of SSU-rRNA(GO:0030490) |
| 0.1 | 3.7 | GO:0048665 | neuron fate specification(GO:0048665) |
| 0.1 | 3.2 | GO:0030517 | negative regulation of axon extension(GO:0030517) |
| 0.1 | 9.6 | GO:0007218 | neuropeptide signaling pathway(GO:0007218) |
| 0.1 | 6.7 | GO:0030279 | negative regulation of ossification(GO:0030279) |
| 0.1 | 0.7 | GO:0035694 | negative regulation of mitochondrial membrane potential(GO:0010917) mitochondrial protein catabolic process(GO:0035694) negative regulation of membrane potential(GO:0045837) |
| 0.1 | 1.2 | GO:0098870 | neuronal action potential propagation(GO:0019227) clustering of voltage-gated sodium channels(GO:0045162) action potential propagation(GO:0098870) |
| 0.1 | 4.5 | GO:0032456 | endocytic recycling(GO:0032456) |
| 0.1 | 6.3 | GO:0000289 | nuclear-transcribed mRNA poly(A) tail shortening(GO:0000289) |
| 0.1 | 1.3 | GO:0016576 | histone dephosphorylation(GO:0016576) |
| 0.1 | 1.1 | GO:1904380 | endoplasmic reticulum mannose trimming(GO:1904380) |
| 0.1 | 11.6 | GO:0090630 | activation of GTPase activity(GO:0090630) |
| 0.1 | 1.6 | GO:0042940 | serine transport(GO:0032329) D-amino acid transport(GO:0042940) |
| 0.1 | 2.8 | GO:0016973 | poly(A)+ mRNA export from nucleus(GO:0016973) |
| 0.1 | 14.8 | GO:0035335 | peptidyl-tyrosine dephosphorylation(GO:0035335) |
| 0.1 | 1.8 | GO:0006020 | inositol metabolic process(GO:0006020) |
| 0.1 | 4.1 | GO:0030206 | chondroitin sulfate biosynthetic process(GO:0030206) |
| 0.1 | 4.2 | GO:1901998 | toxin transport(GO:1901998) |
| 0.1 | 1.2 | GO:0015851 | nucleobase transport(GO:0015851) |
| 0.1 | 3.1 | GO:0048265 | response to pain(GO:0048265) |
| 0.1 | 2.2 | GO:0006044 | N-acetylglucosamine metabolic process(GO:0006044) |
| 0.1 | 1.5 | GO:0009396 | folic acid-containing compound biosynthetic process(GO:0009396) |
| 0.1 | 5.3 | GO:0045453 | bone resorption(GO:0045453) |
| 0.1 | 0.8 | GO:2000271 | positive regulation of fibroblast apoptotic process(GO:2000271) |
| 0.1 | 1.6 | GO:0060445 | branching involved in salivary gland morphogenesis(GO:0060445) |
| 0.1 | 8.3 | GO:0006970 | response to osmotic stress(GO:0006970) |
| 0.1 | 1.5 | GO:0060907 | positive regulation of macrophage cytokine production(GO:0060907) |
| 0.1 | 4.2 | GO:1901385 | regulation of voltage-gated calcium channel activity(GO:1901385) |
| 0.1 | 0.6 | GO:0071692 | sequestering of TGFbeta in extracellular matrix(GO:0035583) protein localization to extracellular region(GO:0071692) maintenance of protein location in extracellular region(GO:0071694) |
| 0.1 | 2.0 | GO:0060976 | coronary vasculature development(GO:0060976) |
| 0.1 | 2.5 | GO:0090102 | cochlea development(GO:0090102) |
| 0.1 | 3.4 | GO:0043403 | skeletal muscle tissue regeneration(GO:0043403) |
| 0.1 | 2.1 | GO:0014047 | glutamate secretion(GO:0014047) |
| 0.1 | 3.1 | GO:0002755 | MyD88-dependent toll-like receptor signaling pathway(GO:0002755) |
| 0.1 | 0.4 | GO:0034378 | chylomicron assembly(GO:0034378) |
| 0.1 | 10.4 | GO:0051262 | protein tetramerization(GO:0051262) |
| 0.1 | 0.3 | GO:0061734 | parkin-mediated mitophagy in response to mitochondrial depolarization(GO:0061734) |
| 0.1 | 1.9 | GO:0006359 | regulation of transcription from RNA polymerase III promoter(GO:0006359) |
| 0.1 | 1.7 | GO:0071108 | protein K48-linked deubiquitination(GO:0071108) |
| 0.1 | 3.5 | GO:1901216 | positive regulation of neuron death(GO:1901216) |
| 0.1 | 1.3 | GO:0032007 | negative regulation of TOR signaling(GO:0032007) |
| 0.1 | 2.5 | GO:0051646 | mitochondrion localization(GO:0051646) |
| 0.1 | 0.3 | GO:0008090 | retrograde axonal transport(GO:0008090) |
| 0.1 | 1.1 | GO:0044872 | vitamin D metabolic process(GO:0042359) lipoprotein transport(GO:0042953) lipoprotein localization(GO:0044872) |
| 0.1 | 10.7 | GO:0070588 | calcium ion transmembrane transport(GO:0070588) |
| 0.1 | 11.4 | GO:0060271 | cilium morphogenesis(GO:0060271) |
| 0.1 | 3.0 | GO:0007602 | phototransduction(GO:0007602) |
| 0.0 | 0.9 | GO:0086010 | membrane depolarization during action potential(GO:0086010) |
| 0.0 | 0.4 | GO:0060252 | positive regulation of glial cell proliferation(GO:0060252) |
| 0.0 | 0.2 | GO:0070221 | sulfide oxidation(GO:0019418) sulfide oxidation, using sulfide:quinone oxidoreductase(GO:0070221) |
| 0.0 | 2.9 | GO:0030593 | neutrophil chemotaxis(GO:0030593) |
| 0.0 | 2.1 | GO:0007157 | heterophilic cell-cell adhesion via plasma membrane cell adhesion molecules(GO:0007157) |
| 0.0 | 0.4 | GO:0001542 | ovulation from ovarian follicle(GO:0001542) |
| 0.0 | 1.3 | GO:0001938 | positive regulation of endothelial cell proliferation(GO:0001938) |
| 0.0 | 0.1 | GO:0060151 | peroxisome localization(GO:0060151) microtubule-based peroxisome localization(GO:0060152) |
| 0.0 | 0.4 | GO:0045104 | intermediate filament cytoskeleton organization(GO:0045104) |
| 0.0 | 4.0 | GO:0050953 | sensory perception of light stimulus(GO:0050953) |
| 0.0 | 1.4 | GO:0065002 | intracellular protein transmembrane transport(GO:0065002) |
| 0.0 | 0.4 | GO:0016578 | histone deubiquitination(GO:0016578) |
| 0.0 | 0.8 | GO:0002718 | regulation of cytokine production involved in immune response(GO:0002718) |
| 0.0 | 0.2 | GO:0045116 | protein neddylation(GO:0045116) |
| 0.0 | 1.2 | GO:0006487 | protein N-linked glycosylation(GO:0006487) |
| 0.0 | 1.0 | GO:0036498 | IRE1-mediated unfolded protein response(GO:0036498) |
| 0.0 | 0.8 | GO:0045540 | regulation of cholesterol biosynthetic process(GO:0045540) |
| 0.0 | 0.9 | GO:0006501 | C-terminal protein lipidation(GO:0006501) |
| 0.0 | 0.5 | GO:0001658 | branching involved in ureteric bud morphogenesis(GO:0001658) |
| 0.0 | 0.5 | GO:0045652 | regulation of megakaryocyte differentiation(GO:0045652) |
Gene overrepresentation in cellular component category:
| Log-likelihood per target | Total log-likelihood | Term | Description |
|---|---|---|---|
| 4.7 | 51.6 | GO:0070776 | H3 histone acetyltransferase complex(GO:0070775) MOZ/MORF histone acetyltransferase complex(GO:0070776) |
| 4.4 | 13.1 | GO:0060987 | lipid tube(GO:0060987) |
| 3.8 | 7.6 | GO:0014802 | terminal cisterna(GO:0014802) |
| 3.1 | 12.3 | GO:0032777 | Piccolo NuA4 histone acetyltransferase complex(GO:0032777) |
| 3.0 | 84.4 | GO:0097386 | glial cell projection(GO:0097386) |
| 2.8 | 8.3 | GO:0034455 | t-UTP complex(GO:0034455) |
| 2.6 | 10.3 | GO:1990578 | perinuclear endoplasmic reticulum membrane(GO:1990578) |
| 2.4 | 7.3 | GO:0036398 | TCR signalosome(GO:0036398) |
| 2.2 | 4.4 | GO:0005797 | Golgi medial cisterna(GO:0005797) |
| 1.8 | 9.1 | GO:0033647 | host intracellular organelle(GO:0033647) host intracellular membrane-bounded organelle(GO:0033648) |
| 1.7 | 12.1 | GO:0030121 | AP-1 adaptor complex(GO:0030121) |
| 1.7 | 19.0 | GO:0030015 | CCR4-NOT core complex(GO:0030015) |
| 1.7 | 14.9 | GO:0001520 | outer dense fiber(GO:0001520) |
| 1.6 | 22.8 | GO:0000124 | SAGA complex(GO:0000124) |
| 1.6 | 95.7 | GO:0033017 | sarcoplasmic reticulum membrane(GO:0033017) |
| 1.5 | 4.6 | GO:0055087 | Ski complex(GO:0055087) |
| 1.4 | 8.6 | GO:1990769 | proximal neuron projection(GO:1990769) |
| 1.4 | 11.0 | GO:0072487 | MSL complex(GO:0072487) |
| 1.3 | 3.9 | GO:0000805 | X chromosome(GO:0000805) |
| 1.2 | 4.9 | GO:0044326 | dendritic spine neck(GO:0044326) |
| 1.1 | 6.7 | GO:0005967 | mitochondrial pyruvate dehydrogenase complex(GO:0005967) |
| 1.1 | 13.9 | GO:0005583 | fibrillar collagen trimer(GO:0005583) banded collagen fibril(GO:0098643) |
| 1.1 | 5.3 | GO:0005947 | mitochondrial alpha-ketoglutarate dehydrogenase complex(GO:0005947) |
| 1.0 | 10.9 | GO:0008024 | cyclin/CDK positive transcription elongation factor complex(GO:0008024) |
| 0.9 | 10.3 | GO:0030061 | mitochondrial crista(GO:0030061) |
| 0.9 | 8.3 | GO:0000137 | Golgi cis cisterna(GO:0000137) |
| 0.9 | 6.1 | GO:1990130 | Iml1 complex(GO:1990130) |
| 0.9 | 3.5 | GO:0038039 | G-protein coupled receptor heterodimeric complex(GO:0038039) |
| 0.8 | 15.7 | GO:0016461 | unconventional myosin complex(GO:0016461) |
| 0.8 | 9.6 | GO:0097427 | microtubule bundle(GO:0097427) |
| 0.8 | 12.5 | GO:0035102 | PRC1 complex(GO:0035102) |
| 0.8 | 11.3 | GO:0001741 | XY body(GO:0001741) |
| 0.7 | 4.5 | GO:0031501 | mannosyltransferase complex(GO:0031501) |
| 0.7 | 1.5 | GO:0098592 | cytoplasmic side of apical plasma membrane(GO:0098592) |
| 0.7 | 3.6 | GO:0000836 | ER ubiquitin ligase complex(GO:0000835) Hrd1p ubiquitin ligase complex(GO:0000836) |
| 0.7 | 10.7 | GO:0097512 | cardiac myofibril(GO:0097512) |
| 0.6 | 9.5 | GO:0032059 | bleb(GO:0032059) |
| 0.6 | 11.7 | GO:0031588 | nucleotide-activated protein kinase complex(GO:0031588) |
| 0.6 | 4.0 | GO:0044327 | dendritic spine head(GO:0044327) |
| 0.6 | 7.9 | GO:0098839 | postsynaptic density membrane(GO:0098839) |
| 0.5 | 4.9 | GO:0044294 | dendritic growth cone(GO:0044294) |
| 0.5 | 3.5 | GO:0046696 | lipopolysaccharide receptor complex(GO:0046696) |
| 0.5 | 3.8 | GO:0032593 | insulin-responsive compartment(GO:0032593) |
| 0.5 | 12.6 | GO:0005682 | U5 snRNP(GO:0005682) |
| 0.5 | 10.9 | GO:0005849 | mRNA cleavage factor complex(GO:0005849) |
| 0.5 | 3.2 | GO:0035253 | ciliary rootlet(GO:0035253) |
| 0.4 | 3.5 | GO:0000015 | phosphopyruvate hydratase complex(GO:0000015) |
| 0.4 | 3.9 | GO:0000813 | ESCRT I complex(GO:0000813) |
| 0.4 | 5.6 | GO:0005662 | DNA replication factor A complex(GO:0005662) |
| 0.4 | 10.9 | GO:0044322 | endoplasmic reticulum quality control compartment(GO:0044322) |
| 0.4 | 18.3 | GO:0030131 | clathrin adaptor complex(GO:0030131) |
| 0.4 | 14.0 | GO:0035861 | site of double-strand break(GO:0035861) |
| 0.4 | 2.8 | GO:0042406 | extrinsic component of endoplasmic reticulum membrane(GO:0042406) |
| 0.4 | 4.1 | GO:0005664 | origin recognition complex(GO:0000808) nuclear origin of replication recognition complex(GO:0005664) |
| 0.4 | 7.9 | GO:1990124 | messenger ribonucleoprotein complex(GO:1990124) |
| 0.4 | 19.9 | GO:0048786 | presynaptic active zone(GO:0048786) |
| 0.3 | 16.3 | GO:0016235 | aggresome(GO:0016235) |
| 0.3 | 18.7 | GO:0043198 | dendritic shaft(GO:0043198) |
| 0.3 | 6.8 | GO:0071141 | SMAD protein complex(GO:0071141) |
| 0.3 | 4.0 | GO:0033256 | I-kappaB/NF-kappaB complex(GO:0033256) |
| 0.3 | 3.0 | GO:0000220 | vacuolar proton-transporting V-type ATPase, V0 domain(GO:0000220) |
| 0.3 | 6.9 | GO:0000930 | gamma-tubulin complex(GO:0000930) |
| 0.3 | 4.6 | GO:0035631 | CD40 receptor complex(GO:0035631) |
| 0.3 | 7.5 | GO:0031143 | pseudopodium(GO:0031143) |
| 0.3 | 3.1 | GO:0097136 | Bcl-2 family protein complex(GO:0097136) |
| 0.2 | 37.5 | GO:0032587 | ruffle membrane(GO:0032587) |
| 0.2 | 2.0 | GO:0000322 | storage vacuole(GO:0000322) |
| 0.2 | 21.5 | GO:1904724 | tertiary granule lumen(GO:1904724) |
| 0.2 | 15.9 | GO:0055038 | recycling endosome membrane(GO:0055038) |
| 0.2 | 3.6 | GO:0008074 | guanylate cyclase complex, soluble(GO:0008074) |
| 0.2 | 3.5 | GO:0005883 | neurofilament(GO:0005883) |
| 0.2 | 8.2 | GO:1902555 | endoribonuclease complex(GO:1902555) |
| 0.2 | 15.7 | GO:0099501 | synaptic vesicle membrane(GO:0030672) exocytic vesicle membrane(GO:0099501) |
| 0.2 | 4.5 | GO:0046930 | pore complex(GO:0046930) |
| 0.2 | 7.1 | GO:0005719 | nuclear euchromatin(GO:0005719) |
| 0.2 | 3.1 | GO:0005671 | Ada2/Gcn5/Ada3 transcription activator complex(GO:0005671) |
| 0.2 | 5.0 | GO:0042629 | mast cell granule(GO:0042629) |
| 0.2 | 49.6 | GO:0098793 | presynapse(GO:0098793) |
| 0.2 | 15.8 | GO:0031093 | platelet alpha granule lumen(GO:0031093) |
| 0.2 | 2.2 | GO:0000815 | ESCRT III complex(GO:0000815) |
| 0.2 | 9.3 | GO:0005871 | kinesin complex(GO:0005871) |
| 0.2 | 14.7 | GO:0032580 | Golgi cisterna membrane(GO:0032580) |
| 0.2 | 3.0 | GO:0005922 | connexon complex(GO:0005922) |
| 0.2 | 1.7 | GO:0031465 | Cul4B-RING E3 ubiquitin ligase complex(GO:0031465) |
| 0.2 | 2.7 | GO:0016281 | eukaryotic translation initiation factor 4F complex(GO:0016281) |
| 0.2 | 3.6 | GO:0051233 | spindle midzone(GO:0051233) |
| 0.2 | 2.1 | GO:0043194 | axon initial segment(GO:0043194) |
| 0.2 | 3.0 | GO:0001527 | microfibril(GO:0001527) fibril(GO:0043205) |
| 0.1 | 3.7 | GO:0014731 | spectrin-associated cytoskeleton(GO:0014731) |
| 0.1 | 3.7 | GO:0005892 | acetylcholine-gated channel complex(GO:0005892) |
| 0.1 | 3.5 | GO:0044298 | neuronal cell body membrane(GO:0032809) cell body membrane(GO:0044298) |
| 0.1 | 2.6 | GO:0001518 | voltage-gated sodium channel complex(GO:0001518) |
| 0.1 | 4.0 | GO:0031304 | intrinsic component of mitochondrial inner membrane(GO:0031304) integral component of mitochondrial inner membrane(GO:0031305) |
| 0.1 | 15.0 | GO:0005814 | centriole(GO:0005814) |
| 0.1 | 55.9 | GO:0043025 | neuronal cell body(GO:0043025) |
| 0.1 | 4.4 | GO:0009925 | basal plasma membrane(GO:0009925) |
| 0.1 | 3.9 | GO:0000421 | autophagosome membrane(GO:0000421) |
| 0.1 | 6.6 | GO:0005891 | voltage-gated calcium channel complex(GO:0005891) |
| 0.1 | 0.7 | GO:0034464 | BBSome(GO:0034464) |
| 0.1 | 2.8 | GO:0035145 | exon-exon junction complex(GO:0035145) |
| 0.1 | 2.8 | GO:0044665 | MLL1/2 complex(GO:0044665) MLL1 complex(GO:0071339) |
| 0.1 | 4.5 | GO:0016592 | mediator complex(GO:0016592) |
| 0.1 | 0.7 | GO:0005827 | polar microtubule(GO:0005827) |
| 0.1 | 11.0 | GO:0005884 | actin filament(GO:0005884) |
| 0.1 | 1.6 | GO:0031082 | BLOC complex(GO:0031082) |
| 0.1 | 4.5 | GO:0019005 | SCF ubiquitin ligase complex(GO:0019005) |
| 0.1 | 1.4 | GO:0042622 | photoreceptor outer segment membrane(GO:0042622) |
| 0.1 | 2.5 | GO:0030660 | Golgi-associated vesicle membrane(GO:0030660) |
| 0.1 | 2.7 | GO:0005844 | polysome(GO:0005844) |
| 0.1 | 4.2 | GO:0036064 | ciliary basal body(GO:0036064) |
| 0.1 | 7.1 | GO:0008076 | voltage-gated potassium channel complex(GO:0008076) potassium channel complex(GO:0034705) |
| 0.1 | 11.6 | GO:0005802 | trans-Golgi network(GO:0005802) |
| 0.1 | 2.5 | GO:0045171 | intercellular bridge(GO:0045171) |
| 0.1 | 2.2 | GO:0031228 | intrinsic component of Golgi membrane(GO:0031228) |
| 0.1 | 25.3 | GO:0005813 | centrosome(GO:0005813) |
| 0.1 | 2.0 | GO:0005776 | autophagosome(GO:0005776) |
| 0.1 | 0.4 | GO:0005594 | collagen type IX trimer(GO:0005594) |
| 0.1 | 1.8 | GO:0031233 | intrinsic component of external side of plasma membrane(GO:0031233) |
| 0.1 | 4.4 | GO:0055037 | recycling endosome(GO:0055037) |
| 0.1 | 1.7 | GO:0005881 | cytoplasmic microtubule(GO:0005881) |
| 0.1 | 3.9 | GO:0034707 | chloride channel complex(GO:0034707) |
| 0.1 | 0.6 | GO:0005890 | sodium:potassium-exchanging ATPase complex(GO:0005890) |
| 0.0 | 0.6 | GO:0000786 | nucleosome(GO:0000786) |
| 0.0 | 3.7 | GO:0005604 | basement membrane(GO:0005604) |
| 0.0 | 8.1 | GO:0005578 | proteinaceous extracellular matrix(GO:0005578) |
| 0.0 | 4.0 | GO:0030176 | integral component of endoplasmic reticulum membrane(GO:0030176) |
| 0.0 | 1.7 | GO:0000922 | spindle pole(GO:0000922) |
| 0.0 | 2.2 | GO:0031225 | anchored component of membrane(GO:0031225) |
| 0.0 | 1.1 | GO:0000794 | condensed nuclear chromosome(GO:0000794) |
Gene overrepresentation in molecular function category:
| Log-likelihood per target | Total log-likelihood | Term | Description |
|---|---|---|---|
| 17.9 | 71.5 | GO:0004356 | glutamate-ammonia ligase activity(GO:0004356) ammonia ligase activity(GO:0016211) acid-ammonia (or amide) ligase activity(GO:0016880) |
| 5.7 | 23.0 | GO:0004513 | neolactotetraosylceramide alpha-2,3-sialyltransferase activity(GO:0004513) lactosylceramide alpha-2,3-sialyltransferase activity(GO:0047291) |
| 5.0 | 15.0 | GO:0033142 | progesterone receptor binding(GO:0033142) |
| 4.6 | 23.2 | GO:0042903 | tubulin deacetylase activity(GO:0042903) |
| 4.3 | 55.8 | GO:0004723 | calcium-dependent protein serine/threonine phosphatase activity(GO:0004723) |
| 4.1 | 12.2 | GO:0070290 | N-acylphosphatidylethanolamine-specific phospholipase D activity(GO:0070290) |
| 3.9 | 11.7 | GO:0050405 | [hydroxymethylglutaryl-CoA reductase (NADPH)] kinase activity(GO:0047322) [acetyl-CoA carboxylase] kinase activity(GO:0050405) |
| 3.7 | 22.1 | GO:0003886 | DNA (cytosine-5-)-methyltransferase activity(GO:0003886) |
| 3.3 | 20.0 | GO:0031708 | endothelin B receptor binding(GO:0031708) |
| 3.3 | 13.1 | GO:0034041 | sterol-transporting ATPase activity(GO:0034041) |
| 3.2 | 9.6 | GO:0004938 | alpha2-adrenergic receptor activity(GO:0004938) |
| 3.1 | 15.4 | GO:0070097 | delta-catenin binding(GO:0070097) |
| 3.0 | 9.0 | GO:0016309 | 1-phosphatidylinositol-5-phosphate 4-kinase activity(GO:0016309) |
| 2.9 | 17.1 | GO:0000179 | rRNA (adenine-N6,N6-)-dimethyltransferase activity(GO:0000179) |
| 2.2 | 11.0 | GO:0001010 | transcription factor activity, sequence-specific DNA binding transcription factor recruiting(GO:0001010) |
| 2.1 | 6.3 | GO:0035575 | histone demethylase activity (H4-K20 specific)(GO:0035575) |
| 2.0 | 7.8 | GO:0032184 | SUMO polymer binding(GO:0032184) |
| 1.9 | 39.2 | GO:0019992 | diacylglycerol binding(GO:0019992) |
| 1.9 | 7.4 | GO:0097001 | ceramide binding(GO:0097001) |
| 1.8 | 16.5 | GO:0046974 | histone methyltransferase activity (H3-K9 specific)(GO:0046974) |
| 1.8 | 21.7 | GO:0001206 | transcriptional repressor activity, RNA polymerase II distal enhancer sequence-specific binding(GO:0001206) |
| 1.8 | 5.3 | GO:0003826 | alpha-ketoacid dehydrogenase activity(GO:0003826) 3-methyl-2-oxobutanoate dehydrogenase (2-methylpropanoyl-transferring) activity(GO:0003863) |
| 1.8 | 7.1 | GO:0035939 | microsatellite binding(GO:0035939) |
| 1.7 | 12.2 | GO:0042289 | MHC class II protein binding(GO:0042289) |
| 1.7 | 15.4 | GO:0036312 | phosphatidylinositol 3-kinase regulatory subunit binding(GO:0036312) |
| 1.6 | 6.6 | GO:1901375 | acetylcholine transmembrane transporter activity(GO:0005277) acetate ester transmembrane transporter activity(GO:1901375) |
| 1.6 | 14.1 | GO:0010385 | double-stranded methylated DNA binding(GO:0010385) |
| 1.5 | 4.5 | GO:0004584 | dolichyl-phosphate-mannose-glycolipid alpha-mannosyltransferase activity(GO:0004584) |
| 1.5 | 7.4 | GO:0001594 | trace-amine receptor activity(GO:0001594) |
| 1.5 | 7.4 | GO:0042610 | CD8 receptor binding(GO:0042610) |
| 1.5 | 7.3 | GO:0004800 | thyroxine 5'-deiodinase activity(GO:0004800) |
| 1.4 | 8.2 | GO:0032296 | ribonuclease III activity(GO:0004525) double-stranded RNA-specific ribonuclease activity(GO:0032296) |
| 1.4 | 4.1 | GO:0050510 | N-acetylgalactosaminyl-proteoglycan 3-beta-glucuronosyltransferase activity(GO:0050510) |
| 1.3 | 4.0 | GO:0098519 | nucleotide phosphatase activity, acting on free nucleotides(GO:0098519) |
| 1.3 | 9.4 | GO:0001591 | dopamine neurotransmitter receptor activity, coupled via Gi/Go(GO:0001591) |
| 1.3 | 21.4 | GO:0030306 | ADP-ribosylation factor binding(GO:0030306) |
| 1.3 | 7.8 | GO:0071074 | eukaryotic initiation factor eIF2 binding(GO:0071074) |
| 1.2 | 5.9 | GO:0010857 | calcium-dependent protein kinase activity(GO:0010857) |
| 1.2 | 7.1 | GO:0047057 | oxidoreductase activity, acting on the CH-OH group of donors, disulfide as acceptor(GO:0016900) vitamin-K-epoxide reductase (warfarin-sensitive) activity(GO:0047057) |
| 1.2 | 12.9 | GO:0001135 | transcription factor activity, RNA polymerase II transcription factor recruiting(GO:0001135) |
| 1.2 | 16.2 | GO:0015379 | potassium:chloride symporter activity(GO:0015379) potassium ion symporter activity(GO:0022820) |
| 1.1 | 6.8 | GO:0008142 | oxysterol binding(GO:0008142) |
| 1.1 | 6.7 | GO:0004740 | pyruvate dehydrogenase (acetyl-transferring) kinase activity(GO:0004740) |
| 1.1 | 21.1 | GO:0035925 | mRNA 3'-UTR AU-rich region binding(GO:0035925) |
| 1.1 | 4.3 | GO:0015220 | choline transmembrane transporter activity(GO:0015220) |
| 1.0 | 3.1 | GO:0047631 | ADP-ribose diphosphatase activity(GO:0047631) |
| 1.0 | 12.0 | GO:0004075 | biotin carboxylase activity(GO:0004075) |
| 1.0 | 7.9 | GO:0031811 | G-protein coupled nucleotide receptor binding(GO:0031811) P2Y1 nucleotide receptor binding(GO:0031812) |
| 0.9 | 7.5 | GO:0044323 | retinoic acid-responsive element binding(GO:0044323) |
| 0.9 | 4.7 | GO:0004694 | eukaryotic translation initiation factor 2alpha kinase activity(GO:0004694) |
| 0.9 | 5.5 | GO:0003873 | 6-phosphofructo-2-kinase activity(GO:0003873) |
| 0.9 | 4.4 | GO:0070573 | peptidyl-dipeptidase activity(GO:0008241) bradykinin receptor binding(GO:0031711) metallodipeptidase activity(GO:0070573) |
| 0.9 | 3.5 | GO:0004965 | G-protein coupled GABA receptor activity(GO:0004965) |
| 0.9 | 5.2 | GO:0061665 | SUMO ligase activity(GO:0061665) |
| 0.8 | 5.9 | GO:0001515 | opioid peptide activity(GO:0001515) |
| 0.8 | 7.6 | GO:0047144 | 2-acylglycerol-3-phosphate O-acyltransferase activity(GO:0047144) |
| 0.8 | 4.2 | GO:0005166 | neurotrophin p75 receptor binding(GO:0005166) |
| 0.8 | 1.7 | GO:0001134 | transcription factor activity, transcription factor recruiting(GO:0001134) |
| 0.8 | 4.9 | GO:0008420 | CTD phosphatase activity(GO:0008420) |
| 0.8 | 5.6 | GO:0001517 | N-acetylglucosamine 6-O-sulfotransferase activity(GO:0001517) |
| 0.8 | 2.4 | GO:0047325 | inositol tetrakisphosphate 1-kinase activity(GO:0047325) inositol tetrakisphosphate kinase activity(GO:0051765) inositol-1,3,4-trisphosphate 6-kinase activity(GO:0052725) inositol-1,3,4-trisphosphate 5-kinase activity(GO:0052726) inositol-1,3,4,5,6-pentakisphosphate 1-phosphatase activity(GO:0052825) inositol-1,3,4,6-tetrakisphosphate 6-phosphatase activity(GO:0052830) inositol-1,3,4,6-tetrakisphosphate 1-phosphatase activity(GO:0052831) inositol-3,4,6-trisphosphate 1-kinase activity(GO:0052835) |
| 0.8 | 7.1 | GO:0097322 | 7SK snRNA binding(GO:0097322) |
| 0.8 | 5.4 | GO:0008440 | inositol-1,4,5-trisphosphate 3-kinase activity(GO:0008440) inositol trisphosphate kinase activity(GO:0051766) |
| 0.7 | 3.0 | GO:0086020 | gap junction channel activity involved in SA node cell-atrial cardiac muscle cell electrical coupling(GO:0086020) gap junction channel activity involved in AV node cell-bundle of His cell electrical coupling(GO:0086077) |
| 0.7 | 3.6 | GO:0016941 | natriuretic peptide receptor activity(GO:0016941) |
| 0.7 | 11.4 | GO:0004861 | cyclin-dependent protein serine/threonine kinase inhibitor activity(GO:0004861) |
| 0.7 | 9.2 | GO:0000774 | adenyl-nucleotide exchange factor activity(GO:0000774) |
| 0.7 | 2.1 | GO:0004923 | leukemia inhibitory factor receptor activity(GO:0004923) |
| 0.7 | 20.0 | GO:0005388 | calcium-transporting ATPase activity(GO:0005388) |
| 0.7 | 3.4 | GO:0061676 | importin-alpha family protein binding(GO:0061676) |
| 0.7 | 10.5 | GO:0032454 | histone demethylase activity (H3-K9 specific)(GO:0032454) |
| 0.6 | 3.1 | GO:0003696 | satellite DNA binding(GO:0003696) |
| 0.6 | 4.9 | GO:0008046 | axon guidance receptor activity(GO:0008046) |
| 0.6 | 1.8 | GO:0001641 | group II metabotropic glutamate receptor activity(GO:0001641) |
| 0.6 | 4.2 | GO:1904929 | coreceptor activity involved in Wnt signaling pathway, planar cell polarity pathway(GO:1904929) |
| 0.6 | 3.5 | GO:0016807 | cysteine-type carboxypeptidase activity(GO:0016807) cysteine-type exopeptidase activity(GO:0070004) |
| 0.6 | 24.2 | GO:0004683 | calmodulin-dependent protein kinase activity(GO:0004683) |
| 0.6 | 4.0 | GO:0048039 | ubiquinone binding(GO:0048039) |
| 0.6 | 14.9 | GO:0050321 | tau-protein kinase activity(GO:0050321) |
| 0.6 | 2.3 | GO:0035276 | ethanol binding(GO:0035276) |
| 0.6 | 11.8 | GO:0030275 | LRR domain binding(GO:0030275) |
| 0.6 | 2.8 | GO:0005222 | intracellular cAMP activated cation channel activity(GO:0005222) |
| 0.6 | 5.0 | GO:0016888 | endodeoxyribonuclease activity, producing 5'-phosphomonoesters(GO:0016888) |
| 0.6 | 11.0 | GO:0097109 | neuroligin family protein binding(GO:0097109) |
| 0.5 | 4.9 | GO:0004767 | sphingomyelin phosphodiesterase activity(GO:0004767) |
| 0.5 | 2.7 | GO:0016907 | G-protein coupled acetylcholine receptor activity(GO:0016907) |
| 0.5 | 2.6 | GO:0086062 | voltage-gated sodium channel activity involved in Purkinje myocyte action potential(GO:0086062) |
| 0.5 | 4.7 | GO:0043533 | inositol 1,3,4,5 tetrakisphosphate binding(GO:0043533) |
| 0.5 | 19.8 | GO:0001106 | RNA polymerase II transcription corepressor activity(GO:0001106) |
| 0.5 | 3.6 | GO:0051864 | histone demethylase activity (H3-K36 specific)(GO:0051864) |
| 0.5 | 12.8 | GO:0008093 | cytoskeletal adaptor activity(GO:0008093) |
| 0.5 | 4.6 | GO:0097157 | pre-mRNA intronic binding(GO:0097157) |
| 0.5 | 4.5 | GO:0050682 | AF-2 domain binding(GO:0050682) |
| 0.5 | 40.9 | GO:0004712 | protein serine/threonine/tyrosine kinase activity(GO:0004712) |
| 0.5 | 1.5 | GO:0030272 | 5-formyltetrahydrofolate cyclo-ligase activity(GO:0030272) |
| 0.5 | 4.4 | GO:0008526 | phosphatidylinositol transporter activity(GO:0008526) |
| 0.5 | 6.8 | GO:0030618 | transforming growth factor beta receptor, pathway-specific cytoplasmic mediator activity(GO:0030618) |
| 0.5 | 2.9 | GO:0004704 | NF-kappaB-inducing kinase activity(GO:0004704) |
| 0.5 | 37.8 | GO:0004402 | histone acetyltransferase activity(GO:0004402) |
| 0.5 | 3.2 | GO:1904288 | BAT3 complex binding(GO:1904288) |
| 0.5 | 6.8 | GO:0016004 | phospholipase activator activity(GO:0016004) |
| 0.4 | 15.2 | GO:0031624 | ubiquitin conjugating enzyme binding(GO:0031624) |
| 0.4 | 3.5 | GO:0004634 | phosphopyruvate hydratase activity(GO:0004634) |
| 0.4 | 5.5 | GO:0005391 | sodium:potassium-exchanging ATPase activity(GO:0005391) |
| 0.4 | 2.1 | GO:0005052 | peroxisome matrix targeting signal-1 binding(GO:0005052) |
| 0.4 | 3.8 | GO:0015272 | ATP-activated inward rectifier potassium channel activity(GO:0015272) |
| 0.4 | 4.2 | GO:0015924 | mannosyl-oligosaccharide mannosidase activity(GO:0015924) |
| 0.4 | 10.0 | GO:0016864 | protein disulfide isomerase activity(GO:0003756) intramolecular oxidoreductase activity, transposing S-S bonds(GO:0016864) |
| 0.4 | 3.3 | GO:0005250 | A-type (transient outward) potassium channel activity(GO:0005250) |
| 0.4 | 2.9 | GO:0005324 | long-chain fatty acid transporter activity(GO:0005324) |
| 0.4 | 23.5 | GO:0070412 | R-SMAD binding(GO:0070412) |
| 0.4 | 1.2 | GO:0008523 | sodium-dependent multivitamin transmembrane transporter activity(GO:0008523) |
| 0.4 | 6.5 | GO:0043548 | phosphatidylinositol 3-kinase binding(GO:0043548) |
| 0.4 | 2.4 | GO:0004489 | methylenetetrahydrofolate reductase (NAD(P)H) activity(GO:0004489) |
| 0.4 | 4.0 | GO:0004957 | prostaglandin E receptor activity(GO:0004957) |
| 0.4 | 2.0 | GO:0052844 | endopolyphosphatase activity(GO:0000298) diphosphoinositol-polyphosphate diphosphatase activity(GO:0008486) bis(5'-adenosyl)-hexaphosphatase activity(GO:0034431) bis(5'-adenosyl)-pentaphosphatase activity(GO:0034432) inositol diphosphate tetrakisphosphate diphosphatase activity(GO:0052840) inositol bisdiphosphate tetrakisphosphate diphosphatase activity(GO:0052841) inositol diphosphate pentakisphosphate diphosphatase activity(GO:0052842) inositol-1-diphosphate-2,3,4,5,6-pentakisphosphate diphosphatase activity(GO:0052843) inositol-3-diphosphate-1,2,4,5,6-pentakisphosphate diphosphatase activity(GO:0052844) inositol-5-diphosphate-1,2,3,4,6-pentakisphosphate diphosphatase activity(GO:0052845) inositol-1,5-bisdiphosphate-2,3,4,6-tetrakisphosphate 1-diphosphatase activity(GO:0052846) inositol-1,5-bisdiphosphate-2,3,4,6-tetrakisphosphate 5-diphosphatase activity(GO:0052847) inositol-3,5-bisdiphosphate-2,3,4,6-tetrakisphosphate 5-diphosphatase activity(GO:0052848) |
| 0.4 | 4.6 | GO:0008140 | cAMP response element binding protein binding(GO:0008140) |
| 0.4 | 13.1 | GO:0071837 | HMG box domain binding(GO:0071837) |
| 0.4 | 4.5 | GO:0051434 | BH3 domain binding(GO:0051434) |
| 0.4 | 5.5 | GO:0008327 | methyl-CpG binding(GO:0008327) |
| 0.4 | 1.8 | GO:0008332 | low voltage-gated calcium channel activity(GO:0008332) |
| 0.4 | 9.5 | GO:0032794 | GTPase activating protein binding(GO:0032794) |
| 0.4 | 4.0 | GO:1990380 | Lys48-specific deubiquitinase activity(GO:1990380) |
| 0.4 | 1.8 | GO:0000828 | inositol-1,3,4,5,6-pentakisphosphate kinase activity(GO:0000827) inositol hexakisphosphate kinase activity(GO:0000828) inositol heptakisphosphate kinase activity(GO:0000829) inositol hexakisphosphate 5-kinase activity(GO:0000832) diphosphoinositol-pentakisphosphate kinase activity(GO:0033857) inositol hexakisphosphate 1-kinase activity(GO:0052723) inositol hexakisphosphate 3-kinase activity(GO:0052724) |
| 0.4 | 4.3 | GO:0030911 | TPR domain binding(GO:0030911) |
| 0.4 | 2.5 | GO:0086089 | voltage-gated potassium channel activity involved in atrial cardiac muscle cell action potential repolarization(GO:0086089) |
| 0.3 | 2.4 | GO:0030023 | extracellular matrix constituent conferring elasticity(GO:0030023) |
| 0.3 | 4.9 | GO:0005078 | MAP-kinase scaffold activity(GO:0005078) |
| 0.3 | 5.5 | GO:0043024 | ribosomal small subunit binding(GO:0043024) |
| 0.3 | 9.6 | GO:0043015 | gamma-tubulin binding(GO:0043015) |
| 0.3 | 2.0 | GO:0008273 | calcium, potassium:sodium antiporter activity(GO:0008273) |
| 0.3 | 2.2 | GO:0008568 | microtubule-severing ATPase activity(GO:0008568) |
| 0.3 | 16.7 | GO:0017112 | Rab guanyl-nucleotide exchange factor activity(GO:0017112) |
| 0.3 | 5.2 | GO:0009881 | photoreceptor activity(GO:0009881) |
| 0.3 | 3.0 | GO:0015386 | sodium:proton antiporter activity(GO:0015385) potassium:proton antiporter activity(GO:0015386) |
| 0.3 | 19.5 | GO:0004004 | ATP-dependent RNA helicase activity(GO:0004004) |
| 0.3 | 2.0 | GO:0030020 | extracellular matrix structural constituent conferring tensile strength(GO:0030020) |
| 0.3 | 4.6 | GO:0038036 | sphingosine-1-phosphate receptor activity(GO:0038036) |
| 0.3 | 1.1 | GO:0071558 | histone demethylase activity (H3-K27 specific)(GO:0071558) |
| 0.3 | 1.1 | GO:0042954 | lipoprotein transporter activity(GO:0042954) |
| 0.3 | 2.2 | GO:0046975 | histone methyltransferase activity (H3-K36 specific)(GO:0046975) |
| 0.3 | 3.0 | GO:0070888 | E-box binding(GO:0070888) |
| 0.3 | 0.8 | GO:0035241 | protein-arginine omega-N monomethyltransferase activity(GO:0035241) |
| 0.3 | 5.8 | GO:0008191 | metalloendopeptidase inhibitor activity(GO:0008191) |
| 0.3 | 2.3 | GO:0008597 | calcium-dependent protein serine/threonine phosphatase regulator activity(GO:0008597) |
| 0.3 | 4.1 | GO:0003688 | DNA replication origin binding(GO:0003688) |
| 0.2 | 9.9 | GO:0030332 | cyclin binding(GO:0030332) |
| 0.2 | 3.7 | GO:0015643 | toxic substance binding(GO:0015643) |
| 0.2 | 7.8 | GO:0008331 | high voltage-gated calcium channel activity(GO:0008331) |
| 0.2 | 6.3 | GO:0004012 | phospholipid-translocating ATPase activity(GO:0004012) |
| 0.2 | 2.7 | GO:0008190 | eukaryotic initiation factor 4E binding(GO:0008190) |
| 0.2 | 3.8 | GO:0019215 | intermediate filament binding(GO:0019215) |
| 0.2 | 9.7 | GO:0005547 | phosphatidylinositol-3,4,5-trisphosphate binding(GO:0005547) |
| 0.2 | 12.8 | GO:0005544 | calcium-dependent phospholipid binding(GO:0005544) |
| 0.2 | 21.8 | GO:0004867 | serine-type endopeptidase inhibitor activity(GO:0004867) |
| 0.2 | 6.1 | GO:0030676 | Rac guanyl-nucleotide exchange factor activity(GO:0030676) |
| 0.2 | 2.6 | GO:0046790 | virion binding(GO:0046790) |
| 0.2 | 3.9 | GO:0005247 | voltage-gated chloride channel activity(GO:0005247) |
| 0.2 | 3.8 | GO:0034237 | protein kinase A regulatory subunit binding(GO:0034237) |
| 0.2 | 5.4 | GO:0045309 | protein phosphorylated amino acid binding(GO:0045309) |
| 0.2 | 1.6 | GO:0070679 | inositol 1,4,5 trisphosphate binding(GO:0070679) |
| 0.2 | 5.9 | GO:0008395 | steroid hydroxylase activity(GO:0008395) |
| 0.2 | 5.0 | GO:0015248 | sterol transporter activity(GO:0015248) |
| 0.2 | 9.0 | GO:0003705 | transcription factor activity, RNA polymerase II distal enhancer sequence-specific binding(GO:0003705) |
| 0.2 | 22.5 | GO:0003774 | motor activity(GO:0003774) |
| 0.1 | 42.4 | GO:0001227 | transcriptional repressor activity, RNA polymerase II transcription regulatory region sequence-specific binding(GO:0001227) |
| 0.1 | 6.6 | GO:0005154 | epidermal growth factor receptor binding(GO:0005154) |
| 0.1 | 4.7 | GO:0016409 | palmitoyltransferase activity(GO:0016409) |
| 0.1 | 5.5 | GO:0030276 | clathrin binding(GO:0030276) |
| 0.1 | 23.2 | GO:0017124 | SH3 domain binding(GO:0017124) |
| 0.1 | 0.8 | GO:0016721 | superoxide dismutase activity(GO:0004784) oxidoreductase activity, acting on superoxide radicals as acceptor(GO:0016721) |
| 0.1 | 3.7 | GO:0001965 | G-protein alpha-subunit binding(GO:0001965) |
| 0.1 | 1.1 | GO:0070411 | I-SMAD binding(GO:0070411) |
| 0.1 | 0.3 | GO:0048273 | mitogen-activated protein kinase p38 binding(GO:0048273) |
| 0.1 | 0.7 | GO:0047696 | beta-adrenergic receptor kinase activity(GO:0047696) |
| 0.1 | 18.0 | GO:0017137 | Rab GTPase binding(GO:0017137) |
| 0.1 | 2.9 | GO:0016876 | aminoacyl-tRNA ligase activity(GO:0004812) ligase activity, forming carbon-oxygen bonds(GO:0016875) ligase activity, forming aminoacyl-tRNA and related compounds(GO:0016876) |
| 0.1 | 0.9 | GO:0030274 | LIM domain binding(GO:0030274) |
| 0.1 | 4.1 | GO:0030742 | GTP-dependent protein binding(GO:0030742) |
| 0.1 | 9.4 | GO:0001191 | transcriptional repressor activity, RNA polymerase II transcription factor binding(GO:0001191) |
| 0.1 | 0.2 | GO:0032422 | purine-rich negative regulatory element binding(GO:0032422) |
| 0.1 | 3.0 | GO:0005086 | ARF guanyl-nucleotide exchange factor activity(GO:0005086) |
| 0.1 | 0.6 | GO:0050436 | microfibril binding(GO:0050436) |
| 0.1 | 6.1 | GO:0016303 | 1-phosphatidylinositol-3-kinase activity(GO:0016303) |
| 0.1 | 4.0 | GO:0043425 | bHLH transcription factor binding(GO:0043425) |
| 0.1 | 0.5 | GO:0001075 | transcription factor activity, RNA polymerase II core promoter sequence-specific binding involved in preinitiation complex assembly(GO:0001075) |
| 0.1 | 5.6 | GO:0070063 | RNA polymerase binding(GO:0070063) |
| 0.1 | 1.9 | GO:0005537 | mannose binding(GO:0005537) |
| 0.1 | 31.5 | GO:0001077 | transcriptional activator activity, RNA polymerase II core promoter proximal region sequence-specific binding(GO:0001077) |
| 0.1 | 2.1 | GO:0005251 | delayed rectifier potassium channel activity(GO:0005251) |
| 0.1 | 3.1 | GO:0004709 | MAP kinase kinase kinase activity(GO:0004709) |
| 0.1 | 7.5 | GO:0005507 | copper ion binding(GO:0005507) |
| 0.1 | 4.9 | GO:0030374 | ligand-dependent nuclear receptor transcription coactivator activity(GO:0030374) |
| 0.1 | 4.8 | GO:0097110 | scaffold protein binding(GO:0097110) |
| 0.1 | 1.8 | GO:0005024 | transforming growth factor beta-activated receptor activity(GO:0005024) |
| 0.1 | 5.1 | GO:0043621 | protein self-association(GO:0043621) |
| 0.1 | 1.7 | GO:0008510 | sodium:bicarbonate symporter activity(GO:0008510) |
| 0.1 | 11.7 | GO:0052689 | carboxylic ester hydrolase activity(GO:0052689) |
| 0.1 | 4.1 | GO:0003743 | translation initiation factor activity(GO:0003743) |
| 0.1 | 6.1 | GO:0050660 | flavin adenine dinucleotide binding(GO:0050660) |
| 0.1 | 2.7 | GO:0030507 | spectrin binding(GO:0030507) |
| 0.1 | 13.8 | GO:0005096 | GTPase activator activity(GO:0005096) |
| 0.1 | 0.2 | GO:0015140 | malate transmembrane transporter activity(GO:0015140) |
| 0.1 | 3.3 | GO:0048306 | calcium-dependent protein binding(GO:0048306) |
| 0.0 | 0.5 | GO:0003707 | steroid hormone receptor activity(GO:0003707) |
| 0.0 | 0.9 | GO:1905030 | voltage-gated sodium channel activity(GO:0005248) voltage-gated ion channel activity involved in regulation of postsynaptic membrane potential(GO:1905030) |
| 0.0 | 4.7 | GO:0004222 | metalloendopeptidase activity(GO:0004222) |
| 0.0 | 7.6 | GO:0061659 | ubiquitin-like protein ligase activity(GO:0061659) |
| 0.0 | 0.3 | GO:0005005 | transmembrane-ephrin receptor activity(GO:0005005) |
| 0.0 | 2.3 | GO:0005249 | voltage-gated potassium channel activity(GO:0005249) |
| 0.0 | 0.9 | GO:0051219 | phosphoprotein binding(GO:0051219) |
| 0.0 | 1.5 | GO:0008375 | acetylglucosaminyltransferase activity(GO:0008375) |
| 0.0 | 5.0 | GO:0000981 | RNA polymerase II transcription factor activity, sequence-specific DNA binding(GO:0000981) |
| 0.0 | 9.0 | GO:0004930 | G-protein coupled receptor activity(GO:0004930) |
| 0.0 | 0.5 | GO:0043236 | laminin binding(GO:0043236) |
Gene overrepresentation in curated gene sets: canonical pathways category:
| Log-likelihood per target | Total log-likelihood | Term | Description |
|---|---|---|---|
| 3.6 | 21.6 | PID WNT CANONICAL PATHWAY | Canonical Wnt signaling pathway |
| 2.1 | 89.0 | ST WNT CA2 CYCLIC GMP PATHWAY | Wnt/Ca2+/cyclic GMP signaling. |
| 1.2 | 4.6 | PID S1P S1P4 PATHWAY | S1P4 pathway |
| 1.1 | 18.1 | PID TCR RAS PATHWAY | Ras signaling in the CD4+ TCR pathway |
| 1.0 | 45.8 | PID RAS PATHWAY | Regulation of Ras family activation |
| 0.7 | 24.4 | ST GAQ PATHWAY | G alpha q Pathway |
| 0.7 | 21.6 | PID HEDGEHOG 2PATHWAY | Signaling events mediated by the Hedgehog family |
| 0.6 | 8.5 | ST JAK STAT PATHWAY | Jak-STAT Pathway |
| 0.6 | 24.2 | PID EPHA FWDPATHWAY | EPHA forward signaling |
| 0.5 | 18.2 | ST MYOCYTE AD PATHWAY | Myocyte Adrenergic Pathway is a specific case of the generalized Adrenergic Pathway. |
| 0.5 | 3.0 | PID ALK1 PATHWAY | ALK1 signaling events |
| 0.5 | 0.9 | PID PDGFRA PATHWAY | PDGFR-alpha signaling pathway |
| 0.5 | 4.6 | PID IL5 PATHWAY | IL5-mediated signaling events |
| 0.5 | 25.9 | PID RXR VDR PATHWAY | RXR and RAR heterodimerization with other nuclear receptor |
| 0.4 | 20.9 | PID AURORA A PATHWAY | Aurora A signaling |
| 0.4 | 15.5 | PID PI3K PLC TRK PATHWAY | Trk receptor signaling mediated by PI3K and PLC-gamma |
| 0.4 | 35.6 | PID LKB1 PATHWAY | LKB1 signaling events |
| 0.4 | 24.6 | PID FRA PATHWAY | Validated transcriptional targets of AP1 family members Fra1 and Fra2 |
| 0.4 | 6.8 | PID ALK2 PATHWAY | ALK2 signaling events |
| 0.4 | 5.3 | PID EPHA2 FWD PATHWAY | EPHA2 forward signaling |
| 0.3 | 20.0 | PID ENDOTHELIN PATHWAY | Endothelins |
| 0.3 | 14.3 | NABA COLLAGENS | Genes encoding collagen proteins |
| 0.3 | 19.6 | PID CERAMIDE PATHWAY | Ceramide signaling pathway |
| 0.3 | 8.0 | PID WNT SIGNALING PATHWAY | Wnt signaling network |
| 0.3 | 4.7 | ST G ALPHA I PATHWAY | G alpha i Pathway |
| 0.3 | 4.1 | PID WNT NONCANONICAL PATHWAY | Noncanonical Wnt signaling pathway |
| 0.3 | 28.6 | PID MYC REPRESS PATHWAY | Validated targets of C-MYC transcriptional repression |
| 0.3 | 9.3 | ST WNT BETA CATENIN PATHWAY | Wnt/beta-catenin Pathway |
| 0.2 | 3.2 | PID IGF1 PATHWAY | IGF1 pathway |
| 0.2 | 11.2 | PID ARF6 PATHWAY | Arf6 signaling events |
| 0.2 | 3.1 | SA PROGRAMMED CELL DEATH | Programmed cell death, or apoptosis, eliminates damaged or unneeded cells. |
| 0.2 | 8.2 | SIG CD40PATHWAYMAP | Genes related to CD40 signaling |
| 0.2 | 2.0 | PID MET PATHWAY | Signaling events mediated by Hepatocyte Growth Factor Receptor (c-Met) |
| 0.2 | 4.9 | PID SMAD2 3PATHWAY | Regulation of cytoplasmic and nuclear SMAD2/3 signaling |
| 0.2 | 3.0 | PID CIRCADIAN PATHWAY | Circadian rhythm pathway |
| 0.1 | 4.4 | SA MMP CYTOKINE CONNECTION | Cytokines can induce activation of matrix metalloproteinases, which degrade extracellular matrix. |
| 0.1 | 2.0 | PID NFAT 3PATHWAY | Role of Calcineurin-dependent NFAT signaling in lymphocytes |
| 0.1 | 10.6 | PID HDAC CLASSI PATHWAY | Signaling events mediated by HDAC Class I |
| 0.1 | 2.9 | PID INTEGRIN CS PATHWAY | Integrin family cell surface interactions |
| 0.1 | 2.4 | PID INTEGRIN5 PATHWAY | Beta5 beta6 beta7 and beta8 integrin cell surface interactions |
| 0.1 | 2.4 | PID IL2 1PATHWAY | IL2-mediated signaling events |
| 0.1 | 4.5 | PID MTOR 4PATHWAY | mTOR signaling pathway |
| 0.1 | 4.8 | PID FGF PATHWAY | FGF signaling pathway |
| 0.1 | 1.3 | PID TNF PATHWAY | TNF receptor signaling pathway |
| 0.1 | 19.5 | NABA ECM REGULATORS | Genes encoding enzymes and their regulators involved in the remodeling of the extracellular matrix |
| 0.1 | 4.7 | PID HIF1 TFPATHWAY | HIF-1-alpha transcription factor network |
| 0.1 | 3.6 | PID RHOA REG PATHWAY | Regulation of RhoA activity |
| 0.1 | 11.8 | NABA ECM GLYCOPROTEINS | Genes encoding structural ECM glycoproteins |
| 0.1 | 0.8 | PID EPO PATHWAY | EPO signaling pathway |
| 0.1 | 3.2 | PID RAC1 REG PATHWAY | Regulation of RAC1 activity |
| 0.0 | 2.3 | PID HES HEY PATHWAY | Notch-mediated HES/HEY network |
| 0.0 | 1.6 | PID FOXO PATHWAY | FoxO family signaling |
| 0.0 | 0.6 | PID NETRIN PATHWAY | Netrin-mediated signaling events |
| 0.0 | 0.2 | SA G2 AND M PHASES | Cdc25 activates the cdc2/cyclin B complex to induce the G2/M transition. |
| 0.0 | 1.7 | PID ERA GENOMIC PATHWAY | Validated nuclear estrogen receptor alpha network |
| 0.0 | 0.3 | PID P38 ALPHA BETA PATHWAY | Regulation of p38-alpha and p38-beta |
Gene overrepresentation in curated gene sets: REACTOME pathways category:
| Log-likelihood per target | Total log-likelihood | Term | Description |
|---|---|---|---|
| 3.5 | 3.5 | REACTOME ACYL CHAIN REMODELLING OF PS | Genes involved in Acyl chain remodelling of PS |
| 2.6 | 71.5 | REACTOME AMINO ACID SYNTHESIS AND INTERCONVERSION TRANSAMINATION | Genes involved in Amino acid synthesis and interconversion (transamination) |
| 1.8 | 14.1 | REACTOME RNA POL I PROMOTER OPENING | Genes involved in RNA Polymerase I Promoter Opening |
| 1.2 | 29.5 | REACTOME INTRINSIC PATHWAY | Genes involved in Intrinsic Pathway |
| 1.0 | 20.0 | REACTOME PLATELET CALCIUM HOMEOSTASIS | Genes involved in Platelet calcium homeostasis |
| 0.9 | 39.6 | REACTOME EFFECTS OF PIP2 HYDROLYSIS | Genes involved in Effects of PIP2 hydrolysis |
| 0.9 | 8.2 | REACTOME MICRORNA MIRNA BIOGENESIS | Genes involved in MicroRNA (miRNA) Biogenesis |
| 0.8 | 4.2 | REACTOME DOPAMINE NEUROTRANSMITTER RELEASE CYCLE | Genes involved in Dopamine Neurotransmitter Release Cycle |
| 0.8 | 19.0 | REACTOME REGULATION OF AMPK ACTIVITY VIA LKB1 | Genes involved in Regulation of AMPK activity via LKB1 |
| 0.8 | 25.2 | REACTOME SIGNALING BY CONSTITUTIVELY ACTIVE EGFR | Genes involved in Signaling by constitutively active EGFR |
| 0.7 | 16.0 | REACTOME ABCA TRANSPORTERS IN LIPID HOMEOSTASIS | Genes involved in ABCA transporters in lipid homeostasis |
| 0.7 | 7.4 | REACTOME PLATELET ADHESION TO EXPOSED COLLAGEN | Genes involved in Platelet Adhesion to exposed collagen |
| 0.6 | 15.4 | REACTOME ACETYLCHOLINE NEUROTRANSMITTER RELEASE CYCLE | Genes involved in Acetylcholine Neurotransmitter Release Cycle |
| 0.6 | 26.4 | REACTOME AMINE LIGAND BINDING RECEPTORS | Genes involved in Amine ligand-binding receptors |
| 0.6 | 11.8 | REACTOME INITIAL TRIGGERING OF COMPLEMENT | Genes involved in Initial triggering of complement |
| 0.6 | 17.8 | REACTOME CELL EXTRACELLULAR MATRIX INTERACTIONS | Genes involved in Cell-extracellular matrix interactions |
| 0.6 | 18.9 | REACTOME CIRCADIAN REPRESSION OF EXPRESSION BY REV ERBA | Genes involved in Circadian Repression of Expression by REV-ERBA |
| 0.6 | 29.4 | REACTOME SMAD2 SMAD3 SMAD4 HETEROTRIMER REGULATES TRANSCRIPTION | Genes involved in SMAD2/SMAD3:SMAD4 heterotrimer regulates transcription |
| 0.6 | 11.0 | REACTOME SYNTHESIS SECRETION AND DEACYLATION OF GHRELIN | Genes involved in Synthesis, Secretion, and Deacylation of Ghrelin |
| 0.6 | 12.6 | REACTOME ACTIVATION OF BH3 ONLY PROTEINS | Genes involved in Activation of BH3-only proteins |
| 0.5 | 10.9 | REACTOME PROCESSING OF INTRONLESS PRE MRNAS | Genes involved in Processing of Intronless Pre-mRNAs |
| 0.5 | 4.1 | REACTOME ACYL CHAIN REMODELLING OF PE | Genes involved in Acyl chain remodelling of PE |
| 0.5 | 5.9 | REACTOME SYNTHESIS OF BILE ACIDS AND BILE SALTS VIA 24 HYDROXYCHOLESTEROL | Genes involved in Synthesis of bile acids and bile salts via 24-hydroxycholesterol |
| 0.5 | 9.0 | REACTOME MRNA DECAY BY 5 TO 3 EXORIBONUCLEASE | Genes involved in mRNA Decay by 5' to 3' Exoribonuclease |
| 0.4 | 11.4 | REACTOME BRANCHED CHAIN AMINO ACID CATABOLISM | Genes involved in Branched-chain amino acid catabolism |
| 0.4 | 5.3 | REACTOME TRAFFICKING AND PROCESSING OF ENDOSOMAL TLR | Genes involved in Trafficking and processing of endosomal TLR |
| 0.3 | 7.3 | REACTOME AMINE DERIVED HORMONES | Genes involved in Amine-derived hormones |
| 0.3 | 10.7 | REACTOME SYNTHESIS OF PA | Genes involved in Synthesis of PA |
| 0.3 | 4.1 | REACTOME E2F ENABLED INHIBITION OF PRE REPLICATION COMPLEX FORMATION | Genes involved in E2F-enabled inhibition of pre-replication complex formation |
| 0.3 | 4.0 | REACTOME PROSTANOID LIGAND RECEPTORS | Genes involved in Prostanoid ligand receptors |
| 0.3 | 9.7 | REACTOME UNBLOCKING OF NMDA RECEPTOR GLUTAMATE BINDING AND ACTIVATION | Genes involved in Unblocking of NMDA receptor, glutamate binding and activation |
| 0.3 | 9.6 | REACTOME CD28 DEPENDENT PI3K AKT SIGNALING | Genes involved in CD28 dependent PI3K/Akt signaling |
| 0.3 | 4.6 | REACTOME ACTIVATION OF IRF3 IRF7 MEDIATED BY TBK1 IKK EPSILON | Genes involved in Activation of IRF3/IRF7 mediated by TBK1/IKK epsilon |
| 0.3 | 4.8 | REACTOME FGFR4 LIGAND BINDING AND ACTIVATION | Genes involved in FGFR4 ligand binding and activation |
| 0.3 | 5.3 | REACTOME CLASS C 3 METABOTROPIC GLUTAMATE PHEROMONE RECEPTORS | Genes involved in Class C/3 (Metabotropic glutamate/pheromone receptors) |
| 0.3 | 19.2 | REACTOME NCAM1 INTERACTIONS | Genes involved in NCAM1 interactions |
| 0.3 | 3.6 | REACTOME PRE NOTCH PROCESSING IN GOLGI | Genes involved in Pre-NOTCH Processing in Golgi |
| 0.3 | 2.3 | REACTOME SPRY REGULATION OF FGF SIGNALING | Genes involved in Spry regulation of FGF signaling |
| 0.2 | 9.0 | REACTOME DEADENYLATION OF MRNA | Genes involved in Deadenylation of mRNA |
| 0.2 | 5.4 | REACTOME PROLACTIN RECEPTOR SIGNALING | Genes involved in Prolactin receptor signaling |
| 0.2 | 15.7 | REACTOME GLUCONEOGENESIS | Genes involved in Gluconeogenesis |
| 0.2 | 5.6 | REACTOME KERATAN SULFATE BIOSYNTHESIS | Genes involved in Keratan sulfate biosynthesis |
| 0.2 | 5.5 | REACTOME GLYCOLYSIS | Genes involved in Glycolysis |
| 0.2 | 9.1 | REACTOME SYNTHESIS OF PIPS AT THE PLASMA MEMBRANE | Genes involved in Synthesis of PIPs at the plasma membrane |
| 0.2 | 3.1 | REACTOME NEF MEDIATED DOWNREGULATION OF MHC CLASS I COMPLEX CELL SURFACE EXPRESSION | Genes involved in Nef mediated downregulation of MHC class I complex cell surface expression |
| 0.2 | 13.5 | REACTOME NOTCH1 INTRACELLULAR DOMAIN REGULATES TRANSCRIPTION | Genes involved in NOTCH1 Intracellular Domain Regulates Transcription |
| 0.2 | 2.1 | REACTOME RAP1 SIGNALLING | Genes involved in Rap1 signalling |
| 0.2 | 2.1 | REACTOME SIGNAL ATTENUATION | Genes involved in Signal attenuation |
| 0.2 | 5.8 | REACTOME N GLYCAN ANTENNAE ELONGATION IN THE MEDIAL TRANS GOLGI | Genes involved in N-glycan antennae elongation in the medial/trans-Golgi |
| 0.2 | 8.5 | REACTOME INTERACTION BETWEEN L1 AND ANKYRINS | Genes involved in Interaction between L1 and Ankyrins |
| 0.2 | 4.5 | REACTOME SYNTHESIS OF GLYCOSYLPHOSPHATIDYLINOSITOL GPI | Genes involved in Synthesis of glycosylphosphatidylinositol (GPI) |
| 0.2 | 2.9 | REACTOME MITOCHONDRIAL TRNA AMINOACYLATION | Genes involved in Mitochondrial tRNA aminoacylation |
| 0.2 | 10.7 | REACTOME STRIATED MUSCLE CONTRACTION | Genes involved in Striated Muscle Contraction |
| 0.2 | 3.8 | REACTOME SYNTHESIS OF PC | Genes involved in Synthesis of PC |
| 0.2 | 3.0 | REACTOME GAP JUNCTION ASSEMBLY | Genes involved in Gap junction assembly |
| 0.2 | 8.2 | REACTOME NEGATIVE REGULATORS OF RIG I MDA5 SIGNALING | Genes involved in Negative regulators of RIG-I/MDA5 signaling |
| 0.2 | 22.9 | REACTOME TRANSPORT OF INORGANIC CATIONS ANIONS AND AMINO ACIDS OLIGOPEPTIDES | Genes involved in Transport of inorganic cations/anions and amino acids/oligopeptides |
| 0.2 | 4.2 | REACTOME RETROGRADE NEUROTROPHIN SIGNALLING | Genes involved in Retrograde neurotrophin signalling |
| 0.2 | 3.7 | REACTOME HIGHLY CALCIUM PERMEABLE POSTSYNAPTIC NICOTINIC ACETYLCHOLINE RECEPTORS | Genes involved in Highly calcium permeable postsynaptic nicotinic acetylcholine receptors |
| 0.2 | 8.2 | REACTOME VOLTAGE GATED POTASSIUM CHANNELS | Genes involved in Voltage gated Potassium channels |
| 0.1 | 5.0 | REACTOME REGULATION OF INSULIN SECRETION | Genes involved in Regulation of Insulin Secretion |
| 0.1 | 4.1 | REACTOME CHONDROITIN SULFATE BIOSYNTHESIS | Genes involved in Chondroitin sulfate biosynthesis |
| 0.1 | 5.5 | REACTOME ION TRANSPORT BY P TYPE ATPASES | Genes involved in Ion transport by P-type ATPases |
| 0.1 | 2.8 | REACTOME PTM GAMMA CARBOXYLATION HYPUSINE FORMATION AND ARYLSULFATASE ACTIVATION | Genes involved in PTM: gamma carboxylation, hypusine formation and arylsulfatase activation |
| 0.1 | 2.4 | REACTOME P38MAPK EVENTS | Genes involved in p38MAPK events |
| 0.1 | 5.2 | REACTOME SEMA4D IN SEMAPHORIN SIGNALING | Genes involved in Sema4D in semaphorin signaling |
| 0.1 | 6.8 | REACTOME NRAGE SIGNALS DEATH THROUGH JNK | Genes involved in NRAGE signals death through JNK |
| 0.1 | 1.8 | REACTOME FORMATION OF FIBRIN CLOT CLOTTING CASCADE | Genes involved in Formation of Fibrin Clot (Clotting Cascade) |
| 0.1 | 4.9 | REACTOME GLYCOSPHINGOLIPID METABOLISM | Genes involved in Glycosphingolipid metabolism |
| 0.1 | 19.4 | REACTOME PEPTIDE LIGAND BINDING RECEPTORS | Genes involved in Peptide ligand-binding receptors |
| 0.1 | 3.1 | REACTOME TRANSMISSION ACROSS CHEMICAL SYNAPSES | Genes involved in Transmission across Chemical Synapses |
| 0.1 | 3.8 | REACTOME CGMP EFFECTS | Genes involved in cGMP effects |
| 0.1 | 1.5 | REACTOME OTHER SEMAPHORIN INTERACTIONS | Genes involved in Other semaphorin interactions |
| 0.1 | 2.6 | REACTOME TIGHT JUNCTION INTERACTIONS | Genes involved in Tight junction interactions |
| 0.1 | 5.0 | REACTOME ACTIVATION OF CHAPERONE GENES BY XBP1S | Genes involved in Activation of Chaperone Genes by XBP1(S) |
| 0.1 | 2.0 | REACTOME SPHINGOLIPID DE NOVO BIOSYNTHESIS | Genes involved in Sphingolipid de novo biosynthesis |
| 0.1 | 4.6 | REACTOME CLASS A1 RHODOPSIN LIKE RECEPTORS | Genes involved in Class A/1 (Rhodopsin-like receptors) |
| 0.0 | 0.6 | REACTOME ROLE OF DCC IN REGULATING APOPTOSIS | Genes involved in Role of DCC in regulating apoptosis |
| 0.0 | 1.6 | REACTOME PERK REGULATED GENE EXPRESSION | Genes involved in PERK regulated gene expression |
| 0.0 | 1.7 | REACTOME COLLAGEN FORMATION | Genes involved in Collagen formation |
| 0.0 | 0.4 | REACTOME CASPASE MEDIATED CLEAVAGE OF CYTOSKELETAL PROTEINS | Genes involved in Caspase-mediated cleavage of cytoskeletal proteins |
| 0.0 | 1.1 | REACTOME SYNTHESIS SECRETION AND INACTIVATION OF GLP1 | Genes involved in Synthesis, Secretion, and Inactivation of Glucagon-like Peptide-1 (GLP-1) |
| 0.0 | 1.1 | REACTOME STEROID HORMONES | Genes involved in Steroid hormones |
| 0.0 | 0.9 | REACTOME KINESINS | Genes involved in Kinesins |
| 0.0 | 0.3 | REACTOME TGF BETA RECEPTOR SIGNALING IN EMT EPITHELIAL TO MESENCHYMAL TRANSITION | Genes involved in TGF-beta receptor signaling in EMT (epithelial to mesenchymal transition) |
| 0.0 | 4.8 | REACTOME ANTIGEN PROCESSING UBIQUITINATION PROTEASOME DEGRADATION | Genes involved in Antigen processing: Ubiquitination & Proteasome degradation |
| 0.0 | 1.6 | REACTOME INTERFERON ALPHA BETA SIGNALING | Genes involved in Interferon alpha/beta signaling |
| 0.0 | 0.2 | REACTOME G2 M DNA DAMAGE CHECKPOINT | Genes involved in G2/M DNA damage checkpoint |