Project
GNF SymAtlas + NCI-60 cancer cell lines, human (Su, 2004; Ross, 2000)
Navigation
Downloads
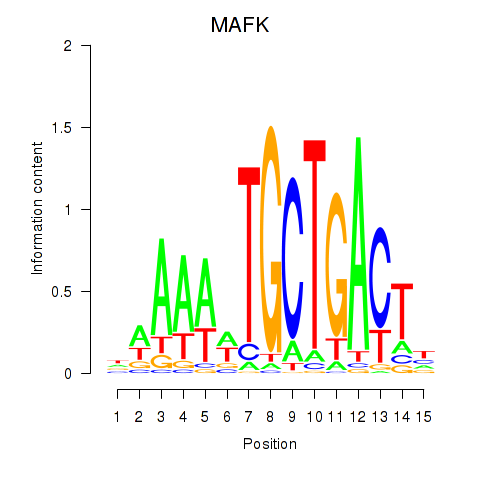
Results for MAFK
Z-value: 1.31
Motif logo
Transcription factors associated with MAFK
| Gene Symbol | Gene ID | Gene Info |
|---|---|---|
|
MAFK
|
ENSG00000198517.10 | MAFK |
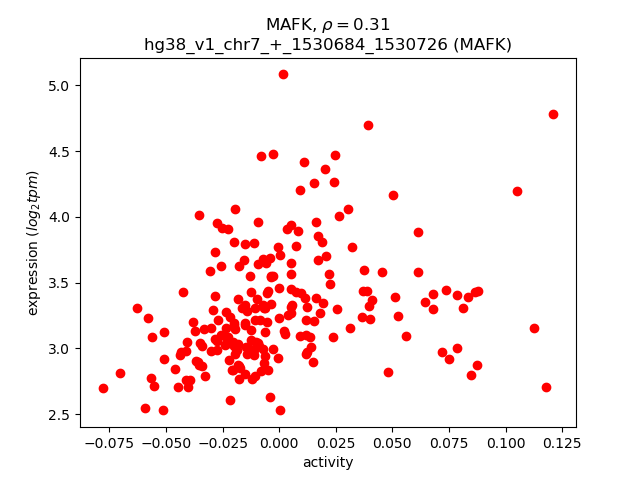
Activity-expression correlation:
| Gene | Promoter | Pearson corr. coef. | P-value | Plot |
|---|---|---|---|---|
| MAFK | hg38_v1_chr7_+_1530684_1530726 | 0.31 | 4.1e-06 | Click! |
Activity profile of MAFK motif
Sorted Z-values of MAFK motif
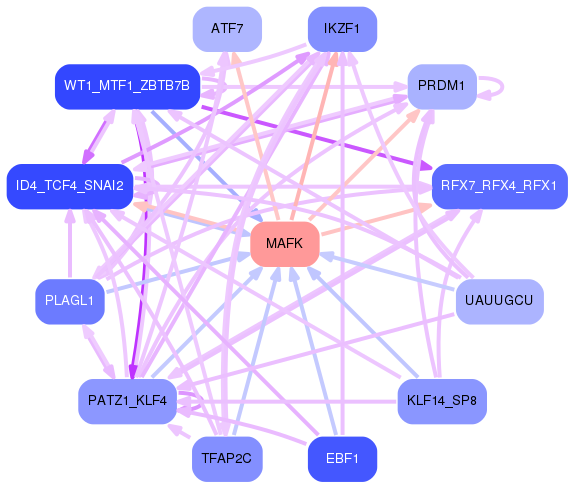
Network of associatons between targets according to the STRING database.

First level regulatory network of MAFK
| Promoter | Score | Transcript | Gene | Gene Info |
|---|---|---|---|---|
| chr1_+_198638968 | 33.61 |
ENST00000348564.11
ENST00000530727.5 ENST00000442510.8 ENST00000645247.1 ENST00000367367.8 ENST00000367364.5 ENST00000413409.6 |
PTPRC
|
protein tyrosine phosphatase receptor type C |
| chr2_+_90021567 | 31.92 |
ENST00000436451.2
|
IGKV6D-21
|
immunoglobulin kappa variable 6D-21 (non-functional) |
| chr2_+_88885397 | 28.99 |
ENST00000390243.2
|
IGKV4-1
|
immunoglobulin kappa variable 4-1 |
| chr22_+_22906342 | 25.56 |
ENST00000390325.2
|
IGLC3
|
immunoglobulin lambda constant 3 (Kern-Oz+ marker) |
| chr6_+_33075952 | 24.49 |
ENST00000418931.7
|
HLA-DPB1
|
major histocompatibility complex, class II, DP beta 1 |
| chr2_+_89913982 | 19.80 |
ENST00000390265.2
|
IGKV1D-33
|
immunoglobulin kappa variable 1D-33 |
| chr14_-_106538331 | 19.76 |
ENST00000390624.3
|
IGHV3-48
|
immunoglobulin heavy variable 3-48 |
| chr2_-_89027700 | 19.13 |
ENST00000483158.1
|
IGKV3-11
|
immunoglobulin kappa variable 3-11 |
| chr1_-_169711603 | 18.93 |
ENST00000236147.6
ENST00000650983.1 |
SELL
|
selectin L |
| chr2_-_89117844 | 17.97 |
ENST00000490686.1
|
IGKV1-17
|
immunoglobulin kappa variable 1-17 |
| chr14_-_106185387 | 17.62 |
ENST00000390605.2
|
IGHV1-18
|
immunoglobulin heavy variable 1-18 |
| chr6_-_25042003 | 17.40 |
ENST00000510784.8
|
RIPOR2
|
RHO family interacting cell polarization regulator 2 |
| chr2_+_90159840 | 16.64 |
ENST00000377032.5
|
IGKV1D-12
|
immunoglobulin kappa variable 1D-12 |
| chr3_-_121660892 | 16.12 |
ENST00000428394.6
ENST00000314583.8 |
HCLS1
|
hematopoietic cell-specific Lyn substrate 1 |
| chr14_-_105626066 | 15.92 |
ENST00000641978.1
ENST00000390543.3 |
IGHG4
|
immunoglobulin heavy constant gamma 4 (G4m marker) |
| chr21_-_10649835 | 15.43 |
ENST00000622028.1
|
IGHV1OR21-1
|
immunoglobulin heavy variable 1/OR21-1 (non-functional) |
| chr22_-_17199609 | 15.20 |
ENST00000330232.8
|
ADA2
|
adenosine deaminase 2 |
| chr1_+_158831323 | 14.44 |
ENST00000368141.5
|
MNDA
|
myeloid cell nuclear differentiation antigen |
| chr2_+_90114838 | 14.05 |
ENST00000417279.3
|
IGKV3D-15
|
immunoglobulin kappa variable 3D-15 |
| chr12_+_69348372 | 14.05 |
ENST00000261267.7
ENST00000549690.1 ENST00000548839.1 |
LYZ
|
lysozyme |
| chr5_+_55102635 | 13.87 |
ENST00000274306.7
|
GZMA
|
granzyme A |
| chr1_-_145995713 | 13.83 |
ENST00000425134.2
|
TXNIP
|
thioredoxin interacting protein |
| chr4_-_70666492 | 13.27 |
ENST00000254801.9
ENST00000391614.7 |
JCHAIN
|
joining chain of multimeric IgA and IgM |
| chr14_-_106658251 | 12.90 |
ENST00000454421.2
|
IGHV3-64
|
immunoglobulin heavy variable 3-64 |
| chr14_-_106235582 | 12.79 |
ENST00000390607.2
|
IGHV3-21
|
immunoglobulin heavy variable 3-21 |
| chr2_-_89160329 | 12.72 |
ENST00000390256.2
|
IGKV6-21
|
immunoglobulin kappa variable 6-21 (non-functional) |
| chr11_-_5227063 | 12.66 |
ENST00000335295.4
ENST00000485743.1 ENST00000647020.1 |
HBB
|
hemoglobin subunit beta |
| chr2_+_90172802 | 12.64 |
ENST00000390277.3
|
IGKV3D-11
|
immunoglobulin kappa variable 3D-11 |
| chr14_-_106025628 | 12.63 |
ENST00000631943.1
|
IGHV7-4-1
|
immunoglobulin heavy variable 7-4-1 |
| chr6_+_32741382 | 12.44 |
ENST00000374940.4
|
HLA-DQA2
|
major histocompatibility complex, class II, DQ alpha 2 |
| chr14_-_106737547 | 12.35 |
ENST00000632209.1
|
IGHV1-69-2
|
immunoglobulin heavy variable 1-69-2 |
| chr13_-_46182136 | 12.12 |
ENST00000323076.7
|
LCP1
|
lymphocyte cytosolic protein 1 |
| chr14_+_20955484 | 11.85 |
ENST00000304625.3
|
RNASE2
|
ribonuclease A family member 2 |
| chr1_-_89126066 | 11.47 |
ENST00000370466.4
|
GBP2
|
guanylate binding protein 2 |
| chr13_+_30735523 | 11.43 |
ENST00000380490.5
|
ALOX5AP
|
arachidonate 5-lipoxygenase activating protein |
| chr13_+_30713477 | 11.15 |
ENST00000617770.4
|
ALOX5AP
|
arachidonate 5-lipoxygenase activating protein |
| chr6_+_6588082 | 10.74 |
ENST00000379953.6
|
LY86
|
lymphocyte antigen 86 |
| chr12_-_91153149 | 10.70 |
ENST00000550758.1
|
DCN
|
decorin |
| chr18_+_24113341 | 10.68 |
ENST00000540918.2
|
TTC39C
|
tetratricopeptide repeat domain 39C |
| chr14_-_106088573 | 10.00 |
ENST00000632099.1
|
IGHV3-64D
|
immunoglobulin heavy variable 3-64D |
| chr7_+_50304693 | 9.98 |
ENST00000331340.8
ENST00000413698.5 ENST00000612658.4 ENST00000359197.9 ENST00000349824.8 ENST00000343574.9 ENST00000357364.8 ENST00000440768.6 ENST00000346667.8 ENST00000615491.4 |
IKZF1
|
IKAROS family zinc finger 1 |
| chr14_-_106422175 | 9.85 |
ENST00000390619.2
|
IGHV4-39
|
immunoglobulin heavy variable 4-39 |
| chr3_+_122325237 | 9.83 |
ENST00000264474.4
ENST00000479204.1 |
CSTA
|
cystatin A |
| chrX_-_107775740 | 9.82 |
ENST00000372383.9
|
TSC22D3
|
TSC22 domain family member 3 |
| chrX_+_129779930 | 9.60 |
ENST00000356892.4
|
SASH3
|
SAM and SH3 domain containing 3 |
| chr14_-_106811131 | 9.47 |
ENST00000424969.2
|
IGHV3-74
|
immunoglobulin heavy variable 3-74 |
| chr2_+_89959979 | 9.44 |
ENST00000453166.2
|
IGKV2D-28
|
immunoglobulin kappa variable 2D-28 |
| chr14_-_95714088 | 9.38 |
ENST00000556450.5
|
TCL1A
|
TCL1 family AKT coactivator A |
| chrX_-_107775951 | 9.28 |
ENST00000315660.8
ENST00000372384.6 ENST00000502650.1 ENST00000506724.1 |
TSC22D3
|
TSC22 domain family member 3 |
| chr1_-_206921867 | 9.08 |
ENST00000628511.2
ENST00000367091.8 |
FCMR
|
Fc fragment of IgM receptor |
| chr19_-_54281082 | 8.96 |
ENST00000314446.10
|
LILRB2
|
leukocyte immunoglobulin like receptor B2 |
| chr14_-_106557465 | 8.94 |
ENST00000390625.3
|
IGHV3-49
|
immunoglobulin heavy variable 3-49 |
| chr14_-_95714114 | 8.85 |
ENST00000402399.6
ENST00000555202.1 |
TCL1A
|
TCL1 family AKT coactivator A |
| chr4_+_101813810 | 8.80 |
ENST00000444316.2
|
BANK1
|
B cell scaffold protein with ankyrin repeats 1 |
| chrY_+_2841594 | 8.76 |
ENST00000250784.13
|
RPS4Y1
|
ribosomal protein S4 Y-linked 1 |
| chr14_-_106062670 | 8.69 |
ENST00000390598.2
|
IGHV3-7
|
immunoglobulin heavy variable 3-7 |
| chr17_-_78128630 | 8.63 |
ENST00000306591.11
|
TMC6
|
transmembrane channel like 6 |
| chr6_+_32844789 | 8.60 |
ENST00000414474.5
|
PSMB9
|
proteasome 20S subunit beta 9 |
| chr14_-_95714146 | 8.56 |
ENST00000554012.5
|
TCL1A
|
TCL1 family AKT coactivator A |
| chr1_+_116754422 | 8.53 |
ENST00000369478.4
ENST00000369477.1 |
CD2
|
CD2 molecule |
| chr2_-_89222461 | 8.46 |
ENST00000482769.1
|
IGKV2-28
|
immunoglobulin kappa variable 2-28 |
| chr12_-_10130241 | 8.44 |
ENST00000353231.9
ENST00000525605.1 |
CLEC7A
|
C-type lectin domain containing 7A |
| chr14_-_106622837 | 8.30 |
ENST00000390628.3
|
IGHV1-58
|
immunoglobulin heavy variable 1-58 |
| chr2_-_89085787 | 8.29 |
ENST00000390252.2
|
IGKV3-15
|
immunoglobulin kappa variable 3-15 |
| chr6_-_52763473 | 8.28 |
ENST00000493422.3
|
GSTA2
|
glutathione S-transferase alpha 2 |
| chr3_-_39280432 | 8.06 |
ENST00000542107.5
ENST00000435290.1 |
CX3CR1
|
C-X3-C motif chemokine receptor 1 |
| chr11_-_5243644 | 8.03 |
ENST00000643122.1
|
HBD
|
hemoglobin subunit delta |
| chr4_+_25160631 | 8.02 |
ENST00000510415.1
ENST00000507794.2 ENST00000512921.4 |
SEPSECS-AS1
PI4K2B
|
SEPSECS antisense RNA 1 (head to head) phosphatidylinositol 4-kinase type 2 beta |
| chr2_+_90154073 | 7.89 |
ENST00000611391.1
|
IGKV1D-13
|
immunoglobulin kappa variable 1D-13 |
| chr14_-_106593319 | 7.88 |
ENST00000390627.3
|
IGHV3-53
|
immunoglobulin heavy variable 3-53 |
| chr1_-_150765735 | 7.82 |
ENST00000679898.1
ENST00000448301.7 ENST00000680664.1 ENST00000679512.1 ENST00000368985.8 ENST00000679582.1 |
CTSS
|
cathepsin S |
| chr11_+_72080313 | 7.74 |
ENST00000307198.11
ENST00000538413.6 ENST00000642648.1 ENST00000289488.7 |
ENSG00000284922.2
LRTOMT
|
leucine rich transmembrane and O-methyltransferase domain containing leucine rich transmembrane and O-methyltransferase domain containing |
| chr16_+_33009175 | 7.58 |
ENST00000565407.2
|
IGHV3OR16-8
|
immunoglobulin heavy variable 3/OR16-8 (non-functional) |
| chr7_+_139829153 | 7.56 |
ENST00000652056.1
|
TBXAS1
|
thromboxane A synthase 1 |
| chr15_-_19988117 | 7.56 |
ENST00000558565.2
|
IGHV3OR15-7
|
immunoglobulin heavy variable 3/OR15-7 (pseudogene) |
| chr1_-_206921987 | 7.54 |
ENST00000530505.1
ENST00000442471.4 |
FCMR
|
Fc fragment of IgM receptor |
| chr11_-_85665077 | 7.54 |
ENST00000527447.2
|
CREBZF
|
CREB/ATF bZIP transcription factor |
| chr2_-_230225628 | 7.43 |
ENST00000540870.5
|
SP110
|
SP110 nuclear body protein |
| chr22_+_22811737 | 7.39 |
ENST00000390315.3
|
IGLV3-10
|
immunoglobulin lambda variable 3-10 |
| chr12_-_10130143 | 7.16 |
ENST00000298523.9
ENST00000396484.6 ENST00000310002.4 ENST00000304084.13 |
CLEC7A
|
C-type lectin domain containing 7A |
| chr2_+_230225718 | 6.99 |
ENST00000420434.7
ENST00000392045.8 ENST00000417495.7 ENST00000343805.10 |
SP140
|
SP140 nuclear body protein |
| chr2_-_89268506 | 6.96 |
ENST00000473726.1
|
IGKV1-33
|
immunoglobulin kappa variable 1-33 |
| chr22_+_22704265 | 6.80 |
ENST00000390307.2
|
IGLV3-22
|
immunoglobulin lambda variable 3-22 |
| chr14_-_106511856 | 6.80 |
ENST00000390622.2
|
IGHV1-46
|
immunoglobulin heavy variable 1-46 |
| chr17_-_64390852 | 6.78 |
ENST00000563924.6
|
PECAM1
|
platelet and endothelial cell adhesion molecule 1 |
| chr14_-_106875069 | 6.67 |
ENST00000390639.2
|
IGHV7-81
|
immunoglobulin heavy variable 7-81 (non-functional) |
| chr4_+_40192949 | 6.66 |
ENST00000507851.5
ENST00000615577.4 ENST00000613272.4 |
RHOH
|
ras homolog family member H |
| chr1_+_159005953 | 6.53 |
ENST00000426592.6
|
IFI16
|
interferon gamma inducible protein 16 |
| chr12_-_7503744 | 6.46 |
ENST00000396620.7
ENST00000432237.3 |
CD163
|
CD163 molecule |
| chr1_-_158686700 | 6.41 |
ENST00000643759.2
|
SPTA1
|
spectrin alpha, erythrocytic 1 |
| chr8_-_133060347 | 6.39 |
ENST00000427060.6
|
SLA
|
Src like adaptor |
| chrX_+_71118515 | 6.35 |
ENST00000333646.10
|
MED12
|
mediator complex subunit 12 |
| chr14_-_106277039 | 6.24 |
ENST00000390610.2
|
IGHV1-24
|
immunoglobulin heavy variable 1-24 |
| chr1_+_159008978 | 6.20 |
ENST00000447473.6
|
IFI16
|
interferon gamma inducible protein 16 |
| chr11_+_65879791 | 6.20 |
ENST00000528419.6
ENST00000307886.8 ENST00000526034.2 ENST00000679584.1 ENST00000680443.1 ENST00000680670.1 |
CTSW
|
cathepsin W |
| chr2_+_89936859 | 6.17 |
ENST00000474213.1
|
IGKV2D-30
|
immunoglobulin kappa variable 2D-30 |
| chr2_+_89851723 | 6.05 |
ENST00000429992.2
|
IGKV2D-40
|
immunoglobulin kappa variable 2D-40 |
| chr14_-_75126964 | 6.05 |
ENST00000678037.1
ENST00000553823.6 ENST00000678531.1 ENST00000238616.10 |
NEK9
|
NIMA related kinase 9 |
| chr1_+_89995102 | 6.05 |
ENST00000340281.9
ENST00000361911.9 ENST00000370447.3 |
ZNF326
|
zinc finger protein 326 |
| chr1_-_150765785 | 6.00 |
ENST00000680311.1
ENST00000681728.1 ENST00000680288.1 |
CTSS
|
cathepsin S |
| chr19_-_54281145 | 5.78 |
ENST00000434421.5
ENST00000391749.4 |
LILRB2
|
leukocyte immunoglobulin like receptor B2 |
| chr4_+_69995958 | 5.75 |
ENST00000381060.2
ENST00000246895.9 |
STATH
|
statherin |
| chr8_-_85341705 | 5.64 |
ENST00000517618.5
|
CA1
|
carbonic anhydrase 1 |
| chr17_-_78128731 | 5.64 |
ENST00000592063.5
ENST00000590602.6 ENST00000589271.5 |
TMC6
|
transmembrane channel like 6 |
| chr1_+_158845798 | 5.57 |
ENST00000438394.1
|
MNDA
|
myeloid cell nuclear differentiation antigen |
| chr2_-_89297785 | 5.56 |
ENST00000465170.1
|
IGKV1-37
|
immunoglobulin kappa variable 1-37 (non-functional) |
| chr6_+_137871208 | 5.47 |
ENST00000614035.4
ENST00000621150.3 ENST00000619035.4 ENST00000615468.4 ENST00000620204.3 |
TNFAIP3
|
TNF alpha induced protein 3 |
| chr7_+_139829242 | 5.47 |
ENST00000455353.6
ENST00000458722.6 ENST00000448866.7 ENST00000411653.6 |
TBXAS1
|
thromboxane A synthase 1 |
| chr22_+_36913620 | 5.46 |
ENST00000403662.8
ENST00000262825.9 |
CSF2RB
|
colony stimulating factor 2 receptor subunit beta |
| chr12_+_12357056 | 5.42 |
ENST00000314565.9
ENST00000542728.5 |
BORCS5
|
BLOC-1 related complex subunit 5 |
| chr6_+_31615215 | 5.38 |
ENST00000337917.11
ENST00000376059.8 |
AIF1
|
allograft inflammatory factor 1 |
| chr13_-_99258366 | 5.30 |
ENST00000397470.5
ENST00000397473.7 |
GPR18
|
G protein-coupled receptor 18 |
| chr17_-_64006880 | 5.29 |
ENST00000449662.6
|
ICAM2
|
intercellular adhesion molecule 2 |
| chr5_+_55024250 | 5.27 |
ENST00000231009.3
|
GZMK
|
granzyme K |
| chr4_-_56681288 | 5.25 |
ENST00000556376.6
ENST00000420433.6 |
HOPX
|
HOP homeobox |
| chr14_-_106154113 | 5.23 |
ENST00000390603.2
|
IGHV3-15
|
immunoglobulin heavy variable 3-15 |
| chr2_-_178807415 | 5.22 |
ENST00000342992.10
ENST00000460472.6 ENST00000589042.5 ENST00000591111.5 ENST00000360870.10 |
TTN
|
titin |
| chr4_-_56681588 | 5.15 |
ENST00000554144.5
ENST00000381260.7 |
HOPX
|
HOP homeobox |
| chr9_-_21368962 | 5.13 |
ENST00000610660.1
|
IFNA13
|
interferon alpha 13 |
| chr15_-_79971164 | 5.12 |
ENST00000335661.6
ENST00000267953.4 ENST00000677151.1 |
BCL2A1
|
BCL2 related protein A1 |
| chr2_+_113406368 | 5.11 |
ENST00000453673.3
|
IGKV1OR2-108
|
immunoglobulin kappa variable 1/OR2-108 (non-functional) |
| chr7_-_36724457 | 5.10 |
ENST00000617537.5
ENST00000435386.1 |
AOAH
|
acyloxyacyl hydrolase |
| chr6_-_32192630 | 5.05 |
ENST00000375040.8
|
GPSM3
|
G protein signaling modulator 3 |
| chr6_-_49744434 | 5.04 |
ENST00000433368.6
ENST00000354620.4 |
CRISP3
|
cysteine rich secretory protein 3 |
| chr2_-_88947820 | 5.03 |
ENST00000496168.1
|
IGKV1-5
|
immunoglobulin kappa variable 1-5 |
| chr11_+_63536801 | 4.99 |
ENST00000255688.8
ENST00000439013.6 |
PLAAT4
|
phospholipase A and acyltransferase 4 |
| chr6_-_32192845 | 4.99 |
ENST00000487761.5
|
GPSM3
|
G protein signaling modulator 3 |
| chr1_+_111139436 | 4.98 |
ENST00000545121.5
|
CEPT1
|
choline/ethanolamine phosphotransferase 1 |
| chr4_+_174283886 | 4.92 |
ENST00000457424.6
ENST00000503780.6 ENST00000514712.5 |
CEP44
|
centrosomal protein 44 |
| chr1_+_26529745 | 4.92 |
ENST00000374168.7
ENST00000374166.8 |
RPS6KA1
|
ribosomal protein S6 kinase A1 |
| chr11_-_57568276 | 4.91 |
ENST00000340573.8
|
UBE2L6
|
ubiquitin conjugating enzyme E2 L6 |
| chr17_+_58238426 | 4.91 |
ENST00000421678.6
ENST00000262290.9 ENST00000543544.5 |
LPO
|
lactoperoxidase |
| chr14_-_106627685 | 4.90 |
ENST00000390629.3
|
IGHV4-59
|
immunoglobulin heavy variable 4-59 |
| chr12_-_96035571 | 4.87 |
ENST00000228740.7
|
LTA4H
|
leukotriene A4 hydrolase |
| chr19_-_10380558 | 4.86 |
ENST00000524462.5
ENST00000525621.6 ENST00000531836.5 |
TYK2
|
tyrosine kinase 2 |
| chr1_+_159015665 | 4.86 |
ENST00000567661.5
ENST00000474473.1 |
IFI16
|
interferon gamma inducible protein 16 |
| chr3_+_111542178 | 4.81 |
ENST00000283285.10
ENST00000352690.9 |
CD96
|
CD96 molecule |
| chr21_+_38256984 | 4.71 |
ENST00000398938.7
|
KCNJ15
|
potassium inwardly rectifying channel subfamily J member 15 |
| chr12_-_91180365 | 4.71 |
ENST00000547937.5
|
DCN
|
decorin |
| chr9_-_120914549 | 4.70 |
ENST00000546084.5
|
TRAF1
|
TNF receptor associated factor 1 |
| chr12_+_10307950 | 4.64 |
ENST00000543420.5
ENST00000543777.5 |
KLRD1
|
killer cell lectin like receptor D1 |
| chr6_-_49744378 | 4.62 |
ENST00000371159.8
ENST00000263045.9 |
CRISP3
|
cysteine rich secretory protein 3 |
| chr8_+_2045037 | 4.62 |
ENST00000262113.9
|
MYOM2
|
myomesin 2 |
| chr7_-_150632644 | 4.61 |
ENST00000618759.4
|
GIMAP6
|
GTPase, IMAP family member 6 |
| chr17_-_30824665 | 4.60 |
ENST00000324238.7
|
CRLF3
|
cytokine receptor like factor 3 |
| chr5_-_140633167 | 4.57 |
ENST00000302014.11
|
CD14
|
CD14 molecule |
| chr19_-_41363930 | 4.55 |
ENST00000675972.1
|
B9D2
|
B9 domain containing 2 |
| chr12_+_75391078 | 4.42 |
ENST00000550916.6
ENST00000378692.7 ENST00000320460.8 ENST00000547164.1 |
GLIPR1L2
|
GLIPR1 like 2 |
| chr7_-_36724380 | 4.37 |
ENST00000617267.4
|
AOAH
|
acyloxyacyl hydrolase |
| chr15_-_55270383 | 4.34 |
ENST00000396307.6
|
RAB27A
|
RAB27A, member RAS oncogene family |
| chr12_-_113335030 | 4.32 |
ENST00000552014.5
ENST00000680972.1 ENST00000548186.5 ENST00000202831.7 ENST00000549181.5 |
SLC8B1
|
solute carrier family 8 member B1 |
| chr12_+_10307818 | 4.26 |
ENST00000350274.9
ENST00000336164.9 |
KLRD1
|
killer cell lectin like receptor D1 |
| chr1_-_153041111 | 4.24 |
ENST00000360379.4
|
SPRR2D
|
small proline rich protein 2D |
| chr1_+_159009886 | 4.22 |
ENST00000340979.10
ENST00000368131.8 ENST00000295809.12 ENST00000368132.7 |
IFI16
|
interferon gamma inducible protein 16 |
| chrX_+_124346544 | 4.22 |
ENST00000371139.9
|
SH2D1A
|
SH2 domain containing 1A |
| chr17_-_78128778 | 4.20 |
ENST00000589553.5
|
TMC6
|
transmembrane channel like 6 |
| chr2_+_98444835 | 4.20 |
ENST00000409016.8
ENST00000409463.5 ENST00000074304.9 ENST00000409851.8 ENST00000409540.7 |
INPP4A
|
inositol polyphosphate-4-phosphatase type I A |
| chr8_+_2045058 | 4.20 |
ENST00000523438.1
|
MYOM2
|
myomesin 2 |
| chr19_+_4791710 | 4.19 |
ENST00000269856.5
|
FEM1A
|
fem-1 homolog A |
| chr13_-_48413105 | 4.18 |
ENST00000620633.5
|
LPAR6
|
lysophosphatidic acid receptor 6 |
| chr21_+_38256698 | 4.18 |
ENST00000613499.4
ENST00000612702.4 ENST00000398925.5 ENST00000398928.5 ENST00000328656.8 ENST00000443341.5 |
KCNJ15
|
potassium inwardly rectifying channel subfamily J member 15 |
| chr14_+_22450089 | 4.15 |
ENST00000390473.1
|
TRDJ1
|
T cell receptor delta joining 1 |
| chrY_+_20575792 | 4.12 |
ENST00000382772.3
|
EIF1AY
|
eukaryotic translation initiation factor 1A Y-linked |
| chr5_+_35856883 | 4.08 |
ENST00000506850.5
ENST00000303115.8 ENST00000511982.1 |
IL7R
|
interleukin 7 receptor |
| chr11_+_6863057 | 4.08 |
ENST00000641461.1
|
OR10A2
|
olfactory receptor family 10 subfamily A member 2 |
| chr1_-_226739271 | 4.06 |
ENST00000429204.6
ENST00000366784.1 |
ITPKB
|
inositol-trisphosphate 3-kinase B |
| chr5_+_157180816 | 4.04 |
ENST00000422843.8
|
ITK
|
IL2 inducible T cell kinase |
| chr1_+_159010002 | 4.03 |
ENST00000359709.7
|
IFI16
|
interferon gamma inducible protein 16 |
| chr6_-_41941795 | 4.02 |
ENST00000372991.9
|
CCND3
|
cyclin D3 |
| chrY_+_20575716 | 4.01 |
ENST00000361365.7
|
EIF1AY
|
eukaryotic translation initiation factor 1A Y-linked |
| chr12_-_9115907 | 3.97 |
ENST00000318602.12
|
A2M
|
alpha-2-macroglobulin |
| chr16_-_25015311 | 3.89 |
ENST00000303665.9
ENST00000455311.6 ENST00000289968.11 |
ARHGAP17
|
Rho GTPase activating protein 17 |
| chr13_-_106568107 | 3.86 |
ENST00000400198.8
|
ARGLU1
|
arginine and glutamate rich 1 |
| chr4_+_70430487 | 3.85 |
ENST00000413702.5
|
MUC7
|
mucin 7, secreted |
| chr12_-_7503841 | 3.84 |
ENST00000359156.8
|
CD163
|
CD163 molecule |
| chr15_-_56245074 | 3.82 |
ENST00000674082.1
|
RFX7
|
regulatory factor X7 |
| chr5_+_157269317 | 3.79 |
ENST00000618329.4
|
CYFIP2
|
cytoplasmic FMR1 interacting protein 2 |
| chr3_+_44338119 | 3.73 |
ENST00000383746.7
ENST00000417237.5 |
TCAIM
|
T cell activation inhibitor, mitochondrial |
| chr10_+_71319249 | 3.71 |
ENST00000373189.6
ENST00000479577.2 |
SLC29A3
|
solute carrier family 29 member 3 |
| chr19_-_54364983 | 3.70 |
ENST00000434277.6
|
LAIR1
|
leukocyte associated immunoglobulin like receptor 1 |
| chr9_+_89318811 | 3.68 |
ENST00000534113.6
|
SECISBP2
|
SECIS binding protein 2 |
| chr8_+_132866948 | 3.68 |
ENST00000220616.9
|
TG
|
thyroglobulin |
| chr14_-_106360320 | 3.67 |
ENST00000390615.2
|
IGHV3-33
|
immunoglobulin heavy variable 3-33 |
| chr19_+_41884370 | 3.67 |
ENST00000378152.8
ENST00000337665.8 |
ARHGEF1
|
Rho guanine nucleotide exchange factor 1 |
| chr10_+_46375645 | 3.63 |
ENST00000622769.4
|
ANXA8L1
|
annexin A8 like 1 |
| chr1_-_153057504 | 3.61 |
ENST00000392653.3
|
SPRR2A
|
small proline rich protein 2A |
| chrX_+_71118576 | 3.61 |
ENST00000374080.8
|
MED12
|
mediator complex subunit 12 |
| chr7_+_80638662 | 3.60 |
ENST00000394788.7
|
CD36
|
CD36 molecule |
| chr18_-_55351977 | 3.59 |
ENST00000643689.1
|
TCF4
|
transcription factor 4 |
| chr19_-_14778552 | 3.57 |
ENST00000315576.8
|
ADGRE2
|
adhesion G protein-coupled receptor E2 |
| chr16_-_67936808 | 3.56 |
ENST00000358514.9
|
PSMB10
|
proteasome 20S subunit beta 10 |
| chr20_+_63733219 | 3.55 |
ENST00000632538.1
|
ENSG00000273154.3
|
novel protein, ZGPAT-LIME1 readthrough |
| chr14_+_61187544 | 3.53 |
ENST00000555185.5
ENST00000557294.5 ENST00000556778.5 |
PRKCH
|
protein kinase C eta |
| chr8_+_95133746 | 3.50 |
ENST00000315367.4
|
PLEKHF2
|
pleckstrin homology and FYVE domain containing 2 |
| chr12_-_10454485 | 3.50 |
ENST00000408006.7
ENST00000544822.2 ENST00000536188.5 |
KLRC1
|
killer cell lectin like receptor C1 |
| chr14_-_90331904 | 3.49 |
ENST00000628832.1
ENST00000354366.8 |
NRDE2
|
NRDE-2, necessary for RNA interference, domain containing |
| chr14_+_20891385 | 3.48 |
ENST00000304639.4
|
RNASE3
|
ribonuclease A family member 3 |
| chr7_+_150567347 | 3.45 |
ENST00000461940.5
|
GIMAP4
|
GTPase, IMAP family member 4 |
| chrX_+_12975083 | 3.43 |
ENST00000451311.7
ENST00000380636.1 |
TMSB4X
|
thymosin beta 4 X-linked |
| chr11_+_57597563 | 3.41 |
ENST00000619430.2
ENST00000457869.1 ENST00000340687.10 ENST00000278407.9 ENST00000378323.8 ENST00000378324.6 ENST00000403558.1 |
SERPING1
|
serpin family G member 1 |
Gene Ontology Analysis
Gene overrepresentation in biological process category:
| Log-likelihood per target | Total log-likelihood | Term | Description |
|---|---|---|---|
| 11.2 | 33.6 | GO:0002378 | immunoglobulin biosynthetic process(GO:0002378) |
| 4.6 | 13.8 | GO:0034769 | basement membrane disassembly(GO:0034769) |
| 4.2 | 12.7 | GO:0030185 | nitric oxide transport(GO:0030185) |
| 3.5 | 17.4 | GO:1903904 | negative regulation of establishment of T cell polarity(GO:1903904) negative regulation of Rho guanyl-nucleotide exchange factor activity(GO:2001107) |
| 3.0 | 15.2 | GO:0046103 | adenosine catabolic process(GO:0006154) inosine biosynthetic process(GO:0046103) |
| 2.8 | 14.0 | GO:0016998 | cell wall macromolecule catabolic process(GO:0016998) |
| 2.6 | 7.9 | GO:0038156 | interleukin-3-mediated signaling pathway(GO:0038156) |
| 2.5 | 7.4 | GO:0001868 | regulation of complement activation, lectin pathway(GO:0001868) negative regulation of complement activation, lectin pathway(GO:0001869) |
| 2.4 | 19.1 | GO:0070236 | regulation of activation-induced cell death of T cells(GO:0070235) negative regulation of activation-induced cell death of T cells(GO:0070236) |
| 2.4 | 346.3 | GO:0006958 | complement activation, classical pathway(GO:0006958) |
| 2.4 | 7.1 | GO:0030241 | skeletal muscle myosin thick filament assembly(GO:0030241) |
| 2.1 | 6.2 | GO:1901895 | negative regulation of calcium-transporting ATPase activity(GO:1901895) |
| 2.0 | 8.1 | GO:0002881 | negative regulation of chronic inflammatory response to non-antigenic stimulus(GO:0002881) |
| 1.9 | 7.8 | GO:0034136 | negative regulation of toll-like receptor 2 signaling pathway(GO:0034136) |
| 1.9 | 25.0 | GO:2001300 | lipoxin metabolic process(GO:2001300) |
| 1.9 | 13.3 | GO:0060267 | positive regulation of respiratory burst(GO:0060267) |
| 1.9 | 13.2 | GO:0090245 | axis elongation involved in somitogenesis(GO:0090245) |
| 1.9 | 5.6 | GO:0002304 | gamma-delta intraepithelial T cell differentiation(GO:0002304) CD8-positive, gamma-delta intraepithelial T cell differentiation(GO:0002305) |
| 1.9 | 5.6 | GO:1900195 | positive regulation of oocyte maturation(GO:1900195) negative regulation of NLRP3 inflammasome complex assembly(GO:1900226) positive regulation of proteasomal ubiquitin-dependent protein catabolic process involved in cellular response to hypoxia(GO:2000777) |
| 1.8 | 14.7 | GO:0002774 | Fc receptor mediated inhibitory signaling pathway(GO:0002774) |
| 1.7 | 6.8 | GO:0050904 | diapedesis(GO:0050904) glomerular endothelium development(GO:0072011) |
| 1.7 | 5.1 | GO:1902846 | regulation of spindle elongation(GO:0032887) regulation of mitotic spindle elongation(GO:0032888) anastral spindle assembly(GO:0055048) protein localization to spindle pole body(GO:0071988) regulation of protein localization to spindle pole body(GO:1902363) positive regulation of protein localization to spindle pole body(GO:1902365) positive regulation of mitotic spindle elongation(GO:1902846) |
| 1.6 | 3.2 | GO:0090290 | positive regulation of osteoclast proliferation(GO:0090290) |
| 1.5 | 16.9 | GO:0071726 | toll-like receptor TLR6:TLR2 signaling pathway(GO:0038124) response to diacyl bacterial lipopeptide(GO:0071724) cellular response to diacyl bacterial lipopeptide(GO:0071726) |
| 1.5 | 16.6 | GO:0043152 | induction of bacterial agglutination(GO:0043152) |
| 1.5 | 16.0 | GO:0032074 | negative regulation of nuclease activity(GO:0032074) |
| 1.4 | 1.4 | GO:0032661 | regulation of interleukin-18 production(GO:0032661) |
| 1.3 | 1.3 | GO:0060459 | left lung development(GO:0060459) |
| 1.3 | 2.6 | GO:1900425 | negative regulation of defense response to bacterium(GO:1900425) |
| 1.3 | 5.2 | GO:0051697 | protein delipidation(GO:0051697) |
| 1.3 | 5.1 | GO:0010430 | fatty acid omega-oxidation(GO:0010430) |
| 1.2 | 8.7 | GO:1903433 | regulation of constitutive secretory pathway(GO:1903433) |
| 1.2 | 16.0 | GO:1900747 | negative regulation of vascular endothelial growth factor signaling pathway(GO:1900747) |
| 1.2 | 2.4 | GO:2001027 | negative regulation of endothelial cell chemotaxis(GO:2001027) |
| 1.2 | 8.5 | GO:0030885 | regulation of myeloid dendritic cell activation(GO:0030885) |
| 1.2 | 4.8 | GO:0002727 | natural killer cell cytokine production(GO:0002370) regulation of natural killer cell cytokine production(GO:0002727) |
| 1.2 | 10.7 | GO:0031666 | positive regulation of lipopolysaccharide-mediated signaling pathway(GO:0031666) |
| 1.2 | 18.7 | GO:0045651 | positive regulation of macrophage differentiation(GO:0045651) |
| 1.1 | 6.8 | GO:2000483 | negative regulation of interleukin-8 secretion(GO:2000483) |
| 1.1 | 7.9 | GO:0014900 | muscle hyperplasia(GO:0014900) |
| 1.1 | 8.8 | GO:0002074 | extraocular skeletal muscle development(GO:0002074) |
| 1.1 | 3.2 | GO:2000538 | regulation of cGMP-mediated signaling(GO:0010752) regulation of B cell chemotaxis(GO:2000537) positive regulation of B cell chemotaxis(GO:2000538) |
| 1.1 | 3.2 | GO:2001226 | negative regulation of chloride transport(GO:2001226) |
| 1.0 | 2.1 | GO:0061031 | endodermal digestive tract morphogenesis(GO:0061031) |
| 1.0 | 4.1 | GO:0001915 | negative regulation of T cell mediated cytotoxicity(GO:0001915) |
| 1.0 | 22.9 | GO:0030889 | negative regulation of B cell proliferation(GO:0030889) |
| 1.0 | 2.0 | GO:0002314 | germinal center B cell differentiation(GO:0002314) |
| 1.0 | 9.8 | GO:1900165 | negative regulation of interleukin-6 secretion(GO:1900165) |
| 1.0 | 15.6 | GO:0006910 | phagocytosis, recognition(GO:0006910) |
| 0.9 | 2.8 | GO:0036049 | protein demalonylation(GO:0036046) peptidyl-lysine demalonylation(GO:0036047) protein desuccinylation(GO:0036048) peptidyl-lysine desuccinylation(GO:0036049) protein deglutarylation(GO:0061698) peptidyl-lysine deglutarylation(GO:0061699) |
| 0.9 | 32.3 | GO:0032461 | positive regulation of protein oligomerization(GO:0032461) |
| 0.9 | 2.7 | GO:0036233 | glycine import(GO:0036233) |
| 0.9 | 3.5 | GO:0050861 | positive regulation of B cell receptor signaling pathway(GO:0050861) |
| 0.9 | 2.6 | GO:0060474 | positive regulation of sperm motility involved in capacitation(GO:0060474) |
| 0.8 | 3.3 | GO:0015722 | canalicular bile acid transport(GO:0015722) |
| 0.8 | 1.6 | GO:0071336 | submandibular salivary gland formation(GO:0060661) hair follicle cell proliferation(GO:0071335) regulation of hair follicle cell proliferation(GO:0071336) positive regulation of hair follicle cell proliferation(GO:0071338) |
| 0.8 | 2.3 | GO:1900275 | negative regulation of phospholipase C activity(GO:1900275) |
| 0.7 | 3.0 | GO:0001555 | oocyte growth(GO:0001555) |
| 0.7 | 2.2 | GO:0060332 | positive regulation of response to interferon-gamma(GO:0060332) positive regulation of interferon-gamma-mediated signaling pathway(GO:0060335) |
| 0.7 | 2.2 | GO:0046271 | phenylpropanoid catabolic process(GO:0046271) |
| 0.7 | 111.1 | GO:0002377 | immunoglobulin production(GO:0002377) |
| 0.7 | 4.9 | GO:2000491 | positive regulation of hepatic stellate cell activation(GO:2000491) |
| 0.7 | 2.8 | GO:0035627 | ceramide transport(GO:0035627) |
| 0.7 | 4.2 | GO:2000158 | positive regulation of ubiquitin-specific protease activity(GO:2000158) |
| 0.7 | 2.1 | GO:0018094 | protein polyglycylation(GO:0018094) |
| 0.7 | 4.1 | GO:0033029 | neutrophil apoptotic process(GO:0001781) regulation of neutrophil apoptotic process(GO:0033029) |
| 0.7 | 11.4 | GO:0071803 | positive regulation of podosome assembly(GO:0071803) |
| 0.7 | 2.7 | GO:0036369 | transcription factor catabolic process(GO:0036369) |
| 0.7 | 10.0 | GO:1900017 | positive regulation of cytokine production involved in inflammatory response(GO:1900017) |
| 0.7 | 3.3 | GO:0019835 | cytolysis(GO:0019835) |
| 0.6 | 1.9 | GO:0035565 | regulation of pronephros size(GO:0035565) |
| 0.6 | 1.9 | GO:0014063 | negative regulation of serotonin secretion(GO:0014063) |
| 0.6 | 8.8 | GO:0002717 | positive regulation of natural killer cell mediated immunity(GO:0002717) positive regulation of natural killer cell mediated cytotoxicity(GO:0045954) |
| 0.6 | 3.1 | GO:2001184 | positive regulation of interleukin-12 secretion(GO:2001184) |
| 0.6 | 13.0 | GO:0019371 | cyclooxygenase pathway(GO:0019371) |
| 0.6 | 1.8 | GO:0072709 | cellular response to sorbitol(GO:0072709) |
| 0.6 | 4.9 | GO:0032020 | ISG15-protein conjugation(GO:0032020) |
| 0.6 | 1.8 | GO:0044565 | dendritic cell proliferation(GO:0044565) |
| 0.6 | 13.6 | GO:0002347 | response to tumor cell(GO:0002347) |
| 0.6 | 1.8 | GO:0090234 | regulation of centromere complex assembly(GO:0090230) regulation of kinetochore assembly(GO:0090234) |
| 0.6 | 1.2 | GO:0003290 | atrial septum secundum morphogenesis(GO:0003290) |
| 0.6 | 4.1 | GO:0001550 | ovarian cumulus expansion(GO:0001550) fused antrum stage(GO:0048165) negative regulation of chondrocyte proliferation(GO:1902731) |
| 0.6 | 26.1 | GO:0032731 | positive regulation of interleukin-1 beta production(GO:0032731) |
| 0.6 | 2.9 | GO:0006432 | phenylalanyl-tRNA aminoacylation(GO:0006432) |
| 0.6 | 2.9 | GO:0007161 | calcium-independent cell-matrix adhesion(GO:0007161) |
| 0.6 | 2.3 | GO:0072369 | regulation of lipid transport by positive regulation of transcription from RNA polymerase II promoter(GO:0072369) |
| 0.6 | 5.8 | GO:0046541 | saliva secretion(GO:0046541) |
| 0.6 | 2.3 | GO:0046968 | peptide antigen transport(GO:0046968) |
| 0.6 | 7.3 | GO:2000622 | regulation of nuclear-transcribed mRNA catabolic process, nonsense-mediated decay(GO:2000622) negative regulation of nuclear-transcribed mRNA catabolic process, nonsense-mediated decay(GO:2000623) |
| 0.6 | 22.9 | GO:0018149 | peptide cross-linking(GO:0018149) |
| 0.6 | 1.7 | GO:0002101 | tRNA wobble cytosine modification(GO:0002101) |
| 0.5 | 3.8 | GO:0051388 | positive regulation of neurotrophin TRK receptor signaling pathway(GO:0051388) |
| 0.5 | 9.3 | GO:0042424 | catechol-containing compound catabolic process(GO:0019614) catecholamine catabolic process(GO:0042424) |
| 0.5 | 1.5 | GO:2000360 | negative regulation of binding of sperm to zona pellucida(GO:2000360) |
| 0.5 | 5.6 | GO:0006657 | CDP-choline pathway(GO:0006657) |
| 0.5 | 2.0 | GO:0090467 | L-arginine import(GO:0043091) arginine import(GO:0090467) L-arginine transport(GO:1902023) |
| 0.5 | 1.5 | GO:0031448 | regulation of fast-twitch skeletal muscle fiber contraction(GO:0031446) positive regulation of fast-twitch skeletal muscle fiber contraction(GO:0031448) |
| 0.5 | 3.5 | GO:2000660 | negative regulation of interleukin-1-mediated signaling pathway(GO:2000660) |
| 0.5 | 4.0 | GO:0015705 | iodide transport(GO:0015705) |
| 0.5 | 18.9 | GO:0033198 | response to ATP(GO:0033198) |
| 0.5 | 10.4 | GO:0001829 | trophectodermal cell differentiation(GO:0001829) |
| 0.5 | 3.0 | GO:0090116 | C-5 methylation of cytosine(GO:0090116) |
| 0.5 | 3.3 | GO:0044245 | polysaccharide digestion(GO:0044245) |
| 0.5 | 23.0 | GO:0032729 | positive regulation of interferon-gamma production(GO:0032729) |
| 0.5 | 4.2 | GO:0001865 | NK T cell differentiation(GO:0001865) |
| 0.5 | 2.8 | GO:0034587 | piRNA metabolic process(GO:0034587) |
| 0.5 | 0.9 | GO:0031959 | mineralocorticoid receptor signaling pathway(GO:0031959) |
| 0.5 | 0.9 | GO:0007525 | somatic muscle development(GO:0007525) |
| 0.4 | 1.3 | GO:0002415 | immunoglobulin transcytosis in epithelial cells mediated by polymeric immunoglobulin receptor(GO:0002415) |
| 0.4 | 2.6 | GO:1904304 | regulation of gastro-intestinal system smooth muscle contraction(GO:1904304) positive regulation of gastro-intestinal system smooth muscle contraction(GO:1904306) |
| 0.4 | 4.3 | GO:2001256 | regulation of store-operated calcium entry(GO:2001256) |
| 0.4 | 2.2 | GO:0007341 | penetration of zona pellucida(GO:0007341) |
| 0.4 | 2.1 | GO:0035093 | spermatogenesis, exchange of chromosomal proteins(GO:0035093) |
| 0.4 | 1.7 | GO:0071896 | protein localization to adherens junction(GO:0071896) |
| 0.4 | 1.7 | GO:0031117 | positive regulation of microtubule depolymerization(GO:0031117) |
| 0.4 | 2.0 | GO:0015742 | alpha-ketoglutarate transport(GO:0015742) |
| 0.4 | 2.0 | GO:0006574 | valine catabolic process(GO:0006574) |
| 0.4 | 8.2 | GO:0005513 | detection of calcium ion(GO:0005513) |
| 0.4 | 1.6 | GO:1900041 | negative regulation of interleukin-2 secretion(GO:1900041) |
| 0.4 | 1.1 | GO:0033685 | negative regulation of luteinizing hormone secretion(GO:0033685) |
| 0.4 | 1.1 | GO:0071812 | circadian temperature homeostasis(GO:0060086) regulation of fever generation by regulation of prostaglandin secretion(GO:0071810) positive regulation of fever generation by positive regulation of prostaglandin secretion(GO:0071812) positive regulation of ERK1 and ERK2 cascade via TNFSF11-mediated signaling(GO:0071848) regulation of fever generation by prostaglandin secretion(GO:0100009) |
| 0.4 | 1.5 | GO:0030806 | negative regulation of cyclic nucleotide catabolic process(GO:0030806) negative regulation of cAMP catabolic process(GO:0030821) |
| 0.4 | 1.1 | GO:0010841 | positive regulation of circadian sleep/wake cycle, wakefulness(GO:0010841) |
| 0.4 | 1.8 | GO:0060054 | positive regulation of epithelial cell proliferation involved in wound healing(GO:0060054) |
| 0.4 | 1.4 | GO:0016334 | morphogenesis of follicular epithelium(GO:0016333) establishment or maintenance of polarity of follicular epithelium(GO:0016334) establishment of planar polarity of follicular epithelium(GO:0042247) |
| 0.4 | 1.1 | GO:0014062 | regulation of serotonin secretion(GO:0014062) |
| 0.3 | 3.1 | GO:0005981 | regulation of glycogen catabolic process(GO:0005981) |
| 0.3 | 2.1 | GO:0070171 | negative regulation of tooth mineralization(GO:0070171) |
| 0.3 | 1.4 | GO:0048807 | ectoderm and mesoderm interaction(GO:0007499) female genitalia morphogenesis(GO:0048807) |
| 0.3 | 2.7 | GO:0009972 | cytidine catabolic process(GO:0006216) cytidine deamination(GO:0009972) cytidine metabolic process(GO:0046087) |
| 0.3 | 2.4 | GO:0045919 | positive regulation of cytolysis(GO:0045919) |
| 0.3 | 3.1 | GO:0071492 | cellular response to UV-A(GO:0071492) |
| 0.3 | 4.6 | GO:1901642 | nucleoside transmembrane transport(GO:1901642) |
| 0.3 | 1.9 | GO:0032196 | transposition(GO:0032196) |
| 0.3 | 3.2 | GO:0032264 | IMP salvage(GO:0032264) |
| 0.3 | 5.7 | GO:0015671 | oxygen transport(GO:0015671) |
| 0.3 | 2.2 | GO:0070127 | tRNA aminoacylation for mitochondrial protein translation(GO:0070127) |
| 0.3 | 0.9 | GO:1901053 | sarcosine metabolic process(GO:1901052) sarcosine catabolic process(GO:1901053) |
| 0.3 | 0.6 | GO:0015669 | gas transport(GO:0015669) |
| 0.3 | 2.7 | GO:0032790 | ribosome disassembly(GO:0032790) |
| 0.3 | 2.4 | GO:0070995 | NADPH oxidation(GO:0070995) |
| 0.3 | 1.7 | GO:0006710 | androgen catabolic process(GO:0006710) |
| 0.3 | 1.2 | GO:1903385 | regulation of homophilic cell adhesion(GO:1903385) |
| 0.3 | 0.9 | GO:0042412 | taurine biosynthetic process(GO:0042412) |
| 0.3 | 1.4 | GO:0014056 | acetylcholine secretion, neurotransmission(GO:0014055) regulation of acetylcholine secretion, neurotransmission(GO:0014056) |
| 0.3 | 4.5 | GO:0060046 | regulation of acrosome reaction(GO:0060046) |
| 0.3 | 2.5 | GO:0042905 | 9-cis-retinoic acid biosynthetic process(GO:0042904) 9-cis-retinoic acid metabolic process(GO:0042905) |
| 0.3 | 2.8 | GO:0045779 | negative regulation of bone resorption(GO:0045779) |
| 0.3 | 1.3 | GO:1901911 | diadenosine polyphosphate catabolic process(GO:0015961) diphosphoinositol polyphosphate metabolic process(GO:0071543) diadenosine pentaphosphate metabolic process(GO:1901906) diadenosine pentaphosphate catabolic process(GO:1901907) diadenosine hexaphosphate metabolic process(GO:1901908) diadenosine hexaphosphate catabolic process(GO:1901909) adenosine 5'-(hexahydrogen pentaphosphate) metabolic process(GO:1901910) adenosine 5'-(hexahydrogen pentaphosphate) catabolic process(GO:1901911) |
| 0.3 | 2.7 | GO:0034058 | endosomal vesicle fusion(GO:0034058) |
| 0.3 | 1.3 | GO:0010519 | negative regulation of phospholipase activity(GO:0010519) |
| 0.3 | 17.0 | GO:0006968 | cellular defense response(GO:0006968) |
| 0.3 | 1.6 | GO:0090073 | positive regulation of protein homodimerization activity(GO:0090073) |
| 0.3 | 2.3 | GO:0046598 | positive regulation of viral entry into host cell(GO:0046598) |
| 0.3 | 0.8 | GO:1990168 | protein K33-linked deubiquitination(GO:1990168) |
| 0.3 | 19.6 | GO:0071349 | interleukin-12-mediated signaling pathway(GO:0035722) response to interleukin-12(GO:0070671) cellular response to interleukin-12(GO:0071349) |
| 0.2 | 2.2 | GO:0006776 | vitamin A metabolic process(GO:0006776) |
| 0.2 | 2.2 | GO:0051045 | negative regulation of membrane protein ectodomain proteolysis(GO:0051045) |
| 0.2 | 2.0 | GO:0030091 | protein repair(GO:0030091) |
| 0.2 | 0.7 | GO:0035359 | negative regulation of peroxisome proliferator activated receptor signaling pathway(GO:0035359) |
| 0.2 | 0.7 | GO:0070681 | glutaminyl-tRNAGln biosynthesis via transamidation(GO:0070681) |
| 0.2 | 1.7 | GO:0006489 | dolichyl diphosphate biosynthetic process(GO:0006489) dolichyl diphosphate metabolic process(GO:0046465) |
| 0.2 | 10.5 | GO:0010107 | potassium ion import(GO:0010107) |
| 0.2 | 1.9 | GO:0051414 | response to cortisol(GO:0051414) |
| 0.2 | 4.6 | GO:0098828 | positive regulation of inhibitory postsynaptic potential(GO:0097151) modulation of inhibitory postsynaptic potential(GO:0098828) |
| 0.2 | 1.6 | GO:0015712 | hexose phosphate transport(GO:0015712) glucose-6-phosphate transport(GO:0015760) |
| 0.2 | 3.0 | GO:0015074 | DNA integration(GO:0015074) |
| 0.2 | 0.8 | GO:1905065 | positive regulation of vascular smooth muscle cell differentiation(GO:1905065) |
| 0.2 | 1.7 | GO:2000773 | negative regulation of cellular senescence(GO:2000773) |
| 0.2 | 1.6 | GO:0032000 | positive regulation of fatty acid beta-oxidation(GO:0032000) |
| 0.2 | 3.9 | GO:0019370 | leukotriene biosynthetic process(GO:0019370) |
| 0.2 | 1.4 | GO:0071688 | striated muscle myosin thick filament assembly(GO:0071688) |
| 0.2 | 2.4 | GO:0010623 | programmed cell death involved in cell development(GO:0010623) |
| 0.2 | 0.8 | GO:1904381 | Golgi apparatus mannose trimming(GO:1904381) |
| 0.2 | 2.4 | GO:0030502 | negative regulation of bone mineralization(GO:0030502) |
| 0.2 | 2.2 | GO:0046784 | viral mRNA export from host cell nucleus(GO:0046784) |
| 0.2 | 6.4 | GO:0002260 | lymphocyte homeostasis(GO:0002260) |
| 0.2 | 2.5 | GO:0048227 | plasma membrane to endosome transport(GO:0048227) |
| 0.2 | 1.9 | GO:0046689 | response to mercury ion(GO:0046689) |
| 0.2 | 1.2 | GO:0006398 | mRNA 3'-end processing by stem-loop binding and cleavage(GO:0006398) |
| 0.2 | 0.2 | GO:1903487 | regulation of lactation(GO:1903487) |
| 0.2 | 2.1 | GO:0098789 | pre-mRNA cleavage required for polyadenylation(GO:0098789) |
| 0.2 | 0.8 | GO:0031999 | negative regulation of fatty acid beta-oxidation(GO:0031999) |
| 0.2 | 48.5 | GO:0002250 | adaptive immune response(GO:0002250) |
| 0.2 | 3.4 | GO:0033539 | fatty acid beta-oxidation using acyl-CoA dehydrogenase(GO:0033539) |
| 0.2 | 0.5 | GO:0097211 | response to gonadotropin-releasing hormone(GO:0097210) cellular response to gonadotropin-releasing hormone(GO:0097211) |
| 0.2 | 1.4 | GO:0006030 | chitin metabolic process(GO:0006030) chitin catabolic process(GO:0006032) |
| 0.2 | 13.5 | GO:0031295 | T cell costimulation(GO:0031295) |
| 0.2 | 2.7 | GO:0046688 | response to copper ion(GO:0046688) |
| 0.2 | 1.2 | GO:0003406 | retinal pigment epithelium development(GO:0003406) |
| 0.2 | 1.1 | GO:0061366 | negative regulation of growth hormone secretion(GO:0060125) behavioral response to chemical pain(GO:0061366) behavioral response to formalin induced pain(GO:0061368) |
| 0.2 | 1.1 | GO:1902659 | regulation of glucose mediated signaling pathway(GO:1902659) |
| 0.2 | 1.4 | GO:0008272 | sulfate transport(GO:0008272) |
| 0.2 | 1.4 | GO:0034983 | peptidyl-lysine deacetylation(GO:0034983) |
| 0.2 | 1.7 | GO:0008298 | intracellular mRNA localization(GO:0008298) |
| 0.2 | 6.2 | GO:0006953 | acute-phase response(GO:0006953) |
| 0.2 | 8.0 | GO:0045576 | mast cell activation(GO:0045576) |
| 0.2 | 2.0 | GO:0090023 | positive regulation of neutrophil chemotaxis(GO:0090023) |
| 0.1 | 11.7 | GO:0045814 | negative regulation of gene expression, epigenetic(GO:0045814) |
| 0.1 | 2.4 | GO:0035589 | G-protein coupled purinergic nucleotide receptor signaling pathway(GO:0035589) purinergic nucleotide receptor signaling pathway(GO:0035590) |
| 0.1 | 0.6 | GO:0072092 | ureteric bud invasion(GO:0072092) |
| 0.1 | 2.1 | GO:0051382 | kinetochore assembly(GO:0051382) |
| 0.1 | 0.4 | GO:0050928 | negative regulation of positive chemotaxis(GO:0050928) |
| 0.1 | 1.3 | GO:0051026 | chiasma assembly(GO:0051026) |
| 0.1 | 1.0 | GO:0000389 | mRNA 3'-splice site recognition(GO:0000389) |
| 0.1 | 0.9 | GO:0070172 | positive regulation of tooth mineralization(GO:0070172) |
| 0.1 | 1.0 | GO:0015886 | heme transport(GO:0015886) |
| 0.1 | 1.3 | GO:0031665 | negative regulation of lipopolysaccharide-mediated signaling pathway(GO:0031665) |
| 0.1 | 0.7 | GO:0036072 | intramembranous ossification(GO:0001957) direct ossification(GO:0036072) |
| 0.1 | 0.8 | GO:0061624 | fructose catabolic process(GO:0006001) fructose catabolic process to hydroxyacetone phosphate and glyceraldehyde-3-phosphate(GO:0061624) |
| 0.1 | 2.1 | GO:0050860 | negative regulation of T cell receptor signaling pathway(GO:0050860) |
| 0.1 | 2.1 | GO:0034356 | NAD biosynthesis via nicotinamide riboside salvage pathway(GO:0034356) |
| 0.1 | 1.4 | GO:0000733 | DNA strand renaturation(GO:0000733) |
| 0.1 | 2.2 | GO:0060766 | negative regulation of androgen receptor signaling pathway(GO:0060766) |
| 0.1 | 1.5 | GO:2000303 | regulation of sphingolipid biosynthetic process(GO:0090153) regulation of membrane lipid metabolic process(GO:1905038) regulation of ceramide biosynthetic process(GO:2000303) |
| 0.1 | 0.7 | GO:0048842 | positive regulation of axon extension involved in axon guidance(GO:0048842) |
| 0.1 | 0.5 | GO:0098957 | anterograde axonal transport of mitochondrion(GO:0098957) |
| 0.1 | 0.4 | GO:0050653 | chondroitin sulfate proteoglycan biosynthetic process, polysaccharide chain biosynthetic process(GO:0050653) |
| 0.1 | 12.4 | GO:0060337 | type I interferon signaling pathway(GO:0060337) cellular response to type I interferon(GO:0071357) |
| 0.1 | 1.7 | GO:0006449 | regulation of translational termination(GO:0006449) |
| 0.1 | 3.1 | GO:0043651 | linoleic acid metabolic process(GO:0043651) |
| 0.1 | 3.6 | GO:0048791 | calcium ion-regulated exocytosis of neurotransmitter(GO:0048791) |
| 0.1 | 2.9 | GO:0030206 | chondroitin sulfate biosynthetic process(GO:0030206) |
| 0.1 | 3.9 | GO:0060384 | innervation(GO:0060384) |
| 0.1 | 0.6 | GO:0044387 | negative regulation of protein kinase activity by regulation of protein phosphorylation(GO:0044387) |
| 0.1 | 1.2 | GO:0032754 | positive regulation of interleukin-5 production(GO:0032754) |
| 0.1 | 0.7 | GO:0070862 | negative regulation of protein exit from endoplasmic reticulum(GO:0070862) negative regulation of retrograde protein transport, ER to cytosol(GO:1904153) |
| 0.1 | 1.6 | GO:0048793 | pronephros development(GO:0048793) |
| 0.1 | 6.8 | GO:0046427 | positive regulation of JAK-STAT cascade(GO:0046427) positive regulation of STAT cascade(GO:1904894) |
| 0.1 | 33.4 | GO:0006413 | translational initiation(GO:0006413) |
| 0.1 | 4.2 | GO:0035025 | positive regulation of Rho protein signal transduction(GO:0035025) |
| 0.1 | 2.6 | GO:0046069 | cGMP catabolic process(GO:0046069) |
| 0.1 | 2.0 | GO:0007213 | G-protein coupled acetylcholine receptor signaling pathway(GO:0007213) |
| 0.1 | 0.6 | GO:0030321 | transepithelial chloride transport(GO:0030321) |
| 0.1 | 4.4 | GO:0044364 | killing of cells of other organism(GO:0031640) disruption of cells of other organism(GO:0044364) |
| 0.1 | 1.1 | GO:0001574 | ganglioside biosynthetic process(GO:0001574) |
| 0.1 | 1.2 | GO:0048251 | elastic fiber assembly(GO:0048251) |
| 0.1 | 0.5 | GO:0040030 | regulation of molecular function, epigenetic(GO:0040030) |
| 0.1 | 0.6 | GO:0061737 | leukotriene signaling pathway(GO:0061737) |
| 0.1 | 0.6 | GO:0009744 | response to sucrose(GO:0009744) response to disaccharide(GO:0034285) |
| 0.1 | 0.2 | GO:0038043 | interleukin-5-mediated signaling pathway(GO:0038043) |
| 0.1 | 1.0 | GO:0042989 | sequestering of actin monomers(GO:0042989) |
| 0.1 | 1.7 | GO:0002228 | natural killer cell mediated immunity(GO:0002228) |
| 0.1 | 0.5 | GO:1900245 | positive regulation of MDA-5 signaling pathway(GO:1900245) |
| 0.1 | 6.1 | GO:0007032 | endosome organization(GO:0007032) |
| 0.1 | 1.2 | GO:0006590 | thyroid hormone generation(GO:0006590) |
| 0.1 | 0.3 | GO:0050917 | sensory perception of sweet taste(GO:0050916) sensory perception of umami taste(GO:0050917) |
| 0.1 | 5.1 | GO:0001836 | release of cytochrome c from mitochondria(GO:0001836) |
| 0.1 | 1.0 | GO:0055091 | phospholipid homeostasis(GO:0055091) |
| 0.1 | 1.1 | GO:0036148 | phosphatidylglycerol acyl-chain remodeling(GO:0036148) phosphatidylinositol acyl-chain remodeling(GO:0036149) |
| 0.1 | 1.8 | GO:0039703 | viral RNA genome replication(GO:0039694) RNA replication(GO:0039703) |
| 0.1 | 8.0 | GO:0051291 | protein heterooligomerization(GO:0051291) |
| 0.1 | 0.5 | GO:0070294 | renal sodium ion absorption(GO:0070294) |
| 0.1 | 0.2 | GO:0030573 | bile acid catabolic process(GO:0030573) |
| 0.1 | 0.1 | GO:0010587 | miRNA catabolic process(GO:0010587) |
| 0.1 | 4.3 | GO:0010803 | regulation of tumor necrosis factor-mediated signaling pathway(GO:0010803) |
| 0.1 | 1.0 | GO:2001241 | positive regulation of extrinsic apoptotic signaling pathway in absence of ligand(GO:2001241) |
| 0.1 | 0.3 | GO:0070857 | regulation of bile acid biosynthetic process(GO:0070857) |
| 0.1 | 0.8 | GO:0042487 | regulation of odontogenesis of dentin-containing tooth(GO:0042487) |
| 0.1 | 0.6 | GO:0098535 | de novo centriole assembly(GO:0098535) |
| 0.1 | 1.6 | GO:0000027 | ribosomal large subunit assembly(GO:0000027) |
| 0.1 | 0.7 | GO:0010898 | positive regulation of triglyceride catabolic process(GO:0010898) |
| 0.1 | 2.5 | GO:0048247 | lymphocyte chemotaxis(GO:0048247) |
| 0.1 | 1.0 | GO:0043968 | histone H2A acetylation(GO:0043968) |
| 0.1 | 0.4 | GO:0071104 | response to interleukin-9(GO:0071104) |
| 0.1 | 0.7 | GO:0006702 | androgen biosynthetic process(GO:0006702) |
| 0.1 | 0.2 | GO:1990822 | basic amino acid transmembrane transport(GO:1990822) |
| 0.1 | 0.3 | GO:0090283 | regulation of protein glycosylation in Golgi(GO:0090283) |
| 0.1 | 0.9 | GO:0043508 | negative regulation of JUN kinase activity(GO:0043508) |
| 0.1 | 6.7 | GO:0050911 | detection of chemical stimulus involved in sensory perception of smell(GO:0050911) |
| 0.1 | 0.1 | GO:0034163 | regulation of toll-like receptor 9 signaling pathway(GO:0034163) |
| 0.1 | 0.4 | GO:1903282 | negative regulation of catecholamine metabolic process(GO:0045914) negative regulation of dopamine metabolic process(GO:0045963) negative regulation of dopamine uptake involved in synaptic transmission(GO:0051585) norepinephrine uptake(GO:0051620) regulation of norepinephrine uptake(GO:0051621) negative regulation of norepinephrine uptake(GO:0051622) negative regulation of catecholamine uptake involved in synaptic transmission(GO:0051945) regulation of glutathione peroxidase activity(GO:1903282) positive regulation of glutathione peroxidase activity(GO:1903284) positive regulation of hydrogen peroxide catabolic process(GO:1903285) regulation of peroxidase activity(GO:2000468) positive regulation of peroxidase activity(GO:2000470) |
| 0.1 | 1.0 | GO:0018298 | protein-chromophore linkage(GO:0018298) |
| 0.1 | 1.0 | GO:0016973 | poly(A)+ mRNA export from nucleus(GO:0016973) |
| 0.1 | 0.2 | GO:0097283 | keratinocyte apoptotic process(GO:0097283) regulation of keratinocyte apoptotic process(GO:1902172) |
| 0.1 | 1.6 | GO:1903557 | positive regulation of tumor necrosis factor production(GO:0032760) positive regulation of tumor necrosis factor superfamily cytokine production(GO:1903557) |
| 0.1 | 1.7 | GO:0000188 | inactivation of MAPK activity(GO:0000188) |
| 0.1 | 3.2 | GO:0045773 | positive regulation of axon extension(GO:0045773) |
| 0.1 | 2.7 | GO:0046626 | regulation of insulin receptor signaling pathway(GO:0046626) |
| 0.1 | 1.4 | GO:0046329 | negative regulation of JNK cascade(GO:0046329) |
| 0.1 | 0.6 | GO:0042908 | xenobiotic transport(GO:0042908) |
| 0.1 | 0.1 | GO:0016999 | antibiotic metabolic process(GO:0016999) |
| 0.1 | 2.4 | GO:0010501 | RNA secondary structure unwinding(GO:0010501) |
| 0.1 | 0.4 | GO:0097201 | negative regulation of transcription from RNA polymerase II promoter in response to stress(GO:0097201) |
| 0.1 | 1.5 | GO:0045668 | negative regulation of osteoblast differentiation(GO:0045668) |
| 0.1 | 0.7 | GO:0016024 | CDP-diacylglycerol biosynthetic process(GO:0016024) |
| 0.1 | 2.1 | GO:2001244 | positive regulation of intrinsic apoptotic signaling pathway(GO:2001244) |
| 0.1 | 1.7 | GO:0046426 | negative regulation of JAK-STAT cascade(GO:0046426) negative regulation of STAT cascade(GO:1904893) |
| 0.0 | 0.4 | GO:0010886 | positive regulation of cholesterol storage(GO:0010886) |
| 0.0 | 3.8 | GO:1902017 | regulation of cilium assembly(GO:1902017) |
| 0.0 | 0.4 | GO:0006682 | galactosylceramide biosynthetic process(GO:0006682) galactolipid biosynthetic process(GO:0019375) |
| 0.0 | 0.6 | GO:0042340 | keratan sulfate catabolic process(GO:0042340) |
| 0.0 | 1.3 | GO:0032007 | negative regulation of TOR signaling(GO:0032007) |
| 0.0 | 0.2 | GO:0071395 | response to jasmonic acid(GO:0009753) cellular response to jasmonic acid stimulus(GO:0071395) |
| 0.0 | 0.1 | GO:0033499 | galactose catabolic process via UDP-galactose(GO:0033499) |
| 0.0 | 1.6 | GO:0001541 | ovarian follicle development(GO:0001541) |
| 0.0 | 0.1 | GO:0042074 | cell migration involved in gastrulation(GO:0042074) |
| 0.0 | 1.1 | GO:0016338 | calcium-independent cell-cell adhesion via plasma membrane cell-adhesion molecules(GO:0016338) |
| 0.0 | 0.7 | GO:0032418 | lysosome localization(GO:0032418) |
| 0.0 | 0.4 | GO:0042635 | positive regulation of hair cycle(GO:0042635) positive regulation of hair follicle development(GO:0051798) |
| 0.0 | 0.1 | GO:1990086 | lens fiber cell apoptotic process(GO:1990086) |
| 0.0 | 0.2 | GO:1901727 | positive regulation of histone deacetylase activity(GO:1901727) |
| 0.0 | 0.4 | GO:0043562 | cellular response to nitrogen starvation(GO:0006995) cellular response to nitrogen levels(GO:0043562) |
| 0.0 | 1.8 | GO:0048384 | retinoic acid receptor signaling pathway(GO:0048384) |
| 0.0 | 0.5 | GO:0034498 | early endosome to Golgi transport(GO:0034498) |
| 0.0 | 2.7 | GO:0071222 | cellular response to lipopolysaccharide(GO:0071222) |
| 0.0 | 0.6 | GO:0033234 | negative regulation of protein sumoylation(GO:0033234) |
| 0.0 | 1.6 | GO:1902475 | L-alpha-amino acid transmembrane transport(GO:1902475) |
| 0.0 | 0.3 | GO:0015693 | magnesium ion transport(GO:0015693) |
| 0.0 | 0.2 | GO:0042791 | 5S class rRNA transcription from RNA polymerase III type 1 promoter(GO:0042791) tRNA transcription from RNA polymerase III promoter(GO:0042797) |
| 0.0 | 0.8 | GO:0007398 | ectoderm development(GO:0007398) |
| 0.0 | 1.6 | GO:0007077 | mitotic nuclear envelope disassembly(GO:0007077) |
| 0.0 | 0.8 | GO:0016578 | histone deubiquitination(GO:0016578) |
| 0.0 | 0.5 | GO:0018214 | peptidyl-glutamic acid carboxylation(GO:0017187) protein carboxylation(GO:0018214) |
| 0.0 | 2.1 | GO:0030282 | bone mineralization(GO:0030282) |
| 0.0 | 0.1 | GO:0045837 | negative regulation of mitochondrial membrane potential(GO:0010917) mitochondrial protein catabolic process(GO:0035694) negative regulation of membrane potential(GO:0045837) |
| 0.0 | 0.2 | GO:0086028 | bundle of His cell to Purkinje myocyte signaling(GO:0086028) bundle of His cell action potential(GO:0086043) |
| 0.0 | 0.1 | GO:0006290 | pyrimidine dimer repair(GO:0006290) |
| 0.0 | 1.5 | GO:0098869 | cellular oxidant detoxification(GO:0098869) |
| 0.0 | 0.6 | GO:2000651 | positive regulation of sodium ion transmembrane transporter activity(GO:2000651) |
| 0.0 | 1.6 | GO:0070527 | platelet aggregation(GO:0070527) |
| 0.0 | 0.3 | GO:0000244 | spliceosomal tri-snRNP complex assembly(GO:0000244) |
| 0.0 | 0.2 | GO:1902895 | positive regulation of pri-miRNA transcription from RNA polymerase II promoter(GO:1902895) |
| 0.0 | 0.9 | GO:0034067 | protein localization to Golgi apparatus(GO:0034067) |
| 0.0 | 0.9 | GO:0003009 | skeletal muscle contraction(GO:0003009) |
| 0.0 | 0.4 | GO:0016558 | protein import into peroxisome matrix(GO:0016558) |
| 0.0 | 0.1 | GO:0070901 | mitochondrial tRNA methylation(GO:0070901) |
| 0.0 | 0.9 | GO:0032784 | regulation of DNA-templated transcription, elongation(GO:0032784) |
| 0.0 | 0.8 | GO:0021983 | pituitary gland development(GO:0021983) |
| 0.0 | 0.6 | GO:0043171 | peptide catabolic process(GO:0043171) |
| 0.0 | 0.2 | GO:0070327 | thyroid hormone transport(GO:0070327) |
| 0.0 | 0.4 | GO:0006517 | protein deglycosylation(GO:0006517) |
| 0.0 | 0.3 | GO:0009083 | branched-chain amino acid catabolic process(GO:0009083) |
| 0.0 | 0.1 | GO:2000347 | positive regulation of hepatocyte proliferation(GO:2000347) |
| 0.0 | 0.1 | GO:0072574 | hepatocyte proliferation(GO:0072574) epithelial cell proliferation involved in liver morphogenesis(GO:0072575) liver morphogenesis(GO:0072576) |
| 0.0 | 0.1 | GO:0035435 | phosphate ion transmembrane transport(GO:0035435) |
| 0.0 | 0.3 | GO:0097502 | mannosylation(GO:0097502) |
| 0.0 | 0.2 | GO:0043248 | proteasome assembly(GO:0043248) |
| 0.0 | 1.5 | GO:0017148 | negative regulation of translation(GO:0017148) |
| 0.0 | 0.2 | GO:0044458 | motile cilium assembly(GO:0044458) |
Gene overrepresentation in cellular component category:
| Log-likelihood per target | Total log-likelihood | Term | Description |
|---|---|---|---|
| 4.4 | 13.3 | GO:0071753 | dimeric IgA immunoglobulin complex(GO:0071750) secretory dimeric IgA immunoglobulin complex(GO:0071752) IgM immunoglobulin complex(GO:0071753) IgM immunoglobulin complex, circulating(GO:0071754) pentameric IgM immunoglobulin complex(GO:0071756) |
| 3.2 | 12.7 | GO:0031838 | haptoglobin-hemoglobin complex(GO:0031838) |
| 2.7 | 128.7 | GO:0042571 | immunoglobulin complex, circulating(GO:0042571) |
| 2.1 | 14.5 | GO:0036021 | endolysosome lumen(GO:0036021) |
| 2.0 | 6.0 | GO:0044609 | DBIRD complex(GO:0044609) |
| 1.9 | 36.9 | GO:0042613 | MHC class II protein complex(GO:0042613) |
| 1.7 | 12.2 | GO:1990111 | spermatoproteasome complex(GO:1990111) |
| 1.7 | 5.1 | GO:0061673 | cortical microtubule(GO:0055028) mitotic spindle astral microtubule(GO:0061673) |
| 1.6 | 17.4 | GO:0060171 | stereocilium membrane(GO:0060171) |
| 1.4 | 5.4 | GO:0005873 | plus-end kinesin complex(GO:0005873) |
| 1.3 | 3.9 | GO:0097679 | other organism cytoplasm(GO:0097679) |
| 1.2 | 15.4 | GO:0098647 | collagen type VI trimer(GO:0005589) collagen beaded filament(GO:0098647) |
| 1.1 | 6.4 | GO:0032437 | cuticular plate(GO:0032437) |
| 1.0 | 176.4 | GO:0072562 | blood microparticle(GO:0072562) |
| 1.0 | 8.7 | GO:0070652 | HAUS complex(GO:0070652) |
| 1.0 | 2.9 | GO:0009328 | phenylalanine-tRNA ligase complex(GO:0009328) |
| 0.8 | 1.6 | GO:0033150 | perinuclear theca(GO:0033011) cytoskeletal calyx(GO:0033150) |
| 0.8 | 2.3 | GO:0035354 | Toll-like receptor 1-Toll-like receptor 2 protein complex(GO:0035354) |
| 0.7 | 2.2 | GO:0043159 | acrosomal matrix(GO:0043159) |
| 0.7 | 2.8 | GO:0071546 | pi-body(GO:0071546) |
| 0.7 | 2.7 | GO:1990876 | cytoplasmic side of nuclear pore(GO:1990876) |
| 0.7 | 17.5 | GO:0001891 | phagocytic cup(GO:0001891) |
| 0.6 | 3.1 | GO:0097169 | AIM2 inflammasome complex(GO:0097169) |
| 0.6 | 6.2 | GO:0098554 | cytoplasmic side of endoplasmic reticulum membrane(GO:0098554) |
| 0.6 | 3.6 | GO:1990769 | proximal neuron projection(GO:1990769) |
| 0.6 | 7.3 | GO:0031618 | nuclear pericentric heterochromatin(GO:0031618) |
| 0.6 | 4.4 | GO:0072487 | MSL complex(GO:0072487) |
| 0.5 | 10.2 | GO:0036038 | MKS complex(GO:0036038) |
| 0.5 | 6.9 | GO:0033093 | Weibel-Palade body(GO:0033093) |
| 0.5 | 1.6 | GO:0044393 | microspike(GO:0044393) |
| 0.5 | 2.1 | GO:0000818 | nuclear MIS12/MIND complex(GO:0000818) |
| 0.5 | 1.5 | GO:0030312 | external encapsulating structure(GO:0030312) |
| 0.5 | 4.6 | GO:0001520 | outer dense fiber(GO:0001520) |
| 0.5 | 4.6 | GO:0046696 | lipopolysaccharide receptor complex(GO:0046696) |
| 0.5 | 4.4 | GO:0044294 | dendritic growth cone(GO:0044294) |
| 0.5 | 2.0 | GO:1990393 | 3M complex(GO:1990393) |
| 0.5 | 4.3 | GO:0030061 | mitochondrial crista(GO:0030061) |
| 0.5 | 16.2 | GO:0031092 | platelet alpha granule membrane(GO:0031092) |
| 0.5 | 5.6 | GO:0005677 | chromatin silencing complex(GO:0005677) |
| 0.4 | 11.6 | GO:0032982 | myosin filament(GO:0032982) |
| 0.4 | 2.3 | GO:0045298 | tubulin complex(GO:0045298) |
| 0.4 | 2.6 | GO:0097209 | epidermal lamellar body(GO:0097209) |
| 0.4 | 2.1 | GO:0000788 | nuclear nucleosome(GO:0000788) |
| 0.4 | 2.1 | GO:0097539 | ciliary transition fiber(GO:0097539) |
| 0.4 | 1.4 | GO:0042643 | actomyosin, actin portion(GO:0042643) |
| 0.3 | 35.8 | GO:0070821 | tertiary granule membrane(GO:0070821) |
| 0.3 | 43.9 | GO:0035578 | azurophil granule lumen(GO:0035578) |
| 0.3 | 4.1 | GO:1990712 | HFE-transferrin receptor complex(GO:1990712) |
| 0.3 | 5.3 | GO:0001931 | uropod(GO:0001931) cell trailing edge(GO:0031254) |
| 0.3 | 5.0 | GO:0031089 | platelet dense granule lumen(GO:0031089) |
| 0.3 | 3.1 | GO:0042587 | glycogen granule(GO:0042587) |
| 0.3 | 1.4 | GO:0030314 | junctional membrane complex(GO:0030314) |
| 0.3 | 12.7 | GO:0001533 | cornified envelope(GO:0001533) |
| 0.3 | 1.3 | GO:0044352 | pinosome(GO:0044352) macropinosome(GO:0044354) |
| 0.2 | 1.0 | GO:0042272 | nuclear RNA export factor complex(GO:0042272) |
| 0.2 | 3.0 | GO:0017146 | NMDA selective glutamate receptor complex(GO:0017146) |
| 0.2 | 17.3 | GO:0022627 | cytosolic small ribosomal subunit(GO:0022627) |
| 0.2 | 1.0 | GO:0032777 | Piccolo NuA4 histone acetyltransferase complex(GO:0032777) |
| 0.2 | 0.7 | GO:0035517 | PR-DUB complex(GO:0035517) |
| 0.2 | 0.7 | GO:0030956 | glutamyl-tRNA(Gln) amidotransferase complex(GO:0030956) |
| 0.2 | 2.2 | GO:0000347 | THO complex(GO:0000347) THO complex part of transcription export complex(GO:0000445) |
| 0.2 | 67.2 | GO:0009897 | external side of plasma membrane(GO:0009897) |
| 0.2 | 2.6 | GO:0097524 | sperm plasma membrane(GO:0097524) |
| 0.2 | 3.2 | GO:0005847 | mRNA cleavage and polyadenylation specificity factor complex(GO:0005847) |
| 0.2 | 8.8 | GO:0016592 | mediator complex(GO:0016592) |
| 0.2 | 2.6 | GO:0017119 | Golgi transport complex(GO:0017119) |
| 0.2 | 1.8 | GO:0043190 | ATP-binding cassette (ABC) transporter complex(GO:0043190) |
| 0.2 | 2.1 | GO:0035145 | exon-exon junction complex(GO:0035145) |
| 0.2 | 2.6 | GO:0031045 | dense core granule(GO:0031045) |
| 0.2 | 2.9 | GO:0045277 | respiratory chain complex IV(GO:0045277) |
| 0.2 | 1.1 | GO:0002177 | manchette(GO:0002177) |
| 0.2 | 7.5 | GO:0101003 | ficolin-1-rich granule membrane(GO:0101003) |
| 0.2 | 4.9 | GO:0031093 | platelet alpha granule lumen(GO:0031093) |
| 0.2 | 3.6 | GO:1990124 | messenger ribonucleoprotein complex(GO:1990124) |
| 0.1 | 0.7 | GO:0000836 | ER ubiquitin ligase complex(GO:0000835) Hrd1p ubiquitin ligase complex(GO:0000836) |
| 0.1 | 2.7 | GO:0031265 | CD95 death-inducing signaling complex(GO:0031265) |
| 0.1 | 1.2 | GO:0071953 | elastic fiber(GO:0071953) |
| 0.1 | 1.6 | GO:0031464 | Cul4A-RING E3 ubiquitin ligase complex(GO:0031464) |
| 0.1 | 3.0 | GO:0005720 | nuclear heterochromatin(GO:0005720) |
| 0.1 | 0.8 | GO:0008282 | ATP-sensitive potassium channel complex(GO:0008282) |
| 0.1 | 0.3 | GO:0044218 | other organism cell membrane(GO:0044218) other organism membrane(GO:0044279) |
| 0.1 | 1.3 | GO:0030008 | TRAPP complex(GO:0030008) |
| 0.1 | 1.4 | GO:0034098 | VCP-NPL4-UFD1 AAA ATPase complex(GO:0034098) |
| 0.1 | 1.1 | GO:0046581 | intercellular canaliculus(GO:0046581) |
| 0.1 | 1.3 | GO:0071203 | WASH complex(GO:0071203) |
| 0.1 | 1.0 | GO:0005787 | signal peptidase complex(GO:0005787) |
| 0.1 | 0.9 | GO:0044327 | dendritic spine head(GO:0044327) |
| 0.1 | 0.3 | GO:0097224 | sperm connecting piece(GO:0097224) |
| 0.1 | 1.2 | GO:0043240 | Fanconi anaemia nuclear complex(GO:0043240) |
| 0.1 | 0.7 | GO:0097425 | smooth endoplasmic reticulum membrane(GO:0030868) smooth endoplasmic reticulum part(GO:0097425) |
| 0.1 | 2.5 | GO:0005790 | smooth endoplasmic reticulum(GO:0005790) |
| 0.1 | 0.6 | GO:0042406 | extrinsic component of endoplasmic reticulum membrane(GO:0042406) |
| 0.1 | 1.7 | GO:0097025 | MPP7-DLG1-LIN7 complex(GO:0097025) |
| 0.1 | 2.9 | GO:0071339 | MLL1/2 complex(GO:0044665) MLL1 complex(GO:0071339) |
| 0.1 | 110.5 | GO:0005615 | extracellular space(GO:0005615) |
| 0.1 | 0.5 | GO:0030905 | retromer, tubulation complex(GO:0030905) |
| 0.1 | 1.4 | GO:0005662 | DNA replication factor A complex(GO:0005662) |
| 0.1 | 0.8 | GO:0033276 | transcription factor TFTC complex(GO:0033276) |
| 0.1 | 2.6 | GO:0002102 | podosome(GO:0002102) |
| 0.1 | 0.2 | GO:0005927 | muscle tendon junction(GO:0005927) |
| 0.1 | 2.6 | GO:0005796 | Golgi lumen(GO:0005796) |
| 0.1 | 0.3 | GO:0005947 | mitochondrial alpha-ketoglutarate dehydrogenase complex(GO:0005947) |
| 0.1 | 3.6 | GO:0031463 | Cul3-RING ubiquitin ligase complex(GO:0031463) |
| 0.1 | 1.5 | GO:0031095 | platelet dense tubular network membrane(GO:0031095) |
| 0.1 | 0.4 | GO:0097486 | late endosome lumen(GO:0031906) multivesicular body lumen(GO:0097486) |
| 0.1 | 2.1 | GO:0035577 | azurophil granule membrane(GO:0035577) |
| 0.1 | 1.3 | GO:0005892 | acetylcholine-gated channel complex(GO:0005892) |
| 0.0 | 1.0 | GO:0071004 | U2-type prespliceosome(GO:0071004) |
| 0.0 | 1.6 | GO:0030173 | integral component of Golgi membrane(GO:0030173) |
| 0.0 | 0.8 | GO:0043194 | axon initial segment(GO:0043194) |
| 0.0 | 6.2 | GO:0005923 | bicellular tight junction(GO:0005923) occluding junction(GO:0070160) |
| 0.0 | 5.9 | GO:0016605 | PML body(GO:0016605) |
| 0.0 | 0.2 | GO:0031314 | extrinsic component of mitochondrial inner membrane(GO:0031314) |
| 0.0 | 0.2 | GO:0071439 | clathrin complex(GO:0071439) |
| 0.0 | 0.9 | GO:0032809 | neuronal cell body membrane(GO:0032809) cell body membrane(GO:0044298) |
| 0.0 | 0.2 | GO:0000127 | transcription factor TFIIIC complex(GO:0000127) |
| 0.0 | 2.0 | GO:0099501 | synaptic vesicle membrane(GO:0030672) exocytic vesicle membrane(GO:0099501) |
| 0.0 | 12.4 | GO:0016607 | nuclear speck(GO:0016607) |
| 0.0 | 0.8 | GO:0034451 | centriolar satellite(GO:0034451) |
| 0.0 | 4.2 | GO:0032993 | protein-DNA complex(GO:0032993) |
| 0.0 | 0.3 | GO:0097225 | sperm midpiece(GO:0097225) |
| 0.0 | 0.5 | GO:0000421 | autophagosome membrane(GO:0000421) |
| 0.0 | 2.6 | GO:0008076 | voltage-gated potassium channel complex(GO:0008076) potassium channel complex(GO:0034705) |
| 0.0 | 0.7 | GO:1902711 | GABA-A receptor complex(GO:1902711) |
| 0.0 | 1.7 | GO:0001750 | photoreceptor outer segment(GO:0001750) |
| 0.0 | 3.8 | GO:0005802 | trans-Golgi network(GO:0005802) |
| 0.0 | 1.5 | GO:0071013 | catalytic step 2 spliceosome(GO:0071013) |
| 0.0 | 0.4 | GO:0031932 | TORC2 complex(GO:0031932) |
| 0.0 | 0.1 | GO:0042788 | polysomal ribosome(GO:0042788) |
| 0.0 | 0.1 | GO:0030123 | AP-3 adaptor complex(GO:0030123) |
| 0.0 | 0.2 | GO:0005890 | sodium:potassium-exchanging ATPase complex(GO:0005890) |
| 0.0 | 0.5 | GO:0032154 | cleavage furrow(GO:0032154) cell surface furrow(GO:0097610) |
Gene overrepresentation in molecular function category:
| Log-likelihood per target | Total log-likelihood | Term | Description |
|---|---|---|---|
| 4.5 | 22.6 | GO:0004464 | leukotriene-C4 synthase activity(GO:0004464) |
| 4.3 | 13.0 | GO:0036134 | thromboxane-A synthase activity(GO:0004796) 12-hydroxyheptadecatrienoic acid synthase activity(GO:0036134) |
| 4.3 | 12.8 | GO:0050528 | acyloxyacyl hydrolase activity(GO:0050528) |
| 3.8 | 18.9 | GO:0043208 | glycosphingolipid binding(GO:0043208) |
| 3.0 | 23.6 | GO:0023029 | MHC class Ib protein binding(GO:0023029) |
| 2.6 | 7.9 | GO:0004912 | interleukin-3 receptor activity(GO:0004912) |
| 2.6 | 12.8 | GO:0032395 | MHC class II receptor activity(GO:0032395) |
| 2.4 | 11.8 | GO:0004522 | ribonuclease A activity(GO:0004522) |
| 2.4 | 141.9 | GO:0034987 | immunoglobulin receptor binding(GO:0034987) |
| 2.3 | 14.0 | GO:0003796 | lysozyme activity(GO:0003796) |
| 2.2 | 6.6 | GO:0046848 | hydroxyapatite binding(GO:0046848) |
| 2.1 | 19.1 | GO:0043426 | MRF binding(GO:0043426) |
| 2.1 | 382.4 | GO:0003823 | antigen binding(GO:0003823) |
| 2.0 | 8.1 | GO:0016495 | C-X3-C chemokine receptor activity(GO:0016495) |
| 1.9 | 5.6 | GO:0034739 | histone deacetylase activity (H4-K16 specific)(GO:0034739) |
| 1.8 | 12.7 | GO:0030492 | hemoglobin binding(GO:0030492) |
| 1.7 | 5.0 | GO:0001861 | complement component C4b receptor activity(GO:0001861) complement component C3b receptor activity(GO:0004877) |
| 1.7 | 5.0 | GO:0004307 | ethanolaminephosphotransferase activity(GO:0004307) |
| 1.6 | 4.8 | GO:0030350 | iron-responsive element binding(GO:0030350) |
| 1.5 | 12.3 | GO:0070892 | lipoteichoic acid receptor activity(GO:0070892) |
| 1.5 | 13.2 | GO:0031685 | adenosine receptor binding(GO:0031685) |
| 1.4 | 4.2 | GO:0031862 | prostanoid receptor binding(GO:0031862) |
| 1.4 | 8.4 | GO:0004430 | 1-phosphatidylinositol 4-kinase activity(GO:0004430) |
| 1.3 | 4.0 | GO:0019959 | interleukin-8 binding(GO:0019959) |
| 1.3 | 5.1 | GO:0004031 | aldehyde oxidase activity(GO:0004031) ethanol binding(GO:0035276) |
| 1.2 | 7.0 | GO:0004301 | epoxide hydrolase activity(GO:0004301) |
| 1.1 | 6.9 | GO:0071723 | lipopeptide binding(GO:0071723) |
| 1.1 | 3.3 | GO:0004556 | alpha-amylase activity(GO:0004556) |
| 1.1 | 2.2 | GO:0042806 | fucose binding(GO:0042806) |
| 1.0 | 3.1 | GO:0052852 | (S)-2-hydroxy-acid oxidase activity(GO:0003973) very-long-chain-(S)-2-hydroxy-acid oxidase activity(GO:0052852) long-chain-(S)-2-hydroxy-long-chain-acid oxidase activity(GO:0052853) medium-chain-(S)-2-hydroxy-acid oxidase activity(GO:0052854) |
| 1.0 | 3.0 | GO:0005174 | CD40 receptor binding(GO:0005174) |
| 1.0 | 4.9 | GO:0042296 | ISG15 transferase activity(GO:0042296) |
| 0.9 | 2.8 | GO:0061697 | protein-malonyllysine demalonylase activity(GO:0036054) protein-succinyllysine desuccinylase activity(GO:0036055) protein-glutaryllysine deglutarylase activity(GO:0061697) |
| 0.9 | 9.3 | GO:0004064 | arylesterase activity(GO:0004064) |
| 0.9 | 2.8 | GO:0097001 | ceramide binding(GO:0097001) |
| 0.9 | 15.6 | GO:0038187 | signaling pattern recognition receptor activity(GO:0008329) pattern recognition receptor activity(GO:0038187) |
| 0.9 | 7.7 | GO:0016206 | catechol O-methyltransferase activity(GO:0016206) |
| 0.9 | 27.3 | GO:0019198 | transmembrane receptor protein tyrosine phosphatase activity(GO:0005001) transmembrane receptor protein phosphatase activity(GO:0019198) |
| 0.8 | 2.5 | GO:0016803 | ether hydrolase activity(GO:0016803) |
| 0.8 | 2.4 | GO:0015265 | urea channel activity(GO:0015265) |
| 0.8 | 28.4 | GO:0043539 | protein serine/threonine kinase activator activity(GO:0043539) |
| 0.7 | 2.2 | GO:0061628 | H3K27me3 modified histone binding(GO:0061628) |
| 0.7 | 3.5 | GO:0004699 | calcium-independent protein kinase C activity(GO:0004699) |
| 0.7 | 15.4 | GO:0097493 | structural molecule activity conferring elasticity(GO:0097493) |
| 0.7 | 4.2 | GO:0035800 | deubiquitinase activator activity(GO:0035800) |
| 0.7 | 2.1 | GO:0070735 | protein-glycine ligase activity(GO:0070735) |
| 0.7 | 11.8 | GO:0042809 | vitamin D receptor binding(GO:0042809) |
| 0.6 | 1.9 | GO:0080130 | L-phenylalanine:2-oxoglutarate aminotransferase activity(GO:0080130) |
| 0.6 | 3.2 | GO:0004692 | cGMP-dependent protein kinase activity(GO:0004692) |
| 0.6 | 2.5 | GO:0050659 | N-acetylgalactosamine 4-sulfate 6-O-sulfotransferase activity(GO:0050659) |
| 0.6 | 22.4 | GO:0071889 | 14-3-3 protein binding(GO:0071889) |
| 0.6 | 6.0 | GO:0051011 | microtubule minus-end binding(GO:0051011) |
| 0.6 | 2.3 | GO:1990430 | extracellular matrix protein binding(GO:1990430) |
| 0.6 | 1.7 | GO:0005150 | interleukin-1, Type I receptor binding(GO:0005150) |
| 0.6 | 4.1 | GO:0008440 | inositol-1,4,5-trisphosphate 3-kinase activity(GO:0008440) |
| 0.6 | 2.9 | GO:0004826 | phenylalanine-tRNA ligase activity(GO:0004826) |
| 0.6 | 3.4 | GO:0016402 | pristanoyl-CoA oxidase activity(GO:0016402) |
| 0.5 | 3.7 | GO:0035368 | selenocysteine insertion sequence binding(GO:0035368) |
| 0.5 | 3.1 | GO:0016416 | O-palmitoyltransferase activity(GO:0016416) |
| 0.5 | 14.5 | GO:0001968 | fibronectin binding(GO:0001968) |
| 0.5 | 1.5 | GO:0033188 | sphingomyelin synthase activity(GO:0033188) ceramide cholinephosphotransferase activity(GO:0047493) |
| 0.5 | 3.0 | GO:0003886 | DNA (cytosine-5-)-methyltransferase activity(GO:0003886) |
| 0.5 | 2.4 | GO:0048248 | CXCR3 chemokine receptor binding(GO:0048248) |
| 0.5 | 2.9 | GO:0018479 | benzaldehyde dehydrogenase (NAD+) activity(GO:0018479) |
| 0.5 | 5.7 | GO:0005344 | oxygen transporter activity(GO:0005344) |
| 0.5 | 2.3 | GO:0031871 | proteinase activated receptor binding(GO:0031871) |
| 0.5 | 8.9 | GO:0015467 | G-protein activated inward rectifier potassium channel activity(GO:0015467) |
| 0.5 | 2.3 | GO:0008410 | CoA-transferase activity(GO:0008410) |
| 0.4 | 2.6 | GO:0048101 | calcium- and calmodulin-regulated 3',5'-cyclic-GMP phosphodiesterase activity(GO:0048101) |
| 0.4 | 2.6 | GO:0097199 | cysteine-type endopeptidase activity involved in apoptotic signaling pathway(GO:0097199) |
| 0.4 | 2.5 | GO:0004630 | phospholipase D activity(GO:0004630) |
| 0.4 | 1.6 | GO:0015315 | hexose phosphate transmembrane transporter activity(GO:0015119) organophosphate:inorganic phosphate antiporter activity(GO:0015315) hexose-phosphate:inorganic phosphate antiporter activity(GO:0015526) glucose 6-phosphate:inorganic phosphate antiporter activity(GO:0061513) |
| 0.4 | 2.0 | GO:0047844 | deoxycytidine deaminase activity(GO:0047844) |
| 0.4 | 5.5 | GO:0061578 | Lys63-specific deubiquitinase activity(GO:0061578) |
| 0.4 | 4.3 | GO:0051525 | NFAT protein binding(GO:0051525) |
| 0.4 | 2.0 | GO:0033743 | peptide-methionine (R)-S-oxide reductase activity(GO:0033743) |
| 0.4 | 1.5 | GO:0047685 | amine sulfotransferase activity(GO:0047685) |
| 0.4 | 2.7 | GO:0015187 | glycine transmembrane transporter activity(GO:0015187) |
| 0.4 | 1.9 | GO:0043120 | tumor necrosis factor binding(GO:0043120) |
| 0.4 | 1.1 | GO:0003826 | alpha-ketoacid dehydrogenase activity(GO:0003826) 3-methyl-2-oxobutanoate dehydrogenase (2-methylpropanoyl-transferring) activity(GO:0003863) |
| 0.4 | 4.2 | GO:0070915 | lysophosphatidic acid receptor activity(GO:0070915) |
| 0.4 | 1.9 | GO:0004800 | thyroxine 5'-deiodinase activity(GO:0004800) |
| 0.4 | 1.1 | GO:0016497 | substance K receptor activity(GO:0016497) |
| 0.4 | 1.9 | GO:0016316 | phosphatidylinositol-3,4-bisphosphate 4-phosphatase activity(GO:0016316) inositol-1,3,4-trisphosphate 4-phosphatase activity(GO:0017161) phosphatidylinositol-4,5-bisphosphate 4-phosphatase activity(GO:0034597) inositol-3,4-bisphosphate 4-phosphatase activity(GO:0052828) |
| 0.4 | 6.3 | GO:0031996 | thioesterase binding(GO:0031996) |
| 0.4 | 2.2 | GO:0061665 | SUMO ligase activity(GO:0061665) |
| 0.4 | 3.6 | GO:0005237 | inhibitory extracellular ligand-gated ion channel activity(GO:0005237) |
| 0.4 | 0.7 | GO:0004040 | amidase activity(GO:0004040) |
| 0.4 | 2.9 | GO:0004022 | alcohol dehydrogenase (NAD) activity(GO:0004022) |
| 0.4 | 3.6 | GO:0005549 | odorant binding(GO:0005549) |
| 0.4 | 1.8 | GO:0015562 | efflux transmembrane transporter activity(GO:0015562) |
| 0.4 | 3.2 | GO:0003876 | AMP deaminase activity(GO:0003876) adenosine-phosphate deaminase activity(GO:0047623) |
| 0.4 | 2.5 | GO:0004499 | N,N-dimethylaniline monooxygenase activity(GO:0004499) |
| 0.3 | 1.4 | GO:0022850 | serotonin-gated cation channel activity(GO:0022850) |
| 0.3 | 1.0 | GO:0001847 | opsonin receptor activity(GO:0001847) |
| 0.3 | 4.1 | GO:0005025 | transforming growth factor beta receptor activity, type I(GO:0005025) |
| 0.3 | 4.4 | GO:0005131 | growth hormone receptor binding(GO:0005131) |
| 0.3 | 4.3 | GO:0005432 | calcium:sodium antiporter activity(GO:0005432) |
| 0.3 | 1.3 | GO:0008467 | [heparan sulfate]-glucosamine 3-sulfotransferase 1 activity(GO:0008467) |
| 0.3 | 8.2 | GO:0005092 | GDP-dissociation inhibitor activity(GO:0005092) |
| 0.3 | 0.9 | GO:0052816 | medium-chain acyl-CoA hydrolase activity(GO:0052815) long-chain acyl-CoA hydrolase activity(GO:0052816) |
| 0.3 | 0.9 | GO:0008480 | sarcosine dehydrogenase activity(GO:0008480) oxidoreductase activity, acting on the CH-NH group of donors, flavin as acceptor(GO:0046997) |
| 0.3 | 3.0 | GO:0004972 | NMDA glutamate receptor activity(GO:0004972) |
| 0.3 | 2.9 | GO:0008061 | chitinase activity(GO:0004568) chitin binding(GO:0008061) |
| 0.3 | 0.9 | GO:0004782 | sulfinoalanine decarboxylase activity(GO:0004782) |
| 0.3 | 2.0 | GO:0003828 | alpha-N-acetylneuraminate alpha-2,8-sialyltransferase activity(GO:0003828) |
| 0.3 | 0.8 | GO:0061609 | fructose-1-phosphate aldolase activity(GO:0061609) |
| 0.3 | 2.7 | GO:0004784 | superoxide dismutase activity(GO:0004784) oxidoreductase activity, acting on superoxide radicals as acceptor(GO:0016721) |
| 0.3 | 1.3 | GO:0000298 | endopolyphosphatase activity(GO:0000298) diphosphoinositol-polyphosphate diphosphatase activity(GO:0008486) bis(5'-adenosyl)-hexaphosphatase activity(GO:0034431) bis(5'-adenosyl)-pentaphosphatase activity(GO:0034432) inositol diphosphate tetrakisphosphate diphosphatase activity(GO:0052840) inositol bisdiphosphate tetrakisphosphate diphosphatase activity(GO:0052841) inositol diphosphate pentakisphosphate diphosphatase activity(GO:0052842) inositol-1-diphosphate-2,3,4,5,6-pentakisphosphate diphosphatase activity(GO:0052843) inositol-3-diphosphate-1,2,4,5,6-pentakisphosphate diphosphatase activity(GO:0052844) inositol-5-diphosphate-1,2,3,4,6-pentakisphosphate diphosphatase activity(GO:0052845) inositol-1,5-bisdiphosphate-2,3,4,6-tetrakisphosphate 1-diphosphatase activity(GO:0052846) inositol-1,5-bisdiphosphate-2,3,4,6-tetrakisphosphate 5-diphosphatase activity(GO:0052847) inositol-3,5-bisdiphosphate-2,3,4,6-tetrakisphosphate 5-diphosphatase activity(GO:0052848) |
| 0.3 | 5.1 | GO:0051400 | BH domain binding(GO:0051400) |
| 0.3 | 1.3 | GO:0019763 | immunoglobulin receptor activity(GO:0019763) |
| 0.3 | 0.8 | GO:0017098 | sulfonylurea receptor binding(GO:0017098) |
| 0.3 | 1.1 | GO:0015222 | serotonin transmembrane transporter activity(GO:0015222) |
| 0.3 | 2.0 | GO:0015143 | urate transmembrane transporter activity(GO:0015143) salt transmembrane transporter activity(GO:1901702) |
| 0.3 | 7.9 | GO:0043015 | gamma-tubulin binding(GO:0043015) |
| 0.2 | 5.2 | GO:0001087 | transcription factor activity, sequence-specific DNA binding, RNA polymerase recruiting(GO:0001011) transcription factor activity, TFIIB-class binding(GO:0001087) |
| 0.2 | 1.7 | GO:0003747 | translation release factor activity(GO:0003747) translation termination factor activity(GO:0008079) |
| 0.2 | 1.5 | GO:0005223 | intracellular cGMP activated cation channel activity(GO:0005223) |
| 0.2 | 5.3 | GO:0005095 | GTPase inhibitor activity(GO:0005095) |
| 0.2 | 1.7 | GO:0008568 | microtubule-severing ATPase activity(GO:0008568) |
| 0.2 | 2.6 | GO:0019957 | C-C chemokine binding(GO:0019957) |
| 0.2 | 6.1 | GO:0031489 | myosin V binding(GO:0031489) |
| 0.2 | 4.6 | GO:0005337 | nucleoside transmembrane transporter activity(GO:0005337) |
| 0.2 | 16.2 | GO:0050840 | extracellular matrix binding(GO:0050840) |
| 0.2 | 2.4 | GO:0019864 | IgG binding(GO:0019864) |
| 0.2 | 1.4 | GO:0008271 | secondary active sulfate transmembrane transporter activity(GO:0008271) |
| 0.2 | 12.0 | GO:0005544 | calcium-dependent phospholipid binding(GO:0005544) |
| 0.2 | 1.8 | GO:0050682 | AF-2 domain binding(GO:0050682) |
| 0.2 | 2.0 | GO:0045236 | CXCR chemokine receptor binding(GO:0045236) |
| 0.2 | 3.5 | GO:0001530 | lipopolysaccharide binding(GO:0001530) |
| 0.2 | 4.2 | GO:0008494 | translation activator activity(GO:0008494) |
| 0.2 | 5.1 | GO:0004602 | glutathione peroxidase activity(GO:0004602) |
| 0.2 | 2.7 | GO:0005049 | nuclear export signal receptor activity(GO:0005049) |
| 0.2 | 0.9 | GO:0017018 | myosin phosphatase activity(GO:0017018) |
| 0.2 | 1.1 | GO:0045029 | UDP-activated nucleotide receptor activity(GO:0045029) |
| 0.2 | 0.7 | GO:0004769 | steroid delta-isomerase activity(GO:0004769) |
| 0.2 | 0.3 | GO:0004060 | arylamine N-acetyltransferase activity(GO:0004060) |
| 0.2 | 14.9 | GO:0004869 | cysteine-type endopeptidase inhibitor activity(GO:0004869) |
| 0.2 | 2.0 | GO:0001075 | transcription factor activity, RNA polymerase II core promoter sequence-specific binding involved in preinitiation complex assembly(GO:0001075) |
| 0.2 | 4.5 | GO:0004298 | threonine-type endopeptidase activity(GO:0004298) threonine-type peptidase activity(GO:0070003) |
| 0.2 | 1.1 | GO:0001165 | RNA polymerase I upstream control element sequence-specific DNA binding(GO:0001165) |
| 0.2 | 0.6 | GO:0004948 | calcitonin receptor activity(GO:0004948) |
| 0.2 | 2.8 | GO:0005522 | profilin binding(GO:0005522) |
| 0.2 | 1.8 | GO:0050700 | CARD domain binding(GO:0050700) |
| 0.2 | 0.8 | GO:0004126 | cytidine deaminase activity(GO:0004126) |
| 0.2 | 3.2 | GO:0048018 | receptor agonist activity(GO:0048018) |
| 0.2 | 0.8 | GO:0003989 | acetyl-CoA carboxylase activity(GO:0003989) |
| 0.1 | 2.5 | GO:0003691 | double-stranded telomeric DNA binding(GO:0003691) |
| 0.1 | 1.0 | GO:0003810 | protein-glutamine gamma-glutamyltransferase activity(GO:0003810) |
| 0.1 | 4.5 | GO:0005044 | scavenger receptor activity(GO:0005044) |
| 0.1 | 2.2 | GO:0003906 | DNA-(apurinic or apyrimidinic site) lyase activity(GO:0003906) |
| 0.1 | 0.7 | GO:0016427 | tRNA (cytosine) methyltransferase activity(GO:0016427) |
| 0.1 | 2.0 | GO:0003995 | acyl-CoA dehydrogenase activity(GO:0003995) |
| 0.1 | 0.6 | GO:0035500 | MH2 domain binding(GO:0035500) |
| 0.1 | 1.4 | GO:0036310 | annealing helicase activity(GO:0036310) |
| 0.1 | 1.1 | GO:0035374 | chondroitin sulfate binding(GO:0035374) |
| 0.1 | 2.6 | GO:0016854 | racemase and epimerase activity(GO:0016854) |
| 0.1 | 2.0 | GO:0016813 | hydrolase activity, acting on carbon-nitrogen (but not peptide) bonds, in linear amidines(GO:0016813) |
| 0.1 | 1.3 | GO:0045028 | G-protein coupled nucleotide receptor activity(GO:0001608) G-protein coupled purinergic nucleotide receptor activity(GO:0045028) |
| 0.1 | 0.6 | GO:0004974 | leukotriene receptor activity(GO:0004974) |
| 0.1 | 0.6 | GO:0004105 | choline-phosphate cytidylyltransferase activity(GO:0004105) |
| 0.1 | 1.4 | GO:0008020 | G-protein coupled photoreceptor activity(GO:0008020) |
| 0.1 | 1.1 | GO:0036312 | phosphatidylinositol 3-kinase regulatory subunit binding(GO:0036312) |
| 0.1 | 0.5 | GO:0044323 | retinoic acid-responsive element binding(GO:0044323) |
| 0.1 | 4.8 | GO:0003785 | actin monomer binding(GO:0003785) |
| 0.1 | 0.3 | GO:0017129 | triglyceride binding(GO:0017129) |
| 0.1 | 11.5 | GO:0005070 | SH3/SH2 adaptor activity(GO:0005070) |
| 0.1 | 1.8 | GO:0098847 | sequence-specific single stranded DNA binding(GO:0098847) |
| 0.1 | 1.2 | GO:0042975 | peroxisome proliferator activated receptor binding(GO:0042975) |
| 0.1 | 4.0 | GO:0005246 | calcium channel regulator activity(GO:0005246) |
| 0.1 | 0.2 | GO:0004914 | interleukin-5 receptor activity(GO:0004914) |
| 0.1 | 1.2 | GO:0097371 | MDM2/MDM4 family protein binding(GO:0097371) |
| 0.1 | 0.9 | GO:0030284 | estrogen receptor activity(GO:0030284) |
| 0.1 | 1.4 | GO:0015245 | fatty acid transporter activity(GO:0015245) |
| 0.1 | 0.8 | GO:0004571 | mannosyl-oligosaccharide 1,2-alpha-mannosidase activity(GO:0004571) |
| 0.1 | 0.6 | GO:0002161 | aminoacyl-tRNA editing activity(GO:0002161) |
| 0.1 | 2.9 | GO:0004129 | cytochrome-c oxidase activity(GO:0004129) heme-copper terminal oxidase activity(GO:0015002) oxidoreductase activity, acting on a heme group of donors, oxygen as acceptor(GO:0016676) |
| 0.1 | 17.8 | GO:0001078 | transcriptional repressor activity, RNA polymerase II core promoter proximal region sequence-specific binding(GO:0001078) |
| 0.1 | 6.8 | GO:0008200 | ion channel inhibitor activity(GO:0008200) channel inhibitor activity(GO:0016248) |
| 0.1 | 0.5 | GO:1990460 | leptin receptor binding(GO:1990460) |
| 0.1 | 1.3 | GO:0004859 | phospholipase inhibitor activity(GO:0004859) |
| 0.1 | 0.4 | GO:0047238 | glucuronosyl-N-acetylgalactosaminyl-proteoglycan 4-beta-N-acetylgalactosaminyltransferase activity(GO:0047238) |
| 0.1 | 4.2 | GO:0017112 | Rab guanyl-nucleotide exchange factor activity(GO:0017112) |
| 0.1 | 0.3 | GO:0080084 | RNA polymerase III type 1 promoter DNA binding(GO:0001030) RNA polymerase III type 2 promoter DNA binding(GO:0001031) 5S rDNA binding(GO:0080084) |
| 0.1 | 2.5 | GO:0008009 | chemokine activity(GO:0008009) |
| 0.1 | 2.7 | GO:0004709 | MAP kinase kinase kinase activity(GO:0004709) |
| 0.1 | 11.4 | GO:0017137 | Rab GTPase binding(GO:0017137) |
| 0.1 | 1.4 | GO:0017136 | NAD-dependent histone deacetylase activity(GO:0017136) |
| 0.1 | 0.7 | GO:0016846 | carbon-sulfur lyase activity(GO:0016846) |
| 0.1 | 0.4 | GO:0016929 | SUMO-specific protease activity(GO:0016929) |
| 0.1 | 4.4 | GO:0048365 | Rac GTPase binding(GO:0048365) |
| 0.1 | 0.4 | GO:0030345 | extracellular matrix structural constituent conferring compression resistance(GO:0030021) structural constituent of tooth enamel(GO:0030345) |
| 0.1 | 1.8 | GO:0031698 | beta-2 adrenergic receptor binding(GO:0031698) |
| 0.1 | 0.6 | GO:0022842 | leak channel activity(GO:0022840) narrow pore channel activity(GO:0022842) |
| 0.1 | 0.8 | GO:0005242 | inward rectifier potassium channel activity(GO:0005242) |
| 0.1 | 0.6 | GO:0033192 | calmodulin-dependent protein phosphatase activity(GO:0033192) |
| 0.1 | 2.2 | GO:0005184 | neuropeptide hormone activity(GO:0005184) |
| 0.1 | 4.9 | GO:0003743 | translation initiation factor activity(GO:0003743) |
| 0.1 | 14.0 | GO:0051015 | actin filament binding(GO:0051015) |
| 0.1 | 14.8 | GO:0004252 | serine-type endopeptidase activity(GO:0004252) |
| 0.1 | 3.0 | GO:0004864 | protein phosphatase inhibitor activity(GO:0004864) |
| 0.1 | 0.2 | GO:0008900 | hydrogen:potassium-exchanging ATPase activity(GO:0008900) |
| 0.1 | 0.3 | GO:0004376 | glycolipid mannosyltransferase activity(GO:0004376) |
| 0.1 | 0.3 | GO:0031779 | melanocortin receptor binding(GO:0031779) type 3 melanocortin receptor binding(GO:0031781) type 4 melanocortin receptor binding(GO:0031782) |
| 0.1 | 4.2 | GO:0004004 | ATP-dependent RNA helicase activity(GO:0004004) |
| 0.1 | 1.3 | GO:0070742 | C2H2 zinc finger domain binding(GO:0070742) |
| 0.1 | 0.3 | GO:0043855 | intracellular cyclic nucleotide activated cation channel activity(GO:0005221) cyclic nucleotide-gated ion channel activity(GO:0043855) |
| 0.1 | 1.4 | GO:0003841 | 1-acylglycerol-3-phosphate O-acyltransferase activity(GO:0003841) |
| 0.1 | 1.3 | GO:0015175 | neutral amino acid transmembrane transporter activity(GO:0015175) |
| 0.1 | 5.3 | GO:0004197 | cysteine-type endopeptidase activity(GO:0004197) |
| 0.1 | 1.4 | GO:0031624 | ubiquitin conjugating enzyme binding(GO:0031624) |
| 0.1 | 0.2 | GO:0000099 | sulfur amino acid transmembrane transporter activity(GO:0000099) L-cystine transmembrane transporter activity(GO:0015184) |
| 0.1 | 12.7 | GO:0005096 | GTPase activator activity(GO:0005096) |
| 0.1 | 0.3 | GO:0032027 | myosin light chain binding(GO:0032027) |
| 0.0 | 0.6 | GO:0001730 | 2'-5'-oligoadenylate synthetase activity(GO:0001730) |
| 0.0 | 1.6 | GO:0050699 | WW domain binding(GO:0050699) |
| 0.0 | 0.3 | GO:0008454 | alpha-1,3-mannosylglycoprotein 4-beta-N-acetylglucosaminyltransferase activity(GO:0008454) |
| 0.0 | 0.2 | GO:0047023 | androsterone dehydrogenase activity(GO:0047023) |
| 0.0 | 0.9 | GO:0050811 | GABA receptor binding(GO:0050811) |
| 0.0 | 0.9 | GO:0008266 | poly(U) RNA binding(GO:0008266) |
| 0.0 | 0.8 | GO:0051059 | NF-kappaB binding(GO:0051059) |
| 0.0 | 0.8 | GO:0043425 | bHLH transcription factor binding(GO:0043425) |
| 0.0 | 2.2 | GO:0005160 | transforming growth factor beta receptor binding(GO:0005160) |
| 0.0 | 2.1 | GO:0005518 | collagen binding(GO:0005518) |
| 0.0 | 0.5 | GO:0030695 | GTPase regulator activity(GO:0030695) |
| 0.0 | 0.6 | GO:0005159 | insulin-like growth factor receptor binding(GO:0005159) |
| 0.0 | 0.3 | GO:0050733 | RS domain binding(GO:0050733) |
| 0.0 | 0.7 | GO:0004993 | G-protein coupled serotonin receptor activity(GO:0004993) serotonin receptor activity(GO:0099589) |
| 0.0 | 0.7 | GO:0030742 | GTP-dependent protein binding(GO:0030742) |
| 0.0 | 0.3 | GO:0016493 | C-C chemokine receptor activity(GO:0016493) |
| 0.0 | 0.5 | GO:0001134 | transcription factor activity, transcription factor recruiting(GO:0001134) |
| 0.0 | 0.2 | GO:0015349 | thyroid hormone transmembrane transporter activity(GO:0015349) |
| 0.0 | 0.5 | GO:0015377 | cation:chloride symporter activity(GO:0015377) |
| 0.0 | 0.1 | GO:0051373 | FATZ binding(GO:0051373) |
| 0.0 | 0.7 | GO:0005251 | delayed rectifier potassium channel activity(GO:0005251) |
| 0.0 | 0.1 | GO:0004925 | prolactin receptor activity(GO:0004925) |
| 0.0 | 0.5 | GO:0016500 | protein-hormone receptor activity(GO:0016500) |
| 0.0 | 0.2 | GO:0015277 | kainate selective glutamate receptor activity(GO:0015277) |
| 0.0 | 0.4 | GO:0008499 | UDP-galactose:beta-N-acetylglucosamine beta-1,3-galactosyltransferase activity(GO:0008499) |
| 0.0 | 0.6 | GO:0070006 | metalloaminopeptidase activity(GO:0070006) |
| 0.0 | 0.6 | GO:0015106 | bicarbonate transmembrane transporter activity(GO:0015106) |
| 0.0 | 1.5 | GO:0101005 | thiol-dependent ubiquitinyl hydrolase activity(GO:0036459) ubiquitinyl hydrolase activity(GO:0101005) |
| 0.0 | 1.8 | GO:0004984 | olfactory receptor activity(GO:0004984) |
| 0.0 | 0.2 | GO:0042609 | CD4 receptor binding(GO:0042609) |
| 0.0 | 0.6 | GO:0035591 | signaling adaptor activity(GO:0035591) |
| 0.0 | 1.4 | GO:0035064 | methylated histone binding(GO:0035064) |
| 0.0 | 0.1 | GO:0004530 | deoxyribonuclease I activity(GO:0004530) |
| 0.0 | 0.4 | GO:0004190 | aspartic-type endopeptidase activity(GO:0004190) aspartic-type peptidase activity(GO:0070001) |
| 0.0 | 0.9 | GO:0051539 | 4 iron, 4 sulfur cluster binding(GO:0051539) |
| 0.0 | 1.0 | GO:0001105 | RNA polymerase II transcription coactivator activity(GO:0001105) |
| 0.0 | 0.3 | GO:0015095 | magnesium ion transmembrane transporter activity(GO:0015095) |
| 0.0 | 0.1 | GO:0047498 | calcium-dependent phospholipase A2 activity(GO:0047498) |
| 0.0 | 0.2 | GO:0017017 | MAP kinase tyrosine/serine/threonine phosphatase activity(GO:0017017) |
| 0.0 | 1.0 | GO:0051219 | phosphoprotein binding(GO:0051219) |
| 0.0 | 16.8 | GO:0001071 | nucleic acid binding transcription factor activity(GO:0001071) transcription factor activity, sequence-specific DNA binding(GO:0003700) |
| 0.0 | 0.1 | GO:0005436 | sodium:phosphate symporter activity(GO:0005436) |
| 0.0 | 0.8 | GO:0005201 | extracellular matrix structural constituent(GO:0005201) |
Gene overrepresentation in curated gene sets: canonical pathways category:
| Log-likelihood per target | Total log-likelihood | Term | Description |
|---|---|---|---|
| 0.6 | 38.5 | SIG PIP3 SIGNALING IN B LYMPHOCYTES | Genes related to PIP3 signaling in B lymphocytes |
| 0.5 | 18.9 | SA MMP CYTOKINE CONNECTION | Cytokines can induce activation of matrix metalloproteinases, which degrade extracellular matrix. |
| 0.4 | 4.9 | ST IL 13 PATHWAY | Interleukin 13 (IL-13) Pathway |
| 0.4 | 22.5 | NABA PROTEOGLYCANS | Genes encoding proteoglycans |
| 0.3 | 2.5 | ST PHOSPHOINOSITIDE 3 KINASE PATHWAY | PI3K Pathway |
| 0.3 | 5.7 | PID IL5 PATHWAY | IL5-mediated signaling events |
| 0.2 | 6.9 | PID TOLL ENDOGENOUS PATHWAY | Endogenous TLR signaling |
| 0.2 | 6.8 | ST GAQ PATHWAY | G alpha q Pathway |
| 0.2 | 9.8 | ST TUMOR NECROSIS FACTOR PATHWAY | Tumor Necrosis Factor Pathway. |
| 0.2 | 9.5 | PID INTEGRIN3 PATHWAY | Beta3 integrin cell surface interactions |
| 0.2 | 4.8 | PID AVB3 OPN PATHWAY | Osteopontin-mediated events |
| 0.2 | 7.7 | PID P38 MKK3 6PATHWAY | p38 MAPK signaling pathway |
| 0.2 | 8.2 | PID INTEGRIN A9B1 PATHWAY | Alpha9 beta1 integrin signaling events |
| 0.2 | 9.2 | PID INTEGRIN2 PATHWAY | Beta2 integrin cell surface interactions |
| 0.2 | 13.5 | PID IL12 2PATHWAY | IL12-mediated signaling events |
| 0.2 | 6.6 | PID HIV NEF PATHWAY | HIV-1 Nef: Negative effector of Fas and TNF-alpha |
| 0.2 | 28.0 | NABA ECM AFFILIATED | Genes encoding proteins affiliated structurally or functionally to extracellular matrix proteins |
| 0.2 | 1.1 | ST INTERFERON GAMMA PATHWAY | Interferon gamma pathway. |
| 0.1 | 4.0 | PID IL2 STAT5 PATHWAY | IL2 signaling events mediated by STAT5 |
| 0.1 | 7.4 | PID BCR 5PATHWAY | BCR signaling pathway |
| 0.1 | 5.6 | PID IL4 2PATHWAY | IL4-mediated signaling events |
| 0.1 | 8.6 | PID RAC1 REG PATHWAY | Regulation of RAC1 activity |
| 0.1 | 2.2 | PID IL12 STAT4 PATHWAY | IL12 signaling mediated by STAT4 |
| 0.1 | 2.9 | PID CONE PATHWAY | Visual signal transduction: Cones |
| 0.1 | 0.6 | PID ECADHERIN KERATINOCYTE PATHWAY | E-cadherin signaling in keratinocytes |
| 0.1 | 11.7 | PID CMYB PATHWAY | C-MYB transcription factor network |
| 0.1 | 6.8 | PID TXA2PATHWAY | Thromboxane A2 receptor signaling |
| 0.1 | 6.4 | PID NFAT TFPATHWAY | Calcineurin-regulated NFAT-dependent transcription in lymphocytes |
| 0.1 | 5.2 | PID FCER1 PATHWAY | Fc-epsilon receptor I signaling in mast cells |
| 0.1 | 3.7 | PID HDAC CLASSIII PATHWAY | Signaling events mediated by HDAC Class III |
| 0.1 | 5.7 | PID BMP PATHWAY | BMP receptor signaling |
| 0.1 | 6.4 | PID HNF3B PATHWAY | FOXA2 and FOXA3 transcription factor networks |
| 0.1 | 0.7 | PID CD40 PATHWAY | CD40/CD40L signaling |
| 0.1 | 1.5 | PID EPHRINB REV PATHWAY | Ephrin B reverse signaling |
| 0.1 | 1.7 | PID IL1 PATHWAY | IL1-mediated signaling events |
| 0.1 | 21.1 | NABA ECM REGULATORS | Genes encoding enzymes and their regulators involved in the remodeling of the extracellular matrix |
| 0.1 | 1.5 | ST GA12 PATHWAY | G alpha 12 Pathway |
| 0.1 | 1.3 | PID HEDGEHOG 2PATHWAY | Signaling events mediated by the Hedgehog family |
| 0.1 | 0.6 | PID PI3KCI AKT PATHWAY | Class I PI3K signaling events mediated by Akt |
| 0.0 | 1.0 | ST P38 MAPK PATHWAY | p38 MAPK Pathway |
| 0.0 | 2.3 | PID CASPASE PATHWAY | Caspase cascade in apoptosis |
| 0.0 | 3.6 | PID RB 1PATHWAY | Regulation of retinoblastoma protein |
| 0.0 | 0.7 | PID HIF1A PATHWAY | Hypoxic and oxygen homeostasis regulation of HIF-1-alpha |
| 0.0 | 1.5 | PID MYC PATHWAY | C-MYC pathway |
| 0.0 | 0.5 | PID THROMBIN PAR1 PATHWAY | PAR1-mediated thrombin signaling events |
| 0.0 | 1.6 | PID LKB1 PATHWAY | LKB1 signaling events |
| 0.0 | 1.2 | PID RXR VDR PATHWAY | RXR and RAR heterodimerization with other nuclear receptor |
| 0.0 | 9.3 | NABA MATRISOME ASSOCIATED | Ensemble of genes encoding ECM-associated proteins including ECM-affilaited proteins, ECM regulators and secreted factors |
| 0.0 | 0.9 | PID RHOA PATHWAY | RhoA signaling pathway |
| 0.0 | 0.7 | PID HDAC CLASSII PATHWAY | Signaling events mediated by HDAC Class II |
| 0.0 | 0.3 | PID WNT CANONICAL PATHWAY | Canonical Wnt signaling pathway |
| 0.0 | 0.7 | PID HDAC CLASSI PATHWAY | Signaling events mediated by HDAC Class I |
| 0.0 | 1.5 | PID BETA CATENIN NUC PATHWAY | Regulation of nuclear beta catenin signaling and target gene transcription |
| 0.0 | 0.4 | PID ALPHA SYNUCLEIN PATHWAY | Alpha-synuclein signaling |
| 0.0 | 0.4 | PID REG GR PATHWAY | Glucocorticoid receptor regulatory network |
| 0.0 | 2.5 | NABA ECM GLYCOPROTEINS | Genes encoding structural ECM glycoproteins |
| 0.0 | 0.5 | PID MTOR 4PATHWAY | mTOR signaling pathway |
| 0.0 | 0.1 | PID ERBB4 PATHWAY | ErbB4 signaling events |
| 0.0 | 0.2 | PID ALK1 PATHWAY | ALK1 signaling events |
Gene overrepresentation in curated gene sets: REACTOME pathways category:
| Log-likelihood per target | Total log-likelihood | Term | Description |
|---|---|---|---|
| 3.0 | 72.8 | REACTOME PHOSPHORYLATION OF CD3 AND TCR ZETA CHAINS | Genes involved in Phosphorylation of CD3 and TCR zeta chains |
| 1.3 | 13.8 | REACTOME ENDOSOMAL VACUOLAR PATHWAY | Genes involved in Endosomal/Vacuolar pathway |
| 0.7 | 4.2 | REACTOME TRAF6 MEDIATED IRF7 ACTIVATION | Genes involved in TRAF6 mediated IRF7 activation |
| 0.7 | 58.6 | REACTOME IMMUNOREGULATORY INTERACTIONS BETWEEN A LYMPHOID AND A NON LYMPHOID CELL | Genes involved in Immunoregulatory interactions between a Lymphoid and a non-Lymphoid cell |
| 0.6 | 11.1 | REACTOME THE NLRP3 INFLAMMASOME | Genes involved in The NLRP3 inflammasome |
| 0.6 | 18.3 | REACTOME CHONDROITIN SULFATE BIOSYNTHESIS | Genes involved in Chondroitin sulfate biosynthesis |
| 0.6 | 9.3 | REACTOME REVERSIBLE HYDRATION OF CARBON DIOXIDE | Genes involved in Reversible Hydration of Carbon Dioxide |
| 0.6 | 5.7 | REACTOME BETA DEFENSINS | Genes involved in Beta defensins |
| 0.5 | 3.2 | REACTOME IL 2 SIGNALING | Genes involved in Interleukin-2 signaling |
| 0.5 | 5.1 | REACTOME ETHANOL OXIDATION | Genes involved in Ethanol oxidation |
| 0.4 | 6.1 | REACTOME PECAM1 INTERACTIONS | Genes involved in PECAM1 interactions |
| 0.4 | 4.4 | REACTOME RECRUITMENT OF NUMA TO MITOTIC CENTROSOMES | Genes involved in Recruitment of NuMA to mitotic centrosomes |
| 0.4 | 3.2 | REACTOME DCC MEDIATED ATTRACTIVE SIGNALING | Genes involved in DCC mediated attractive signaling |
| 0.4 | 14.8 | REACTOME AMYLOIDS | Genes involved in Amyloids |
| 0.4 | 4.6 | REACTOME IKK COMPLEX RECRUITMENT MEDIATED BY RIP1 | Genes involved in IKK complex recruitment mediated by RIP1 |
| 0.3 | 14.8 | REACTOME NOD1 2 SIGNALING PATHWAY | Genes involved in NOD1/2 Signaling Pathway |
| 0.3 | 7.7 | REACTOME SYNTHESIS OF PIPS AT THE GOLGI MEMBRANE | Genes involved in Synthesis of PIPs at the Golgi membrane |
| 0.3 | 7.9 | REACTOME INTRINSIC PATHWAY | Genes involved in Intrinsic Pathway |
| 0.3 | 5.0 | REACTOME SYNTHESIS OF PE | Genes involved in Synthesis of PE |
| 0.3 | 4.9 | REACTOME IL 6 SIGNALING | Genes involved in Interleukin-6 signaling |
| 0.3 | 5.2 | REACTOME P2Y RECEPTORS | Genes involved in P2Y receptors |
| 0.3 | 3.3 | REACTOME DIGESTION OF DIETARY CARBOHYDRATE | Genes involved in Digestion of dietary carbohydrate |
| 0.3 | 12.6 | REACTOME CGMP EFFECTS | Genes involved in cGMP effects |
| 0.3 | 3.1 | REACTOME INFLAMMASOMES | Genes involved in Inflammasomes |
| 0.2 | 3.7 | REACTOME COMMON PATHWAY | Genes involved in Common Pathway |
| 0.2 | 8.9 | REACTOME INHIBITION OF VOLTAGE GATED CA2 CHANNELS VIA GBETA GAMMA SUBUNITS | Genes involved in Inhibition of voltage gated Ca2+ channels via Gbeta/gamma subunits |
| 0.2 | 4.1 | REACTOME IL 7 SIGNALING | Genes involved in Interleukin-7 signaling |
| 0.2 | 4.6 | REACTOME NOREPINEPHRINE NEUROTRANSMITTER RELEASE CYCLE | Genes involved in Norepinephrine Neurotransmitter Release Cycle |
| 0.2 | 1.6 | REACTOME RORA ACTIVATES CIRCADIAN EXPRESSION | Genes involved in RORA Activates Circadian Expression |
| 0.2 | 1.8 | REACTOME RECYCLING OF BILE ACIDS AND SALTS | Genes involved in Recycling of bile acids and salts |
| 0.2 | 12.6 | REACTOME CYTOCHROME P450 ARRANGED BY SUBSTRATE TYPE | Genes involved in Cytochrome P450 - arranged by substrate type |
| 0.2 | 2.7 | REACTOME TAK1 ACTIVATES NFKB BY PHOSPHORYLATION AND ACTIVATION OF IKKS COMPLEX | Genes involved in TAK1 activates NFkB by phosphorylation and activation of IKKs complex |
| 0.2 | 1.1 | REACTOME RNA POL I PROMOTER OPENING | Genes involved in RNA Polymerase I Promoter Opening |
| 0.2 | 14.1 | REACTOME FORMATION OF THE TERNARY COMPLEX AND SUBSEQUENTLY THE 43S COMPLEX | Genes involved in Formation of the ternary complex, and subsequently, the 43S complex |
| 0.2 | 6.0 | REACTOME IL RECEPTOR SHC SIGNALING | Genes involved in Interleukin receptor SHC signaling |
| 0.2 | 3.6 | REACTOME ACTIVATION OF THE MRNA UPON BINDING OF THE CAP BINDING COMPLEX AND EIFS AND SUBSEQUENT BINDING TO 43S | Genes involved in Activation of the mRNA upon binding of the cap-binding complex and eIFs, and subsequent binding to 43S |
| 0.2 | 19.3 | REACTOME TRANSCRIPTIONAL REGULATION OF WHITE ADIPOCYTE DIFFERENTIATION | Genes involved in Transcriptional Regulation of White Adipocyte Differentiation |
| 0.2 | 10.4 | REACTOME CHEMOKINE RECEPTORS BIND CHEMOKINES | Genes involved in Chemokine receptors bind chemokines |
| 0.2 | 4.0 | REACTOME GENERATION OF SECOND MESSENGER MOLECULES | Genes involved in Generation of second messenger molecules |
| 0.2 | 6.4 | REACTOME ERK MAPK TARGETS | Genes involved in ERK/MAPK targets |
| 0.2 | 3.5 | REACTOME TERMINATION OF O GLYCAN BIOSYNTHESIS | Genes involved in Termination of O-glycan biosynthesis |
| 0.1 | 8.1 | REACTOME NEGATIVE REGULATORS OF RIG I MDA5 SIGNALING | Genes involved in Negative regulators of RIG-I/MDA5 signaling |
| 0.1 | 2.7 | REACTOME INSULIN SYNTHESIS AND PROCESSING | Genes involved in Insulin Synthesis and Processing |
| 0.1 | 1.6 | REACTOME CD28 DEPENDENT VAV1 PATHWAY | Genes involved in CD28 dependent Vav1 pathway |
| 0.1 | 2.3 | REACTOME SYNTHESIS SECRETION AND INACTIVATION OF GIP | Genes involved in Synthesis, Secretion, and Inactivation of Glucose-dependent Insulinotropic Polypeptide (GIP) |
| 0.1 | 1.4 | REACTOME OPSINS | Genes involved in Opsins |
| 0.1 | 2.0 | REACTOME ORGANIC CATION ANION ZWITTERION TRANSPORT | Genes involved in Organic cation/anion/zwitterion transport |
| 0.1 | 0.7 | REACTOME HORMONE SENSITIVE LIPASE HSL MEDIATED TRIACYLGLYCEROL HYDROLYSIS | Genes involved in Hormone-sensitive lipase (HSL)-mediated triacylglycerol hydrolysis |
| 0.1 | 10.1 | REACTOME INTERFERON ALPHA BETA SIGNALING | Genes involved in Interferon alpha/beta signaling |
| 0.1 | 0.8 | REACTOME INWARDLY RECTIFYING K CHANNELS | Genes involved in Inwardly rectifying K+ channels |
| 0.1 | 3.0 | REACTOME SIGNALING BY BMP | Genes involved in Signaling by BMP |
| 0.1 | 6.6 | REACTOME STRIATED MUSCLE CONTRACTION | Genes involved in Striated Muscle Contraction |
| 0.1 | 9.4 | REACTOME 3 UTR MEDIATED TRANSLATIONAL REGULATION | Genes involved in 3' -UTR-mediated translational regulation |
| 0.1 | 4.2 | REACTOME ABC FAMILY PROTEINS MEDIATED TRANSPORT | Genes involved in ABC-family proteins mediated transport |
| 0.1 | 0.8 | REACTOME BILE SALT AND ORGANIC ANION SLC TRANSPORTERS | Genes involved in Bile salt and organic anion SLC transporters |
| 0.1 | 3.9 | REACTOME TRANSPORT OF MATURE MRNA DERIVED FROM AN INTRONLESS TRANSCRIPT | Genes involved in Transport of Mature mRNA Derived from an Intronless Transcript |
| 0.1 | 0.7 | REACTOME DSCAM INTERACTIONS | Genes involved in DSCAM interactions |
| 0.1 | 1.2 | REACTOME NUCLEAR SIGNALING BY ERBB4 | Genes involved in Nuclear signaling by ERBB4 |
| 0.1 | 4.1 | REACTOME REGULATION OF GENE EXPRESSION IN BETA CELLS | Genes involved in Regulation of gene expression in beta cells |
| 0.1 | 2.0 | REACTOME EXTRINSIC PATHWAY FOR APOPTOSIS | Genes involved in Extrinsic Pathway for Apoptosis |
| 0.1 | 7.8 | REACTOME CELL SURFACE INTERACTIONS AT THE VASCULAR WALL | Genes involved in Cell surface interactions at the vascular wall |
| 0.1 | 1.7 | REACTOME IL1 SIGNALING | Genes involved in Interleukin-1 signaling |
| 0.1 | 6.9 | REACTOME OLFACTORY SIGNALING PATHWAY | Genes involved in Olfactory Signaling Pathway |
| 0.1 | 1.7 | REACTOME REGULATION OF COMPLEMENT CASCADE | Genes involved in Regulation of Complement cascade |
| 0.1 | 3.4 | REACTOME TRANSPORT OF VITAMINS NUCLEOSIDES AND RELATED MOLECULES | Genes involved in Transport of vitamins, nucleosides, and related molecules |
| 0.1 | 3.0 | REACTOME INTERACTION BETWEEN L1 AND ANKYRINS | Genes involved in Interaction between L1 and Ankyrins |
| 0.1 | 0.7 | REACTOME ANDROGEN BIOSYNTHESIS | Genes involved in Androgen biosynthesis |
| 0.1 | 2.7 | REACTOME SEMA4D INDUCED CELL MIGRATION AND GROWTH CONE COLLAPSE | Genes involved in Sema4D induced cell migration and growth-cone collapse |
| 0.1 | 1.4 | REACTOME PRESYNAPTIC NICOTINIC ACETYLCHOLINE RECEPTORS | Genes involved in Presynaptic nicotinic acetylcholine receptors |
| 0.1 | 0.7 | REACTOME TRAFFICKING AND PROCESSING OF ENDOSOMAL TLR | Genes involved in Trafficking and processing of endosomal TLR |
| 0.1 | 1.5 | REACTOME PURINE SALVAGE | Genes involved in Purine salvage |
| 0.1 | 1.2 | REACTOME AMINE DERIVED HORMONES | Genes involved in Amine-derived hormones |
| 0.1 | 2.2 | REACTOME EFFECTS OF PIP2 HYDROLYSIS | Genes involved in Effects of PIP2 hydrolysis |
| 0.1 | 1.8 | REACTOME ACTIVATED AMPK STIMULATES FATTY ACID OXIDATION IN MUSCLE | Genes involved in Activated AMPK stimulates fatty-acid oxidation in muscle |
| 0.1 | 2.0 | REACTOME GLUTATHIONE CONJUGATION | Genes involved in Glutathione conjugation |
| 0.1 | 1.7 | REACTOME BRANCHED CHAIN AMINO ACID CATABOLISM | Genes involved in Branched-chain amino acid catabolism |
| 0.1 | 1.5 | REACTOME PLATELET CALCIUM HOMEOSTASIS | Genes involved in Platelet calcium homeostasis |
| 0.0 | 5.5 | REACTOME SIGNALING BY RHO GTPASES | Genes involved in Signaling by Rho GTPases |
| 0.0 | 4.8 | REACTOME CLASS B 2 SECRETIN FAMILY RECEPTORS | Genes involved in Class B/2 (Secretin family receptors) |
| 0.0 | 1.6 | REACTOME INTEGRIN CELL SURFACE INTERACTIONS | Genes involved in Integrin cell surface interactions |
| 0.0 | 1.6 | REACTOME RECYCLING PATHWAY OF L1 | Genes involved in Recycling pathway of L1 |
| 0.0 | 1.5 | REACTOME AMINO ACID TRANSPORT ACROSS THE PLASMA MEMBRANE | Genes involved in Amino acid transport across the plasma membrane |
| 0.0 | 0.6 | REACTOME KERATAN SULFATE DEGRADATION | Genes involved in Keratan sulfate degradation |
| 0.0 | 0.3 | REACTOME REGULATION OF THE FANCONI ANEMIA PATHWAY | Genes involved in Regulation of the Fanconi anemia pathway |
| 0.0 | 1.5 | REACTOME TIGHT JUNCTION INTERACTIONS | Genes involved in Tight junction interactions |
| 0.0 | 0.3 | REACTOME MTORC1 MEDIATED SIGNALLING | Genes involved in mTORC1-mediated signalling |
| 0.0 | 1.0 | REACTOME SULFUR AMINO ACID METABOLISM | Genes involved in Sulfur amino acid metabolism |
| 0.0 | 1.0 | REACTOME CELL EXTRACELLULAR MATRIX INTERACTIONS | Genes involved in Cell-extracellular matrix interactions |
| 0.0 | 0.6 | REACTOME EICOSANOID LIGAND BINDING RECEPTORS | Genes involved in Eicosanoid ligand-binding receptors |
| 0.0 | 0.2 | REACTOME SYNTHESIS OF BILE ACIDS AND BILE SALTS VIA 24 HYDROXYCHOLESTEROL | Genes involved in Synthesis of bile acids and bile salts via 24-hydroxycholesterol |
| 0.0 | 1.8 | REACTOME G ALPHA1213 SIGNALLING EVENTS | Genes involved in G alpha (12/13) signalling events |
| 0.0 | 2.5 | REACTOME NUCLEAR RECEPTOR TRANSCRIPTION PATHWAY | Genes involved in Nuclear Receptor transcription pathway |
| 0.0 | 0.4 | REACTOME PASSIVE TRANSPORT BY AQUAPORINS | Genes involved in Passive Transport by Aquaporins |
| 0.0 | 0.9 | REACTOME SYNTHESIS OF PA | Genes involved in Synthesis of PA |
| 0.0 | 0.6 | REACTOME AMINE COMPOUND SLC TRANSPORTERS | Genes involved in Amine compound SLC transporters |
| 0.0 | 0.3 | REACTOME MITOCHONDRIAL TRNA AMINOACYLATION | Genes involved in Mitochondrial tRNA aminoacylation |
| 0.0 | 0.7 | REACTOME GABA A RECEPTOR ACTIVATION | Genes involved in GABA A receptor activation |
| 0.0 | 0.4 | REACTOME CYTOSOLIC SULFONATION OF SMALL MOLECULES | Genes involved in Cytosolic sulfonation of small molecules |
| 0.0 | 0.1 | REACTOME HORMONE LIGAND BINDING RECEPTORS | Genes involved in Hormone ligand-binding receptors |
| 0.0 | 0.4 | REACTOME CHONDROITIN SULFATE DERMATAN SULFATE METABOLISM | Genes involved in Chondroitin sulfate/dermatan sulfate metabolism |
| 0.0 | 0.2 | REACTOME HS GAG BIOSYNTHESIS | Genes involved in HS-GAG biosynthesis |