Project
GNF SymAtlas + NCI-60 cancer cell lines, human (Su, 2004; Ross, 2000)
Navigation
Downloads
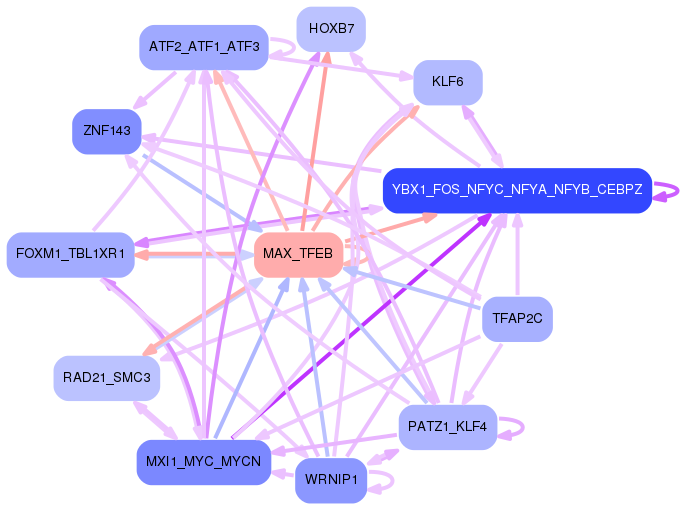
Results for MAX_TFEB
Z-value: 1.67
Motif logo
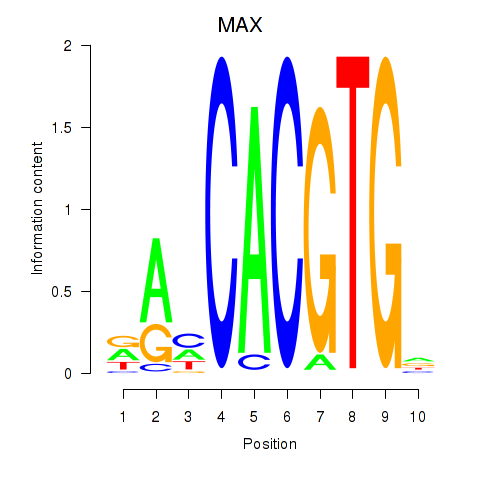
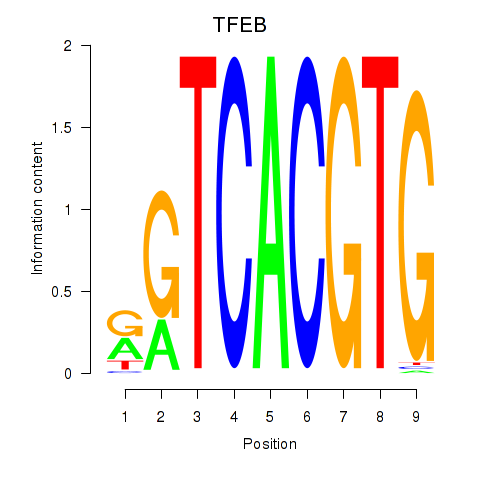
Transcription factors associated with MAX_TFEB
| Gene Symbol | Gene ID | Gene Info |
|---|---|---|
|
MAX
|
ENSG00000125952.20 | MAX |
|
TFEB
|
ENSG00000112561.19 | TFEB |
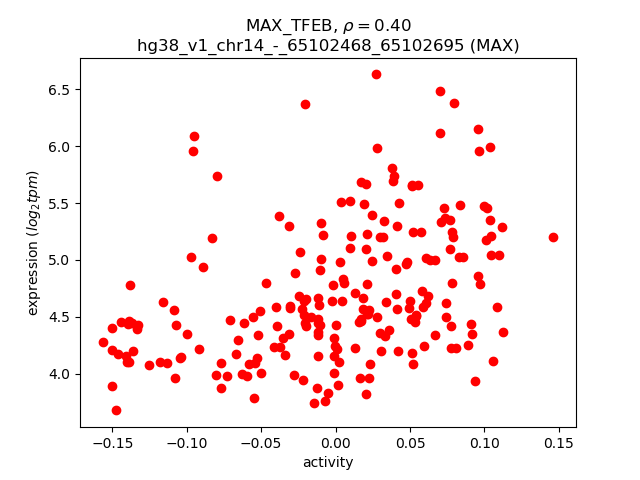
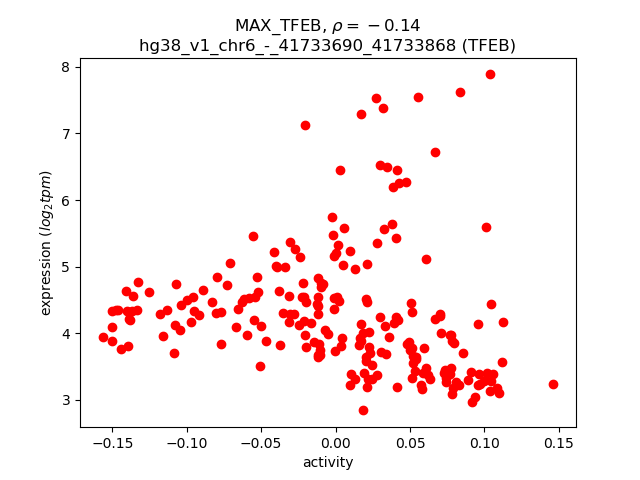
Activity-expression correlation:
| Gene | Promoter | Pearson corr. coef. | P-value | Plot |
|---|---|---|---|---|
| MAX | hg38_v1_chr14_-_65102468_65102695 | 0.40 | 9.4e-10 | Click! |
| TFEB | hg38_v1_chr6_-_41733690_41733868 | -0.14 | 4.6e-02 | Click! |
Activity profile of MAX_TFEB motif
Sorted Z-values of MAX_TFEB motif
Network of associatons between targets according to the STRING database.

First level regulatory network of MAX_TFEB
Gene Ontology Analysis
Gene overrepresentation in biological process category:
| Log-likelihood per target | Total log-likelihood | Term | Description |
|---|---|---|---|
| 83.3 | 416.6 | GO:1904637 | response to ionomycin(GO:1904636) cellular response to ionomycin(GO:1904637) |
| 28.7 | 86.0 | GO:0097698 | telomere maintenance via base-excision repair(GO:0097698) |
| 27.1 | 135.7 | GO:0033387 | putrescine biosynthetic process from ornithine(GO:0033387) |
| 22.1 | 66.4 | GO:0046452 | dihydrofolate metabolic process(GO:0046452) |
| 19.7 | 59.2 | GO:0002368 | B cell cytokine production(GO:0002368) |
| 17.0 | 68.0 | GO:0009216 | adenosine salvage(GO:0006169) dATP biosynthetic process(GO:0006175) purine deoxyribonucleoside triphosphate biosynthetic process(GO:0009216) |
| 13.6 | 81.5 | GO:0019264 | glycine biosynthetic process from serine(GO:0019264) |
| 13.4 | 40.1 | GO:0070407 | oxidation-dependent protein catabolic process(GO:0070407) |
| 12.1 | 48.5 | GO:0000961 | negative regulation of mitochondrial RNA catabolic process(GO:0000961) |
| 12.1 | 36.3 | GO:1902445 | regulation of mitochondrial membrane permeability involved in programmed necrotic cell death(GO:1902445) |
| 11.5 | 46.0 | GO:0018106 | peptidyl-histidine phosphorylation(GO:0018106) |
| 11.0 | 110.3 | GO:1904715 | negative regulation of chaperone-mediated autophagy(GO:1904715) |
| 10.8 | 97.3 | GO:0061484 | hematopoietic stem cell homeostasis(GO:0061484) |
| 10.7 | 32.1 | GO:0070429 | regulation of toll-like receptor 5 signaling pathway(GO:0034147) negative regulation of toll-like receptor 5 signaling pathway(GO:0034148) negative regulation of nucleotide-binding oligomerization domain containing 1 signaling pathway(GO:0070429) tolerance induction to lipopolysaccharide(GO:0072573) |
| 10.6 | 31.7 | GO:0090149 | mitochondrial membrane fission(GO:0090149) |
| 10.0 | 40.2 | GO:1902544 | regulation of DNA N-glycosylase activity(GO:1902544) |
| 9.5 | 28.5 | GO:0035752 | lysosomal lumen pH elevation(GO:0035752) |
| 9.4 | 28.2 | GO:1902905 | positive regulation of fibril organization(GO:1902905) |
| 8.7 | 8.7 | GO:0006620 | posttranslational protein targeting to membrane(GO:0006620) |
| 8.2 | 24.7 | GO:0070902 | mitochondrial tRNA pseudouridine synthesis(GO:0070902) |
| 8.2 | 73.9 | GO:0006335 | DNA replication-dependent nucleosome assembly(GO:0006335) DNA replication-dependent nucleosome organization(GO:0034723) |
| 8.2 | 24.6 | GO:0043323 | regulation of natural killer cell degranulation(GO:0043321) positive regulation of natural killer cell degranulation(GO:0043323) |
| 8.0 | 24.1 | GO:0001732 | formation of cytoplasmic translation initiation complex(GO:0001732) |
| 8.0 | 31.9 | GO:2000255 | negative regulation of male germ cell proliferation(GO:2000255) |
| 8.0 | 31.8 | GO:2000259 | positive regulation of complement activation(GO:0045917) positive regulation of protein activation cascade(GO:2000259) |
| 7.9 | 23.7 | GO:1904339 | negative regulation of dopaminergic neuron differentiation(GO:1904339) |
| 7.8 | 23.5 | GO:2000176 | regulation of pro-T cell differentiation(GO:2000174) positive regulation of pro-T cell differentiation(GO:2000176) |
| 7.8 | 54.6 | GO:1902416 | positive regulation of mRNA binding(GO:1902416) |
| 7.7 | 23.2 | GO:0090611 | ubiquitin-independent protein catabolic process via the multivesicular body sorting pathway(GO:0090611) |
| 7.6 | 22.9 | GO:1903031 | regulation of microtubule plus-end binding(GO:1903031) positive regulation of microtubule plus-end binding(GO:1903033) |
| 7.6 | 61.0 | GO:1902961 | positive regulation of aspartic-type endopeptidase activity involved in amyloid precursor protein catabolic process(GO:1902961) positive regulation of aspartic-type peptidase activity(GO:1905247) |
| 7.6 | 76.2 | GO:0045716 | positive regulation of low-density lipoprotein particle receptor biosynthetic process(GO:0045716) |
| 7.3 | 22.0 | GO:0006059 | hexitol metabolic process(GO:0006059) |
| 7.3 | 21.9 | GO:0000738 | DNA catabolic process, exonucleolytic(GO:0000738) |
| 7.0 | 20.9 | GO:0043490 | malate-aspartate shuttle(GO:0043490) |
| 6.8 | 34.1 | GO:0043137 | DNA replication, removal of RNA primer(GO:0043137) |
| 6.8 | 88.0 | GO:0006268 | DNA unwinding involved in DNA replication(GO:0006268) |
| 6.5 | 19.5 | GO:1901355 | response to rapamycin(GO:1901355) |
| 6.4 | 83.2 | GO:0021769 | orbitofrontal cortex development(GO:0021769) |
| 6.2 | 18.6 | GO:0044034 | negative stranded viral RNA replication(GO:0039689) multi-organism biosynthetic process(GO:0044034) |
| 6.2 | 24.7 | GO:0046833 | positive regulation of RNA export from nucleus(GO:0046833) |
| 6.1 | 49.1 | GO:0016139 | glycoside catabolic process(GO:0016139) |
| 5.9 | 17.6 | GO:1901301 | regulation of cargo loading into COPII-coated vesicle(GO:1901301) |
| 5.8 | 51.9 | GO:0045039 | protein import into mitochondrial inner membrane(GO:0045039) |
| 5.5 | 109.6 | GO:0016254 | preassembly of GPI anchor in ER membrane(GO:0016254) |
| 5.5 | 27.4 | GO:0032929 | negative regulation of superoxide anion generation(GO:0032929) |
| 5.5 | 21.9 | GO:0008588 | release of cytoplasmic sequestered NF-kappaB(GO:0008588) |
| 5.1 | 30.7 | GO:0070494 | regulation of thrombin receptor signaling pathway(GO:0070494) negative regulation of thrombin receptor signaling pathway(GO:0070495) |
| 5.0 | 20.1 | GO:0002501 | peptide antigen assembly with MHC protein complex(GO:0002501) |
| 4.9 | 24.6 | GO:0006344 | maintenance of chromatin silencing(GO:0006344) |
| 4.6 | 18.6 | GO:0043335 | protein unfolding(GO:0043335) |
| 4.6 | 22.8 | GO:0014886 | transition between slow and fast fiber(GO:0014886) |
| 4.4 | 17.8 | GO:0035407 | histone H3-T11 phosphorylation(GO:0035407) |
| 4.4 | 30.8 | GO:0046985 | histone H4-R3 methylation(GO:0043985) negative regulation of megakaryocyte differentiation(GO:0045653) positive regulation of hemoglobin biosynthetic process(GO:0046985) |
| 4.4 | 39.6 | GO:0042256 | mature ribosome assembly(GO:0042256) |
| 4.3 | 85.2 | GO:0006474 | N-terminal protein amino acid acetylation(GO:0006474) |
| 4.0 | 16.1 | GO:0048205 | COPI-coated vesicle budding(GO:0035964) Golgi transport vesicle coating(GO:0048200) COPI coating of Golgi vesicle(GO:0048205) |
| 3.9 | 11.8 | GO:0007174 | epidermal growth factor catabolic process(GO:0007174) |
| 3.9 | 11.8 | GO:0036245 | cellular response to menadione(GO:0036245) |
| 3.9 | 11.8 | GO:0002101 | tRNA wobble cytosine modification(GO:0002101) |
| 3.9 | 11.7 | GO:0031938 | pre-replicative complex assembly involved in nuclear cell cycle DNA replication(GO:0006267) regulation of chromatin silencing at telomere(GO:0031938) pre-replicative complex assembly(GO:0036388) pre-replicative complex assembly involved in cell cycle DNA replication(GO:1902299) |
| 3.9 | 15.5 | GO:0006556 | S-adenosylmethionine biosynthetic process(GO:0006556) |
| 3.8 | 7.7 | GO:0090402 | oncogene-induced cell senescence(GO:0090402) |
| 3.8 | 11.5 | GO:0090521 | glomerular visceral epithelial cell migration(GO:0090521) |
| 3.8 | 7.6 | GO:1901526 | positive regulation of macromitophagy(GO:1901526) positive regulation of mitophagy in response to mitochondrial depolarization(GO:1904925) |
| 3.8 | 30.2 | GO:0046604 | positive regulation of mitotic centrosome separation(GO:0046604) |
| 3.8 | 15.0 | GO:0033634 | positive regulation of cell-cell adhesion mediated by integrin(GO:0033634) |
| 3.8 | 11.3 | GO:0000454 | snoRNA guided rRNA pseudouridine synthesis(GO:0000454) |
| 3.7 | 7.4 | GO:0006166 | purine ribonucleoside salvage(GO:0006166) |
| 3.6 | 28.6 | GO:0060155 | platelet dense granule organization(GO:0060155) |
| 3.5 | 20.8 | GO:0016321 | female meiosis chromosome segregation(GO:0016321) |
| 3.4 | 30.8 | GO:0006189 | 'de novo' IMP biosynthetic process(GO:0006189) |
| 3.4 | 44.4 | GO:2000781 | positive regulation of double-strand break repair(GO:2000781) |
| 3.4 | 10.2 | GO:0002949 | tRNA threonylcarbamoyladenosine modification(GO:0002949) |
| 3.4 | 10.1 | GO:0006864 | pyrimidine nucleotide transport(GO:0006864) mitochondrial pyrimidine nucleotide import(GO:1990519) |
| 3.4 | 6.7 | GO:0046166 | glyceraldehyde-3-phosphate biosynthetic process(GO:0046166) |
| 3.4 | 6.7 | GO:0044205 | 'de novo' UMP biosynthetic process(GO:0044205) |
| 3.2 | 9.7 | GO:0098905 | regulation of bundle of His cell action potential(GO:0098905) |
| 3.2 | 16.1 | GO:0061738 | late endosomal microautophagy(GO:0061738) negative regulation of fibril organization(GO:1902904) chaperone-mediated autophagy translocation complex disassembly(GO:1904764) |
| 3.1 | 31.4 | GO:0045008 | depyrimidination(GO:0045008) |
| 3.1 | 9.3 | GO:1903093 | regulation of protein K48-linked deubiquitination(GO:1903093) negative regulation of protein K48-linked deubiquitination(GO:1903094) negative regulation of ubiquitin-specific protease activity(GO:2000157) |
| 3.1 | 43.0 | GO:2000680 | rubidium ion transport(GO:0035826) regulation of rubidium ion transport(GO:2000680) |
| 3.0 | 15.0 | GO:0006740 | NADPH regeneration(GO:0006740) |
| 3.0 | 26.9 | GO:1903608 | protein localization to cytoplasmic stress granule(GO:1903608) |
| 3.0 | 6.0 | GO:1903774 | positive regulation of viral budding via host ESCRT complex(GO:1903774) |
| 3.0 | 26.7 | GO:0071578 | zinc II ion transmembrane import(GO:0071578) |
| 2.9 | 23.0 | GO:0034316 | negative regulation of Arp2/3 complex-mediated actin nucleation(GO:0034316) |
| 2.9 | 14.3 | GO:0031291 | Ran protein signal transduction(GO:0031291) |
| 2.8 | 42.3 | GO:0075522 | IRES-dependent viral translational initiation(GO:0075522) |
| 2.8 | 8.4 | GO:0008611 | ether lipid biosynthetic process(GO:0008611) glycerol ether biosynthetic process(GO:0046504) ether biosynthetic process(GO:1901503) |
| 2.8 | 169.3 | GO:0070911 | global genome nucleotide-excision repair(GO:0070911) |
| 2.8 | 8.3 | GO:1903676 | regulation of cap-dependent translational initiation(GO:1903674) positive regulation of cap-dependent translational initiation(GO:1903676) |
| 2.8 | 35.8 | GO:0007253 | cytoplasmic sequestering of NF-kappaB(GO:0007253) |
| 2.7 | 18.8 | GO:2000812 | regulation of barbed-end actin filament capping(GO:2000812) |
| 2.7 | 10.7 | GO:2000435 | regulation of protein neddylation(GO:2000434) negative regulation of protein neddylation(GO:2000435) |
| 2.7 | 10.6 | GO:0000415 | negative regulation of histone H3-K36 methylation(GO:0000415) |
| 2.6 | 28.4 | GO:0006552 | leucine catabolic process(GO:0006552) |
| 2.6 | 18.0 | GO:0044351 | macropinocytosis(GO:0044351) |
| 2.5 | 22.4 | GO:1902455 | negative regulation of stem cell population maintenance(GO:1902455) |
| 2.5 | 74.5 | GO:0090383 | phagosome acidification(GO:0090383) |
| 2.5 | 9.9 | GO:0019348 | dolichol metabolic process(GO:0019348) |
| 2.5 | 7.4 | GO:0006167 | AMP biosynthetic process(GO:0006167) |
| 2.5 | 12.3 | GO:0009213 | pyrimidine nucleoside triphosphate catabolic process(GO:0009149) pyrimidine deoxyribonucleoside triphosphate catabolic process(GO:0009213) |
| 2.5 | 19.6 | GO:0002759 | regulation of antimicrobial humoral response(GO:0002759) |
| 2.4 | 12.2 | GO:0072423 | response to cell cycle checkpoint signaling(GO:0072396) response to DNA integrity checkpoint signaling(GO:0072402) response to DNA damage checkpoint signaling(GO:0072423) |
| 2.4 | 26.3 | GO:0044341 | sodium-dependent phosphate transport(GO:0044341) |
| 2.3 | 16.4 | GO:0097680 | double-strand break repair via classical nonhomologous end joining(GO:0097680) |
| 2.3 | 37.0 | GO:0006228 | UTP biosynthetic process(GO:0006228) |
| 2.3 | 6.8 | GO:1902594 | viral penetration into host nucleus(GO:0075732) multi-organism nuclear import(GO:1902594) |
| 2.3 | 145.4 | GO:0007157 | heterophilic cell-cell adhesion via plasma membrane cell adhesion molecules(GO:0007157) |
| 2.2 | 20.2 | GO:0044800 | fusion of virus membrane with host plasma membrane(GO:0019064) membrane fusion involved in viral entry into host cell(GO:0039663) multi-organism membrane fusion(GO:0044800) |
| 2.2 | 6.6 | GO:0044828 | negative regulation by host of viral genome replication(GO:0044828) |
| 2.2 | 11.0 | GO:0016240 | autophagosome docking(GO:0016240) |
| 2.1 | 15.0 | GO:0015712 | hexose phosphate transport(GO:0015712) glucose-6-phosphate transport(GO:0015760) |
| 2.1 | 19.2 | GO:1902570 | protein localization to nucleolus(GO:1902570) |
| 2.1 | 6.3 | GO:0071963 | establishment or maintenance of cell polarity regulating cell shape(GO:0071963) |
| 2.1 | 10.5 | GO:0030043 | actin filament fragmentation(GO:0030043) |
| 2.1 | 6.2 | GO:0060266 | negative regulation of respiratory burst involved in inflammatory response(GO:0060266) |
| 2.1 | 14.4 | GO:0000255 | allantoin metabolic process(GO:0000255) |
| 2.0 | 12.3 | GO:0048254 | snoRNA localization(GO:0048254) |
| 2.0 | 8.1 | GO:1900126 | negative regulation of hyaluronan biosynthetic process(GO:1900126) |
| 2.0 | 26.0 | GO:1901072 | glucosamine-containing compound catabolic process(GO:1901072) |
| 2.0 | 10.0 | GO:0009052 | pentose-phosphate shunt, non-oxidative branch(GO:0009052) |
| 1.9 | 17.4 | GO:0018401 | peptidyl-proline hydroxylation to 4-hydroxy-L-proline(GO:0018401) |
| 1.9 | 11.4 | GO:0015680 | intracellular copper ion transport(GO:0015680) |
| 1.9 | 9.5 | GO:0071051 | polyadenylation-dependent snoRNA 3'-end processing(GO:0071051) |
| 1.9 | 22.6 | GO:0007221 | positive regulation of transcription of Notch receptor target(GO:0007221) |
| 1.9 | 5.6 | GO:0045556 | TRAIL biosynthetic process(GO:0045553) regulation of TRAIL biosynthetic process(GO:0045554) positive regulation of TRAIL biosynthetic process(GO:0045556) |
| 1.9 | 18.5 | GO:0048368 | lateral mesoderm development(GO:0048368) |
| 1.9 | 9.3 | GO:1900262 | regulation of DNA-directed DNA polymerase activity(GO:1900262) positive regulation of DNA-directed DNA polymerase activity(GO:1900264) |
| 1.8 | 271.5 | GO:0006613 | cotranslational protein targeting to membrane(GO:0006613) |
| 1.8 | 28.5 | GO:0009125 | nucleoside monophosphate catabolic process(GO:0009125) |
| 1.8 | 8.8 | GO:0045875 | negative regulation of sister chromatid cohesion(GO:0045875) |
| 1.7 | 8.7 | GO:1901159 | xylulose metabolic process(GO:0005997) glucuronate catabolic process(GO:0006064) glucuronate catabolic process to xylulose 5-phosphate(GO:0019640) xylulose 5-phosphate metabolic process(GO:0051167) xylulose 5-phosphate biosynthetic process(GO:1901159) |
| 1.7 | 20.8 | GO:0035360 | positive regulation of peroxisome proliferator activated receptor signaling pathway(GO:0035360) |
| 1.7 | 20.7 | GO:0007064 | mitotic sister chromatid cohesion(GO:0007064) |
| 1.7 | 12.1 | GO:0072553 | terminal button organization(GO:0072553) |
| 1.7 | 5.1 | GO:1903691 | positive regulation of wound healing, spreading of epidermal cells(GO:1903691) |
| 1.6 | 1.6 | GO:0072387 | flavin adenine dinucleotide metabolic process(GO:0072387) |
| 1.6 | 6.6 | GO:0051182 | coenzyme transport(GO:0051182) |
| 1.6 | 6.5 | GO:0072719 | smooth muscle hyperplasia(GO:0014806) cellular response to cisplatin(GO:0072719) |
| 1.6 | 4.8 | GO:0060510 | Type II pneumocyte differentiation(GO:0060510) |
| 1.6 | 28.2 | GO:0048262 | determination of dorsal/ventral asymmetry(GO:0048262) |
| 1.6 | 4.7 | GO:0033499 | galactose catabolic process via UDP-galactose(GO:0033499) |
| 1.6 | 4.7 | GO:0060279 | regulation of ovulation(GO:0060278) positive regulation of ovulation(GO:0060279) |
| 1.5 | 34.0 | GO:0090190 | positive regulation of branching involved in ureteric bud morphogenesis(GO:0090190) |
| 1.5 | 68.9 | GO:2000816 | negative regulation of sister chromatid segregation(GO:0033046) negative regulation of mitotic sister chromatid segregation(GO:0033048) negative regulation of mitotic sister chromatid separation(GO:2000816) |
| 1.5 | 25.7 | GO:1990126 | retrograde transport, endosome to plasma membrane(GO:1990126) |
| 1.5 | 15.0 | GO:0040016 | embryonic cleavage(GO:0040016) |
| 1.5 | 9.0 | GO:2000253 | positive regulation of feeding behavior(GO:2000253) |
| 1.5 | 4.4 | GO:0002905 | mature B cell apoptotic process(GO:0002901) regulation of mature B cell apoptotic process(GO:0002905) negative regulation of mature B cell apoptotic process(GO:0002906) |
| 1.4 | 21.5 | GO:1903760 | regulation of voltage-gated potassium channel activity involved in ventricular cardiac muscle cell action potential repolarization(GO:1903760) |
| 1.4 | 11.3 | GO:0070164 | negative regulation of adiponectin secretion(GO:0070164) |
| 1.4 | 5.6 | GO:0030200 | heparan sulfate proteoglycan catabolic process(GO:0030200) |
| 1.4 | 20.8 | GO:0034244 | negative regulation of transcription elongation from RNA polymerase II promoter(GO:0034244) |
| 1.4 | 6.9 | GO:0007042 | lysosomal lumen acidification(GO:0007042) |
| 1.4 | 15.1 | GO:0051151 | negative regulation of smooth muscle cell differentiation(GO:0051151) |
| 1.4 | 13.8 | GO:0051451 | myoblast migration(GO:0051451) |
| 1.3 | 18.7 | GO:1903800 | positive regulation of production of miRNAs involved in gene silencing by miRNA(GO:1903800) |
| 1.3 | 10.6 | GO:0045627 | positive regulation of T-helper 1 cell differentiation(GO:0045627) |
| 1.3 | 6.6 | GO:2000110 | regulation of MyD88-dependent toll-like receptor signaling pathway(GO:0034124) negative regulation of macrophage apoptotic process(GO:2000110) |
| 1.3 | 1.3 | GO:0014734 | skeletal muscle hypertrophy(GO:0014734) |
| 1.3 | 1.3 | GO:0000960 | mitochondrial RNA catabolic process(GO:0000957) regulation of mitochondrial RNA catabolic process(GO:0000960) |
| 1.3 | 3.8 | GO:1902498 | regulation of protein autoubiquitination(GO:1902498) |
| 1.3 | 5.0 | GO:0051088 | PMA-inducible membrane protein ectodomain proteolysis(GO:0051088) |
| 1.2 | 12.3 | GO:0061158 | 3'-UTR-mediated mRNA destabilization(GO:0061158) |
| 1.2 | 23.3 | GO:0050862 | positive regulation of T cell receptor signaling pathway(GO:0050862) |
| 1.2 | 8.5 | GO:0008295 | spermidine biosynthetic process(GO:0008295) |
| 1.2 | 3.6 | GO:0060528 | secretory columnal luminar epithelial cell differentiation involved in prostate glandular acinus development(GO:0060528) |
| 1.2 | 3.6 | GO:0035910 | endocardial cushion fusion(GO:0003274) ascending aorta development(GO:0035905) ascending aorta morphogenesis(GO:0035910) uterine wall breakdown(GO:0042704) |
| 1.2 | 30.6 | GO:0015937 | coenzyme A biosynthetic process(GO:0015937) |
| 1.2 | 4.7 | GO:0010585 | glutamine secretion(GO:0010585) L-glutamine import(GO:0036229) L-glutamine import into cell(GO:1903803) |
| 1.2 | 26.8 | GO:0030488 | tRNA methylation(GO:0030488) |
| 1.2 | 12.7 | GO:2001169 | regulation of ATP biosynthetic process(GO:2001169) positive regulation of ATP biosynthetic process(GO:2001171) |
| 1.1 | 25.0 | GO:0008334 | histone mRNA metabolic process(GO:0008334) |
| 1.1 | 29.4 | GO:0000185 | activation of MAPKKK activity(GO:0000185) |
| 1.1 | 24.8 | GO:1902894 | negative regulation of pri-miRNA transcription from RNA polymerase II promoter(GO:1902894) |
| 1.1 | 11.3 | GO:0008298 | intracellular mRNA localization(GO:0008298) |
| 1.1 | 24.8 | GO:0090503 | RNA phosphodiester bond hydrolysis, exonucleolytic(GO:0090503) |
| 1.1 | 8.9 | GO:0044206 | pyrimidine ribonucleotide salvage(GO:0010138) pyrimidine nucleotide salvage(GO:0032262) UMP salvage(GO:0044206) |
| 1.1 | 10.0 | GO:0042276 | error-prone translesion synthesis(GO:0042276) |
| 1.1 | 41.2 | GO:0000289 | nuclear-transcribed mRNA poly(A) tail shortening(GO:0000289) |
| 1.1 | 4.4 | GO:0042450 | arginine biosynthetic process via ornithine(GO:0042450) |
| 1.1 | 63.6 | GO:0042273 | ribosomal large subunit biogenesis(GO:0042273) |
| 1.1 | 4.4 | GO:0046654 | tetrahydrofolate biosynthetic process(GO:0046654) |
| 1.1 | 4.4 | GO:0042264 | peptidyl-aspartic acid hydroxylation(GO:0042264) |
| 1.1 | 1.1 | GO:0060003 | copper ion export(GO:0060003) |
| 1.1 | 5.4 | GO:0019464 | glycine catabolic process(GO:0006546) glycine decarboxylation via glycine cleavage system(GO:0019464) |
| 1.1 | 3.2 | GO:0036233 | glycine import(GO:0036233) |
| 1.0 | 3.1 | GO:2000298 | regulation of Rho-dependent protein serine/threonine kinase activity(GO:2000298) |
| 1.0 | 19.7 | GO:0006782 | protoporphyrinogen IX biosynthetic process(GO:0006782) |
| 1.0 | 13.3 | GO:0032025 | response to cobalt ion(GO:0032025) |
| 1.0 | 10.1 | GO:0051315 | attachment of mitotic spindle microtubules to kinetochore(GO:0051315) |
| 1.0 | 13.1 | GO:0034498 | early endosome to Golgi transport(GO:0034498) |
| 1.0 | 16.0 | GO:0042340 | keratan sulfate catabolic process(GO:0042340) |
| 1.0 | 3.9 | GO:0019355 | nicotinamide nucleotide biosynthetic process from aspartate(GO:0019355) 'de novo' NAD biosynthetic process(GO:0034627) 'de novo' NAD biosynthetic process from aspartate(GO:0034628) |
| 1.0 | 6.7 | GO:0018206 | peptidyl-methionine modification(GO:0018206) |
| 0.9 | 39.2 | GO:0034724 | DNA replication-independent nucleosome organization(GO:0034724) |
| 0.9 | 116.5 | GO:0006364 | rRNA processing(GO:0006364) |
| 0.9 | 3.7 | GO:0002032 | desensitization of G-protein coupled receptor protein signaling pathway by arrestin(GO:0002032) |
| 0.9 | 15.1 | GO:0098779 | mitophagy in response to mitochondrial depolarization(GO:0098779) |
| 0.9 | 5.3 | GO:0061767 | negative regulation of lung blood pressure(GO:0061767) |
| 0.9 | 7.0 | GO:2000210 | positive regulation of anoikis(GO:2000210) |
| 0.9 | 7.9 | GO:0070459 | prolactin secretion(GO:0070459) |
| 0.9 | 8.7 | GO:0006983 | ER overload response(GO:0006983) |
| 0.9 | 8.5 | GO:0006294 | nucleotide-excision repair, preincision complex assembly(GO:0006294) |
| 0.9 | 11.1 | GO:0002115 | store-operated calcium entry(GO:0002115) |
| 0.8 | 2.5 | GO:1901389 | regulation of transforming growth factor beta activation(GO:1901388) negative regulation of transforming growth factor beta activation(GO:1901389) |
| 0.8 | 24.0 | GO:0045898 | regulation of RNA polymerase II transcriptional preinitiation complex assembly(GO:0045898) |
| 0.8 | 44.6 | GO:0048009 | insulin-like growth factor receptor signaling pathway(GO:0048009) |
| 0.8 | 2.5 | GO:0002416 | IgG immunoglobulin transcytosis in epithelial cells mediated by FcRn immunoglobulin receptor(GO:0002416) |
| 0.8 | 2.5 | GO:0001188 | RNA polymerase I transcriptional preinitiation complex assembly(GO:0001188) RNA polymerase I transcriptional preinitiation complex assembly at the promoter for the nuclear large rRNA transcript(GO:0001189) |
| 0.8 | 51.2 | GO:0042267 | natural killer cell mediated cytotoxicity(GO:0042267) |
| 0.8 | 45.1 | GO:0006334 | nucleosome assembly(GO:0006334) |
| 0.8 | 6.4 | GO:0006659 | phosphatidylserine biosynthetic process(GO:0006659) |
| 0.8 | 61.7 | GO:0045071 | negative regulation of viral genome replication(GO:0045071) |
| 0.8 | 5.5 | GO:0033183 | negative regulation of histone ubiquitination(GO:0033183) histone H2A K63-linked ubiquitination(GO:0070535) negative regulation of protein K63-linked ubiquitination(GO:1900045) regulation of histone H2A K63-linked ubiquitination(GO:1901314) negative regulation of histone H2A K63-linked ubiquitination(GO:1901315) negative regulation of protein polyubiquitination(GO:1902915) |
| 0.8 | 57.1 | GO:0006369 | termination of RNA polymerase II transcription(GO:0006369) |
| 0.7 | 6.7 | GO:0000395 | mRNA 5'-splice site recognition(GO:0000395) |
| 0.7 | 5.9 | GO:1902235 | regulation of endoplasmic reticulum stress-induced intrinsic apoptotic signaling pathway(GO:1902235) |
| 0.7 | 5.1 | GO:0010592 | positive regulation of lamellipodium assembly(GO:0010592) |
| 0.7 | 5.8 | GO:0007549 | dosage compensation(GO:0007549) dosage compensation by inactivation of X chromosome(GO:0009048) |
| 0.7 | 6.5 | GO:0048026 | positive regulation of mRNA splicing, via spliceosome(GO:0048026) |
| 0.7 | 14.8 | GO:1902893 | regulation of pri-miRNA transcription from RNA polymerase II promoter(GO:1902893) |
| 0.7 | 12.0 | GO:0016226 | iron-sulfur cluster assembly(GO:0016226) metallo-sulfur cluster assembly(GO:0031163) |
| 0.7 | 26.7 | GO:0000188 | inactivation of MAPK activity(GO:0000188) |
| 0.7 | 2.8 | GO:0034975 | protein folding in endoplasmic reticulum(GO:0034975) |
| 0.7 | 2.8 | GO:0030961 | peptidyl-arginine hydroxylation(GO:0030961) |
| 0.7 | 2.1 | GO:0036510 | trimming of terminal mannose on C branch(GO:0036510) |
| 0.7 | 8.9 | GO:0090161 | Golgi ribbon formation(GO:0090161) |
| 0.7 | 46.3 | GO:0000380 | alternative mRNA splicing, via spliceosome(GO:0000380) |
| 0.7 | 14.0 | GO:0043651 | linoleic acid metabolic process(GO:0043651) |
| 0.7 | 11.3 | GO:0003334 | keratinocyte development(GO:0003334) |
| 0.7 | 5.3 | GO:0033484 | regulation of protein ADP-ribosylation(GO:0010835) nitric oxide homeostasis(GO:0033484) |
| 0.7 | 7.3 | GO:0035269 | protein O-linked mannosylation(GO:0035269) |
| 0.7 | 5.3 | GO:0048702 | embryonic neurocranium morphogenesis(GO:0048702) |
| 0.6 | 29.0 | GO:0070979 | protein K11-linked ubiquitination(GO:0070979) |
| 0.6 | 1.9 | GO:0090160 | Golgi to lysosome transport(GO:0090160) |
| 0.6 | 17.3 | GO:0034643 | establishment of mitochondrion localization, microtubule-mediated(GO:0034643) mitochondrion transport along microtubule(GO:0047497) |
| 0.6 | 19.0 | GO:1900026 | positive regulation of substrate adhesion-dependent cell spreading(GO:1900026) |
| 0.6 | 1.2 | GO:0061113 | pancreas morphogenesis(GO:0061113) |
| 0.6 | 4.9 | GO:0006450 | regulation of translational fidelity(GO:0006450) |
| 0.6 | 15.3 | GO:0006363 | termination of RNA polymerase I transcription(GO:0006363) |
| 0.6 | 62.2 | GO:0070527 | platelet aggregation(GO:0070527) |
| 0.6 | 2.4 | GO:0032907 | B cell receptor transport within lipid bilayer(GO:0032595) B cell receptor transport into membrane raft(GO:0032597) protein transport out of membrane raft(GO:0032599) chemokine receptor transport out of membrane raft(GO:0032600) transforming growth factor beta3 production(GO:0032907) regulation of transforming growth factor beta3 production(GO:0032910) negative regulation of transforming growth factor beta3 production(GO:0032913) chemokine receptor transport within lipid bilayer(GO:0033606) |
| 0.6 | 10.2 | GO:0042921 | glucocorticoid receptor signaling pathway(GO:0042921) |
| 0.6 | 50.4 | GO:0043297 | apical junction assembly(GO:0043297) |
| 0.6 | 5.3 | GO:0031580 | membrane raft polarization(GO:0001766) membrane raft distribution(GO:0031580) |
| 0.6 | 8.5 | GO:0006105 | succinate metabolic process(GO:0006105) |
| 0.6 | 26.0 | GO:1901998 | toxin transport(GO:1901998) |
| 0.6 | 2.3 | GO:0015677 | copper ion import(GO:0015677) |
| 0.6 | 3.4 | GO:0006689 | ganglioside catabolic process(GO:0006689) |
| 0.6 | 40.1 | GO:0035722 | interleukin-12-mediated signaling pathway(GO:0035722) response to interleukin-12(GO:0070671) cellular response to interleukin-12(GO:0071349) |
| 0.6 | 3.3 | GO:0050893 | sensory processing(GO:0050893) |
| 0.5 | 6.6 | GO:0060261 | positive regulation of transcription initiation from RNA polymerase II promoter(GO:0060261) |
| 0.5 | 39.3 | GO:0032981 | NADH dehydrogenase complex assembly(GO:0010257) mitochondrial respiratory chain complex I assembly(GO:0032981) mitochondrial respiratory chain complex I biogenesis(GO:0097031) |
| 0.5 | 4.9 | GO:1902237 | positive regulation of endoplasmic reticulum stress-induced intrinsic apoptotic signaling pathway(GO:1902237) |
| 0.5 | 26.7 | GO:0000245 | spliceosomal complex assembly(GO:0000245) |
| 0.5 | 32.5 | GO:1904667 | negative regulation of ubiquitin-protein ligase activity involved in mitotic cell cycle(GO:0051436) regulation of ubiquitin-protein ligase activity involved in mitotic cell cycle(GO:0051439) negative regulation of ubiquitin protein ligase activity(GO:1904667) |
| 0.5 | 17.3 | GO:0001881 | receptor recycling(GO:0001881) |
| 0.5 | 2.1 | GO:0018879 | biphenyl metabolic process(GO:0018879) |
| 0.5 | 1.0 | GO:0045605 | negative regulation of epidermal cell differentiation(GO:0045605) negative regulation of keratinocyte differentiation(GO:0045617) |
| 0.5 | 5.5 | GO:0016180 | snRNA processing(GO:0016180) |
| 0.5 | 3.5 | GO:0048280 | vesicle fusion with Golgi apparatus(GO:0048280) |
| 0.5 | 8.9 | GO:0051085 | chaperone mediated protein folding requiring cofactor(GO:0051085) |
| 0.5 | 15.8 | GO:0006378 | mRNA polyadenylation(GO:0006378) RNA polyadenylation(GO:0043631) |
| 0.5 | 8.9 | GO:0006646 | phosphatidylethanolamine biosynthetic process(GO:0006646) |
| 0.5 | 5.1 | GO:0043653 | mitochondrial fragmentation involved in apoptotic process(GO:0043653) |
| 0.5 | 12.7 | GO:0006754 | ATP biosynthetic process(GO:0006754) |
| 0.5 | 4.1 | GO:0006564 | L-serine biosynthetic process(GO:0006564) |
| 0.4 | 5.7 | GO:0043983 | histone H4-K12 acetylation(GO:0043983) |
| 0.4 | 4.4 | GO:0001886 | endothelial cell morphogenesis(GO:0001886) |
| 0.4 | 18.3 | GO:0071377 | cellular response to glucagon stimulus(GO:0071377) |
| 0.4 | 4.5 | GO:1904714 | regulation of chaperone-mediated autophagy(GO:1904714) |
| 0.4 | 5.7 | GO:0032836 | glomerular basement membrane development(GO:0032836) |
| 0.4 | 9.2 | GO:0045736 | negative regulation of cyclin-dependent protein serine/threonine kinase activity(GO:0045736) |
| 0.4 | 17.7 | GO:0090502 | RNA phosphodiester bond hydrolysis, endonucleolytic(GO:0090502) |
| 0.4 | 18.1 | GO:0046839 | phospholipid dephosphorylation(GO:0046839) |
| 0.4 | 22.9 | GO:0044364 | killing of cells of other organism(GO:0031640) disruption of cells of other organism(GO:0044364) |
| 0.4 | 28.1 | GO:0048678 | response to axon injury(GO:0048678) |
| 0.4 | 16.5 | GO:0048146 | positive regulation of fibroblast proliferation(GO:0048146) |
| 0.4 | 1.1 | GO:1901895 | negative regulation of calcium-transporting ATPase activity(GO:1901895) |
| 0.4 | 1.1 | GO:1901492 | positive regulation of lymphangiogenesis(GO:1901492) |
| 0.4 | 8.2 | GO:0006491 | N-glycan processing(GO:0006491) |
| 0.4 | 5.2 | GO:0036010 | protein localization to endosome(GO:0036010) |
| 0.4 | 1.8 | GO:0019919 | peptidyl-arginine methylation, to asymmetrical-dimethyl arginine(GO:0019919) peptidyl-arginine omega-N-methylation(GO:0035247) |
| 0.4 | 11.2 | GO:0006409 | tRNA export from nucleus(GO:0006409) tRNA-containing ribonucleoprotein complex export from nucleus(GO:0071431) |
| 0.3 | 2.1 | GO:0017182 | peptidyl-diphthamide metabolic process(GO:0017182) peptidyl-diphthamide biosynthetic process from peptidyl-histidine(GO:0017183) |
| 0.3 | 1.4 | GO:0003366 | cell-matrix adhesion involved in ameboidal cell migration(GO:0003366) |
| 0.3 | 38.1 | GO:0006414 | translational elongation(GO:0006414) |
| 0.3 | 21.1 | GO:0038128 | ERBB2 signaling pathway(GO:0038128) |
| 0.3 | 7.2 | GO:0031639 | plasminogen activation(GO:0031639) |
| 0.3 | 3.1 | GO:0048387 | negative regulation of retinoic acid receptor signaling pathway(GO:0048387) |
| 0.3 | 2.8 | GO:0048386 | positive regulation of retinoic acid receptor signaling pathway(GO:0048386) |
| 0.3 | 5.5 | GO:0032402 | melanosome transport(GO:0032402) |
| 0.3 | 3.0 | GO:0010452 | histone H3-K36 methylation(GO:0010452) |
| 0.3 | 10.1 | GO:0070207 | protein homotrimerization(GO:0070207) |
| 0.3 | 1.9 | GO:0042255 | ribosome assembly(GO:0042255) |
| 0.3 | 20.8 | GO:0032272 | negative regulation of protein polymerization(GO:0032272) |
| 0.3 | 26.5 | GO:0006487 | protein N-linked glycosylation(GO:0006487) |
| 0.3 | 4.5 | GO:0040015 | negative regulation of multicellular organism growth(GO:0040015) |
| 0.3 | 26.4 | GO:0036498 | IRE1-mediated unfolded protein response(GO:0036498) |
| 0.3 | 5.7 | GO:0002021 | response to dietary excess(GO:0002021) |
| 0.3 | 4.3 | GO:0070723 | response to cholesterol(GO:0070723) |
| 0.3 | 18.5 | GO:0006446 | regulation of translational initiation(GO:0006446) |
| 0.3 | 6.3 | GO:0070423 | nucleotide-binding oligomerization domain containing signaling pathway(GO:0070423) |
| 0.3 | 3.6 | GO:0030050 | vesicle transport along actin filament(GO:0030050) |
| 0.3 | 11.6 | GO:0045776 | negative regulation of blood pressure(GO:0045776) |
| 0.3 | 5.3 | GO:0070534 | protein K63-linked ubiquitination(GO:0070534) |
| 0.3 | 3.9 | GO:0048535 | lymph node development(GO:0048535) |
| 0.3 | 2.6 | GO:0000338 | protein deneddylation(GO:0000338) |
| 0.3 | 3.8 | GO:0071577 | zinc II ion transmembrane transport(GO:0071577) |
| 0.3 | 3.8 | GO:0015889 | cobalamin transport(GO:0015889) |
| 0.3 | 5.5 | GO:1903432 | regulation of TORC1 signaling(GO:1903432) |
| 0.2 | 1.0 | GO:0050902 | leukocyte adhesive activation(GO:0050902) |
| 0.2 | 2.9 | GO:2000271 | positive regulation of fibroblast apoptotic process(GO:2000271) |
| 0.2 | 3.4 | GO:0006020 | inositol metabolic process(GO:0006020) |
| 0.2 | 1.9 | GO:0044030 | regulation of DNA methylation(GO:0044030) |
| 0.2 | 8.5 | GO:0061462 | protein localization to lysosome(GO:0061462) |
| 0.2 | 2.3 | GO:0032926 | negative regulation of activin receptor signaling pathway(GO:0032926) |
| 0.2 | 0.9 | GO:0019418 | sulfide oxidation(GO:0019418) sulfide oxidation, using sulfide:quinone oxidoreductase(GO:0070221) |
| 0.2 | 0.7 | GO:0048312 | intracellular distribution of mitochondria(GO:0048312) |
| 0.2 | 1.6 | GO:0043928 | nuclear-transcribed mRNA catabolic process, exonucleolytic(GO:0000291) exonucleolytic nuclear-transcribed mRNA catabolic process involved in deadenylation-dependent decay(GO:0043928) |
| 0.2 | 2.3 | GO:0006853 | carnitine shuttle(GO:0006853) |
| 0.2 | 13.5 | GO:0071300 | cellular response to retinoic acid(GO:0071300) |
| 0.2 | 0.8 | GO:0033306 | phytol metabolic process(GO:0033306) fatty alcohol metabolic process(GO:1903173) |
| 0.2 | 2.8 | GO:0001778 | plasma membrane repair(GO:0001778) |
| 0.2 | 34.2 | GO:0000377 | RNA splicing, via transesterification reactions with bulged adenosine as nucleophile(GO:0000377) mRNA splicing, via spliceosome(GO:0000398) |
| 0.2 | 2.5 | GO:0018027 | peptidyl-lysine dimethylation(GO:0018027) |
| 0.2 | 6.5 | GO:0046676 | negative regulation of insulin secretion(GO:0046676) |
| 0.2 | 4.6 | GO:1903831 | acetylcholine receptor signaling pathway(GO:0095500) postsynaptic signal transduction(GO:0098926) signal transduction involved in cellular response to ammonium ion(GO:1903831) response to acetylcholine(GO:1905144) cellular response to acetylcholine(GO:1905145) |
| 0.2 | 53.7 | GO:0010038 | response to metal ion(GO:0010038) |
| 0.2 | 7.5 | GO:0048247 | lymphocyte chemotaxis(GO:0048247) |
| 0.2 | 1.9 | GO:0051601 | exocyst localization(GO:0051601) |
| 0.2 | 2.2 | GO:0032331 | negative regulation of chondrocyte differentiation(GO:0032331) |
| 0.2 | 6.4 | GO:1902400 | DNA damage response, signal transduction by p53 class mediator resulting in cell cycle arrest(GO:0006977) signal transduction involved in mitotic G1 DNA damage checkpoint(GO:0072431) intracellular signal transduction involved in G1 DNA damage checkpoint(GO:1902400) |
| 0.2 | 2.8 | GO:0097264 | self proteolysis(GO:0097264) |
| 0.2 | 86.4 | GO:0043312 | neutrophil activation involved in immune response(GO:0002283) neutrophil degranulation(GO:0043312) |
| 0.2 | 2.7 | GO:0008535 | respiratory chain complex IV assembly(GO:0008535) |
| 0.2 | 3.4 | GO:0050873 | brown fat cell differentiation(GO:0050873) |
| 0.2 | 9.2 | GO:0006401 | RNA catabolic process(GO:0006401) |
| 0.2 | 3.9 | GO:0006400 | tRNA modification(GO:0006400) |
| 0.2 | 2.6 | GO:0034453 | microtubule anchoring(GO:0034453) |
| 0.2 | 8.1 | GO:0015701 | bicarbonate transport(GO:0015701) |
| 0.1 | 3.7 | GO:0031648 | protein destabilization(GO:0031648) |
| 0.1 | 4.7 | GO:2000249 | regulation of actin cytoskeleton reorganization(GO:2000249) |
| 0.1 | 1.0 | GO:0002230 | positive regulation of defense response to virus by host(GO:0002230) |
| 0.1 | 1.1 | GO:1901407 | regulation of phosphorylation of RNA polymerase II C-terminal domain(GO:1901407) |
| 0.1 | 5.3 | GO:0045638 | negative regulation of myeloid cell differentiation(GO:0045638) |
| 0.1 | 2.3 | GO:0048935 | peripheral nervous system neuron differentiation(GO:0048934) peripheral nervous system neuron development(GO:0048935) |
| 0.1 | 1.1 | GO:0002315 | marginal zone B cell differentiation(GO:0002315) |
| 0.1 | 0.9 | GO:0032486 | Rap protein signal transduction(GO:0032486) |
| 0.1 | 2.5 | GO:0006308 | DNA catabolic process(GO:0006308) |
| 0.1 | 1.3 | GO:0016024 | CDP-diacylglycerol biosynthetic process(GO:0016024) |
| 0.1 | 8.7 | GO:0002576 | platelet degranulation(GO:0002576) |
| 0.1 | 5.1 | GO:0043647 | inositol phosphate metabolic process(GO:0043647) |
| 0.1 | 1.6 | GO:0006283 | transcription-coupled nucleotide-excision repair(GO:0006283) |
| 0.1 | 1.7 | GO:0042149 | cellular response to glucose starvation(GO:0042149) |
| 0.1 | 0.5 | GO:0071895 | odontoblast differentiation(GO:0071895) |
| 0.1 | 2.6 | GO:0045604 | regulation of epidermal cell differentiation(GO:0045604) |
| 0.1 | 0.6 | GO:0042976 | activation of Janus kinase activity(GO:0042976) |
| 0.1 | 0.5 | GO:0015939 | pantothenate metabolic process(GO:0015939) |
| 0.1 | 8.0 | GO:2001020 | regulation of response to DNA damage stimulus(GO:2001020) |
| 0.1 | 4.3 | GO:0006968 | cellular defense response(GO:0006968) |
| 0.1 | 9.7 | GO:0050920 | regulation of chemotaxis(GO:0050920) |
| 0.1 | 5.9 | GO:2001237 | negative regulation of extrinsic apoptotic signaling pathway(GO:2001237) |
| 0.1 | 12.4 | GO:0050851 | antigen receptor-mediated signaling pathway(GO:0050851) |
| 0.1 | 3.6 | GO:0019915 | lipid storage(GO:0019915) |
| 0.1 | 1.5 | GO:0033198 | response to ATP(GO:0033198) |
| 0.1 | 1.6 | GO:0031581 | hemidesmosome assembly(GO:0031581) |
| 0.1 | 2.5 | GO:0045454 | cell redox homeostasis(GO:0045454) |
| 0.1 | 0.6 | GO:0048251 | elastic fiber assembly(GO:0048251) |
| 0.0 | 0.5 | GO:0060009 | Sertoli cell development(GO:0060009) |
| 0.0 | 1.4 | GO:0048635 | negative regulation of muscle organ development(GO:0048635) |
| 0.0 | 0.6 | GO:0033006 | regulation of mast cell activation involved in immune response(GO:0033006) regulation of mast cell degranulation(GO:0043304) |
| 0.0 | 2.0 | GO:0006501 | C-terminal protein lipidation(GO:0006501) |
| 0.0 | 0.8 | GO:0050690 | regulation of defense response to virus by virus(GO:0050690) |
| 0.0 | 0.2 | GO:0015074 | DNA integration(GO:0015074) |
| 0.0 | 0.4 | GO:0042339 | keratan sulfate metabolic process(GO:0042339) |
| 0.0 | 2.9 | GO:0031424 | keratinization(GO:0031424) |
| 0.0 | 0.0 | GO:2000679 | positive regulation of transcription regulatory region DNA binding(GO:2000679) |
| 0.0 | 0.7 | GO:0015804 | neutral amino acid transport(GO:0015804) |
| 0.0 | 0.0 | GO:0009750 | response to fructose(GO:0009750) |
| 0.0 | 0.9 | GO:0070301 | cellular response to hydrogen peroxide(GO:0070301) |
Gene overrepresentation in cellular component category:
| Log-likelihood per target | Total log-likelihood | Term | Description |
|---|---|---|---|
| 69.4 | 416.6 | GO:0097129 | cyclin D2-CDK4 complex(GO:0097129) |
| 18.5 | 73.9 | GO:0033186 | CAF-1 complex(GO:0033186) |
| 15.3 | 122.8 | GO:0098575 | lumenal side of lysosomal membrane(GO:0098575) |
| 12.2 | 61.0 | GO:0070381 | endosome to plasma membrane transport vesicle(GO:0070381) |
| 11.0 | 109.6 | GO:0000506 | glycosylphosphatidylinositol-N-acetylglucosaminyltransferase (GPI-GnT) complex(GO:0000506) |
| 9.9 | 29.7 | GO:0033597 | mitotic checkpoint complex(GO:0033597) bub1-bub3 complex(GO:1990298) |
| 8.6 | 25.7 | GO:0030906 | retromer, cargo-selective complex(GO:0030906) |
| 7.7 | 46.3 | GO:0042721 | mitochondrial inner membrane protein insertion complex(GO:0042721) |
| 7.5 | 67.8 | GO:0019907 | cyclin-dependent protein kinase activating kinase holoenzyme complex(GO:0019907) |
| 7.4 | 29.6 | GO:0071986 | Ragulator complex(GO:0071986) |
| 7.3 | 21.9 | GO:0045323 | interleukin-1 receptor complex(GO:0045323) |
| 7.0 | 48.9 | GO:0031415 | NatA complex(GO:0031415) |
| 6.9 | 20.7 | GO:0034991 | nuclear meiotic cohesin complex(GO:0034991) |
| 6.8 | 88.3 | GO:0042555 | MCM complex(GO:0042555) |
| 6.6 | 66.2 | GO:0070552 | BRISC complex(GO:0070552) |
| 6.4 | 32.0 | GO:0034388 | Pwp2p-containing subcomplex of 90S preribosome(GO:0034388) |
| 6.4 | 44.7 | GO:0044530 | supraspliceosomal complex(GO:0044530) |
| 6.3 | 25.3 | GO:0031510 | SUMO activating enzyme complex(GO:0031510) |
| 6.3 | 56.4 | GO:0042382 | paraspeckles(GO:0042382) |
| 5.4 | 21.6 | GO:0020003 | symbiont-containing vacuole(GO:0020003) |
| 5.4 | 86.1 | GO:0033177 | proton-transporting two-sector ATPase complex, proton-transporting domain(GO:0033177) proton-transporting V-type ATPase, V0 domain(GO:0033179) |
| 5.3 | 101.2 | GO:0005671 | Ada2/Gcn5/Ada3 transcription activator complex(GO:0005671) |
| 5.2 | 15.5 | GO:0048269 | methionine adenosyltransferase complex(GO:0048269) |
| 4.9 | 14.7 | GO:0071148 | TEAD-1-YAP complex(GO:0071148) |
| 4.8 | 48.1 | GO:0046581 | intercellular canaliculus(GO:0046581) |
| 4.7 | 47.4 | GO:0071541 | eukaryotic translation initiation factor 3 complex, eIF3m(GO:0071541) |
| 4.7 | 14.0 | GO:0071817 | MMXD complex(GO:0071817) |
| 4.6 | 22.9 | GO:0030981 | cortical microtubule cytoskeleton(GO:0030981) |
| 4.5 | 13.6 | GO:0005664 | origin recognition complex(GO:0000808) nuclear origin of replication recognition complex(GO:0005664) |
| 4.4 | 17.6 | GO:0032937 | SREBP-SCAP-Insig complex(GO:0032937) |
| 4.3 | 12.9 | GO:1902737 | dendritic filopodium(GO:1902737) |
| 4.2 | 16.8 | GO:0034457 | Mpp10 complex(GO:0034457) |
| 4.2 | 83.2 | GO:0005885 | Arp2/3 protein complex(GO:0005885) |
| 4.1 | 36.5 | GO:0097208 | alveolar lamellar body(GO:0097208) |
| 4.0 | 27.8 | GO:1990111 | spermatoproteasome complex(GO:1990111) |
| 4.0 | 75.2 | GO:0005641 | nuclear envelope lumen(GO:0005641) |
| 3.9 | 70.6 | GO:0005852 | eukaryotic translation initiation factor 3 complex(GO:0005852) |
| 3.9 | 11.7 | GO:0005656 | nuclear pre-replicative complex(GO:0005656) pre-replicative complex(GO:0036387) |
| 3.7 | 18.6 | GO:0034274 | Atg12-Atg5-Atg16 complex(GO:0034274) |
| 3.7 | 29.7 | GO:0002169 | 3-methylcrotonyl-CoA carboxylase complex, mitochondrial(GO:0002169) methylcrotonoyl-CoA carboxylase complex(GO:1905202) |
| 3.6 | 43.0 | GO:0097487 | multivesicular body, internal vesicle(GO:0097487) |
| 3.5 | 38.7 | GO:0005853 | eukaryotic translation elongation factor 1 complex(GO:0005853) |
| 3.5 | 55.8 | GO:0034709 | methylosome(GO:0034709) |
| 3.5 | 52.1 | GO:0005689 | U12-type spliceosomal complex(GO:0005689) |
| 3.4 | 41.2 | GO:0008250 | oligosaccharyltransferase complex(GO:0008250) |
| 3.3 | 20.1 | GO:0042824 | MHC class I peptide loading complex(GO:0042824) |
| 3.3 | 19.7 | GO:0032279 | asymmetric synapse(GO:0032279) |
| 3.2 | 38.4 | GO:0071203 | WASH complex(GO:0071203) |
| 3.0 | 14.9 | GO:0016589 | NURF complex(GO:0016589) |
| 2.7 | 13.6 | GO:0000942 | condensed nuclear chromosome outer kinetochore(GO:0000942) |
| 2.7 | 18.8 | GO:0032021 | NELF complex(GO:0032021) |
| 2.6 | 23.1 | GO:0000439 | core TFIIH complex(GO:0000439) |
| 2.6 | 38.4 | GO:0031083 | BLOC-1 complex(GO:0031083) |
| 2.5 | 7.4 | GO:0030689 | Noc complex(GO:0030689) |
| 2.4 | 114.1 | GO:0042645 | nucleoid(GO:0009295) mitochondrial nucleoid(GO:0042645) |
| 2.4 | 26.1 | GO:0031465 | Cul4B-RING E3 ubiquitin ligase complex(GO:0031465) |
| 2.3 | 39.7 | GO:0034098 | VCP-NPL4-UFD1 AAA ATPase complex(GO:0034098) |
| 2.3 | 41.2 | GO:0016281 | eukaryotic translation initiation factor 4F complex(GO:0016281) |
| 2.3 | 11.3 | GO:0072588 | box H/ACA snoRNP complex(GO:0031429) box H/ACA RNP complex(GO:0072588) box H/ACA scaRNP complex(GO:0072589) box H/ACA telomerase RNP complex(GO:0090661) |
| 2.1 | 29.3 | GO:0090543 | Flemming body(GO:0090543) |
| 2.0 | 73.8 | GO:0030140 | trans-Golgi network transport vesicle(GO:0030140) |
| 2.0 | 10.2 | GO:0000408 | EKC/KEOPS complex(GO:0000408) |
| 2.0 | 215.5 | GO:0022625 | cytosolic large ribosomal subunit(GO:0022625) |
| 2.0 | 9.9 | GO:0043564 | Ku70:Ku80 complex(GO:0043564) |
| 2.0 | 7.8 | GO:0005899 | insulin receptor complex(GO:0005899) |
| 2.0 | 9.8 | GO:0033503 | HULC complex(GO:0033503) |
| 1.9 | 23.2 | GO:0097136 | Bcl-2 family protein complex(GO:0097136) |
| 1.9 | 14.9 | GO:0031464 | Cul4A-RING E3 ubiquitin ligase complex(GO:0031464) |
| 1.9 | 7.4 | GO:0002189 | ribose phosphate diphosphokinase complex(GO:0002189) |
| 1.6 | 11.5 | GO:0030905 | retromer, tubulation complex(GO:0030905) |
| 1.6 | 19.6 | GO:0097413 | Lewy body(GO:0097413) |
| 1.6 | 4.8 | GO:0044611 | nuclear pore inner ring(GO:0044611) |
| 1.6 | 4.7 | GO:0043512 | inhibin complex(GO:0043511) inhibin A complex(GO:0043512) |
| 1.6 | 12.4 | GO:0070761 | pre-snoRNP complex(GO:0070761) |
| 1.6 | 57.5 | GO:0005790 | smooth endoplasmic reticulum(GO:0005790) |
| 1.5 | 9.3 | GO:0031390 | Ctf18 RFC-like complex(GO:0031390) |
| 1.5 | 4.5 | GO:0071001 | U4/U6 snRNP(GO:0071001) |
| 1.5 | 32.0 | GO:0071141 | SMAD protein complex(GO:0071141) |
| 1.4 | 5.6 | GO:0042719 | mitochondrial intermembrane space protein transporter complex(GO:0042719) |
| 1.4 | 9.6 | GO:0000940 | condensed chromosome outer kinetochore(GO:0000940) |
| 1.3 | 5.4 | GO:0005960 | glycine cleavage complex(GO:0005960) |
| 1.3 | 4.0 | GO:1903349 | omegasome membrane(GO:1903349) |
| 1.3 | 10.5 | GO:0000015 | phosphopyruvate hydratase complex(GO:0000015) |
| 1.3 | 10.1 | GO:0061700 | GATOR2 complex(GO:0061700) |
| 1.3 | 40.4 | GO:0030687 | preribosome, large subunit precursor(GO:0030687) |
| 1.3 | 20.0 | GO:0035102 | PRC1 complex(GO:0035102) |
| 1.2 | 7.0 | GO:0020018 | ciliary pocket(GO:0020016) ciliary pocket membrane(GO:0020018) |
| 1.2 | 137.6 | GO:0035578 | azurophil granule lumen(GO:0035578) |
| 1.2 | 4.6 | GO:0008537 | proteasome activator complex(GO:0008537) |
| 1.1 | 5.7 | GO:0000243 | commitment complex(GO:0000243) |
| 1.1 | 17.7 | GO:0005736 | DNA-directed RNA polymerase I complex(GO:0005736) |
| 1.1 | 161.3 | GO:0016605 | PML body(GO:0016605) |
| 1.1 | 21.5 | GO:0097025 | MPP7-DLG1-LIN7 complex(GO:0097025) |
| 1.1 | 207.9 | GO:0005840 | ribosome(GO:0005840) |
| 1.0 | 6.3 | GO:0000172 | ribonuclease MRP complex(GO:0000172) |
| 1.0 | 7.3 | GO:0031298 | replication fork protection complex(GO:0031298) |
| 1.0 | 17.0 | GO:1990909 | Wnt signalosome(GO:1990909) |
| 0.9 | 9.3 | GO:0034663 | endoplasmic reticulum chaperone complex(GO:0034663) |
| 0.9 | 5.5 | GO:1990131 | EGO complex(GO:0034448) Gtr1-Gtr2 GTPase complex(GO:1990131) |
| 0.9 | 8.1 | GO:0005786 | signal recognition particle, endoplasmic reticulum targeting(GO:0005786) |
| 0.9 | 14.3 | GO:0097431 | mitotic spindle pole(GO:0097431) |
| 0.8 | 6.7 | GO:0030686 | 90S preribosome(GO:0030686) |
| 0.8 | 2.5 | GO:1990913 | sperm head plasma membrane(GO:1990913) ooplasm(GO:1990917) |
| 0.8 | 4.8 | GO:0017101 | aminoacyl-tRNA synthetase multienzyme complex(GO:0017101) |
| 0.8 | 17.3 | GO:0000930 | gamma-tubulin complex(GO:0000930) |
| 0.8 | 21.8 | GO:0000178 | exosome (RNase complex)(GO:0000178) |
| 0.8 | 8.6 | GO:0005638 | lamin filament(GO:0005638) |
| 0.8 | 7.6 | GO:0031595 | nuclear proteasome complex(GO:0031595) |
| 0.7 | 5.8 | GO:0030532 | small nuclear ribonucleoprotein complex(GO:0030532) |
| 0.7 | 8.7 | GO:0000815 | ESCRT III complex(GO:0000815) |
| 0.7 | 50.6 | GO:0032154 | cleavage furrow(GO:0032154) cell surface furrow(GO:0097610) |
| 0.7 | 92.2 | GO:0005882 | intermediate filament(GO:0005882) |
| 0.7 | 3.5 | GO:0030062 | mitochondrial tricarboxylic acid cycle enzyme complex(GO:0030062) |
| 0.7 | 22.9 | GO:0016581 | NuRD complex(GO:0016581) CHD-type complex(GO:0090545) |
| 0.7 | 2.7 | GO:0035841 | growing cell tip(GO:0035838) new growing cell tip(GO:0035841) |
| 0.7 | 6.0 | GO:0000813 | ESCRT I complex(GO:0000813) |
| 0.6 | 1.9 | GO:0098592 | cytoplasmic side of apical plasma membrane(GO:0098592) |
| 0.6 | 6.1 | GO:0030126 | COPI vesicle coat(GO:0030126) |
| 0.6 | 3.5 | GO:1990726 | Lsm1-7-Pat1 complex(GO:1990726) |
| 0.6 | 8.9 | GO:0098563 | integral component of synaptic vesicle membrane(GO:0030285) intrinsic component of synaptic vesicle membrane(GO:0098563) |
| 0.5 | 4.4 | GO:0032541 | cortical endoplasmic reticulum(GO:0032541) |
| 0.5 | 5.5 | GO:0008385 | IkappaB kinase complex(GO:0008385) |
| 0.5 | 10.2 | GO:0031362 | anchored component of external side of plasma membrane(GO:0031362) |
| 0.5 | 1.6 | GO:0055087 | Ski complex(GO:0055087) |
| 0.5 | 44.0 | GO:0000777 | condensed chromosome kinetochore(GO:0000777) |
| 0.5 | 3.7 | GO:0031466 | Cul5-RING ubiquitin ligase complex(GO:0031466) |
| 0.5 | 7.8 | GO:0032040 | small-subunit processome(GO:0032040) |
| 0.5 | 58.1 | GO:0070821 | tertiary granule membrane(GO:0070821) |
| 0.5 | 5.5 | GO:0032039 | integrator complex(GO:0032039) |
| 0.5 | 22.2 | GO:0031258 | lamellipodium membrane(GO:0031258) |
| 0.5 | 5.1 | GO:0000153 | cytoplasmic ubiquitin ligase complex(GO:0000153) |
| 0.5 | 30.3 | GO:0005637 | nuclear inner membrane(GO:0005637) |
| 0.4 | 39.8 | GO:0005643 | nuclear pore(GO:0005643) |
| 0.4 | 79.8 | GO:0005681 | spliceosomal complex(GO:0005681) |
| 0.4 | 2.0 | GO:0032044 | DSIF complex(GO:0032044) |
| 0.4 | 8.8 | GO:0098800 | inner mitochondrial membrane protein complex(GO:0098800) |
| 0.3 | 2.8 | GO:0072546 | ER membrane protein complex(GO:0072546) |
| 0.3 | 1.4 | GO:0034669 | integrin alpha4-beta7 complex(GO:0034669) |
| 0.3 | 28.1 | GO:0017053 | transcriptional repressor complex(GO:0017053) |
| 0.3 | 25.2 | GO:0031594 | neuromuscular junction(GO:0031594) |
| 0.3 | 46.5 | GO:1904813 | ficolin-1-rich granule(GO:0101002) ficolin-1-rich granule lumen(GO:1904813) |
| 0.3 | 11.3 | GO:0002102 | podosome(GO:0002102) |
| 0.3 | 2.7 | GO:0001520 | outer dense fiber(GO:0001520) |
| 0.3 | 1.8 | GO:0042405 | nuclear inclusion body(GO:0042405) |
| 0.3 | 27.4 | GO:0016459 | myosin complex(GO:0016459) |
| 0.3 | 14.0 | GO:0000502 | proteasome complex(GO:0000502) |
| 0.3 | 8.7 | GO:0005902 | microvillus(GO:0005902) |
| 0.3 | 0.8 | GO:0097135 | cyclin E2-CDK2 complex(GO:0097135) |
| 0.2 | 1.2 | GO:0005827 | polar microtubule(GO:0005827) |
| 0.2 | 21.2 | GO:0005758 | mitochondrial intermembrane space(GO:0005758) organelle envelope lumen(GO:0031970) |
| 0.2 | 27.8 | GO:0048770 | melanosome(GO:0042470) pigment granule(GO:0048770) |
| 0.2 | 21.0 | GO:0005746 | mitochondrial respiratory chain(GO:0005746) |
| 0.2 | 3.5 | GO:0097433 | dense body(GO:0097433) |
| 0.2 | 7.8 | GO:0016592 | mediator complex(GO:0016592) |
| 0.2 | 5.1 | GO:0032420 | stereocilium(GO:0032420) |
| 0.2 | 13.4 | GO:0045335 | phagocytic vesicle(GO:0045335) |
| 0.2 | 10.4 | GO:0031526 | brush border membrane(GO:0031526) |
| 0.2 | 5.6 | GO:0005903 | brush border(GO:0005903) |
| 0.2 | 9.0 | GO:0035580 | specific granule lumen(GO:0035580) |
| 0.2 | 11.0 | GO:0031966 | mitochondrial membrane(GO:0031966) |
| 0.1 | 3.3 | GO:0005892 | acetylcholine-gated channel complex(GO:0005892) |
| 0.1 | 3.0 | GO:0000776 | kinetochore(GO:0000776) |
| 0.1 | 6.9 | GO:0031903 | peroxisomal membrane(GO:0005778) microbody membrane(GO:0031903) |
| 0.1 | 42.3 | GO:0016324 | apical plasma membrane(GO:0016324) |
| 0.1 | 4.4 | GO:0043034 | costamere(GO:0043034) |
| 0.1 | 3.0 | GO:0070971 | endoplasmic reticulum exit site(GO:0070971) |
| 0.1 | 1.0 | GO:0001931 | uropod(GO:0001931) cell trailing edge(GO:0031254) |
| 0.1 | 0.5 | GO:1990907 | beta-catenin-TCF complex(GO:1990907) |
| 0.1 | 3.8 | GO:0045111 | intermediate filament cytoskeleton(GO:0045111) |
| 0.1 | 15.6 | GO:0005741 | mitochondrial outer membrane(GO:0005741) |
| 0.1 | 13.5 | GO:0008021 | synaptic vesicle(GO:0008021) |
| 0.1 | 20.9 | GO:0019866 | organelle inner membrane(GO:0019866) |
| 0.1 | 2.1 | GO:0044322 | endoplasmic reticulum quality control compartment(GO:0044322) |
| 0.1 | 2.6 | GO:0008180 | COP9 signalosome(GO:0008180) |
| 0.1 | 0.4 | GO:0030896 | checkpoint clamp complex(GO:0030896) |
| 0.1 | 67.8 | GO:0005730 | nucleolus(GO:0005730) |
| 0.1 | 2.7 | GO:0097517 | stress fiber(GO:0001725) contractile actin filament bundle(GO:0097517) |
| 0.1 | 1.9 | GO:0005680 | anaphase-promoting complex(GO:0005680) |
| 0.1 | 2.3 | GO:0005771 | multivesicular body(GO:0005771) |
| 0.1 | 5.0 | GO:0005581 | collagen trimer(GO:0005581) |
| 0.0 | 6.4 | GO:0031225 | anchored component of membrane(GO:0031225) |
| 0.0 | 1.1 | GO:0030173 | integral component of Golgi membrane(GO:0030173) |
| 0.0 | 2.8 | GO:0030496 | midbody(GO:0030496) |
| 0.0 | 9.6 | GO:0010008 | endosome membrane(GO:0010008) |
| 0.0 | 1.0 | GO:0045171 | intercellular bridge(GO:0045171) |
| 0.0 | 0.3 | GO:0072686 | mitotic spindle(GO:0072686) |
Gene overrepresentation in molecular function category:
| Log-likelihood per target | Total log-likelihood | Term | Description |
|---|---|---|---|
| 21.5 | 86.0 | GO:0008311 | double-stranded DNA 3'-5' exodeoxyribonuclease activity(GO:0008311) |
| 17.1 | 34.1 | GO:0008309 | double-stranded DNA exodeoxyribonuclease activity(GO:0008309) |
| 17.0 | 68.0 | GO:0004001 | adenosine kinase activity(GO:0004001) |
| 16.8 | 83.9 | GO:0070180 | large ribosomal subunit rRNA binding(GO:0070180) |
| 14.9 | 44.6 | GO:0016936 | galactoside binding(GO:0016936) |
| 14.1 | 42.3 | GO:0005010 | insulin-like growth factor-activated receptor activity(GO:0005010) |
| 13.8 | 110.1 | GO:0004308 | exo-alpha-sialidase activity(GO:0004308) alpha-sialidase activity(GO:0016997) |
| 13.6 | 81.5 | GO:0008732 | glycine hydroxymethyltransferase activity(GO:0004372) threonine aldolase activity(GO:0004793) L-allo-threonine aldolase activity(GO:0008732) |
| 13.4 | 40.2 | GO:0043739 | G/U mismatch-specific uracil-DNA glycosylase activity(GO:0043739) |
| 13.4 | 40.1 | GO:0070362 | mitochondrial light strand promoter anti-sense binding(GO:0070361) mitochondrial heavy strand promoter anti-sense binding(GO:0070362) mitochondrial heavy strand promoter sense binding(GO:0070364) |
| 12.2 | 109.6 | GO:0017176 | phosphatidylinositol N-acetylglucosaminyltransferase activity(GO:0017176) |
| 11.0 | 55.0 | GO:0031871 | proteinase activated receptor binding(GO:0031871) |
| 10.8 | 420.6 | GO:0016538 | cyclin-dependent protein serine/threonine kinase regulator activity(GO:0016538) |
| 10.7 | 64.0 | GO:0019238 | cyclohydrolase activity(GO:0019238) |
| 9.9 | 59.2 | GO:0034186 | apolipoprotein A-I binding(GO:0034186) |
| 9.4 | 28.3 | GO:0004638 | phosphoribosylaminoimidazole carboxylase activity(GO:0004638) phosphoribosylaminoimidazolesuccinocarboxamide synthase activity(GO:0004639) |
| 9.1 | 36.3 | GO:1990189 | peptide-serine-N-acetyltransferase activity(GO:1990189) |
| 8.2 | 24.7 | GO:0004730 | pseudouridylate synthase activity(GO:0004730) |
| 7.3 | 21.9 | GO:0008859 | exoribonuclease II activity(GO:0008859) |
| 6.9 | 27.6 | GO:0042134 | rRNA primary transcript binding(GO:0042134) |
| 6.7 | 20.1 | GO:0008988 | rRNA (adenine-N6-)-methyltransferase activity(GO:0008988) |
| 6.7 | 93.4 | GO:0031386 | protein tag(GO:0031386) |
| 6.2 | 24.6 | GO:0008449 | N-acetylglucosamine-6-sulfatase activity(GO:0008449) |
| 5.6 | 44.7 | GO:0003726 | double-stranded RNA adenosine deaminase activity(GO:0003726) |
| 5.4 | 26.8 | GO:0097322 | 7SK snRNA binding(GO:0097322) |
| 5.3 | 26.3 | GO:0015319 | sodium:inorganic phosphate symporter activity(GO:0015319) |
| 5.2 | 20.6 | GO:0043273 | CTPase activity(GO:0043273) |
| 5.1 | 30.8 | GO:0044020 | histone methyltransferase activity (H4-R3 specific)(GO:0044020) |
| 5.1 | 20.5 | GO:0004844 | uracil DNA N-glycosylase activity(GO:0004844) deaminated base DNA N-glycosylase activity(GO:0097506) |
| 5.0 | 15.0 | GO:0004346 | glucose-6-phosphatase activity(GO:0004346) sugar-terminal-phosphatase activity(GO:0050309) |
| 4.9 | 19.7 | GO:0004853 | uroporphyrinogen decarboxylase activity(GO:0004853) |
| 4.9 | 24.5 | GO:0004809 | tRNA (guanine-N2-)-methyltransferase activity(GO:0004809) |
| 4.9 | 48.9 | GO:0004596 | peptide alpha-N-acetyltransferase activity(GO:0004596) |
| 4.7 | 23.7 | GO:0019776 | Atg8 ligase activity(GO:0019776) |
| 4.4 | 17.8 | GO:0035402 | histone kinase activity (H3-T11 specific)(GO:0035402) |
| 4.4 | 84.4 | GO:0019215 | intermediate filament binding(GO:0019215) |
| 4.4 | 61.0 | GO:0032050 | clathrin heavy chain binding(GO:0032050) |
| 4.2 | 25.1 | GO:0004839 | ubiquitin activating enzyme activity(GO:0004839) |
| 4.0 | 31.9 | GO:0008379 | thioredoxin peroxidase activity(GO:0008379) |
| 3.8 | 22.9 | GO:0035500 | MH2 domain binding(GO:0035500) |
| 3.7 | 18.6 | GO:0015183 | L-aspartate transmembrane transporter activity(GO:0015183) |
| 3.7 | 29.7 | GO:0004485 | methylcrotonoyl-CoA carboxylase activity(GO:0004485) |
| 3.6 | 10.9 | GO:0000702 | oxidized base lesion DNA N-glycosylase activity(GO:0000702) oxidized purine nucleobase lesion DNA N-glycosylase activity(GO:0008534) |
| 3.5 | 20.7 | GO:0036033 | mediator complex binding(GO:0036033) |
| 3.4 | 20.7 | GO:0042392 | sphingosine-1-phosphate phosphatase activity(GO:0042392) |
| 3.4 | 17.2 | GO:0051998 | carboxyl-O-methyltransferase activity(GO:0010340) protein carboxyl O-methyltransferase activity(GO:0051998) |
| 3.4 | 10.2 | GO:0000033 | alpha-1,3-mannosyltransferase activity(GO:0000033) |
| 3.4 | 23.8 | GO:0001849 | complement component C1q binding(GO:0001849) |
| 3.4 | 10.1 | GO:0015218 | pyrimidine nucleotide transmembrane transporter activity(GO:0015218) |
| 3.3 | 43.5 | GO:1990825 | sequence-specific mRNA binding(GO:1990825) |
| 3.3 | 152.4 | GO:0031492 | nucleosomal DNA binding(GO:0031492) |
| 3.3 | 13.0 | GO:0008192 | RNA guanylyltransferase activity(GO:0008192) |
| 2.9 | 17.4 | GO:0019826 | oxygen sensor activity(GO:0019826) |
| 2.9 | 23.0 | GO:0071933 | Arp2/3 complex binding(GO:0071933) |
| 2.8 | 8.5 | GO:0004766 | spermidine synthase activity(GO:0004766) |
| 2.8 | 8.3 | GO:0004618 | phosphoglycerate kinase activity(GO:0004618) |
| 2.8 | 74.5 | GO:0036442 | hydrogen-exporting ATPase activity(GO:0036442) |
| 2.8 | 8.3 | GO:0071074 | eukaryotic initiation factor eIF2 binding(GO:0071074) |
| 2.6 | 84.5 | GO:0051059 | NF-kappaB binding(GO:0051059) |
| 2.6 | 13.1 | GO:1990460 | leptin receptor binding(GO:1990460) |
| 2.6 | 15.7 | GO:0015093 | ferrous iron transmembrane transporter activity(GO:0015093) |
| 2.6 | 20.7 | GO:0015288 | porin activity(GO:0015288) |
| 2.6 | 61.8 | GO:0070530 | K63-linked polyubiquitin binding(GO:0070530) |
| 2.6 | 128.8 | GO:0016831 | carboxy-lyase activity(GO:0016831) |
| 2.5 | 15.0 | GO:0022833 | mechanically-gated ion channel activity(GO:0008381) mechanically gated channel activity(GO:0022833) |
| 2.5 | 9.9 | GO:0003976 | UDP-N-acetylglucosamine-lysosomal-enzyme N-acetylglucosaminephosphotransferase activity(GO:0003976) |
| 2.5 | 19.8 | GO:0042975 | peroxisome proliferator activated receptor binding(GO:0042975) |
| 2.4 | 7.3 | GO:0003917 | DNA topoisomerase type I activity(GO:0003917) |
| 2.4 | 16.5 | GO:0071535 | RING-like zinc finger domain binding(GO:0071535) |
| 2.3 | 45.4 | GO:0042609 | CD4 receptor binding(GO:0042609) |
| 2.3 | 33.8 | GO:0003688 | DNA replication origin binding(GO:0003688) |
| 2.2 | 22.5 | GO:0000340 | RNA 7-methylguanosine cap binding(GO:0000340) |
| 2.2 | 8.9 | GO:0016532 | superoxide dismutase copper chaperone activity(GO:0016532) |
| 2.2 | 4.4 | GO:0004167 | dopachrome isomerase activity(GO:0004167) |
| 2.2 | 13.2 | GO:1990446 | U1 snRNP binding(GO:1990446) |
| 2.2 | 56.0 | GO:0005092 | GDP-dissociation inhibitor activity(GO:0005092) |
| 2.1 | 22.6 | GO:0016861 | intramolecular oxidoreductase activity, interconverting aldoses and ketoses(GO:0016861) |
| 2.0 | 12.2 | GO:0048256 | flap endonuclease activity(GO:0048256) |
| 2.0 | 28.2 | GO:0000339 | RNA cap binding(GO:0000339) |
| 2.0 | 28.0 | GO:0008097 | 5S rRNA binding(GO:0008097) |
| 1.9 | 13.6 | GO:0010997 | anaphase-promoting complex binding(GO:0010997) |
| 1.9 | 9.7 | GO:0005087 | Ran guanyl-nucleotide exchange factor activity(GO:0005087) |
| 1.9 | 11.6 | GO:0004301 | epoxide hydrolase activity(GO:0004301) |
| 1.9 | 23.2 | GO:0051434 | BH3 domain binding(GO:0051434) |
| 1.9 | 5.6 | GO:0008466 | glycogenin glucosyltransferase activity(GO:0008466) |
| 1.9 | 5.6 | GO:0004566 | beta-glucuronidase activity(GO:0004566) heparanase activity(GO:0030305) |
| 1.8 | 5.4 | GO:0004047 | aminomethyltransferase activity(GO:0004047) |
| 1.7 | 137.7 | GO:0005507 | copper ion binding(GO:0005507) |
| 1.7 | 10.4 | GO:0051032 | nucleic acid transmembrane transporter activity(GO:0051032) RNA transmembrane transporter activity(GO:0051033) |
| 1.7 | 31.1 | GO:0008353 | RNA polymerase II carboxy-terminal domain kinase activity(GO:0008353) |
| 1.7 | 107.2 | GO:0003743 | translation initiation factor activity(GO:0003743) |
| 1.7 | 8.5 | GO:0004774 | succinate-CoA ligase activity(GO:0004774) |
| 1.7 | 5.1 | GO:0052839 | inositol 5-diphosphate pentakisphosphate 5-kinase activity(GO:0052836) inositol diphosphate tetrakisphosphate kinase activity(GO:0052839) |
| 1.7 | 6.7 | GO:0043024 | ribosomal small subunit binding(GO:0043024) |
| 1.7 | 41.9 | GO:0003746 | translation elongation factor activity(GO:0003746) |
| 1.6 | 44.5 | GO:0008187 | poly-pyrimidine tract binding(GO:0008187) |
| 1.6 | 29.6 | GO:0016018 | cyclosporin A binding(GO:0016018) |
| 1.6 | 11.3 | GO:0000182 | rDNA binding(GO:0000182) |
| 1.6 | 11.3 | GO:0034513 | box H/ACA snoRNA binding(GO:0034513) |
| 1.6 | 51.2 | GO:0042288 | MHC class I protein binding(GO:0042288) |
| 1.6 | 7.8 | GO:0033906 | hyaluronoglucuronidase activity(GO:0033906) |
| 1.5 | 9.3 | GO:0036435 | K48-linked polyubiquitin binding(GO:0036435) |
| 1.5 | 14.8 | GO:0032552 | deoxyribonucleotide binding(GO:0032552) |
| 1.5 | 13.3 | GO:0097157 | pre-mRNA intronic binding(GO:0097157) |
| 1.5 | 31.0 | GO:0048156 | tau protein binding(GO:0048156) |
| 1.5 | 29.4 | GO:0008349 | MAP kinase kinase kinase kinase activity(GO:0008349) |
| 1.5 | 16.1 | GO:0055131 | C3HC4-type RING finger domain binding(GO:0055131) |
| 1.5 | 4.4 | GO:0004056 | argininosuccinate lyase activity(GO:0004056) |
| 1.5 | 4.4 | GO:0004597 | peptide-aspartate beta-dioxygenase activity(GO:0004597) |
| 1.5 | 21.9 | GO:0005149 | interleukin-1 receptor binding(GO:0005149) |
| 1.4 | 20.0 | GO:0019534 | toxin transporter activity(GO:0019534) |
| 1.4 | 11.4 | GO:0016423 | tRNA (guanine) methyltransferase activity(GO:0016423) |
| 1.4 | 9.9 | GO:0051575 | 5'-deoxyribose-5-phosphate lyase activity(GO:0051575) |
| 1.4 | 42.1 | GO:0034237 | protein kinase A regulatory subunit binding(GO:0034237) |
| 1.4 | 19.5 | GO:0003680 | AT DNA binding(GO:0003680) |
| 1.4 | 8.1 | GO:0005047 | signal recognition particle binding(GO:0005047) |
| 1.3 | 44.1 | GO:0000175 | 3'-5'-exoribonuclease activity(GO:0000175) |
| 1.3 | 13.2 | GO:1990247 | N6-methyladenosine-containing RNA binding(GO:1990247) |
| 1.3 | 9.3 | GO:0033170 | DNA clamp loader activity(GO:0003689) protein-DNA loading ATPase activity(GO:0033170) |
| 1.3 | 10.5 | GO:0004634 | phosphopyruvate hydratase activity(GO:0004634) |
| 1.3 | 28.5 | GO:0016799 | hydrolase activity, hydrolyzing N-glycosyl compounds(GO:0016799) |
| 1.3 | 29.8 | GO:0031491 | nucleosome binding(GO:0031491) |
| 1.3 | 6.5 | GO:0004392 | heme oxygenase (decyclizing) activity(GO:0004392) |
| 1.3 | 43.6 | GO:0004003 | ATP-dependent DNA helicase activity(GO:0004003) |
| 1.3 | 58.5 | GO:0048487 | beta-tubulin binding(GO:0048487) |
| 1.3 | 2.5 | GO:0004530 | deoxyribonuclease I activity(GO:0004530) |
| 1.3 | 25.2 | GO:0016881 | acid-amino acid ligase activity(GO:0016881) |
| 1.3 | 35.1 | GO:0080025 | phosphatidylinositol-3,5-bisphosphate binding(GO:0080025) |
| 1.2 | 7.4 | GO:0004749 | ribose phosphate diphosphokinase activity(GO:0004749) |
| 1.2 | 11.1 | GO:0015279 | store-operated calcium channel activity(GO:0015279) |
| 1.2 | 6.1 | GO:0008240 | tripeptidyl-peptidase activity(GO:0008240) |
| 1.2 | 21.5 | GO:0097016 | L27 domain binding(GO:0097016) |
| 1.1 | 51.6 | GO:0004864 | protein phosphatase inhibitor activity(GO:0004864) |
| 1.1 | 4.5 | GO:0004348 | glucosylceramidase activity(GO:0004348) |
| 1.1 | 17.7 | GO:0001054 | RNA polymerase I activity(GO:0001054) |
| 1.1 | 12.1 | GO:0001094 | TFIID-class transcription factor binding(GO:0001094) |
| 1.1 | 14.9 | GO:0016290 | palmitoyl-CoA hydrolase activity(GO:0016290) |
| 1.1 | 6.4 | GO:0003998 | acylphosphatase activity(GO:0003998) |
| 1.1 | 25.3 | GO:0005095 | GTPase inhibitor activity(GO:0005095) |
| 1.1 | 2.1 | GO:0000403 | Y-form DNA binding(GO:0000403) |
| 1.0 | 8.4 | GO:0008269 | JAK pathway signal transduction adaptor activity(GO:0008269) |
| 1.0 | 7.3 | GO:0004169 | dolichyl-phosphate-mannose-protein mannosyltransferase activity(GO:0004169) |
| 1.0 | 20.6 | GO:0003924 | GTPase activity(GO:0003924) |
| 1.0 | 4.1 | GO:0004647 | phosphoserine phosphatase activity(GO:0004647) |
| 1.0 | 18.0 | GO:0009931 | calcium-dependent protein serine/threonine kinase activity(GO:0009931) calcium-dependent protein kinase activity(GO:0010857) |
| 1.0 | 19.4 | GO:0008510 | sodium:bicarbonate symporter activity(GO:0008510) |
| 1.0 | 3.9 | GO:0000309 | nicotinamide-nucleotide adenylyltransferase activity(GO:0000309) |
| 1.0 | 198.2 | GO:0003735 | structural constituent of ribosome(GO:0003735) |
| 1.0 | 44.8 | GO:0061650 | ubiquitin conjugating enzyme activity(GO:0061631) ubiquitin-like protein conjugating enzyme activity(GO:0061650) |
| 0.9 | 33.4 | GO:0000983 | transcription factor activity, RNA polymerase II core promoter sequence-specific(GO:0000983) |
| 0.9 | 3.7 | GO:0031826 | type 2A serotonin receptor binding(GO:0031826) |
| 0.9 | 18.1 | GO:0004697 | protein kinase C activity(GO:0004697) |
| 0.9 | 17.0 | GO:0017049 | GTP-Rho binding(GO:0017049) |
| 0.9 | 8.1 | GO:0032051 | clathrin light chain binding(GO:0032051) |
| 0.9 | 28.2 | GO:0004602 | glutathione peroxidase activity(GO:0004602) |
| 0.9 | 20.5 | GO:0003756 | protein disulfide isomerase activity(GO:0003756) intramolecular oxidoreductase activity, transposing S-S bonds(GO:0016864) |
| 0.8 | 7.6 | GO:0036402 | proteasome-activating ATPase activity(GO:0036402) |
| 0.8 | 7.6 | GO:0004396 | glucokinase activity(GO:0004340) hexokinase activity(GO:0004396) fructokinase activity(GO:0008865) mannokinase activity(GO:0019158) |
| 0.8 | 19.8 | GO:0070003 | threonine-type endopeptidase activity(GO:0004298) threonine-type peptidase activity(GO:0070003) |
| 0.8 | 4.9 | GO:0002161 | aminoacyl-tRNA editing activity(GO:0002161) |
| 0.8 | 8.9 | GO:0008195 | phosphatidate phosphatase activity(GO:0008195) |
| 0.8 | 11.1 | GO:0022820 | potassium:chloride symporter activity(GO:0015379) potassium ion symporter activity(GO:0022820) |
| 0.7 | 14.9 | GO:0005385 | zinc ion transmembrane transporter activity(GO:0005385) |
| 0.7 | 13.1 | GO:0043274 | phospholipase binding(GO:0043274) |
| 0.7 | 3.6 | GO:0034714 | type III transforming growth factor beta receptor binding(GO:0034714) |
| 0.7 | 11.2 | GO:0008536 | Ran GTPase binding(GO:0008536) |
| 0.7 | 3.4 | GO:0033857 | diphosphoinositol-pentakisphosphate kinase activity(GO:0033857) |
| 0.7 | 5.4 | GO:0016274 | arginine N-methyltransferase activity(GO:0016273) protein-arginine N-methyltransferase activity(GO:0016274) |
| 0.7 | 4.7 | GO:0015186 | L-glutamine transmembrane transporter activity(GO:0015186) |
| 0.7 | 4.6 | GO:0061133 | endopeptidase activator activity(GO:0061133) |
| 0.7 | 5.9 | GO:0089720 | caspase binding(GO:0089720) |
| 0.7 | 62.0 | GO:0003725 | double-stranded RNA binding(GO:0003725) |
| 0.6 | 16.2 | GO:0051010 | microtubule plus-end binding(GO:0051010) |
| 0.6 | 3.9 | GO:0008479 | queuine tRNA-ribosyltransferase activity(GO:0008479) |
| 0.6 | 16.5 | GO:0070064 | proline-rich region binding(GO:0070064) |
| 0.6 | 2.5 | GO:0019770 | IgG receptor activity(GO:0019770) |
| 0.6 | 6.1 | GO:0070883 | pre-miRNA binding(GO:0070883) |
| 0.6 | 77.0 | GO:0008565 | protein transporter activity(GO:0008565) |
| 0.6 | 6.5 | GO:0035613 | RNA stem-loop binding(GO:0035613) |
| 0.6 | 4.7 | GO:0070699 | type II activin receptor binding(GO:0070699) |
| 0.6 | 12.7 | GO:0070061 | fructose binding(GO:0070061) |
| 0.6 | 2.3 | GO:0008823 | cupric reductase activity(GO:0008823) ferric-chelate reductase (NADPH) activity(GO:0052851) |
| 0.6 | 37.2 | GO:0003684 | damaged DNA binding(GO:0003684) |
| 0.5 | 51.8 | GO:0032947 | protein complex scaffold(GO:0032947) |
| 0.5 | 6.3 | GO:0004526 | ribonuclease P activity(GO:0004526) |
| 0.5 | 14.2 | GO:0005388 | calcium-transporting ATPase activity(GO:0005388) |
| 0.5 | 6.1 | GO:0019911 | structural constituent of myelin sheath(GO:0019911) |
| 0.5 | 3.0 | GO:0004046 | aminoacylase activity(GO:0004046) |
| 0.5 | 11.3 | GO:0051371 | muscle alpha-actinin binding(GO:0051371) |
| 0.5 | 2.4 | GO:0050220 | prostaglandin-E synthase activity(GO:0050220) |
| 0.5 | 3.8 | GO:0070878 | transforming growth factor beta receptor, pathway-specific cytoplasmic mediator activity(GO:0030618) primary miRNA binding(GO:0070878) |
| 0.5 | 11.5 | GO:0017056 | structural constituent of nuclear pore(GO:0017056) |
| 0.5 | 4.7 | GO:0070569 | uridylyltransferase activity(GO:0070569) |
| 0.5 | 7.0 | GO:0034185 | apolipoprotein binding(GO:0034185) |
| 0.5 | 35.4 | GO:0019003 | GDP binding(GO:0019003) |
| 0.5 | 3.3 | GO:0099602 | acetylcholine receptor regulator activity(GO:0030548) neurotransmitter receptor regulator activity(GO:0099602) |
| 0.5 | 6.5 | GO:0003857 | 3-hydroxyacyl-CoA dehydrogenase activity(GO:0003857) |
| 0.5 | 7.8 | GO:0005068 | transmembrane receptor protein tyrosine kinase adaptor activity(GO:0005068) |
| 0.5 | 2.3 | GO:0004095 | carnitine O-palmitoyltransferase activity(GO:0004095) |
| 0.4 | 9.0 | GO:0030515 | snoRNA binding(GO:0030515) |
| 0.4 | 17.7 | GO:0004521 | endoribonuclease activity(GO:0004521) |
| 0.4 | 4.6 | GO:0031995 | insulin-like growth factor II binding(GO:0031995) |
| 0.4 | 1.2 | GO:0031208 | POZ domain binding(GO:0031208) |
| 0.4 | 2.8 | GO:0016618 | hydroxypyruvate reductase activity(GO:0016618) glyoxylate reductase (NADP) activity(GO:0030267) |
| 0.4 | 3.1 | GO:0052650 | NADP-retinol dehydrogenase activity(GO:0052650) |
| 0.4 | 5.3 | GO:0048027 | mRNA 5'-UTR binding(GO:0048027) |
| 0.4 | 5.7 | GO:0008517 | folic acid transporter activity(GO:0008517) |
| 0.4 | 5.6 | GO:0048406 | nerve growth factor binding(GO:0048406) |
| 0.3 | 9.3 | GO:0042605 | peptide antigen binding(GO:0042605) |
| 0.3 | 9.1 | GO:0070577 | lysine-acetylated histone binding(GO:0070577) |
| 0.3 | 7.0 | GO:0003887 | DNA-directed DNA polymerase activity(GO:0003887) |
| 0.3 | 3.3 | GO:0015643 | toxic substance binding(GO:0015643) |
| 0.3 | 14.7 | GO:0005484 | SNAP receptor activity(GO:0005484) |
| 0.3 | 23.6 | GO:0004869 | cysteine-type endopeptidase inhibitor activity(GO:0004869) |
| 0.3 | 4.8 | GO:0004985 | opioid receptor activity(GO:0004985) |
| 0.3 | 18.2 | GO:0016763 | transferase activity, transferring pentosyl groups(GO:0016763) |
| 0.3 | 2.5 | GO:0005250 | A-type (transient outward) potassium channel activity(GO:0005250) |
| 0.3 | 17.8 | GO:0019213 | deacetylase activity(GO:0019213) |
| 0.3 | 0.9 | GO:0015140 | malate transmembrane transporter activity(GO:0015140) |
| 0.3 | 11.5 | GO:0005184 | neuropeptide hormone activity(GO:0005184) |
| 0.3 | 4.5 | GO:0032266 | phosphatidylinositol-3-phosphate binding(GO:0032266) |
| 0.3 | 25.9 | GO:0043130 | ubiquitin binding(GO:0043130) |
| 0.3 | 1.1 | GO:0033829 | O-fucosylpeptide 3-beta-N-acetylglucosaminyltransferase activity(GO:0033829) |
| 0.3 | 2.9 | GO:0003993 | acid phosphatase activity(GO:0003993) |
| 0.3 | 2.5 | GO:0046974 | histone methyltransferase activity (H3-K9 specific)(GO:0046974) |
| 0.3 | 2.3 | GO:0031730 | CCR5 chemokine receptor binding(GO:0031730) |
| 0.3 | 12.5 | GO:0030145 | manganese ion binding(GO:0030145) |
| 0.3 | 58.1 | GO:0051015 | actin filament binding(GO:0051015) |
| 0.3 | 0.8 | GO:0046577 | long-chain-alcohol oxidase activity(GO:0046577) |
| 0.3 | 5.6 | GO:0001965 | G-protein alpha-subunit binding(GO:0001965) |
| 0.3 | 5.1 | GO:0045028 | G-protein coupled nucleotide receptor activity(GO:0001608) G-protein coupled purinergic nucleotide receptor activity(GO:0045028) |
| 0.3 | 27.0 | GO:0001618 | virus receptor activity(GO:0001618) |
| 0.3 | 2.1 | GO:0004571 | mannosyl-oligosaccharide 1,2-alpha-mannosidase activity(GO:0004571) mannosyl-oligosaccharide mannosidase activity(GO:0015924) |
| 0.3 | 2.8 | GO:0032453 | histone demethylase activity (H3-K4 specific)(GO:0032453) |
| 0.2 | 16.5 | GO:0016655 | oxidoreductase activity, acting on NAD(P)H, quinone or similar compound as acceptor(GO:0016655) |
| 0.2 | 35.2 | GO:0005178 | integrin binding(GO:0005178) |
| 0.2 | 7.2 | GO:0046965 | retinoid X receptor binding(GO:0046965) |
| 0.2 | 15.9 | GO:0048306 | calcium-dependent protein binding(GO:0048306) |
| 0.2 | 6.6 | GO:0051879 | Hsp90 protein binding(GO:0051879) |
| 0.2 | 3.7 | GO:0001968 | fibronectin binding(GO:0001968) |
| 0.2 | 2.6 | GO:0043022 | ribosome binding(GO:0043022) |
| 0.2 | 5.6 | GO:0031624 | ubiquitin conjugating enzyme binding(GO:0031624) |
| 0.2 | 11.9 | GO:0016651 | oxidoreductase activity, acting on NAD(P)H(GO:0016651) |
| 0.2 | 5.1 | GO:0003785 | actin monomer binding(GO:0003785) |
| 0.2 | 7.5 | GO:0008009 | chemokine activity(GO:0008009) |
| 0.2 | 1.7 | GO:0016286 | small conductance calcium-activated potassium channel activity(GO:0016286) |
| 0.2 | 1.6 | GO:0070566 | adenylyltransferase activity(GO:0070566) |
| 0.2 | 1.5 | GO:0004931 | extracellular ATP-gated cation channel activity(GO:0004931) ATP-gated ion channel activity(GO:0035381) |
| 0.2 | 3.7 | GO:0017134 | fibroblast growth factor binding(GO:0017134) |
| 0.2 | 0.6 | GO:0004925 | prolactin receptor activity(GO:0004925) |
| 0.2 | 0.5 | GO:0016295 | [acyl-carrier-protein] S-malonyltransferase activity(GO:0004314) 3-oxoacyl-[acyl-carrier-protein] synthase activity(GO:0004315) oleoyl-[acyl-carrier-protein] hydrolase activity(GO:0004320) myristoyl-[acyl-carrier-protein] hydrolase activity(GO:0016295) palmitoyl-[acyl-carrier-protein] hydrolase activity(GO:0016296) acyl-[acyl-carrier-protein] hydrolase activity(GO:0016297) S-malonyltransferase activity(GO:0016419) malonyltransferase activity(GO:0016420) phosphopantetheine binding(GO:0031177) |
| 0.2 | 1.1 | GO:0008190 | eukaryotic initiation factor 4E binding(GO:0008190) |
| 0.2 | 0.9 | GO:0004594 | pantothenate kinase activity(GO:0004594) |
| 0.1 | 0.4 | GO:0004461 | lactose synthase activity(GO:0004461) |
| 0.1 | 1.1 | GO:0005172 | vascular endothelial growth factor receptor binding(GO:0005172) |
| 0.1 | 32.5 | GO:0001227 | transcriptional repressor activity, RNA polymerase II transcription regulatory region sequence-specific binding(GO:0001227) |
| 0.1 | 4.8 | GO:0016811 | hydrolase activity, acting on carbon-nitrogen (but not peptide) bonds, in linear amides(GO:0016811) |
| 0.1 | 4.1 | GO:0005154 | epidermal growth factor receptor binding(GO:0005154) |
| 0.1 | 0.9 | GO:0098821 | BMP receptor activity(GO:0098821) |
| 0.1 | 1.5 | GO:0031419 | cobalamin binding(GO:0031419) |
| 0.1 | 16.4 | GO:0003714 | transcription corepressor activity(GO:0003714) |
| 0.1 | 1.5 | GO:0070182 | DNA polymerase binding(GO:0070182) |
| 0.1 | 0.4 | GO:0008853 | exodeoxyribonuclease III activity(GO:0008853) |
| 0.1 | 10.3 | GO:0003705 | transcription factor activity, RNA polymerase II distal enhancer sequence-specific binding(GO:0003705) |
| 0.1 | 0.6 | GO:0035374 | chondroitin sulfate binding(GO:0035374) |
| 0.1 | 0.9 | GO:0017034 | Rap guanyl-nucleotide exchange factor activity(GO:0017034) |
| 0.1 | 2.1 | GO:0001972 | retinoic acid binding(GO:0001972) |
| 0.1 | 4.1 | GO:0042826 | histone deacetylase binding(GO:0042826) |
| 0.1 | 77.8 | GO:0003723 | RNA binding(GO:0003723) |
| 0.1 | 6.6 | GO:0017124 | SH3 domain binding(GO:0017124) |
| 0.0 | 0.3 | GO:0010484 | H3 histone acetyltransferase activity(GO:0010484) |
| 0.0 | 10.1 | GO:0030246 | carbohydrate binding(GO:0030246) |
| 0.0 | 0.2 | GO:0004692 | cGMP-dependent protein kinase activity(GO:0004692) |
| 0.0 | 2.2 | GO:0005179 | hormone activity(GO:0005179) |
| 0.0 | 6.9 | GO:0005525 | GTP binding(GO:0005525) |
| 0.0 | 0.9 | GO:0004715 | non-membrane spanning protein tyrosine kinase activity(GO:0004715) |
| 0.0 | 0.7 | GO:0016776 | phosphotransferase activity, phosphate group as acceptor(GO:0016776) |
Gene overrepresentation in curated gene sets: canonical pathways category:
| Log-likelihood per target | Total log-likelihood | Term | Description |
|---|---|---|---|
| 20.9 | 417.4 | SA REG CASCADE OF CYCLIN EXPR | Expression of cyclins regulates progression through the cell cycle by activating cyclin-dependent kinases. |
| 3.0 | 425.8 | PID MYC ACTIV PATHWAY | Validated targets of C-MYC transcriptional activation |
| 2.9 | 147.3 | PID HIF2PATHWAY | HIF-2-alpha transcription factor network |
| 2.1 | 40.5 | PID P38 GAMMA DELTA PATHWAY | Signaling mediated by p38-gamma and p38-delta |
| 1.9 | 98.5 | PID FOXM1 PATHWAY | FOXM1 transcription factor network |
| 1.6 | 83.8 | PID ATR PATHWAY | ATR signaling pathway |
| 1.4 | 114.6 | PID HEDGEHOG GLI PATHWAY | Hedgehog signaling events mediated by Gli proteins |
| 1.3 | 9.4 | SA G2 AND M PHASES | Cdc25 activates the cdc2/cyclin B complex to induce the G2/M transition. |
| 1.2 | 55.5 | PID NFKAPPAB CANONICAL PATHWAY | Canonical NF-kappaB pathway |
| 1.2 | 99.8 | PID RAC1 PATHWAY | RAC1 signaling pathway |
| 1.1 | 86.7 | PID ILK PATHWAY | Integrin-linked kinase signaling |
| 1.1 | 7.4 | PID TCR RAS PATHWAY | Ras signaling in the CD4+ TCR pathway |
| 0.7 | 33.6 | ST ERK1 ERK2 MAPK PATHWAY | ERK1/ERK2 MAPK Pathway |
| 0.7 | 51.2 | PID E2F PATHWAY | E2F transcription factor network |
| 0.6 | 19.7 | PID ATM PATHWAY | ATM pathway |
| 0.6 | 43.0 | PID RB 1PATHWAY | Regulation of retinoblastoma protein |
| 0.6 | 9.9 | PID DNA PK PATHWAY | DNA-PK pathway in nonhomologous end joining |
| 0.5 | 24.1 | PID IL2 PI3K PATHWAY | IL2 signaling events mediated by PI3K |
| 0.5 | 18.8 | PID NCADHERIN PATHWAY | N-cadherin signaling events |
| 0.5 | 35.9 | PID HIF1 TFPATHWAY | HIF-1-alpha transcription factor network |
| 0.4 | 7.5 | PID HDAC CLASSII PATHWAY | Signaling events mediated by HDAC Class II |
| 0.4 | 35.3 | PID PTP1B PATHWAY | Signaling events mediated by PTP1B |
| 0.4 | 8.4 | PID IL2 1PATHWAY | IL2-mediated signaling events |
| 0.4 | 17.2 | PID ECADHERIN NASCENT AJ PATHWAY | E-cadherin signaling in the nascent adherens junction |
| 0.4 | 8.3 | PID VEGFR1 PATHWAY | VEGFR1 specific signals |
| 0.4 | 9.0 | PID SYNDECAN 3 PATHWAY | Syndecan-3-mediated signaling events |
| 0.4 | 1.1 | PID VEGF VEGFR PATHWAY | VEGF and VEGFR signaling network |
| 0.3 | 91.7 | NABA ECM REGULATORS | Genes encoding enzymes and their regulators involved in the remodeling of the extracellular matrix |
| 0.3 | 47.9 | PID P53 DOWNSTREAM PATHWAY | Direct p53 effectors |
| 0.3 | 29.4 | ST FAS SIGNALING PATHWAY | Fas Signaling Pathway |
| 0.3 | 24.7 | PID TGFBR PATHWAY | TGF-beta receptor signaling |
| 0.3 | 8.1 | PID FAS PATHWAY | FAS (CD95) signaling pathway |
| 0.3 | 12.8 | PID INTEGRIN2 PATHWAY | Beta2 integrin cell surface interactions |
| 0.3 | 17.0 | PID VEGFR1 2 PATHWAY | Signaling events mediated by VEGFR1 and VEGFR2 |
| 0.3 | 20.4 | PID CASPASE PATHWAY | Caspase cascade in apoptosis |
| 0.3 | 6.1 | PID P38 MK2 PATHWAY | p38 signaling mediated by MAPKAP kinases |
| 0.2 | 15.2 | PID HDAC CLASSI PATHWAY | Signaling events mediated by HDAC Class I |
| 0.2 | 12.0 | PID AP1 PATHWAY | AP-1 transcription factor network |
| 0.2 | 12.7 | PID P73PATHWAY | p73 transcription factor network |
| 0.2 | 4.7 | PID ALK1 PATHWAY | ALK1 signaling events |
| 0.2 | 6.4 | PID IL8 CXCR2 PATHWAY | IL8- and CXCR2-mediated signaling events |
| 0.2 | 3.5 | PID ARF 3PATHWAY | Arf1 pathway |
| 0.2 | 14.1 | PID CMYB PATHWAY | C-MYB transcription factor network |
| 0.2 | 7.1 | PID IL4 2PATHWAY | IL4-mediated signaling events |
| 0.2 | 4.5 | SA MMP CYTOKINE CONNECTION | Cytokines can induce activation of matrix metalloproteinases, which degrade extracellular matrix. |
| 0.2 | 2.2 | PID HEDGEHOG 2PATHWAY | Signaling events mediated by the Hedgehog family |
| 0.1 | 4.4 | SIG REGULATION OF THE ACTIN CYTOSKELETON BY RHO GTPASES | Genes related to regulation of the actin cytoskeleton |
| 0.1 | 3.1 | PID TAP63 PATHWAY | Validated transcriptional targets of TAp63 isoforms |
| 0.1 | 1.9 | PID INSULIN PATHWAY | Insulin Pathway |
| 0.1 | 1.3 | PID THROMBIN PAR1 PATHWAY | PAR1-mediated thrombin signaling events |
| 0.1 | 2.5 | PID AR TF PATHWAY | Regulation of Androgen receptor activity |
| 0.1 | 1.2 | PID ATF2 PATHWAY | ATF-2 transcription factor network |
| 0.1 | 1.0 | PID AMB2 NEUTROPHILS PATHWAY | amb2 Integrin signaling |
| 0.1 | 1.3 | PID P53 REGULATION PATHWAY | p53 pathway |
| 0.0 | 0.3 | ST TYPE I INTERFERON PATHWAY | Type I Interferon (alpha/beta IFN) Pathway |
| 0.0 | 1.1 | PID HNF3B PATHWAY | FOXA2 and FOXA3 transcription factor networks |
| 0.0 | 0.2 | PID P38 ALPHA BETA PATHWAY | Regulation of p38-alpha and p38-beta |
| 0.0 | 1.3 | PID RHOA REG PATHWAY | Regulation of RhoA activity |
| 0.0 | 0.3 | PID RHOA PATHWAY | RhoA signaling pathway |
| 0.0 | 0.5 | PID FGF PATHWAY | FGF signaling pathway |
Gene overrepresentation in curated gene sets: REACTOME pathways category:
| Log-likelihood per target | Total log-likelihood | Term | Description |
|---|---|---|---|
| 11.5 | 415.5 | REACTOME MEIOTIC RECOMBINATION | Genes involved in Meiotic Recombination |
| 6.9 | 137.3 | REACTOME METABOLISM OF POLYAMINES | Genes involved in Metabolism of polyamines |
| 6.9 | 137.0 | REACTOME BASE FREE SUGAR PHOSPHATE REMOVAL VIA THE SINGLE NUCLEOTIDE REPLACEMENT PATHWAY | Genes involved in Base-free sugar-phosphate removal via the single-nucleotide replacement pathway |
| 6.7 | 100.0 | REACTOME UNWINDING OF DNA | Genes involved in Unwinding of DNA |
| 6.5 | 97.2 | REACTOME PURINE RIBONUCLEOSIDE MONOPHOSPHATE BIOSYNTHESIS | Genes involved in Purine ribonucleoside monophosphate biosynthesis |
| 4.8 | 109.6 | REACTOME SYNTHESIS OF GLYCOSYLPHOSPHATIDYLINOSITOL GPI | Genes involved in Synthesis of glycosylphosphatidylinositol (GPI) |
| 3.8 | 34.1 | REACTOME RESOLUTION OF AP SITES VIA THE MULTIPLE NUCLEOTIDE PATCH REPLACEMENT PATHWAY | Genes involved in Resolution of AP sites via the multiple-nucleotide patch replacement pathway |
| 3.2 | 74.2 | REACTOME DEPOSITION OF NEW CENPA CONTAINING NUCLEOSOMES AT THE CENTROMERE | Genes involved in Deposition of New CENPA-containing Nucleosomes at the Centromere |
| 3.0 | 71.7 | REACTOME PURINE SALVAGE | Genes involved in Purine salvage |
| 2.7 | 74.5 | REACTOME INSULIN RECEPTOR RECYCLING | Genes involved in Insulin receptor recycling |
| 2.5 | 83.0 | REACTOME SYNTHESIS AND INTERCONVERSION OF NUCLEOTIDE DI AND TRIPHOSPHATES | Genes involved in Synthesis and interconversion of nucleotide di- and triphosphates |
| 2.5 | 37.3 | REACTOME CALNEXIN CALRETICULIN CYCLE | Genes involved in Calnexin/calreticulin cycle |
| 2.5 | 24.6 | REACTOME KERATAN SULFATE DEGRADATION | Genes involved in Keratan sulfate degradation |
| 2.2 | 129.4 | REACTOME MITOCHONDRIAL PROTEIN IMPORT | Genes involved in Mitochondrial Protein Import |
| 2.2 | 416.9 | REACTOME 3 UTR MEDIATED TRANSLATIONAL REGULATION | Genes involved in 3' -UTR-mediated translational regulation |
| 2.1 | 110.5 | REACTOME GLYCOSPHINGOLIPID METABOLISM | Genes involved in Glycosphingolipid metabolism |
| 2.1 | 12.5 | REACTOME BINDING AND ENTRY OF HIV VIRION | Genes involved in Binding and entry of HIV virion |
| 2.1 | 33.2 | REACTOME VITAMIN B5 PANTOTHENATE METABOLISM | Genes involved in Vitamin B5 (pantothenate) metabolism |
| 2.0 | 163.4 | REACTOME GOLGI ASSOCIATED VESICLE BIOGENESIS | Genes involved in Golgi Associated Vesicle Biogenesis |
| 2.0 | 28.2 | REACTOME PURINE CATABOLISM | Genes involved in Purine catabolism |
| 1.8 | 21.3 | REACTOME MRNA DECAY BY 3 TO 5 EXORIBONUCLEASE | Genes involved in mRNA Decay by 3' to 5' Exoribonuclease |
| 1.5 | 9.3 | REACTOME REPAIR SYNTHESIS FOR GAP FILLING BY DNA POL IN TC NER | Genes involved in Repair synthesis for gap-filling by DNA polymerase in TC-NER |
| 1.4 | 21.4 | REACTOME SLBP DEPENDENT PROCESSING OF REPLICATION DEPENDENT HISTONE PRE MRNAS | Genes involved in SLBP Dependent Processing of Replication-Dependent Histone Pre-mRNAs |
| 1.3 | 46.9 | REACTOME SIGNALING BY NODAL | Genes involved in Signaling by NODAL |
| 1.3 | 22.6 | REACTOME GLUCOSE TRANSPORT | Genes involved in Glucose transport |
| 1.3 | 204.6 | REACTOME MRNA SPLICING | Genes involved in mRNA Splicing |
| 1.3 | 22.4 | REACTOME FORMATION OF THE HIV1 EARLY ELONGATION COMPLEX | Genes involved in Formation of the HIV-1 Early Elongation Complex |
| 1.3 | 30.9 | REACTOME G BETA GAMMA SIGNALLING THROUGH PLC BETA | Genes involved in G beta:gamma signalling through PLC beta |
| 1.2 | 3.7 | REACTOME VIF MEDIATED DEGRADATION OF APOBEC3G | Genes involved in Vif-mediated degradation of APOBEC3G |
| 1.2 | 22.6 | REACTOME SIGNALING BY CONSTITUTIVELY ACTIVE EGFR | Genes involved in Signaling by constitutively active EGFR |
| 1.2 | 121.3 | REACTOME MITOTIC PROMETAPHASE | Genes involved in Mitotic Prometaphase |
| 1.1 | 12.3 | REACTOME DESTABILIZATION OF MRNA BY KSRP | Genes involved in Destabilization of mRNA by KSRP |
| 1.1 | 12.7 | REACTOME REGULATORY RNA PATHWAYS | Genes involved in Regulatory RNA pathways |
| 1.1 | 66.6 | REACTOME TRANSLATION | Genes involved in Translation |
| 1.0 | 39.8 | REACTOME MRNA PROCESSING | Genes involved in mRNA Processing |
| 1.0 | 37.5 | REACTOME SIGNALING BY FGFR1 FUSION MUTANTS | Genes involved in Signaling by FGFR1 fusion mutants |
| 1.0 | 52.1 | REACTOME NEGATIVE REGULATORS OF RIG I MDA5 SIGNALING | Genes involved in Negative regulators of RIG-I/MDA5 signaling |
| 0.9 | 28.3 | REACTOME METABOLISM OF PORPHYRINS | Genes involved in Metabolism of porphyrins |
| 0.9 | 6.6 | REACTOME TRAF3 DEPENDENT IRF ACTIVATION PATHWAY | Genes involved in TRAF3-dependent IRF activation pathway |
| 0.9 | 24.2 | REACTOME ACTIVATED TAK1 MEDIATES P38 MAPK ACTIVATION | Genes involved in activated TAK1 mediates p38 MAPK activation |
| 0.9 | 29.8 | REACTOME CYCLIN E ASSOCIATED EVENTS DURING G1 S TRANSITION | Genes involved in Cyclin E associated events during G1/S transition |
| 0.9 | 28.7 | REACTOME CELL EXTRACELLULAR MATRIX INTERACTIONS | Genes involved in Cell-extracellular matrix interactions |
| 0.9 | 6.0 | REACTOME MEMBRANE BINDING AND TARGETTING OF GAG PROTEINS | Genes involved in Membrane binding and targetting of GAG proteins |
| 0.8 | 14.9 | REACTOME ZINC TRANSPORTERS | Genes involved in Zinc transporters |
| 0.8 | 4.9 | REACTOME INFLUENZA VIRAL RNA TRANSCRIPTION AND REPLICATION | Genes involved in Influenza Viral RNA Transcription and Replication |
| 0.7 | 5.0 | REACTOME RECEPTOR LIGAND BINDING INITIATES THE SECOND PROTEOLYTIC CLEAVAGE OF NOTCH RECEPTOR | Genes involved in Receptor-ligand binding initiates the second proteolytic cleavage of Notch receptor |
| 0.7 | 24.9 | REACTOME YAP1 AND WWTR1 TAZ STIMULATED GENE EXPRESSION | Genes involved in YAP1- and WWTR1 (TAZ)-stimulated gene expression |
| 0.7 | 5.7 | REACTOME ACTIVATED NOTCH1 TRANSMITS SIGNAL TO THE NUCLEUS | Genes involved in Activated NOTCH1 Transmits Signal to the Nucleus |
| 0.7 | 5.6 | REACTOME ALPHA LINOLENIC ACID ALA METABOLISM | Genes involved in alpha-linolenic acid (ALA) metabolism |
| 0.7 | 60.0 | REACTOME APC C CDC20 MEDIATED DEGRADATION OF MITOTIC PROTEINS | Genes involved in APC/C:Cdc20 mediated degradation of mitotic proteins |
| 0.7 | 6.1 | REACTOME COPI MEDIATED TRANSPORT | Genes involved in COPI Mediated Transport |
| 0.7 | 30.2 | REACTOME HOST INTERACTIONS OF HIV FACTORS | Genes involved in Host Interactions of HIV factors |
| 0.7 | 16.0 | REACTOME SULFUR AMINO ACID METABOLISM | Genes involved in Sulfur amino acid metabolism |
| 0.6 | 2.5 | REACTOME RNA POL I TRANSCRIPTION INITIATION | Genes involved in RNA Polymerase I Transcription Initiation |
| 0.6 | 5.5 | REACTOME PYRIMIDINE CATABOLISM | Genes involved in Pyrimidine catabolism |
| 0.6 | 21.5 | REACTOME ACTIVATION OF KAINATE RECEPTORS UPON GLUTAMATE BINDING | Genes involved in Activation of Kainate Receptors upon glutamate binding |
| 0.6 | 4.8 | REACTOME FORMATION OF RNA POL II ELONGATION COMPLEX | Genes involved in Formation of RNA Pol II elongation complex |
| 0.6 | 14.0 | REACTOME INTRINSIC PATHWAY | Genes involved in Intrinsic Pathway |
| 0.6 | 9.9 | REACTOME EARLY PHASE OF HIV LIFE CYCLE | Genes involved in Early Phase of HIV Life Cycle |
| 0.6 | 5.6 | REACTOME G ALPHA Z SIGNALLING EVENTS | Genes involved in G alpha (z) signalling events |
| 0.6 | 8.9 | REACTOME SYNTHESIS OF PE | Genes involved in Synthesis of PE |
| 0.5 | 8.7 | REACTOME ENDOSOMAL SORTING COMPLEX REQUIRED FOR TRANSPORT ESCRT | Genes involved in Endosomal Sorting Complex Required For Transport (ESCRT) |
| 0.5 | 4.8 | REACTOME CYTOSOLIC TRNA AMINOACYLATION | Genes involved in Cytosolic tRNA aminoacylation |
| 0.5 | 15.4 | REACTOME SMAD2 SMAD3 SMAD4 HETEROTRIMER REGULATES TRANSCRIPTION | Genes involved in SMAD2/SMAD3:SMAD4 heterotrimer regulates transcription |
| 0.5 | 7.3 | REACTOME OXYGEN DEPENDENT PROLINE HYDROXYLATION OF HYPOXIA INDUCIBLE FACTOR ALPHA | Genes involved in Oxygen-dependent Proline Hydroxylation of Hypoxia-inducible Factor Alpha |
| 0.5 | 22.8 | REACTOME INTRINSIC PATHWAY FOR APOPTOSIS | Genes involved in Intrinsic Pathway for Apoptosis |
| 0.4 | 5.8 | REACTOME METABOLISM OF NON CODING RNA | Genes involved in Metabolism of non-coding RNA |
| 0.4 | 9.1 | REACTOME CITRIC ACID CYCLE TCA CYCLE | Genes involved in Citric acid cycle (TCA cycle) |
| 0.4 | 6.7 | REACTOME FORMATION OF INCISION COMPLEX IN GG NER | Genes involved in Formation of incision complex in GG-NER |
| 0.4 | 8.3 | REACTOME ACTIVATION OF RAC | Genes involved in Activation of Rac |
| 0.4 | 4.7 | REACTOME GLYCOPROTEIN HORMONES | Genes involved in Glycoprotein hormones |
| 0.4 | 39.1 | REACTOME P75 NTR RECEPTOR MEDIATED SIGNALLING | Genes involved in p75 NTR receptor-mediated signalling |
| 0.4 | 6.5 | REACTOME MITOCHONDRIAL FATTY ACID BETA OXIDATION | Genes involved in Mitochondrial Fatty Acid Beta-Oxidation |
| 0.4 | 7.8 | REACTOME HYALURONAN UPTAKE AND DEGRADATION | Genes involved in Hyaluronan uptake and degradation |
| 0.4 | 8.9 | REACTOME PROTEOLYTIC CLEAVAGE OF SNARE COMPLEX PROTEINS | Genes involved in Proteolytic cleavage of SNARE complex proteins |
| 0.4 | 52.6 | REACTOME TRANSPORT OF INORGANIC CATIONS ANIONS AND AMINO ACIDS OLIGOPEPTIDES | Genes involved in Transport of inorganic cations/anions and amino acids/oligopeptides |
| 0.4 | 7.5 | REACTOME SEMA3A PAK DEPENDENT AXON REPULSION | Genes involved in Sema3A PAK dependent Axon repulsion |
| 0.3 | 8.4 | REACTOME G1 PHASE | Genes involved in G1 Phase |
| 0.3 | 9.3 | REACTOME BRANCHED CHAIN AMINO ACID CATABOLISM | Genes involved in Branched-chain amino acid catabolism |
| 0.3 | 12.0 | REACTOME ASSOCIATION OF TRIC CCT WITH TARGET PROTEINS DURING BIOSYNTHESIS | Genes involved in Association of TriC/CCT with target proteins during biosynthesis |
| 0.3 | 37.4 | REACTOME RESPONSE TO ELEVATED PLATELET CYTOSOLIC CA2 | Genes involved in Response to elevated platelet cytosolic Ca2+ |
| 0.3 | 4.1 | REACTOME RNA POL I TRANSCRIPTION TERMINATION | Genes involved in RNA Polymerase I Transcription Termination |
| 0.3 | 22.7 | REACTOME RESPIRATORY ELECTRON TRANSPORT | Genes involved in Respiratory electron transport |
| 0.3 | 5.6 | REACTOME GLYCOGEN BREAKDOWN GLYCOGENOLYSIS | Genes involved in Glycogen breakdown (glycogenolysis) |
| 0.3 | 38.1 | REACTOME ANTIGEN PROCESSING UBIQUITINATION PROTEASOME DEGRADATION | Genes involved in Antigen processing: Ubiquitination & Proteasome degradation |
| 0.2 | 6.6 | REACTOME SPHINGOLIPID DE NOVO BIOSYNTHESIS | Genes involved in Sphingolipid de novo biosynthesis |
| 0.2 | 5.1 | REACTOME NUCLEAR EVENTS KINASE AND TRANSCRIPTION FACTOR ACTIVATION | Genes involved in Nuclear Events (kinase and transcription factor activation) |
| 0.2 | 19.0 | REACTOME INTERFERON ALPHA BETA SIGNALING | Genes involved in Interferon alpha/beta signaling |
| 0.2 | 3.5 | REACTOME MRNA DECAY BY 5 TO 3 EXORIBONUCLEASE | Genes involved in mRNA Decay by 5' to 3' Exoribonuclease |
| 0.2 | 4.6 | REACTOME REGULATION OF INSULIN LIKE GROWTH FACTOR IGF ACTIVITY BY INSULIN LIKE GROWTH FACTOR BINDING PROTEINS IGFBPS | Genes involved in Regulation of Insulin-like Growth Factor (IGF) Activity by Insulin-like Growth Factor Binding Proteins (IGFBPs) |
| 0.2 | 14.3 | REACTOME LOSS OF NLP FROM MITOTIC CENTROSOMES | Genes involved in Loss of Nlp from mitotic centrosomes |
| 0.2 | 1.3 | REACTOME ADP SIGNALLING THROUGH P2RY12 | Genes involved in ADP signalling through P2Y purinoceptor 12 |
| 0.2 | 3.7 | REACTOME HS GAG DEGRADATION | Genes involved in HS-GAG degradation |
| 0.2 | 14.1 | REACTOME IMMUNOREGULATORY INTERACTIONS BETWEEN A LYMPHOID AND A NON LYMPHOID CELL | Genes involved in Immunoregulatory interactions between a Lymphoid and a non-Lymphoid cell |
| 0.2 | 4.1 | REACTOME AMINO ACID SYNTHESIS AND INTERCONVERSION TRANSAMINATION | Genes involved in Amino acid synthesis and interconversion (transamination) |
| 0.1 | 17.9 | REACTOME SIGNALING BY RHO GTPASES | Genes involved in Signaling by Rho GTPases |
| 0.1 | 3.3 | REACTOME HIGHLY CALCIUM PERMEABLE POSTSYNAPTIC NICOTINIC ACETYLCHOLINE RECEPTORS | Genes involved in Highly calcium permeable postsynaptic nicotinic acetylcholine receptors |
| 0.1 | 3.1 | REACTOME SIGNAL REGULATORY PROTEIN SIRP FAMILY INTERACTIONS | Genes involved in Signal regulatory protein (SIRP) family interactions |
| 0.1 | 4.1 | REACTOME PEROXISOMAL LIPID METABOLISM | Genes involved in Peroxisomal lipid metabolism |
| 0.1 | 5.2 | REACTOME NETRIN1 SIGNALING | Genes involved in Netrin-1 signaling |
| 0.1 | 8.0 | REACTOME APOPTOTIC CLEAVAGE OF CELLULAR PROTEINS | Genes involved in Apoptotic cleavage of cellular proteins |
| 0.1 | 1.9 | REACTOME INSULIN SYNTHESIS AND PROCESSING | Genes involved in Insulin Synthesis and Processing |
| 0.1 | 4.4 | REACTOME ACTIVATION OF CHAPERONE GENES BY XBP1S | Genes involved in Activation of Chaperone Genes by XBP1(S) |
| 0.1 | 2.3 | REACTOME ACTIVATED AMPK STIMULATES FATTY ACID OXIDATION IN MUSCLE | Genes involved in Activated AMPK stimulates fatty-acid oxidation in muscle |
| 0.1 | 0.9 | REACTOME REGULATION OF SIGNALING BY CBL | Genes involved in Regulation of signaling by CBL |
| 0.0 | 4.5 | REACTOME METABOLISM OF AMINO ACIDS AND DERIVATIVES | Genes involved in Metabolism of amino acids and derivatives |
| 0.0 | 0.4 | REACTOME ACTIVATION OF ATR IN RESPONSE TO REPLICATION STRESS | Genes involved in Activation of ATR in response to replication stress |
| 0.0 | 0.6 | REACTOME PROLACTIN RECEPTOR SIGNALING | Genes involved in Prolactin receptor signaling |
| 0.0 | 2.4 | REACTOME L1CAM INTERACTIONS | Genes involved in L1CAM interactions |
| 0.0 | 0.5 | REACTOME FGFR4 LIGAND BINDING AND ACTIVATION | Genes involved in FGFR4 ligand binding and activation |
| 0.0 | 0.5 | REACTOME HDL MEDIATED LIPID TRANSPORT | Genes involved in HDL-mediated lipid transport |
| 0.0 | 2.8 | REACTOME FACTORS INVOLVED IN MEGAKARYOCYTE DEVELOPMENT AND PLATELET PRODUCTION | Genes involved in Factors involved in megakaryocyte development and platelet production |
| 0.0 | 0.4 | REACTOME N GLYCAN ANTENNAE ELONGATION | Genes involved in N-Glycan antennae elongation |
| 0.0 | 0.6 | REACTOME CHOLESTEROL BIOSYNTHESIS | Genes involved in Cholesterol biosynthesis |
| 0.0 | 0.1 | REACTOME REGULATION OF IFNG SIGNALING | Genes involved in Regulation of IFNG signaling |