Project
GNF SymAtlas + NCI-60 cancer cell lines, human (Su, 2004; Ross, 2000)
Navigation
Downloads
Results for MAZ_ZNF281_GTF2F1
Z-value: 2.79
Motif logo
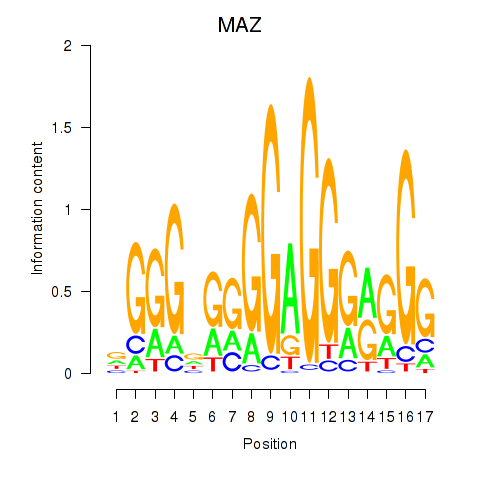
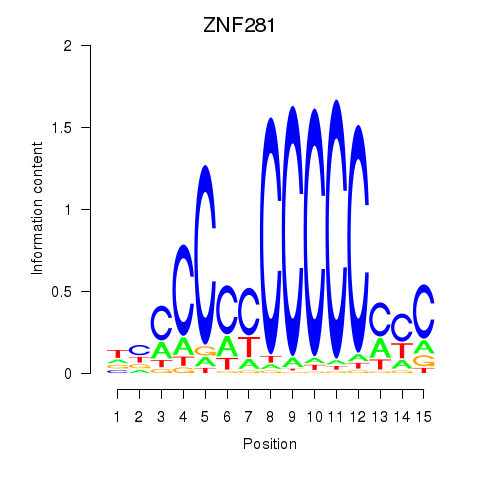
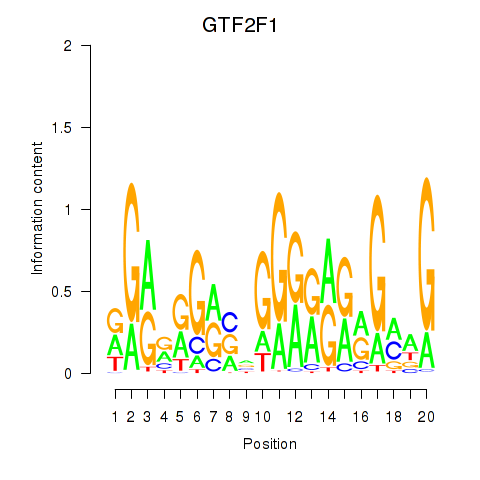
Transcription factors associated with MAZ_ZNF281_GTF2F1
| Gene Symbol | Gene ID | Gene Info |
|---|---|---|
|
MAZ
|
ENSG00000103495.14 | MAZ |
|
ZNF281
|
ENSG00000162702.8 | ZNF281 |
|
GTF2F1
|
ENSG00000125651.14 | GTF2F1 |
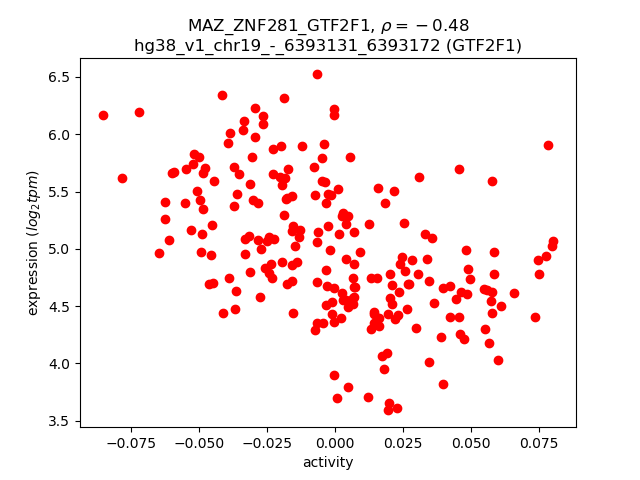
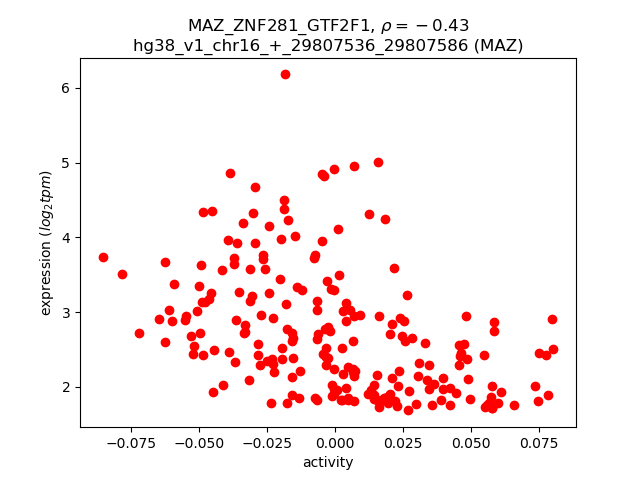
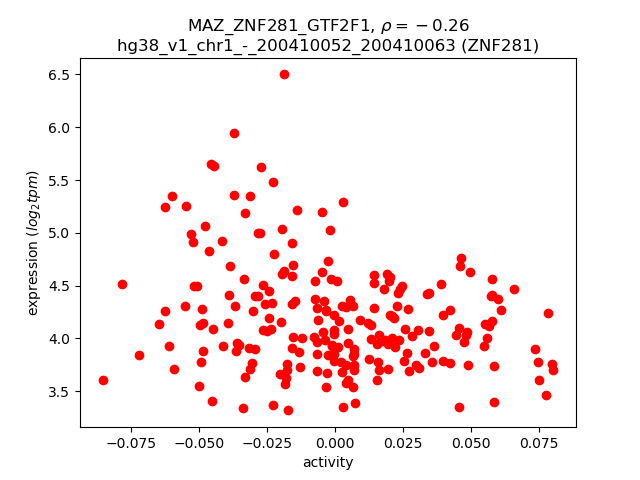
Activity-expression correlation:
| Gene | Promoter | Pearson corr. coef. | P-value | Plot |
|---|---|---|---|---|
| GTF2F1 | hg38_v1_chr19_-_6393131_6393172 | -0.48 | 8.9e-14 | Click! |
| MAZ | hg38_v1_chr16_+_29807536_29807586 | -0.43 | 2.4e-11 | Click! |
| ZNF281 | hg38_v1_chr1_-_200410052_200410063, hg38_v1_chr1_-_200410001_200410049, hg38_v1_chr1_-_200409976_200410000 | -0.26 | 1.1e-04 | Click! |
Activity profile of MAZ_ZNF281_GTF2F1 motif
Sorted Z-values of MAZ_ZNF281_GTF2F1 motif
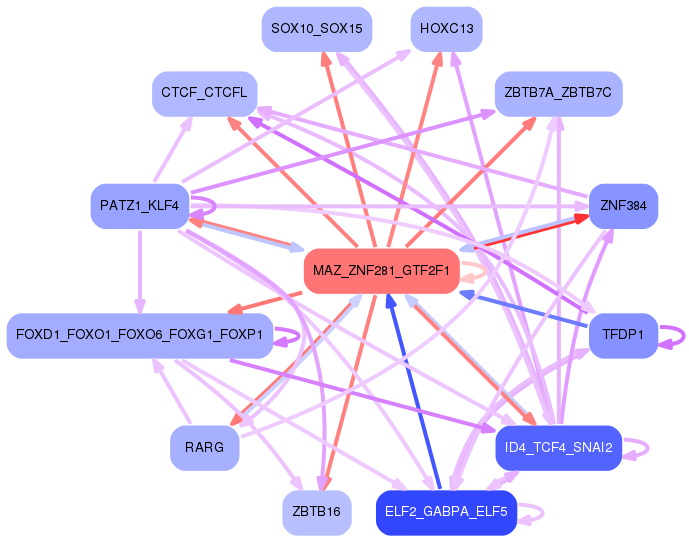
Network of associatons between targets according to the STRING database.

First level regulatory network of MAZ_ZNF281_GTF2F1
Gene Ontology Analysis
Gene overrepresentation in biological process category:
| Log-likelihood per target | Total log-likelihood | Term | Description |
|---|---|---|---|
| 34.4 | 103.3 | GO:0051939 | gamma-aminobutyric acid import(GO:0051939) |
| 24.8 | 99.3 | GO:0031117 | positive regulation of microtubule depolymerization(GO:0031117) |
| 22.2 | 66.5 | GO:0052026 | modulation by virus of host transcription(GO:0019056) positive regulation of sprouting of injured axon(GO:0048687) positive regulation of axon extension involved in regeneration(GO:0048691) modulation by symbiont of host transcription(GO:0052026) |
| 20.7 | 103.3 | GO:0031630 | regulation of synaptic vesicle fusion to presynaptic membrane(GO:0031630) |
| 16.8 | 50.4 | GO:1905051 | regulation of base-excision repair(GO:1905051) positive regulation of base-excision repair(GO:1905053) |
| 16.2 | 64.9 | GO:0033693 | neurofilament bundle assembly(GO:0033693) |
| 16.0 | 47.9 | GO:1904692 | positive regulation of type B pancreatic cell proliferation(GO:1904692) |
| 15.7 | 47.1 | GO:0070317 | negative regulation of G0 to G1 transition(GO:0070317) |
| 14.6 | 58.4 | GO:0031161 | phosphatidylinositol catabolic process(GO:0031161) |
| 14.5 | 247.2 | GO:0090361 | platelet-derived growth factor production(GO:0090360) regulation of platelet-derived growth factor production(GO:0090361) |
| 14.3 | 42.8 | GO:1903288 | positive regulation of potassium ion import(GO:1903288) |
| 14.0 | 55.9 | GO:0003431 | growth plate cartilage chondrocyte growth(GO:0003430) growth plate cartilage chondrocyte development(GO:0003431) |
| 13.9 | 55.7 | GO:0033159 | negative regulation of protein import into nucleus, translocation(GO:0033159) |
| 13.8 | 41.4 | GO:0098746 | fast, calcium ion-dependent exocytosis of neurotransmitter(GO:0098746) |
| 13.7 | 41.2 | GO:0042412 | taurine biosynthetic process(GO:0042412) |
| 13.2 | 145.5 | GO:0097116 | gephyrin clustering involved in postsynaptic density assembly(GO:0097116) |
| 13.2 | 66.1 | GO:0015688 | iron chelate transport(GO:0015688) siderophore transport(GO:0015891) |
| 13.2 | 79.2 | GO:0021966 | corticospinal neuron axon guidance(GO:0021966) |
| 13.0 | 38.9 | GO:0001868 | regulation of complement activation, lectin pathway(GO:0001868) negative regulation of complement activation, lectin pathway(GO:0001869) |
| 12.9 | 12.9 | GO:0072301 | regulation of metanephric glomerular mesangial cell proliferation(GO:0072301) |
| 12.7 | 25.5 | GO:0061535 | glutamate secretion, neurotransmission(GO:0061535) |
| 12.7 | 76.2 | GO:0030644 | cellular chloride ion homeostasis(GO:0030644) |
| 12.5 | 211.7 | GO:0007021 | tubulin complex assembly(GO:0007021) |
| 12.0 | 192.2 | GO:0070445 | oligodendrocyte progenitor proliferation(GO:0070444) regulation of oligodendrocyte progenitor proliferation(GO:0070445) |
| 12.0 | 36.0 | GO:1900920 | regulation of amino acid uptake involved in synaptic transmission(GO:0051941) regulation of glutamate uptake involved in transmission of nerve impulse(GO:0051946) regulation of L-glutamate import(GO:1900920) |
| 11.7 | 23.3 | GO:0016185 | synaptic vesicle budding from presynaptic endocytic zone membrane(GO:0016185) |
| 11.7 | 35.0 | GO:0060221 | retinal rod cell differentiation(GO:0060221) |
| 11.6 | 46.5 | GO:0018231 | peptidyl-L-cysteine S-palmitoylation(GO:0018230) peptidyl-S-diacylglycerol-L-cysteine biosynthetic process from peptidyl-cysteine(GO:0018231) |
| 11.2 | 33.7 | GO:0050760 | negative regulation of thymidylate synthase biosynthetic process(GO:0050760) |
| 11.1 | 55.5 | GO:0051138 | positive regulation of NK T cell differentiation(GO:0051138) |
| 10.8 | 10.8 | GO:0036091 | positive regulation of transcription from RNA polymerase II promoter in response to oxidative stress(GO:0036091) |
| 10.8 | 43.1 | GO:2000297 | negative regulation of synapse maturation(GO:2000297) |
| 10.7 | 53.6 | GO:0093001 | glycolysis from storage polysaccharide through glucose-1-phosphate(GO:0093001) |
| 10.7 | 32.0 | GO:1905071 | occluding junction disassembly(GO:1905071) regulation of occluding junction disassembly(GO:1905073) positive regulation of occluding junction disassembly(GO:1905075) |
| 10.6 | 21.2 | GO:0097114 | NMDA glutamate receptor clustering(GO:0097114) |
| 10.5 | 31.6 | GO:0072365 | regulation of cellular ketone metabolic process by negative regulation of transcription from RNA polymerase II promoter(GO:0072365) |
| 10.5 | 168.6 | GO:0048172 | regulation of short-term neuronal synaptic plasticity(GO:0048172) |
| 10.5 | 31.4 | GO:1904616 | regulation of actin filament binding(GO:1904529) regulation of actin binding(GO:1904616) |
| 10.0 | 30.1 | GO:1905167 | positive regulation of lysosomal protein catabolic process(GO:1905167) |
| 10.0 | 50.2 | GO:2001074 | regulation of metanephric ureteric bud development(GO:2001074) positive regulation of metanephric ureteric bud development(GO:2001076) |
| 10.0 | 30.0 | GO:0060032 | notochord regression(GO:0060032) |
| 10.0 | 10.0 | GO:0072021 | ascending thin limb development(GO:0072021) metanephric ascending thin limb development(GO:0072218) |
| 9.7 | 48.5 | GO:0099590 | neurotransmitter receptor internalization(GO:0099590) |
| 9.6 | 28.9 | GO:0014813 | skeletal muscle satellite cell commitment(GO:0014813) |
| 9.5 | 28.4 | GO:1990504 | dense core granule exocytosis(GO:1990504) |
| 9.5 | 113.5 | GO:0051611 | negative regulation of neurotransmitter uptake(GO:0051581) regulation of serotonin uptake(GO:0051611) negative regulation of serotonin uptake(GO:0051612) |
| 9.4 | 18.9 | GO:0021590 | cerebellum maturation(GO:0021590) cerebellar cortex maturation(GO:0021699) |
| 9.4 | 84.9 | GO:0002175 | protein localization to paranode region of axon(GO:0002175) |
| 9.4 | 65.9 | GO:0070560 | protein secretion by platelet(GO:0070560) |
| 9.3 | 46.4 | GO:1902612 | regulation of anti-Mullerian hormone signaling pathway(GO:1902612) negative regulation of anti-Mullerian hormone signaling pathway(GO:1902613) anti-Mullerian hormone signaling pathway(GO:1990262) |
| 9.2 | 27.6 | GO:0099558 | maintenance of synapse structure(GO:0099558) |
| 8.8 | 26.5 | GO:0071393 | cellular response to progesterone stimulus(GO:0071393) |
| 8.8 | 35.3 | GO:1902530 | regulation of protein linear polyubiquitination(GO:1902528) positive regulation of protein linear polyubiquitination(GO:1902530) |
| 8.7 | 17.5 | GO:0071874 | response to norepinephrine(GO:0071873) cellular response to norepinephrine stimulus(GO:0071874) |
| 8.6 | 34.6 | GO:1904800 | negative regulation of dendrite extension(GO:1903860) regulation of neuron remodeling(GO:1904799) negative regulation of neuron remodeling(GO:1904800) negative regulation of branching morphogenesis of a nerve(GO:2000173) |
| 8.6 | 51.8 | GO:0097118 | neuroligin clustering involved in postsynaptic membrane assembly(GO:0097118) |
| 8.1 | 40.6 | GO:1901910 | diadenosine polyphosphate catabolic process(GO:0015961) diphosphoinositol polyphosphate metabolic process(GO:0071543) diadenosine pentaphosphate metabolic process(GO:1901906) diadenosine pentaphosphate catabolic process(GO:1901907) diadenosine hexaphosphate metabolic process(GO:1901908) diadenosine hexaphosphate catabolic process(GO:1901909) adenosine 5'-(hexahydrogen pentaphosphate) metabolic process(GO:1901910) adenosine 5'-(hexahydrogen pentaphosphate) catabolic process(GO:1901911) |
| 8.1 | 16.1 | GO:1903233 | regulation of calcium ion-dependent exocytosis of neurotransmitter(GO:1903233) |
| 8.1 | 8.1 | GO:0010694 | positive regulation of alkaline phosphatase activity(GO:0010694) |
| 8.0 | 39.9 | GO:0002904 | positive regulation of B cell apoptotic process(GO:0002904) |
| 7.9 | 39.7 | GO:0018352 | protein-pyridoxal-5-phosphate linkage(GO:0018352) |
| 7.8 | 47.0 | GO:0060313 | negative regulation of blood vessel remodeling(GO:0060313) |
| 7.8 | 375.2 | GO:0007214 | gamma-aminobutyric acid signaling pathway(GO:0007214) |
| 7.8 | 31.2 | GO:0034628 | nicotinamide nucleotide biosynthetic process from aspartate(GO:0019355) 'de novo' NAD biosynthetic process(GO:0034627) 'de novo' NAD biosynthetic process from aspartate(GO:0034628) |
| 7.8 | 15.5 | GO:1900275 | negative regulation of phospholipase C activity(GO:1900275) |
| 7.7 | 23.0 | GO:0061163 | endoplasmic reticulum polarization(GO:0061163) actin filament bundle retrograde transport(GO:0061573) actin filament bundle distribution(GO:0070650) |
| 7.6 | 22.7 | GO:0098582 | innate vocalization behavior(GO:0098582) |
| 7.5 | 22.6 | GO:0042137 | sequestering of neurotransmitter(GO:0042137) |
| 7.5 | 29.9 | GO:0097091 | synaptic vesicle clustering(GO:0097091) |
| 7.5 | 29.9 | GO:1903974 | positive regulation of odontogenesis of dentin-containing tooth(GO:0042488) mammary gland fat development(GO:0060611) positive regulation of macrophage colony-stimulating factor signaling pathway(GO:1902228) positive regulation of response to macrophage colony-stimulating factor(GO:1903971) positive regulation of cellular response to macrophage colony-stimulating factor stimulus(GO:1903974) positive regulation of microglial cell migration(GO:1904141) |
| 7.3 | 21.9 | GO:0090176 | microtubule cytoskeleton organization involved in establishment of planar polarity(GO:0090176) |
| 7.3 | 87.4 | GO:0097113 | AMPA glutamate receptor clustering(GO:0097113) glutamate receptor clustering(GO:0097688) |
| 7.3 | 50.9 | GO:2000671 | regulation of motor neuron apoptotic process(GO:2000671) |
| 7.0 | 63.4 | GO:0060075 | regulation of resting membrane potential(GO:0060075) |
| 7.0 | 7.0 | GO:0072262 | metanephric glomerular mesangial cell proliferation involved in metanephros development(GO:0072262) |
| 6.9 | 76.1 | GO:0010499 | proteasomal ubiquitin-independent protein catabolic process(GO:0010499) |
| 6.8 | 41.1 | GO:0071477 | hypotonic salinity response(GO:0042539) cellular hypotonic salinity response(GO:0071477) |
| 6.8 | 27.4 | GO:0006542 | glutamine biosynthetic process(GO:0006542) |
| 6.8 | 20.4 | GO:0060988 | lipid tube assembly(GO:0060988) |
| 6.8 | 27.2 | GO:0019072 | viral genome packaging(GO:0019072) viral RNA genome packaging(GO:0019074) |
| 6.7 | 26.6 | GO:0036369 | transcription factor catabolic process(GO:0036369) |
| 6.6 | 19.9 | GO:0036146 | cellular response to mycotoxin(GO:0036146) |
| 6.5 | 45.3 | GO:2000324 | positive regulation of glucocorticoid receptor signaling pathway(GO:2000324) |
| 6.5 | 19.4 | GO:1900239 | phenotypic switching(GO:0036166) regulation of phenotypic switching(GO:1900239) |
| 6.4 | 32.1 | GO:0010615 | positive regulation of cardiac muscle adaptation(GO:0010615) positive regulation of cardiac muscle hypertrophy in response to stress(GO:1903244) |
| 6.4 | 19.2 | GO:0072023 | thick ascending limb development(GO:0072023) metanephric thick ascending limb development(GO:0072233) |
| 6.4 | 25.6 | GO:1904980 | positive regulation of endosome organization(GO:1904980) |
| 6.4 | 32.0 | GO:0090258 | negative regulation of mitochondrial fission(GO:0090258) |
| 6.4 | 19.1 | GO:0071464 | cellular response to hydrostatic pressure(GO:0071464) |
| 6.3 | 19.0 | GO:0016103 | diterpenoid catabolic process(GO:0016103) retinoic acid catabolic process(GO:0034653) |
| 6.2 | 18.7 | GO:0021592 | fourth ventricle development(GO:0021592) third ventricle development(GO:0021678) |
| 6.2 | 18.6 | GO:0035544 | negative regulation of SNARE complex assembly(GO:0035544) |
| 6.1 | 18.4 | GO:0071206 | establishment of protein localization to juxtaparanode region of axon(GO:0071206) |
| 6.1 | 60.9 | GO:0019227 | neuronal action potential propagation(GO:0019227) action potential propagation(GO:0098870) |
| 6.0 | 18.1 | GO:0060392 | negative regulation of SMAD protein import into nucleus(GO:0060392) |
| 6.0 | 18.0 | GO:0046416 | D-amino acid metabolic process(GO:0046416) |
| 5.9 | 47.6 | GO:0003185 | primary heart field specification(GO:0003138) sinoatrial valve development(GO:0003172) sinoatrial valve morphogenesis(GO:0003185) |
| 5.9 | 17.6 | GO:1990168 | protein K33-linked deubiquitination(GO:1990168) |
| 5.8 | 23.4 | GO:0097676 | histone H3-K36 dimethylation(GO:0097676) |
| 5.8 | 17.5 | GO:0014016 | neuroblast differentiation(GO:0014016) |
| 5.7 | 51.6 | GO:0014052 | regulation of gamma-aminobutyric acid secretion(GO:0014052) |
| 5.7 | 34.3 | GO:0051388 | positive regulation of neurotrophin TRK receptor signaling pathway(GO:0051388) |
| 5.7 | 51.3 | GO:1902255 | positive regulation of intrinsic apoptotic signaling pathway by p53 class mediator(GO:1902255) |
| 5.7 | 17.1 | GO:0043376 | regulation of CD8-positive, alpha-beta T cell differentiation(GO:0043376) |
| 5.7 | 79.1 | GO:0021942 | radial glia guided migration of Purkinje cell(GO:0021942) |
| 5.6 | 11.3 | GO:0021780 | spinal cord oligodendrocyte cell differentiation(GO:0021529) spinal cord oligodendrocyte cell fate specification(GO:0021530) oligodendrocyte cell fate specification(GO:0021778) oligodendrocyte cell fate commitment(GO:0021779) glial cell fate specification(GO:0021780) |
| 5.6 | 5.6 | GO:0060599 | lateral sprouting involved in mammary gland duct morphogenesis(GO:0060599) |
| 5.6 | 27.8 | GO:0006535 | cysteine biosynthetic process from serine(GO:0006535) cysteine biosynthetic process via cystathionine(GO:0019343) |
| 5.6 | 22.2 | GO:0035054 | embryonic heart tube anterior/posterior pattern specification(GO:0035054) |
| 5.5 | 60.4 | GO:2000311 | regulation of alpha-amino-3-hydroxy-5-methyl-4-isoxazole propionate selective glutamate receptor activity(GO:2000311) |
| 5.4 | 16.3 | GO:0051039 | histone displacement(GO:0001207) positive regulation of transcription involved in meiotic cell cycle(GO:0051039) |
| 5.4 | 16.3 | GO:1901897 | regulation of relaxation of cardiac muscle(GO:1901897) |
| 5.4 | 21.7 | GO:2000686 | regulation of rubidium ion transmembrane transporter activity(GO:2000686) |
| 5.4 | 16.2 | GO:0070843 | misfolded protein transport(GO:0070843) polyubiquitinated protein transport(GO:0070844) polyubiquitinated misfolded protein transport(GO:0070845) Hsp90 deacetylation(GO:0070846) |
| 5.4 | 21.5 | GO:0010900 | negative regulation of phosphatidylcholine catabolic process(GO:0010900) |
| 5.3 | 21.1 | GO:0019086 | late viral transcription(GO:0019086) |
| 5.2 | 5.2 | GO:0051957 | positive regulation of amino acid transport(GO:0051957) |
| 5.2 | 26.1 | GO:0061762 | CAMKK-AMPK signaling cascade(GO:0061762) |
| 5.2 | 15.5 | GO:0003104 | positive regulation of glomerular filtration(GO:0003104) |
| 5.0 | 30.2 | GO:0035469 | determination of pancreatic left/right asymmetry(GO:0035469) determination of liver left/right asymmetry(GO:0071910) |
| 5.0 | 15.1 | GO:0060040 | retinal bipolar neuron differentiation(GO:0060040) |
| 5.0 | 25.0 | GO:0030950 | establishment or maintenance of actin cytoskeleton polarity(GO:0030950) |
| 5.0 | 14.9 | GO:0043012 | regulation of fusion of sperm to egg plasma membrane(GO:0043012) |
| 4.9 | 9.8 | GO:0072344 | rescue of stalled ribosome(GO:0072344) |
| 4.9 | 4.9 | GO:0097324 | melanocyte migration(GO:0097324) |
| 4.9 | 14.6 | GO:1900194 | negative regulation of oocyte maturation(GO:1900194) |
| 4.9 | 14.6 | GO:0036304 | umbilical cord morphogenesis(GO:0036304) umbilical cord development(GO:0061027) |
| 4.8 | 14.4 | GO:0009447 | putrescine catabolic process(GO:0009447) |
| 4.8 | 14.4 | GO:0061699 | protein demalonylation(GO:0036046) peptidyl-lysine demalonylation(GO:0036047) protein desuccinylation(GO:0036048) peptidyl-lysine desuccinylation(GO:0036049) protein deglutarylation(GO:0061698) peptidyl-lysine deglutarylation(GO:0061699) |
| 4.8 | 86.4 | GO:0071786 | endoplasmic reticulum tubular network organization(GO:0071786) |
| 4.8 | 81.0 | GO:0003322 | pancreatic A cell development(GO:0003322) |
| 4.7 | 4.7 | GO:0009996 | negative regulation of cell fate specification(GO:0009996) |
| 4.7 | 4.7 | GO:0045763 | negative regulation of cellular amino acid metabolic process(GO:0045763) |
| 4.7 | 28.1 | GO:0003190 | atrioventricular valve formation(GO:0003190) |
| 4.7 | 23.4 | GO:0014050 | negative regulation of glutamate secretion(GO:0014050) |
| 4.7 | 14.0 | GO:0036292 | DNA rewinding(GO:0036292) |
| 4.6 | 50.5 | GO:0070050 | neuron cellular homeostasis(GO:0070050) |
| 4.6 | 45.8 | GO:0060371 | regulation of atrial cardiac muscle cell membrane depolarization(GO:0060371) |
| 4.6 | 13.7 | GO:0032223 | negative regulation of synaptic transmission, cholinergic(GO:0032223) neurotransmitter receptor biosynthetic process(GO:0045212) |
| 4.6 | 13.7 | GO:2000053 | regulation of Wnt signaling pathway involved in dorsal/ventral axis specification(GO:2000053) |
| 4.5 | 13.5 | GO:0033602 | negative regulation of dopamine secretion(GO:0033602) |
| 4.5 | 40.2 | GO:0099566 | regulation of postsynaptic cytosolic calcium ion concentration(GO:0099566) |
| 4.4 | 35.3 | GO:0048712 | negative regulation of astrocyte differentiation(GO:0048712) |
| 4.4 | 39.5 | GO:0016198 | axon choice point recognition(GO:0016198) |
| 4.4 | 34.9 | GO:0008090 | retrograde axonal transport(GO:0008090) |
| 4.3 | 17.3 | GO:1900454 | positive regulation of long term synaptic depression(GO:1900454) |
| 4.3 | 8.6 | GO:0051040 | regulation of calcium-independent cell-cell adhesion(GO:0051040) |
| 4.3 | 42.8 | GO:0021957 | corticospinal tract morphogenesis(GO:0021957) |
| 4.3 | 21.4 | GO:1904566 | response to 1-oleoyl-sn-glycerol 3-phosphate(GO:1904565) cellular response to 1-oleoyl-sn-glycerol 3-phosphate(GO:1904566) |
| 4.3 | 8.5 | GO:2000820 | negative regulation of transcription from RNA polymerase II promoter involved in smooth muscle cell differentiation(GO:2000820) |
| 4.2 | 4.2 | GO:0048690 | regulation of sprouting of injured axon(GO:0048686) regulation of axon extension involved in regeneration(GO:0048690) |
| 4.2 | 50.8 | GO:0031284 | positive regulation of guanylate cyclase activity(GO:0031284) |
| 4.2 | 12.7 | GO:0009449 | gamma-aminobutyric acid biosynthetic process(GO:0009449) |
| 4.2 | 12.6 | GO:1902746 | regulation of lens fiber cell differentiation(GO:1902746) |
| 4.2 | 29.4 | GO:0021999 | neural plate anterior/posterior regionalization(GO:0021999) |
| 4.2 | 12.5 | GO:0021913 | regulation of transcription from RNA polymerase II promoter involved in ventral spinal cord interneuron specification(GO:0021913) |
| 4.2 | 16.6 | GO:0014859 | negative regulation of skeletal muscle cell proliferation(GO:0014859) negative regulation of skeletal muscle satellite cell proliferation(GO:1902723) |
| 4.1 | 4.1 | GO:1902959 | regulation of aspartic-type endopeptidase activity involved in amyloid precursor protein catabolic process(GO:1902959) regulation of aspartic-type peptidase activity(GO:1905245) |
| 4.1 | 12.3 | GO:0015670 | carbon dioxide transport(GO:0015670) |
| 4.1 | 53.3 | GO:2001135 | regulation of endocytic recycling(GO:2001135) |
| 4.1 | 16.3 | GO:0061091 | regulation of phospholipid translocation(GO:0061091) positive regulation of phospholipid translocation(GO:0061092) |
| 4.1 | 44.9 | GO:0070779 | D-aspartate transport(GO:0070777) D-aspartate import(GO:0070779) |
| 4.1 | 125.9 | GO:2000369 | regulation of clathrin-mediated endocytosis(GO:2000369) |
| 4.1 | 4.1 | GO:0031269 | pseudopodium assembly(GO:0031269) |
| 4.0 | 4.0 | GO:0021586 | pons maturation(GO:0021586) superior olivary nucleus development(GO:0021718) superior olivary nucleus maturation(GO:0021722) |
| 4.0 | 8.0 | GO:0060018 | astrocyte fate commitment(GO:0060018) |
| 4.0 | 71.8 | GO:0032291 | central nervous system myelination(GO:0022010) axon ensheathment in central nervous system(GO:0032291) |
| 3.9 | 11.8 | GO:0007343 | egg activation(GO:0007343) activation of meiosis(GO:0090427) |
| 3.9 | 15.7 | GO:0072660 | maintenance of protein location in membrane(GO:0072658) maintenance of protein location in plasma membrane(GO:0072660) positive regulation of membrane depolarization during cardiac muscle cell action potential(GO:1900827) |
| 3.9 | 15.6 | GO:2000638 | regulation of SREBP signaling pathway(GO:2000638) negative regulation of SREBP signaling pathway(GO:2000639) |
| 3.9 | 7.8 | GO:1903279 | regulation of calcium:sodium antiporter activity(GO:1903279) |
| 3.9 | 19.4 | GO:0033058 | directional locomotion(GO:0033058) |
| 3.8 | 57.4 | GO:0007258 | JUN phosphorylation(GO:0007258) |
| 3.8 | 7.6 | GO:0075044 | autophagy of host cells involved in interaction with symbiont(GO:0075044) autophagy involved in symbiotic interaction(GO:0075071) |
| 3.8 | 19.1 | GO:0030070 | insulin processing(GO:0030070) |
| 3.8 | 15.3 | GO:0033029 | regulation of neutrophil apoptotic process(GO:0033029) |
| 3.8 | 140.1 | GO:0048791 | calcium ion-regulated exocytosis of neurotransmitter(GO:0048791) |
| 3.8 | 11.3 | GO:2000538 | regulation of B cell chemotaxis(GO:2000537) positive regulation of B cell chemotaxis(GO:2000538) |
| 3.8 | 15.1 | GO:2000170 | positive regulation of peptidyl-cysteine S-nitrosylation(GO:2000170) |
| 3.8 | 3.8 | GO:0023041 | neuronal signal transduction(GO:0023041) |
| 3.7 | 14.9 | GO:0061303 | cornea development in camera-type eye(GO:0061303) |
| 3.7 | 14.8 | GO:1903818 | positive regulation of voltage-gated potassium channel activity(GO:1903818) |
| 3.7 | 18.4 | GO:0060160 | negative regulation of dopamine receptor signaling pathway(GO:0060160) |
| 3.7 | 7.4 | GO:0098528 | skeletal muscle fiber differentiation(GO:0098528) regulation of skeletal muscle fiber differentiation(GO:1902809) |
| 3.7 | 7.3 | GO:0035441 | cell migration involved in vasculogenesis(GO:0035441) |
| 3.6 | 7.3 | GO:0072276 | metanephric glomerulus morphogenesis(GO:0072275) metanephric glomerulus vasculature morphogenesis(GO:0072276) metanephric glomerular capillary formation(GO:0072277) |
| 3.6 | 36.2 | GO:0007196 | adenylate cyclase-inhibiting G-protein coupled glutamate receptor signaling pathway(GO:0007196) |
| 3.6 | 50.2 | GO:0060004 | reflex(GO:0060004) |
| 3.6 | 7.2 | GO:0001983 | regulation of systemic arterial blood pressure by carotid sinus baroreceptor feedback(GO:0001978) baroreceptor response to increased systemic arterial blood pressure(GO:0001983) |
| 3.6 | 3.6 | GO:0031335 | regulation of sulfur amino acid metabolic process(GO:0031335) regulation of homocysteine metabolic process(GO:0050666) |
| 3.6 | 3.6 | GO:1902080 | regulation of calcium ion import into sarcoplasmic reticulum(GO:1902080) negative regulation of calcium ion import into sarcoplasmic reticulum(GO:1902081) |
| 3.6 | 3.6 | GO:1900138 | negative regulation of phospholipase A2 activity(GO:1900138) |
| 3.5 | 14.2 | GO:0048680 | positive regulation of axon regeneration(GO:0048680) |
| 3.5 | 17.7 | GO:0045925 | positive regulation of female receptivity(GO:0045925) |
| 3.5 | 17.4 | GO:1903906 | plasma membrane raft distribution(GO:0044855) plasma membrane raft localization(GO:0044856) plasma membrane raft polarization(GO:0044858) regulation of plasma membrane raft polarization(GO:1903906) |
| 3.5 | 7.0 | GO:1902938 | regulation of intracellular calcium activated chloride channel activity(GO:1902938) |
| 3.5 | 7.0 | GO:2000259 | positive regulation of complement activation(GO:0045917) positive regulation of protein activation cascade(GO:2000259) |
| 3.5 | 10.4 | GO:1902630 | regulation of membrane hyperpolarization(GO:1902630) |
| 3.4 | 20.7 | GO:1902473 | regulation of protein localization to synapse(GO:1902473) |
| 3.4 | 89.2 | GO:0071625 | vocalization behavior(GO:0071625) |
| 3.4 | 24.0 | GO:0007158 | neuron cell-cell adhesion(GO:0007158) |
| 3.4 | 20.4 | GO:0006543 | glutamine catabolic process(GO:0006543) |
| 3.4 | 10.2 | GO:0061591 | calcium activated phospholipid scrambling(GO:0061588) calcium activated phosphatidylcholine scrambling(GO:0061590) calcium activated galactosylceramide scrambling(GO:0061591) |
| 3.4 | 10.1 | GO:0072674 | multinuclear osteoclast differentiation(GO:0072674) osteoclast fusion(GO:0072675) |
| 3.3 | 59.5 | GO:0061577 | calcium ion transmembrane transport via high voltage-gated calcium channel(GO:0061577) |
| 3.3 | 36.3 | GO:0043562 | cellular response to nitrogen starvation(GO:0006995) cellular response to nitrogen levels(GO:0043562) |
| 3.3 | 6.6 | GO:0007089 | traversing start control point of mitotic cell cycle(GO:0007089) |
| 3.3 | 32.8 | GO:2001224 | positive regulation of neuron migration(GO:2001224) |
| 3.2 | 9.7 | GO:0006172 | ADP biosynthetic process(GO:0006172) purine deoxyribonucleoside diphosphate biosynthetic process(GO:0009183) |
| 3.2 | 12.9 | GO:1900169 | regulation of glucocorticoid mediated signaling pathway(GO:1900169) |
| 3.2 | 9.7 | GO:1990108 | protein linear deubiquitination(GO:1990108) |
| 3.2 | 3.2 | GO:1902263 | apoptotic process involved in embryonic digit morphogenesis(GO:1902263) |
| 3.2 | 19.3 | GO:0002760 | positive regulation of antimicrobial peptide production(GO:0002225) positive regulation of antimicrobial humoral response(GO:0002760) positive regulation of antibacterial peptide production(GO:0002803) |
| 3.2 | 3.2 | GO:1900226 | negative regulation of NLRP3 inflammasome complex assembly(GO:1900226) |
| 3.2 | 6.4 | GO:0030208 | dermatan sulfate biosynthetic process(GO:0030208) dermatan sulfate proteoglycan biosynthetic process(GO:0050651) |
| 3.2 | 25.4 | GO:0000160 | phosphorelay signal transduction system(GO:0000160) |
| 3.1 | 6.3 | GO:1902174 | positive regulation of keratinocyte apoptotic process(GO:1902174) |
| 3.1 | 18.7 | GO:1904936 | cerebral cortex GABAergic interneuron migration(GO:0021853) interneuron migration(GO:1904936) |
| 3.1 | 6.2 | GO:1900425 | negative regulation of defense response to bacterium(GO:1900425) |
| 3.1 | 24.7 | GO:2000467 | positive regulation of glycogen (starch) synthase activity(GO:2000467) |
| 3.1 | 45.9 | GO:0042424 | catechol-containing compound catabolic process(GO:0019614) catecholamine catabolic process(GO:0042424) |
| 3.0 | 33.5 | GO:0097186 | amelogenesis(GO:0097186) |
| 3.0 | 21.3 | GO:0036481 | intrinsic apoptotic signaling pathway in response to hydrogen peroxide(GO:0036481) |
| 3.0 | 3.0 | GO:0099612 | protein localization to axon(GO:0099612) |
| 3.0 | 72.7 | GO:0035235 | ionotropic glutamate receptor signaling pathway(GO:0035235) |
| 3.0 | 12.0 | GO:0032849 | positive regulation of cellular pH reduction(GO:0032849) |
| 3.0 | 18.0 | GO:0045586 | regulation of gamma-delta T cell differentiation(GO:0045586) |
| 3.0 | 134.0 | GO:0007190 | activation of adenylate cyclase activity(GO:0007190) |
| 3.0 | 35.5 | GO:0001955 | blood vessel maturation(GO:0001955) |
| 2.9 | 17.6 | GO:0035063 | nuclear speck organization(GO:0035063) |
| 2.9 | 8.8 | GO:2000097 | regulation of smooth muscle cell-matrix adhesion(GO:2000097) |
| 2.9 | 11.7 | GO:0090245 | axis elongation involved in somitogenesis(GO:0090245) |
| 2.9 | 8.7 | GO:0014022 | neural plate elongation(GO:0014022) convergent extension involved in neural plate elongation(GO:0022007) |
| 2.9 | 43.0 | GO:0046325 | negative regulation of glucose import(GO:0046325) |
| 2.9 | 20.0 | GO:1903237 | negative regulation of leukocyte tethering or rolling(GO:1903237) |
| 2.8 | 14.2 | GO:2001181 | positive regulation of interleukin-10 secretion(GO:2001181) |
| 2.8 | 5.7 | GO:0070093 | negative regulation of glucagon secretion(GO:0070093) |
| 2.8 | 2.8 | GO:0006533 | aspartate catabolic process(GO:0006533) |
| 2.8 | 203.0 | GO:0006501 | C-terminal protein lipidation(GO:0006501) |
| 2.8 | 16.8 | GO:0001920 | negative regulation of receptor recycling(GO:0001920) |
| 2.8 | 8.4 | GO:0043653 | mitochondrial fragmentation involved in apoptotic process(GO:0043653) |
| 2.8 | 44.4 | GO:2000480 | negative regulation of cAMP-dependent protein kinase activity(GO:2000480) |
| 2.8 | 13.8 | GO:0042713 | sperm ejaculation(GO:0042713) |
| 2.8 | 8.3 | GO:1905232 | cellular response to L-glutamate(GO:1905232) |
| 2.8 | 5.5 | GO:0031282 | regulation of guanylate cyclase activity(GO:0031282) |
| 2.8 | 27.5 | GO:0097011 | cellular response to granulocyte macrophage colony-stimulating factor stimulus(GO:0097011) response to granulocyte macrophage colony-stimulating factor(GO:0097012) |
| 2.8 | 5.5 | GO:1901624 | negative regulation of lymphocyte chemotaxis(GO:1901624) |
| 2.7 | 10.9 | GO:1903627 | regulation of calcium-dependent ATPase activity(GO:1903610) negative regulation of calcium-dependent ATPase activity(GO:1903611) regulation of dUTP diphosphatase activity(GO:1903627) positive regulation of dUTP diphosphatase activity(GO:1903629) negative regulation of aminoacyl-tRNA ligase activity(GO:1903631) regulation of leucine-tRNA ligase activity(GO:1903633) negative regulation of leucine-tRNA ligase activity(GO:1903634) |
| 2.7 | 2.7 | GO:0072104 | glomerulus vasculature morphogenesis(GO:0072103) glomerular capillary formation(GO:0072104) |
| 2.7 | 18.9 | GO:2000322 | regulation of glucocorticoid receptor signaling pathway(GO:2000322) |
| 2.7 | 5.4 | GO:1990086 | lens fiber cell apoptotic process(GO:1990086) |
| 2.7 | 8.1 | GO:1900245 | positive regulation of MDA-5 signaling pathway(GO:1900245) |
| 2.7 | 18.8 | GO:0032100 | positive regulation of response to food(GO:0032097) positive regulation of appetite(GO:0032100) |
| 2.7 | 32.2 | GO:0042373 | vitamin K metabolic process(GO:0042373) |
| 2.7 | 2.7 | GO:0035502 | metanephric part of ureteric bud development(GO:0035502) |
| 2.7 | 13.3 | GO:1901093 | regulation of protein tetramerization(GO:1901090) negative regulation of protein tetramerization(GO:1901091) regulation of protein homotetramerization(GO:1901093) negative regulation of protein homotetramerization(GO:1901094) |
| 2.7 | 10.7 | GO:0009305 | protein biotinylation(GO:0009305) histone biotinylation(GO:0071110) |
| 2.7 | 58.6 | GO:0090036 | regulation of protein kinase C signaling(GO:0090036) |
| 2.7 | 5.3 | GO:0045715 | negative regulation of low-density lipoprotein particle receptor biosynthetic process(GO:0045715) |
| 2.7 | 55.8 | GO:1900449 | regulation of glutamate receptor signaling pathway(GO:1900449) |
| 2.7 | 8.0 | GO:1904640 | response to methionine(GO:1904640) |
| 2.6 | 18.5 | GO:1903142 | positive regulation of endothelial cell development(GO:1901552) positive regulation of establishment of endothelial barrier(GO:1903142) |
| 2.6 | 15.8 | GO:1990034 | calcium ion export from cell(GO:1990034) |
| 2.6 | 29.0 | GO:0031987 | locomotion involved in locomotory behavior(GO:0031987) |
| 2.6 | 13.0 | GO:2001014 | regulation of skeletal muscle cell differentiation(GO:2001014) |
| 2.6 | 130.3 | GO:1901385 | regulation of voltage-gated calcium channel activity(GO:1901385) |
| 2.6 | 36.5 | GO:2000291 | regulation of myoblast proliferation(GO:2000291) |
| 2.6 | 5.2 | GO:0060023 | soft palate development(GO:0060023) |
| 2.6 | 2.6 | GO:1901668 | regulation of superoxide dismutase activity(GO:1901668) |
| 2.6 | 7.7 | GO:1903644 | regulation of chaperone-mediated protein folding(GO:1903644) |
| 2.6 | 17.9 | GO:1901509 | regulation of endothelial tube morphogenesis(GO:1901509) |
| 2.5 | 25.3 | GO:0009128 | purine nucleoside monophosphate catabolic process(GO:0009128) |
| 2.5 | 10.1 | GO:1990834 | response to odorant(GO:1990834) |
| 2.5 | 47.9 | GO:0043046 | DNA methylation involved in gamete generation(GO:0043046) |
| 2.5 | 47.9 | GO:0010763 | positive regulation of fibroblast migration(GO:0010763) |
| 2.5 | 2.5 | GO:0021781 | glial cell fate commitment(GO:0021781) |
| 2.5 | 2.5 | GO:0061032 | visceral serous pericardium development(GO:0061032) |
| 2.5 | 10.0 | GO:0001767 | establishment of lymphocyte polarity(GO:0001767) |
| 2.5 | 19.8 | GO:1900004 | negative regulation of serine-type endopeptidase activity(GO:1900004) negative regulation of serine-type peptidase activity(GO:1902572) |
| 2.5 | 123.7 | GO:0086010 | membrane depolarization during action potential(GO:0086010) |
| 2.5 | 12.4 | GO:0033504 | floor plate development(GO:0033504) |
| 2.5 | 12.3 | GO:0009134 | nucleoside diphosphate catabolic process(GO:0009134) |
| 2.5 | 22.1 | GO:0007217 | tachykinin receptor signaling pathway(GO:0007217) |
| 2.5 | 7.4 | GO:0006208 | pyrimidine nucleobase catabolic process(GO:0006208) thymine catabolic process(GO:0006210) thymine metabolic process(GO:0019859) |
| 2.5 | 4.9 | GO:0048102 | autophagic cell death(GO:0048102) |
| 2.4 | 31.8 | GO:1900028 | negative regulation of ruffle assembly(GO:1900028) |
| 2.4 | 4.9 | GO:0008354 | germ cell migration(GO:0008354) |
| 2.4 | 12.2 | GO:0002371 | dendritic cell cytokine production(GO:0002371) |
| 2.4 | 9.7 | GO:0060353 | regulation of cell adhesion molecule production(GO:0060353) positive regulation of cell adhesion molecule production(GO:0060355) |
| 2.4 | 19.3 | GO:0046959 | nonassociative learning(GO:0046958) habituation(GO:0046959) |
| 2.4 | 12.1 | GO:0035524 | proline transmembrane transport(GO:0035524) |
| 2.4 | 7.2 | GO:0098935 | dendritic transport(GO:0098935) anterograde dendritic transport(GO:0098937) |
| 2.4 | 2.4 | GO:0014873 | response to muscle activity involved in regulation of muscle adaptation(GO:0014873) |
| 2.4 | 2.4 | GO:0051097 | negative regulation of helicase activity(GO:0051097) |
| 2.4 | 2.4 | GO:1905225 | response to thyrotropin-releasing hormone(GO:1905225) |
| 2.4 | 2.4 | GO:0038003 | opioid receptor signaling pathway(GO:0038003) |
| 2.4 | 21.3 | GO:0060267 | positive regulation of respiratory burst(GO:0060267) |
| 2.4 | 11.8 | GO:0060214 | endocardium formation(GO:0060214) |
| 2.3 | 4.7 | GO:0001574 | ganglioside biosynthetic process(GO:0001574) |
| 2.3 | 30.4 | GO:0021692 | cerebellar Purkinje cell layer morphogenesis(GO:0021692) |
| 2.3 | 63.2 | GO:0010669 | epithelial structure maintenance(GO:0010669) |
| 2.3 | 7.0 | GO:0030886 | negative regulation of myeloid dendritic cell activation(GO:0030886) |
| 2.3 | 4.7 | GO:0051533 | positive regulation of NFAT protein import into nucleus(GO:0051533) |
| 2.3 | 14.0 | GO:0032525 | somite rostral/caudal axis specification(GO:0032525) |
| 2.3 | 16.3 | GO:0010961 | cellular magnesium ion homeostasis(GO:0010961) |
| 2.3 | 16.3 | GO:0034983 | peptidyl-lysine deacetylation(GO:0034983) |
| 2.3 | 7.0 | GO:2001226 | negative regulation of chloride transport(GO:2001226) |
| 2.3 | 67.0 | GO:0032011 | ARF protein signal transduction(GO:0032011) |
| 2.3 | 6.9 | GO:1904204 | regulation of skeletal muscle hypertrophy(GO:1904204) |
| 2.3 | 9.2 | GO:0010765 | positive regulation of sodium ion transport(GO:0010765) |
| 2.3 | 4.6 | GO:0003358 | noradrenergic neuron development(GO:0003358) |
| 2.3 | 38.9 | GO:0046069 | cGMP catabolic process(GO:0046069) |
| 2.3 | 11.4 | GO:0072366 | regulation of cellular ketone metabolic process by positive regulation of transcription from RNA polymerase II promoter(GO:0072366) |
| 2.3 | 9.1 | GO:0002357 | defense response to tumor cell(GO:0002357) |
| 2.3 | 25.1 | GO:2000169 | negative regulation of peptidyl-cysteine S-nitrosylation(GO:1902083) regulation of peptidyl-cysteine S-nitrosylation(GO:2000169) |
| 2.3 | 2.3 | GO:0019336 | phenol-containing compound catabolic process(GO:0019336) |
| 2.3 | 6.8 | GO:0009386 | translational attenuation(GO:0009386) |
| 2.3 | 38.4 | GO:0007130 | synaptonemal complex assembly(GO:0007130) |
| 2.3 | 11.3 | GO:0032489 | regulation of Cdc42 protein signal transduction(GO:0032489) |
| 2.2 | 6.7 | GO:0021538 | epithalamus development(GO:0021538) habenula development(GO:0021986) |
| 2.2 | 6.7 | GO:0072134 | nephrogenic mesenchyme morphogenesis(GO:0072134) |
| 2.2 | 13.3 | GO:0035093 | spermatogenesis, exchange of chromosomal proteins(GO:0035093) |
| 2.2 | 44.1 | GO:1904778 | regulation of protein localization to cell cortex(GO:1904776) positive regulation of protein localization to cell cortex(GO:1904778) |
| 2.2 | 4.4 | GO:0071279 | cellular response to cobalt ion(GO:0071279) |
| 2.2 | 6.6 | GO:0070105 | positive regulation of interleukin-6-mediated signaling pathway(GO:0070105) |
| 2.2 | 6.5 | GO:0098928 | presynaptic signal transduction(GO:0098928) presynapse to nucleus signaling pathway(GO:0099526) |
| 2.2 | 6.5 | GO:0061026 | cardiac muscle tissue regeneration(GO:0061026) |
| 2.2 | 8.6 | GO:2000195 | negative regulation of female gonad development(GO:2000195) |
| 2.1 | 10.7 | GO:0001555 | oocyte growth(GO:0001555) |
| 2.1 | 15.0 | GO:0070278 | extracellular matrix constituent secretion(GO:0070278) |
| 2.1 | 21.3 | GO:0030322 | stabilization of membrane potential(GO:0030322) |
| 2.1 | 6.4 | GO:0099404 | negative regulation of maintenance of sister chromatid cohesion(GO:0034092) negative regulation of maintenance of mitotic sister chromatid cohesion(GO:0034183) maintenance of mitotic sister chromatid cohesion, telomeric(GO:0099403) mitotic sister chromatid cohesion, telomeric(GO:0099404) regulation of maintenance of mitotic sister chromatid cohesion, telomeric(GO:1904907) negative regulation of maintenance of mitotic sister chromatid cohesion, telomeric(GO:1904908) |
| 2.1 | 10.6 | GO:0006127 | glycerophosphate shuttle(GO:0006127) |
| 2.1 | 10.6 | GO:0015808 | L-alanine transport(GO:0015808) |
| 2.1 | 8.5 | GO:0060159 | regulation of dopamine receptor signaling pathway(GO:0060159) |
| 2.1 | 4.2 | GO:1901074 | regulation of engulfment of apoptotic cell(GO:1901074) |
| 2.1 | 10.5 | GO:0045629 | negative regulation of T-helper 2 cell differentiation(GO:0045629) |
| 2.1 | 6.2 | GO:0014060 | regulation of epinephrine secretion(GO:0014060) negative regulation of epinephrine secretion(GO:0032811) epinephrine secretion(GO:0048242) activation of MAPK activity by adrenergic receptor signaling pathway(GO:0071883) |
| 2.1 | 2.1 | GO:0072364 | regulation of cellular ketone metabolic process by regulation of transcription from RNA polymerase II promoter(GO:0072364) |
| 2.1 | 10.4 | GO:1903960 | negative regulation of anion transmembrane transport(GO:1903960) |
| 2.1 | 57.7 | GO:0046676 | negative regulation of insulin secretion(GO:0046676) |
| 2.1 | 6.2 | GO:1990637 | response to prolactin(GO:1990637) |
| 2.1 | 2.1 | GO:0044333 | Wnt signaling pathway involved in digestive tract morphogenesis(GO:0044333) |
| 2.1 | 4.1 | GO:1904379 | protein localization to cytosolic proteasome complex(GO:1904327) protein localization to cytosolic proteasome complex involved in ERAD pathway(GO:1904379) |
| 2.0 | 2.0 | GO:0007210 | serotonin receptor signaling pathway(GO:0007210) |
| 2.0 | 16.3 | GO:0019732 | antifungal humoral response(GO:0019732) |
| 2.0 | 2.0 | GO:1903413 | cellular response to bile acid(GO:1903413) |
| 2.0 | 12.2 | GO:2000346 | negative regulation of hepatocyte proliferation(GO:2000346) |
| 2.0 | 6.1 | GO:0003219 | cardiac right ventricle formation(GO:0003219) |
| 2.0 | 6.1 | GO:0005988 | lactose metabolic process(GO:0005988) lactose biosynthetic process(GO:0005989) |
| 2.0 | 16.2 | GO:0046604 | positive regulation of mitotic centrosome separation(GO:0046604) |
| 2.0 | 20.1 | GO:2000427 | positive regulation of apoptotic cell clearance(GO:2000427) |
| 2.0 | 14.1 | GO:0010890 | positive regulation of sequestering of triglyceride(GO:0010890) |
| 2.0 | 6.0 | GO:0021775 | smoothened signaling pathway involved in ventral spinal cord interneuron specification(GO:0021775) smoothened signaling pathway involved in spinal cord motor neuron cell fate specification(GO:0021776) subpallium cell proliferation in forebrain(GO:0022012) lateral ganglionic eminence cell proliferation(GO:0022018) lambdoid suture morphogenesis(GO:0060366) sagittal suture morphogenesis(GO:0060367) anterior semicircular canal development(GO:0060873) lateral semicircular canal development(GO:0060875) |
| 2.0 | 14.0 | GO:0050882 | voluntary musculoskeletal movement(GO:0050882) |
| 2.0 | 2.0 | GO:0014004 | microglia differentiation(GO:0014004) microglia development(GO:0014005) |
| 2.0 | 12.0 | GO:0016926 | protein desumoylation(GO:0016926) |
| 2.0 | 16.0 | GO:1900748 | positive regulation of vascular endothelial growth factor signaling pathway(GO:1900748) |
| 2.0 | 9.9 | GO:0097338 | response to clozapine(GO:0097338) |
| 2.0 | 4.0 | GO:0042415 | norepinephrine metabolic process(GO:0042415) |
| 2.0 | 2.0 | GO:0051127 | positive regulation of actin nucleation(GO:0051127) |
| 2.0 | 3.9 | GO:2000253 | positive regulation of feeding behavior(GO:2000253) |
| 2.0 | 7.9 | GO:1900738 | positive regulation of phospholipase C-activating G-protein coupled receptor signaling pathway(GO:1900738) |
| 2.0 | 13.7 | GO:0018095 | protein polyglutamylation(GO:0018095) |
| 2.0 | 3.9 | GO:0038162 | erythropoietin-mediated signaling pathway(GO:0038162) |
| 1.9 | 9.7 | GO:0060830 | ciliary receptor clustering involved in smoothened signaling pathway(GO:0060830) |
| 1.9 | 1.9 | GO:0001992 | regulation of systemic arterial blood pressure by vasopressin(GO:0001992) |
| 1.9 | 17.4 | GO:0032482 | Rab protein signal transduction(GO:0032482) |
| 1.9 | 15.4 | GO:0046710 | GDP metabolic process(GO:0046710) |
| 1.9 | 1.9 | GO:0010764 | negative regulation of fibroblast migration(GO:0010764) |
| 1.9 | 3.8 | GO:1902949 | positive regulation of tau-protein kinase activity(GO:1902949) |
| 1.9 | 7.7 | GO:0042360 | vitamin E metabolic process(GO:0042360) |
| 1.9 | 9.5 | GO:0010829 | negative regulation of glucose transport(GO:0010829) |
| 1.9 | 13.4 | GO:0070127 | tRNA aminoacylation for mitochondrial protein translation(GO:0070127) |
| 1.9 | 57.1 | GO:0097503 | sialylation(GO:0097503) |
| 1.9 | 7.6 | GO:0019470 | 4-hydroxyproline catabolic process(GO:0019470) |
| 1.9 | 20.9 | GO:0035878 | nail development(GO:0035878) |
| 1.9 | 9.4 | GO:0048630 | skeletal muscle tissue growth(GO:0048630) |
| 1.9 | 3.8 | GO:0046208 | spermine catabolic process(GO:0046208) |
| 1.9 | 22.5 | GO:0070327 | thyroid hormone transport(GO:0070327) |
| 1.9 | 9.4 | GO:2000535 | regulation of entry of bacterium into host cell(GO:2000535) |
| 1.9 | 5.6 | GO:0002865 | negative regulation of acute inflammatory response to antigenic stimulus(GO:0002865) negative regulation of hypersensitivity(GO:0002884) |
| 1.9 | 1.9 | GO:0090403 | oxidative stress-induced premature senescence(GO:0090403) |
| 1.9 | 13.0 | GO:2000766 | negative regulation of cytoplasmic translation(GO:2000766) |
| 1.9 | 7.4 | GO:0072092 | ureteric bud invasion(GO:0072092) |
| 1.8 | 16.5 | GO:0030007 | cellular potassium ion homeostasis(GO:0030007) |
| 1.8 | 3.6 | GO:0046113 | nucleobase catabolic process(GO:0046113) |
| 1.8 | 18.2 | GO:1990573 | potassium ion import across plasma membrane(GO:1990573) |
| 1.8 | 9.1 | GO:0042754 | negative regulation of circadian rhythm(GO:0042754) |
| 1.8 | 5.4 | GO:0008065 | establishment of blood-nerve barrier(GO:0008065) |
| 1.8 | 1.8 | GO:0007354 | zygotic determination of anterior/posterior axis, embryo(GO:0007354) |
| 1.8 | 9.0 | GO:0071436 | sodium ion export(GO:0071436) |
| 1.8 | 10.8 | GO:0010459 | negative regulation of heart rate(GO:0010459) |
| 1.8 | 9.0 | GO:0048104 | establishment of body hair or bristle planar orientation(GO:0048104) establishment of body hair planar orientation(GO:0048105) |
| 1.8 | 19.8 | GO:0006030 | chitin metabolic process(GO:0006030) chitin catabolic process(GO:0006032) |
| 1.8 | 10.8 | GO:0035603 | fibroblast growth factor receptor signaling pathway involved in negative regulation of apoptotic process in bone marrow(GO:0035602) fibroblast growth factor receptor signaling pathway involved in hemopoiesis(GO:0035603) fibroblast growth factor receptor signaling pathway involved in positive regulation of cell proliferation in bone marrow(GO:0035604) |
| 1.8 | 10.7 | GO:0061302 | smooth muscle cell-matrix adhesion(GO:0061302) |
| 1.8 | 30.4 | GO:0006646 | phosphatidylethanolamine biosynthetic process(GO:0006646) |
| 1.8 | 1.8 | GO:0098712 | L-glutamate import across plasma membrane(GO:0098712) |
| 1.8 | 1.8 | GO:0021798 | forebrain dorsal/ventral pattern formation(GO:0021798) |
| 1.8 | 10.6 | GO:0007506 | gonadal mesoderm development(GO:0007506) |
| 1.8 | 1.8 | GO:0006562 | proline catabolic process(GO:0006562) |
| 1.8 | 3.5 | GO:0032499 | positive regulation of antigen processing and presentation of peptide or polysaccharide antigen via MHC class II(GO:0002582) positive regulation of antigen processing and presentation of peptide antigen(GO:0002585) positive regulation of antigen processing and presentation of peptide antigen via MHC class II(GO:0002588) detection of peptidoglycan(GO:0032499) |
| 1.8 | 5.3 | GO:0032466 | negative regulation of cytokinesis(GO:0032466) |
| 1.8 | 7.0 | GO:0003275 | apoptotic process involved in outflow tract morphogenesis(GO:0003275) regulation of apoptotic process involved in outflow tract morphogenesis(GO:1902256) |
| 1.8 | 12.3 | GO:0015812 | gamma-aminobutyric acid transport(GO:0015812) |
| 1.7 | 3.5 | GO:0090187 | positive regulation of pancreatic juice secretion(GO:0090187) |
| 1.7 | 5.2 | GO:0051013 | microtubule severing(GO:0051013) |
| 1.7 | 1.7 | GO:0060903 | positive regulation of meiosis I(GO:0060903) |
| 1.7 | 8.6 | GO:0051694 | pointed-end actin filament capping(GO:0051694) |
| 1.7 | 5.2 | GO:0036072 | intramembranous ossification(GO:0001957) direct ossification(GO:0036072) |
| 1.7 | 6.9 | GO:0051029 | rRNA transport(GO:0051029) |
| 1.7 | 3.4 | GO:0071921 | establishment of sister chromatid cohesion(GO:0034085) cohesin loading(GO:0071921) regulation of cohesin loading(GO:0071922) |
| 1.7 | 39.2 | GO:0036152 | phosphatidylethanolamine acyl-chain remodeling(GO:0036152) |
| 1.7 | 56.2 | GO:0046928 | regulation of neurotransmitter secretion(GO:0046928) |
| 1.7 | 5.1 | GO:0044565 | dendritic cell proliferation(GO:0044565) |
| 1.7 | 1.7 | GO:0060029 | convergent extension involved in organogenesis(GO:0060029) |
| 1.7 | 8.5 | GO:1903361 | protein localization to basolateral plasma membrane(GO:1903361) |
| 1.7 | 40.5 | GO:0018146 | keratan sulfate biosynthetic process(GO:0018146) |
| 1.7 | 15.2 | GO:1900112 | regulation of histone H3-K9 trimethylation(GO:1900112) |
| 1.7 | 13.5 | GO:0006384 | transcription initiation from RNA polymerase III promoter(GO:0006384) |
| 1.7 | 21.9 | GO:0042354 | fucose catabolic process(GO:0019317) L-fucose metabolic process(GO:0042354) L-fucose catabolic process(GO:0042355) |
| 1.7 | 33.5 | GO:0042749 | regulation of circadian sleep/wake cycle(GO:0042749) |
| 1.7 | 10.0 | GO:1990253 | cellular response to leucine starvation(GO:1990253) |
| 1.7 | 5.0 | GO:1990641 | response to iron ion starvation(GO:1990641) |
| 1.7 | 9.9 | GO:0045722 | positive regulation of gluconeogenesis(GO:0045722) |
| 1.7 | 9.9 | GO:0070131 | positive regulation of mitochondrial translation(GO:0070131) |
| 1.6 | 9.9 | GO:0032468 | Golgi calcium ion homeostasis(GO:0032468) |
| 1.6 | 4.9 | GO:0045085 | negative regulation of interleukin-2 biosynthetic process(GO:0045085) |
| 1.6 | 9.9 | GO:0051012 | microtubule sliding(GO:0051012) |
| 1.6 | 6.6 | GO:0071802 | negative regulation of podosome assembly(GO:0071802) |
| 1.6 | 19.7 | GO:0006600 | creatine metabolic process(GO:0006600) |
| 1.6 | 16.3 | GO:1901525 | negative regulation of macromitophagy(GO:1901525) |
| 1.6 | 4.9 | GO:0021965 | spinal cord ventral commissure morphogenesis(GO:0021965) |
| 1.6 | 1.6 | GO:0061743 | motor learning(GO:0061743) |
| 1.6 | 4.9 | GO:0006540 | glutamate decarboxylation to succinate(GO:0006540) |
| 1.6 | 6.4 | GO:0010157 | response to chlorate(GO:0010157) |
| 1.6 | 4.8 | GO:1904751 | positive regulation of protein localization to nucleolus(GO:1904751) |
| 1.6 | 17.6 | GO:1904261 | regulation of basement membrane assembly involved in embryonic body morphogenesis(GO:1904259) positive regulation of basement membrane assembly involved in embryonic body morphogenesis(GO:1904261) basement membrane assembly involved in embryonic body morphogenesis(GO:2001197) |
| 1.6 | 1.6 | GO:0021684 | cerebellar granular layer formation(GO:0021684) cerebellar granule cell differentiation(GO:0021707) |
| 1.6 | 11.1 | GO:0097369 | sodium ion import(GO:0097369) sodium ion import across plasma membrane(GO:0098719) sodium ion import into cell(GO:1990118) |
| 1.6 | 7.9 | GO:1901098 | positive regulation of autophagosome maturation(GO:1901098) |
| 1.6 | 3.2 | GO:0007206 | phospholipase C-activating G-protein coupled glutamate receptor signaling pathway(GO:0007206) |
| 1.6 | 4.8 | GO:0002143 | tRNA wobble position uridine thiolation(GO:0002143) |
| 1.6 | 9.5 | GO:0031953 | negative regulation of protein autophosphorylation(GO:0031953) |
| 1.6 | 11.1 | GO:0038065 | collagen-activated signaling pathway(GO:0038065) |
| 1.6 | 4.8 | GO:0051295 | establishment of meiotic spindle localization(GO:0051295) |
| 1.6 | 23.7 | GO:1904714 | regulation of chaperone-mediated autophagy(GO:1904714) |
| 1.6 | 3.2 | GO:1900220 | semaphorin-plexin signaling pathway involved in bone trabecula morphogenesis(GO:1900220) |
| 1.6 | 7.9 | GO:0046167 | glycerol-3-phosphate metabolic process(GO:0006072) glycerol-3-phosphate biosynthetic process(GO:0046167) |
| 1.6 | 17.3 | GO:0030321 | transepithelial chloride transport(GO:0030321) |
| 1.6 | 4.7 | GO:0006566 | threonine metabolic process(GO:0006566) |
| 1.6 | 6.3 | GO:0007616 | long-term memory(GO:0007616) |
| 1.6 | 4.7 | GO:0010587 | miRNA catabolic process(GO:0010587) |
| 1.6 | 3.1 | GO:1900227 | positive regulation of NLRP3 inflammasome complex assembly(GO:1900227) |
| 1.6 | 7.8 | GO:2000857 | positive regulation of mineralocorticoid secretion(GO:2000857) positive regulation of aldosterone secretion(GO:2000860) |
| 1.6 | 9.3 | GO:0051386 | regulation of neurotrophin TRK receptor signaling pathway(GO:0051386) |
| 1.6 | 1.6 | GO:0032328 | alanine transport(GO:0032328) |
| 1.6 | 1.6 | GO:0043435 | response to corticotropin-releasing hormone(GO:0043435) cellular response to corticotropin-releasing hormone stimulus(GO:0071376) |
| 1.5 | 13.9 | GO:0080182 | histone H3-K4 trimethylation(GO:0080182) |
| 1.5 | 1.5 | GO:0046533 | negative regulation of photoreceptor cell differentiation(GO:0046533) |
| 1.5 | 1.5 | GO:0043589 | skin morphogenesis(GO:0043589) |
| 1.5 | 3.0 | GO:0071907 | determination of digestive tract left/right asymmetry(GO:0071907) |
| 1.5 | 1.5 | GO:0021859 | pyramidal neuron differentiation(GO:0021859) pyramidal neuron development(GO:0021860) |
| 1.5 | 16.6 | GO:0042417 | dopamine metabolic process(GO:0042417) |
| 1.5 | 9.1 | GO:0035507 | regulation of myosin-light-chain-phosphatase activity(GO:0035507) |
| 1.5 | 9.0 | GO:0001554 | luteolysis(GO:0001554) |
| 1.5 | 12.0 | GO:0001696 | gastric acid secretion(GO:0001696) |
| 1.5 | 19.3 | GO:0070208 | protein heterotrimerization(GO:0070208) |
| 1.5 | 17.8 | GO:1900747 | negative regulation of vascular endothelial growth factor signaling pathway(GO:1900747) negative regulation of cellular response to vascular endothelial growth factor stimulus(GO:1902548) |
| 1.5 | 5.9 | GO:2000463 | positive regulation of excitatory postsynaptic potential(GO:2000463) |
| 1.5 | 10.2 | GO:0043615 | astrocyte cell migration(GO:0043615) |
| 1.5 | 20.5 | GO:0006983 | ER overload response(GO:0006983) |
| 1.5 | 2.9 | GO:2001258 | negative regulation of cation channel activity(GO:2001258) |
| 1.5 | 4.4 | GO:0006982 | response to lipid hydroperoxide(GO:0006982) |
| 1.4 | 11.6 | GO:0035413 | positive regulation of catenin import into nucleus(GO:0035413) |
| 1.4 | 14.5 | GO:0045745 | positive regulation of G-protein coupled receptor protein signaling pathway(GO:0045745) |
| 1.4 | 4.3 | GO:0097090 | presynaptic membrane organization(GO:0097090) |
| 1.4 | 28.8 | GO:0021988 | olfactory lobe development(GO:0021988) |
| 1.4 | 7.2 | GO:0045023 | G0 to G1 transition(GO:0045023) |
| 1.4 | 10.1 | GO:0070294 | renal sodium ion absorption(GO:0070294) |
| 1.4 | 7.2 | GO:0045872 | positive regulation of rhodopsin gene expression(GO:0045872) |
| 1.4 | 18.5 | GO:1901223 | negative regulation of NIK/NF-kappaB signaling(GO:1901223) |
| 1.4 | 62.2 | GO:0007212 | dopamine receptor signaling pathway(GO:0007212) |
| 1.4 | 33.8 | GO:0021846 | cell proliferation in forebrain(GO:0021846) |
| 1.4 | 7.0 | GO:0034128 | negative regulation of MyD88-independent toll-like receptor signaling pathway(GO:0034128) |
| 1.4 | 12.5 | GO:0098535 | de novo centriole assembly(GO:0098535) |
| 1.4 | 1.4 | GO:1900106 | hyaluranon cable assembly(GO:0036118) regulation of hyaluranon cable assembly(GO:1900104) positive regulation of hyaluranon cable assembly(GO:1900106) |
| 1.4 | 13.8 | GO:1900025 | negative regulation of substrate adhesion-dependent cell spreading(GO:1900025) |
| 1.4 | 6.9 | GO:0060763 | mammary duct terminal end bud growth(GO:0060763) |
| 1.4 | 2.7 | GO:0070634 | transepithelial ammonium transport(GO:0070634) |
| 1.4 | 1.4 | GO:0048016 | inositol phosphate-mediated signaling(GO:0048016) |
| 1.4 | 12.2 | GO:0003351 | epithelial cilium movement(GO:0003351) |
| 1.3 | 4.0 | GO:1901053 | sarcosine metabolic process(GO:1901052) sarcosine catabolic process(GO:1901053) |
| 1.3 | 224.7 | GO:0071805 | cellular potassium ion transport(GO:0071804) potassium ion transmembrane transport(GO:0071805) |
| 1.3 | 4.0 | GO:0071812 | regulation of fever generation by regulation of prostaglandin secretion(GO:0071810) positive regulation of fever generation by positive regulation of prostaglandin secretion(GO:0071812) positive regulation of ERK1 and ERK2 cascade via TNFSF11-mediated signaling(GO:0071848) regulation of fever generation by prostaglandin secretion(GO:0100009) |
| 1.3 | 2.6 | GO:0036515 | serotonergic neuron axon guidance(GO:0036515) |
| 1.3 | 10.6 | GO:1904262 | negative regulation of TORC1 signaling(GO:1904262) |
| 1.3 | 13.2 | GO:0051481 | negative regulation of cytosolic calcium ion concentration(GO:0051481) |
| 1.3 | 18.4 | GO:0060907 | positive regulation of macrophage cytokine production(GO:0060907) |
| 1.3 | 5.2 | GO:0031627 | telomeric loop formation(GO:0031627) |
| 1.3 | 5.2 | GO:0046968 | peptide antigen transport(GO:0046968) |
| 1.3 | 7.8 | GO:0033152 | immunoglobulin V(D)J recombination(GO:0033152) |
| 1.3 | 9.1 | GO:0060155 | platelet dense granule organization(GO:0060155) |
| 1.3 | 9.1 | GO:1904354 | negative regulation of telomere capping(GO:1904354) |
| 1.3 | 5.2 | GO:0071418 | cellular response to amine stimulus(GO:0071418) |
| 1.3 | 5.2 | GO:1904428 | negative regulation of tubulin deacetylation(GO:1904428) |
| 1.3 | 1.3 | GO:0072093 | metanephric renal vesicle formation(GO:0072093) |
| 1.3 | 9.0 | GO:0097500 | receptor localization to nonmotile primary cilium(GO:0097500) |
| 1.3 | 11.6 | GO:0060314 | regulation of ryanodine-sensitive calcium-release channel activity(GO:0060314) |
| 1.3 | 6.4 | GO:0008063 | Toll signaling pathway(GO:0008063) |
| 1.3 | 10.2 | GO:0090073 | positive regulation of protein homodimerization activity(GO:0090073) |
| 1.3 | 3.8 | GO:0008626 | granzyme-mediated apoptotic signaling pathway(GO:0008626) |
| 1.3 | 6.3 | GO:2001295 | malonyl-CoA biosynthetic process(GO:2001295) |
| 1.3 | 7.5 | GO:0019509 | L-methionine biosynthetic process from methylthioadenosine(GO:0019509) |
| 1.2 | 2.5 | GO:0099550 | trans-synaptic signalling, modulating synaptic transmission(GO:0099550) |
| 1.2 | 7.4 | GO:0018343 | protein farnesylation(GO:0018343) |
| 1.2 | 8.7 | GO:0070164 | negative regulation of adiponectin secretion(GO:0070164) |
| 1.2 | 13.6 | GO:1990035 | calcium ion import across plasma membrane(GO:0098703) calcium ion import into cell(GO:1990035) |
| 1.2 | 6.2 | GO:0006772 | thiamine metabolic process(GO:0006772) |
| 1.2 | 7.4 | GO:0051122 | hepoxilin metabolic process(GO:0051121) hepoxilin biosynthetic process(GO:0051122) |
| 1.2 | 11.1 | GO:0043249 | erythrocyte maturation(GO:0043249) |
| 1.2 | 11.0 | GO:0060831 | smoothened signaling pathway involved in dorsal/ventral neural tube patterning(GO:0060831) |
| 1.2 | 4.9 | GO:0090074 | negative regulation of protein homodimerization activity(GO:0090074) |
| 1.2 | 81.5 | GO:1903779 | regulation of cardiac conduction(GO:1903779) |
| 1.2 | 8.5 | GO:0045007 | depurination(GO:0045007) |
| 1.2 | 19.4 | GO:0034389 | lipid particle organization(GO:0034389) |
| 1.2 | 3.6 | GO:1902857 | positive regulation of nonmotile primary cilium assembly(GO:1902857) |
| 1.2 | 2.4 | GO:0022410 | circadian sleep/wake cycle process(GO:0022410) |
| 1.2 | 1.2 | GO:0006531 | aspartate metabolic process(GO:0006531) |
| 1.2 | 2.4 | GO:0014744 | positive regulation of muscle adaptation(GO:0014744) |
| 1.2 | 1.2 | GO:1904017 | cellular response to Thyroglobulin triiodothyronine(GO:1904017) |
| 1.2 | 4.7 | GO:0021794 | thalamus development(GO:0021794) |
| 1.2 | 34.1 | GO:0048854 | brain morphogenesis(GO:0048854) |
| 1.2 | 15.2 | GO:0034242 | negative regulation of syncytium formation by plasma membrane fusion(GO:0034242) |
| 1.2 | 8.2 | GO:0048011 | neurotrophin TRK receptor signaling pathway(GO:0048011) |
| 1.2 | 25.7 | GO:0098868 | bone growth(GO:0098868) |
| 1.2 | 3.5 | GO:1902283 | negative regulation of primary amine oxidase activity(GO:1902283) |
| 1.2 | 15.0 | GO:0045879 | negative regulation of smoothened signaling pathway(GO:0045879) |
| 1.2 | 8.1 | GO:0055089 | fatty acid homeostasis(GO:0055089) |
| 1.2 | 28.9 | GO:0007189 | adenylate cyclase-activating G-protein coupled receptor signaling pathway(GO:0007189) |
| 1.2 | 5.8 | GO:0060718 | chorionic trophoblast cell differentiation(GO:0060718) |
| 1.1 | 2.3 | GO:0003343 | proepicardium development(GO:0003342) septum transversum development(GO:0003343) regulation of intracellular mRNA localization(GO:1904580) positive regulation of intracellular mRNA localization(GO:1904582) |
| 1.1 | 14.9 | GO:0097484 | dendrite extension(GO:0097484) |
| 1.1 | 5.7 | GO:0035021 | negative regulation of Rac protein signal transduction(GO:0035021) |
| 1.1 | 4.6 | GO:0014807 | regulation of somitogenesis(GO:0014807) |
| 1.1 | 2.3 | GO:0086021 | SA node cell to atrial cardiac muscle cell communication by electrical coupling(GO:0086021) AV node cell to bundle of His cell communication by electrical coupling(GO:0086053) |
| 1.1 | 3.4 | GO:0060052 | neurofilament cytoskeleton organization(GO:0060052) |
| 1.1 | 5.6 | GO:0034959 | substance P catabolic process(GO:0010814) calcitonin catabolic process(GO:0010816) endothelin maturation(GO:0034959) |
| 1.1 | 3.4 | GO:0016256 | N-glycan processing to lysosome(GO:0016256) |
| 1.1 | 4.5 | GO:1902231 | positive regulation of intrinsic apoptotic signaling pathway in response to DNA damage(GO:1902231) |
| 1.1 | 77.8 | GO:0001578 | microtubule bundle formation(GO:0001578) |
| 1.1 | 1.1 | GO:0019065 | receptor-mediated endocytosis of virus by host cell(GO:0019065) endocytosis involved in viral entry into host cell(GO:0075509) |
| 1.1 | 3.4 | GO:0010025 | wax biosynthetic process(GO:0010025) wax metabolic process(GO:0010166) |
| 1.1 | 4.5 | GO:0002545 | chronic inflammatory response to non-antigenic stimulus(GO:0002545) regulation of chronic inflammatory response to non-antigenic stimulus(GO:0002880) negative regulation of chronic inflammatory response to non-antigenic stimulus(GO:0002881) |
| 1.1 | 9.0 | GO:0033129 | positive regulation of histone phosphorylation(GO:0033129) |
| 1.1 | 1.1 | GO:1900109 | regulation of histone H3-K9 dimethylation(GO:1900109) |
| 1.1 | 4.5 | GO:0030903 | notochord development(GO:0030903) |
| 1.1 | 21.2 | GO:0097120 | receptor localization to synapse(GO:0097120) |
| 1.1 | 8.9 | GO:0021516 | dorsal spinal cord development(GO:0021516) |
| 1.1 | 3.3 | GO:0061107 | seminal vesicle development(GO:0061107) |
| 1.1 | 6.6 | GO:0046092 | deoxycytidine metabolic process(GO:0046092) |
| 1.1 | 15.5 | GO:0090141 | positive regulation of mitochondrial fission(GO:0090141) |
| 1.1 | 8.8 | GO:0007256 | activation of JNKK activity(GO:0007256) |
| 1.1 | 6.6 | GO:0034638 | phosphatidylcholine catabolic process(GO:0034638) |
| 1.1 | 2.2 | GO:0050720 | interleukin-1 beta biosynthetic process(GO:0050720) |
| 1.1 | 1.1 | GO:0014916 | regulation of lung blood pressure(GO:0014916) |
| 1.1 | 1.1 | GO:1901491 | negative regulation of lymphangiogenesis(GO:1901491) |
| 1.1 | 8.7 | GO:0032957 | inositol trisphosphate metabolic process(GO:0032957) |
| 1.1 | 15.2 | GO:0035249 | synaptic transmission, glutamatergic(GO:0035249) |
| 1.1 | 9.7 | GO:0042758 | long-chain fatty acid catabolic process(GO:0042758) |
| 1.1 | 6.5 | GO:0016081 | synaptic vesicle docking(GO:0016081) |
| 1.1 | 3.2 | GO:0090285 | regulation of protein glycosylation in Golgi(GO:0090283) negative regulation of protein glycosylation in Golgi(GO:0090285) |
| 1.1 | 2.2 | GO:2001271 | regulation of cysteine-type endopeptidase activity involved in execution phase of apoptosis(GO:2001270) negative regulation of cysteine-type endopeptidase activity involved in execution phase of apoptosis(GO:2001271) |
| 1.1 | 1.1 | GO:1903056 | regulation of melanosome organization(GO:1903056) |
| 1.1 | 4.3 | GO:0002215 | defense response to nematode(GO:0002215) |
| 1.1 | 3.2 | GO:1901731 | positive regulation of platelet aggregation(GO:1901731) |
| 1.1 | 19.1 | GO:0050812 | regulation of acyl-CoA biosynthetic process(GO:0050812) |
| 1.1 | 14.8 | GO:2001204 | regulation of osteoclast development(GO:2001204) |
| 1.1 | 3.2 | GO:0010934 | macrophage cytokine production(GO:0010934) |
| 1.0 | 16.6 | GO:0070314 | G1 to G0 transition(GO:0070314) |
| 1.0 | 3.1 | GO:0042074 | cell migration involved in gastrulation(GO:0042074) |
| 1.0 | 3.1 | GO:0043321 | regulation of natural killer cell degranulation(GO:0043321) positive regulation of natural killer cell degranulation(GO:0043323) |
| 1.0 | 2.1 | GO:0051684 | maintenance of Golgi location(GO:0051684) |
| 1.0 | 32.6 | GO:0050650 | chondroitin sulfate proteoglycan biosynthetic process(GO:0050650) |
| 1.0 | 8.1 | GO:0010533 | regulation of activation of Janus kinase activity(GO:0010533) |
| 1.0 | 16.3 | GO:0018345 | protein palmitoylation(GO:0018345) |
| 1.0 | 2.0 | GO:0036149 | phosphatidylinositol acyl-chain remodeling(GO:0036149) |
| 1.0 | 4.0 | GO:0090219 | negative regulation of lipid kinase activity(GO:0090219) |
| 1.0 | 1.0 | GO:1903963 | arachidonic acid secretion(GO:0050482) arachidonate transport(GO:1903963) |
| 1.0 | 11.1 | GO:0014029 | neural crest formation(GO:0014029) |
| 1.0 | 8.1 | GO:0010359 | regulation of anion channel activity(GO:0010359) |
| 1.0 | 2.0 | GO:0015870 | acetylcholine transport(GO:0015870) |
| 1.0 | 3.0 | GO:0016322 | neuron remodeling(GO:0016322) |
| 1.0 | 13.8 | GO:0014047 | glutamate secretion(GO:0014047) |
| 1.0 | 2.0 | GO:0035973 | aggrephagy(GO:0035973) |
| 1.0 | 3.9 | GO:0061187 | regulation of chromatin silencing at rDNA(GO:0061187) negative regulation of chromatin silencing at rDNA(GO:0061188) |
| 1.0 | 3.9 | GO:0048243 | norepinephrine secretion(GO:0048243) |
| 1.0 | 8.8 | GO:0007625 | grooming behavior(GO:0007625) |
| 1.0 | 10.8 | GO:0060050 | positive regulation of protein glycosylation(GO:0060050) |
| 1.0 | 2.9 | GO:0035582 | sequestering of BMP in extracellular matrix(GO:0035582) |
| 1.0 | 1.9 | GO:0015855 | pyrimidine nucleobase transport(GO:0015855) purine nucleobase transmembrane transport(GO:1904823) |
| 1.0 | 3.9 | GO:0021615 | glossopharyngeal nerve morphogenesis(GO:0021615) |
| 1.0 | 4.8 | GO:0061737 | leukotriene signaling pathway(GO:0061737) |
| 1.0 | 15.4 | GO:2001275 | positive regulation of glucose import in response to insulin stimulus(GO:2001275) |
| 1.0 | 42.2 | GO:0015701 | bicarbonate transport(GO:0015701) |
| 1.0 | 1.9 | GO:0090024 | negative regulation of granulocyte chemotaxis(GO:0071623) negative regulation of neutrophil chemotaxis(GO:0090024) negative regulation of neutrophil migration(GO:1902623) |
| 1.0 | 4.8 | GO:2000576 | positive regulation of microtubule motor activity(GO:2000576) regulation of ATP-dependent microtubule motor activity, plus-end-directed(GO:2000580) positive regulation of ATP-dependent microtubule motor activity, plus-end-directed(GO:2000582) |
| 0.9 | 1.9 | GO:0051919 | positive regulation of fibrinolysis(GO:0051919) |
| 0.9 | 1.9 | GO:0032417 | regulation of sodium:proton antiporter activity(GO:0032415) positive regulation of sodium:proton antiporter activity(GO:0032417) |
| 0.9 | 4.7 | GO:0006655 | phosphatidylglycerol biosynthetic process(GO:0006655) |
| 0.9 | 10.4 | GO:0048251 | elastic fiber assembly(GO:0048251) |
| 0.9 | 2.8 | GO:2000852 | corticosterone secretion(GO:0035934) regulation of corticosterone secretion(GO:2000852) |
| 0.9 | 5.6 | GO:0035617 | stress granule disassembly(GO:0035617) |
| 0.9 | 0.9 | GO:1903365 | regulation of fear response(GO:1903365) regulation of behavioral fear response(GO:2000822) |
| 0.9 | 1.9 | GO:1903031 | regulation of microtubule plus-end binding(GO:1903031) positive regulation of microtubule plus-end binding(GO:1903033) positive regulation of microtubule binding(GO:1904528) |
| 0.9 | 0.9 | GO:2000546 | positive regulation of cell chemotaxis to fibroblast growth factor(GO:1904849) positive regulation of endothelial cell chemotaxis to fibroblast growth factor(GO:2000546) |
| 0.9 | 1.8 | GO:0014827 | intestine smooth muscle contraction(GO:0014827) |
| 0.9 | 0.9 | GO:0033076 | isoquinoline alkaloid metabolic process(GO:0033076) |
| 0.9 | 9.2 | GO:0043031 | negative regulation of macrophage activation(GO:0043031) |
| 0.9 | 2.7 | GO:0060290 | transdifferentiation(GO:0060290) |
| 0.9 | 0.9 | GO:2000591 | positive regulation of metanephric mesenchymal cell migration by platelet-derived growth factor receptor-beta signaling pathway(GO:0035793) regulation of metanephric mesenchymal cell migration by platelet-derived growth factor receptor-beta signaling pathway(GO:1900238) positive regulation of metanephric mesenchymal cell migration(GO:2000591) |
| 0.9 | 6.4 | GO:0038172 | interleukin-33-mediated signaling pathway(GO:0038172) |
| 0.9 | 2.7 | GO:0033127 | regulation of histone phosphorylation(GO:0033127) |
| 0.9 | 4.5 | GO:1902075 | cellular response to salt(GO:1902075) cellular response to sodium arsenite(GO:1903936) |
| 0.9 | 11.7 | GO:0099517 | anterograde synaptic vesicle transport(GO:0048490) synaptic vesicle cytoskeletal transport(GO:0099514) synaptic vesicle transport along microtubule(GO:0099517) |
| 0.9 | 41.0 | GO:0007269 | neurotransmitter secretion(GO:0007269) signal release from synapse(GO:0099643) |
| 0.9 | 2.7 | GO:0060662 | tube lumen cavitation(GO:0060605) salivary gland cavitation(GO:0060662) |
| 0.9 | 13.3 | GO:0018026 | peptidyl-lysine monomethylation(GO:0018026) |
| 0.9 | 15.1 | GO:0021952 | central nervous system projection neuron axonogenesis(GO:0021952) |
| 0.9 | 2.6 | GO:0072137 | condensed mesenchymal cell proliferation(GO:0072137) |
| 0.9 | 2.6 | GO:0006004 | fucose metabolic process(GO:0006004) |
| 0.9 | 6.1 | GO:0045078 | positive regulation of interferon-gamma biosynthetic process(GO:0045078) |
| 0.9 | 13.9 | GO:0050901 | leukocyte tethering or rolling(GO:0050901) |
| 0.9 | 3.5 | GO:2000342 | negative regulation of chemokine (C-X-C motif) ligand 2 production(GO:2000342) |
| 0.9 | 3.5 | GO:0034154 | toll-like receptor 7 signaling pathway(GO:0034154) |
| 0.9 | 21.6 | GO:0007193 | adenylate cyclase-inhibiting G-protein coupled receptor signaling pathway(GO:0007193) |
| 0.9 | 9.4 | GO:0009068 | aspartate family amino acid catabolic process(GO:0009068) |
| 0.9 | 13.7 | GO:0010603 | regulation of cytoplasmic mRNA processing body assembly(GO:0010603) |
| 0.9 | 6.0 | GO:2000318 | positive regulation of T-helper 17 type immune response(GO:2000318) |
| 0.9 | 5.1 | GO:0035616 | histone H2B conserved C-terminal lysine deubiquitination(GO:0035616) |
| 0.9 | 3.4 | GO:2000794 | regulation of epithelial cell proliferation involved in lung morphogenesis(GO:2000794) |
| 0.8 | 8.5 | GO:0090292 | nuclear matrix anchoring at nuclear membrane(GO:0090292) |
| 0.8 | 3.4 | GO:0035865 | cellular response to potassium ion(GO:0035865) |
| 0.8 | 3.4 | GO:0002541 | activation of plasma proteins involved in acute inflammatory response(GO:0002541) |
| 0.8 | 8.3 | GO:0060074 | synapse maturation(GO:0060074) |
| 0.8 | 53.7 | GO:0000381 | regulation of alternative mRNA splicing, via spliceosome(GO:0000381) |
| 0.8 | 8.2 | GO:0051281 | positive regulation of release of sequestered calcium ion into cytosol(GO:0051281) |
| 0.8 | 5.7 | GO:0006833 | water transport(GO:0006833) |
| 0.8 | 32.7 | GO:0007218 | neuropeptide signaling pathway(GO:0007218) |
| 0.8 | 53.0 | GO:0016525 | negative regulation of angiogenesis(GO:0016525) |
| 0.8 | 44.5 | GO:0010923 | negative regulation of phosphatase activity(GO:0010923) |
| 0.8 | 2.4 | GO:0006565 | L-serine catabolic process(GO:0006565) |
| 0.8 | 1.6 | GO:0005513 | detection of calcium ion(GO:0005513) |
| 0.8 | 4.0 | GO:0019323 | pentose catabolic process(GO:0019323) |
| 0.8 | 3.2 | GO:0038161 | prolactin signaling pathway(GO:0038161) |
| 0.8 | 4.0 | GO:2000096 | positive regulation of Wnt signaling pathway, planar cell polarity pathway(GO:2000096) |
| 0.8 | 2.4 | GO:0070681 | glutaminyl-tRNAGln biosynthesis via transamidation(GO:0070681) |
| 0.8 | 1.6 | GO:0090290 | positive regulation of osteoclast proliferation(GO:0090290) |
| 0.8 | 2.4 | GO:0038193 | thromboxane A2 signaling pathway(GO:0038193) |
| 0.8 | 17.6 | GO:0042994 | cytoplasmic sequestering of transcription factor(GO:0042994) |
| 0.8 | 4.6 | GO:2000194 | regulation of female gonad development(GO:2000194) |
| 0.8 | 6.1 | GO:2001199 | negative regulation of dendritic cell differentiation(GO:2001199) |
| 0.8 | 13.8 | GO:0070207 | protein homotrimerization(GO:0070207) |
| 0.8 | 0.8 | GO:0046619 | optic placode formation(GO:0001743) optic placode formation involved in camera-type eye formation(GO:0046619) |
| 0.8 | 0.8 | GO:0090370 | negative regulation of cholesterol efflux(GO:0090370) |
| 0.8 | 5.3 | GO:0046061 | dATP catabolic process(GO:0046061) |
| 0.7 | 1.5 | GO:1902856 | negative regulation of nonmotile primary cilium assembly(GO:1902856) |
| 0.7 | 71.4 | GO:0090630 | activation of GTPase activity(GO:0090630) |
| 0.7 | 15.6 | GO:0010738 | regulation of protein kinase A signaling(GO:0010738) |
| 0.7 | 18.4 | GO:0050912 | detection of chemical stimulus involved in sensory perception of taste(GO:0050912) |
| 0.7 | 0.7 | GO:1903336 | negative regulation of vacuolar transport(GO:1903336) |
| 0.7 | 32.7 | GO:1904893 | negative regulation of JAK-STAT cascade(GO:0046426) negative regulation of STAT cascade(GO:1904893) |
| 0.7 | 2.2 | GO:0086097 | phospholipase C-activating angiotensin-activated signaling pathway(GO:0086097) |
| 0.7 | 2.2 | GO:0038163 | thrombopoietin-mediated signaling pathway(GO:0038163) |
| 0.7 | 3.6 | GO:0050910 | detection of mechanical stimulus involved in sensory perception of sound(GO:0050910) |
| 0.7 | 0.7 | GO:0035625 | epidermal growth factor-activated receptor transactivation by G-protein coupled receptor signaling pathway(GO:0035625) |
| 0.7 | 2.9 | GO:0060414 | aorta smooth muscle tissue morphogenesis(GO:0060414) |
| 0.7 | 2.1 | GO:0009822 | alkaloid catabolic process(GO:0009822) |
| 0.7 | 4.9 | GO:1901678 | iron coordination entity transport(GO:1901678) |
| 0.7 | 9.8 | GO:0000022 | mitotic spindle elongation(GO:0000022) |
| 0.7 | 5.6 | GO:0090160 | Golgi to lysosome transport(GO:0090160) |
| 0.7 | 4.2 | GO:0002430 | complement receptor mediated signaling pathway(GO:0002430) |
| 0.7 | 1.4 | GO:0045988 | negative regulation of striated muscle contraction(GO:0045988) |
| 0.7 | 10.3 | GO:0007141 | male meiosis I(GO:0007141) |
| 0.7 | 3.4 | GO:0071440 | regulation of histone H3-K14 acetylation(GO:0071440) |
| 0.7 | 2.7 | GO:0080009 | mRNA methylation(GO:0080009) |
| 0.7 | 2.1 | GO:1902951 | negative regulation of dendritic spine maintenance(GO:1902951) |
| 0.7 | 9.5 | GO:0016576 | histone dephosphorylation(GO:0016576) |
| 0.7 | 2.7 | GO:0061086 | negative regulation of histone H3-K27 methylation(GO:0061086) |
| 0.7 | 3.4 | GO:1903232 | melanosome assembly(GO:1903232) |
| 0.7 | 8.2 | GO:0033622 | integrin activation(GO:0033622) |
| 0.7 | 5.4 | GO:0043569 | negative regulation of insulin-like growth factor receptor signaling pathway(GO:0043569) |
| 0.7 | 1.4 | GO:0030174 | regulation of DNA-dependent DNA replication initiation(GO:0030174) |
| 0.7 | 2.0 | GO:0030186 | melatonin metabolic process(GO:0030186) melatonin biosynthetic process(GO:0030187) |
| 0.7 | 7.3 | GO:0007188 | adenylate cyclase-modulating G-protein coupled receptor signaling pathway(GO:0007188) |
| 0.7 | 44.0 | GO:0006826 | iron ion transport(GO:0006826) |
| 0.7 | 4.0 | GO:0033274 | response to vitamin B2(GO:0033274) heterochromatin maintenance(GO:0070829) |
| 0.7 | 4.7 | GO:0002726 | positive regulation of T cell cytokine production(GO:0002726) |
| 0.7 | 2.6 | GO:2000114 | regulation of establishment of cell polarity(GO:2000114) |
| 0.7 | 2.0 | GO:0035747 | natural killer cell chemotaxis(GO:0035747) |
| 0.7 | 9.9 | GO:0044458 | motile cilium assembly(GO:0044458) |
| 0.7 | 3.9 | GO:0007340 | acrosome reaction(GO:0007340) |
| 0.7 | 6.6 | GO:0021904 | dorsal/ventral neural tube patterning(GO:0021904) |
| 0.7 | 2.0 | GO:0019755 | one-carbon compound transport(GO:0019755) |
| 0.7 | 11.1 | GO:0006750 | glutathione biosynthetic process(GO:0006750) |
| 0.7 | 1.3 | GO:0097211 | response to gonadotropin-releasing hormone(GO:0097210) cellular response to gonadotropin-releasing hormone(GO:0097211) |
| 0.6 | 1.3 | GO:0070213 | protein auto-ADP-ribosylation(GO:0070213) |
| 0.6 | 2.6 | GO:0042182 | ketone catabolic process(GO:0042182) |
| 0.6 | 1.9 | GO:0006883 | cellular sodium ion homeostasis(GO:0006883) |
| 0.6 | 0.6 | GO:0050915 | sensory perception of sour taste(GO:0050915) |
| 0.6 | 1.9 | GO:0051823 | regulation of synapse structural plasticity(GO:0051823) |
| 0.6 | 10.0 | GO:0051382 | kinetochore assembly(GO:0051382) |
| 0.6 | 16.2 | GO:0006836 | neurotransmitter transport(GO:0006836) |
| 0.6 | 2.5 | GO:0033353 | S-adenosylmethionine cycle(GO:0033353) |
| 0.6 | 3.7 | GO:0048280 | vesicle fusion with Golgi apparatus(GO:0048280) |
| 0.6 | 6.2 | GO:0030210 | heparin metabolic process(GO:0030202) heparin biosynthetic process(GO:0030210) |
| 0.6 | 3.1 | GO:0060732 | positive regulation of inositol phosphate biosynthetic process(GO:0060732) |
| 0.6 | 1.8 | GO:0015860 | purine nucleoside transmembrane transport(GO:0015860) |
| 0.6 | 8.5 | GO:0045662 | negative regulation of myoblast differentiation(GO:0045662) |
| 0.6 | 15.8 | GO:0043551 | regulation of phosphatidylinositol 3-kinase activity(GO:0043551) |
| 0.6 | 2.4 | GO:0048512 | circadian behavior(GO:0048512) |
| 0.6 | 2.4 | GO:0043116 | negative regulation of vascular permeability(GO:0043116) |
| 0.6 | 2.4 | GO:0015942 | formate metabolic process(GO:0015942) |
| 0.6 | 1.2 | GO:0021764 | amygdala development(GO:0021764) |
| 0.6 | 0.6 | GO:0021521 | ventral spinal cord interneuron specification(GO:0021521) cell fate specification involved in pattern specification(GO:0060573) |
| 0.6 | 7.1 | GO:0006776 | vitamin A metabolic process(GO:0006776) |
| 0.6 | 2.4 | GO:0070842 | aggresome assembly(GO:0070842) |
| 0.6 | 2.9 | GO:0043456 | regulation of pentose-phosphate shunt(GO:0043456) |
| 0.6 | 2.9 | GO:2000189 | positive regulation of cholesterol homeostasis(GO:2000189) |
| 0.6 | 1.2 | GO:0072578 | neurotransmitter-gated ion channel clustering(GO:0072578) |
| 0.6 | 1.7 | GO:0050847 | progesterone receptor signaling pathway(GO:0050847) |
| 0.6 | 11.0 | GO:0006940 | regulation of smooth muscle contraction(GO:0006940) |
| 0.6 | 3.4 | GO:0048520 | positive regulation of behavior(GO:0048520) |
| 0.6 | 4.5 | GO:0015693 | magnesium ion transport(GO:0015693) |
| 0.6 | 4.0 | GO:0009048 | dosage compensation(GO:0007549) dosage compensation by inactivation of X chromosome(GO:0009048) |
| 0.6 | 2.3 | GO:0032754 | positive regulation of interleukin-5 production(GO:0032754) |
| 0.6 | 1.7 | GO:0034442 | regulation of lipoprotein oxidation(GO:0034442) negative regulation of lipoprotein oxidation(GO:0034443) regulation of plasma lipoprotein particle oxidation(GO:0034444) negative regulation of plasma lipoprotein particle oxidation(GO:0034445) |
| 0.6 | 12.3 | GO:0042403 | thyroid hormone metabolic process(GO:0042403) |
| 0.6 | 3.3 | GO:0006686 | sphingomyelin biosynthetic process(GO:0006686) |
| 0.6 | 5.0 | GO:0007035 | vacuolar acidification(GO:0007035) |
| 0.6 | 4.4 | GO:0035269 | protein O-linked mannosylation(GO:0035269) |
| 0.5 | 3.8 | GO:0006707 | cholesterol catabolic process(GO:0006707) sterol catabolic process(GO:0016127) |
| 0.5 | 2.7 | GO:0042118 | endothelial cell activation(GO:0042118) |
| 0.5 | 3.8 | GO:1990440 | positive regulation of transcription from RNA polymerase II promoter in response to endoplasmic reticulum stress(GO:1990440) |
| 0.5 | 5.4 | GO:0045725 | positive regulation of glycogen biosynthetic process(GO:0045725) |
| 0.5 | 1.6 | GO:0033078 | extrathymic T cell differentiation(GO:0033078) regulation of extrathymic T cell differentiation(GO:0033082) sebum secreting cell proliferation(GO:1990654) |
| 0.5 | 0.5 | GO:0070827 | chromatin maintenance(GO:0070827) |
| 0.5 | 3.7 | GO:0042271 | susceptibility to natural killer cell mediated cytotoxicity(GO:0042271) |
| 0.5 | 4.3 | GO:1901889 | negative regulation of cell junction assembly(GO:1901889) |
| 0.5 | 30.1 | GO:0008277 | regulation of G-protein coupled receptor protein signaling pathway(GO:0008277) |
| 0.5 | 1.6 | GO:0036414 | protein citrullination(GO:0018101) histone citrullination(GO:0036414) |
| 0.5 | 8.9 | GO:0010719 | negative regulation of epithelial to mesenchymal transition(GO:0010719) |
| 0.5 | 1.1 | GO:1901376 | mycotoxin metabolic process(GO:0043385) aflatoxin metabolic process(GO:0046222) organic heteropentacyclic compound metabolic process(GO:1901376) |
| 0.5 | 1.6 | GO:2000866 | positive regulation of estrogen secretion(GO:2000863) positive regulation of estradiol secretion(GO:2000866) |
| 0.5 | 2.6 | GO:0032717 | negative regulation of interleukin-8 production(GO:0032717) |
| 0.5 | 0.5 | GO:0060398 | regulation of growth hormone receptor signaling pathway(GO:0060398) |
| 0.5 | 2.1 | GO:0030259 | lipid glycosylation(GO:0030259) |
| 0.5 | 1.5 | GO:1902525 | regulation of protein monoubiquitination(GO:1902525) |
| 0.5 | 1.5 | GO:0003147 | neural crest cell migration involved in heart formation(GO:0003147) cardiac neural crest cell migration involved in outflow tract morphogenesis(GO:0003253) cell migration involved in heart formation(GO:0060974) anterior neural tube closure(GO:0061713) cellular response to folic acid(GO:0071231) |
| 0.5 | 2.6 | GO:0034162 | toll-like receptor 9 signaling pathway(GO:0034162) |
| 0.5 | 7.1 | GO:0050919 | negative chemotaxis(GO:0050919) |
| 0.5 | 1.0 | GO:0021523 | somatic motor neuron differentiation(GO:0021523) |
| 0.5 | 44.1 | GO:0007626 | locomotory behavior(GO:0007626) |
| 0.5 | 3.5 | GO:0090527 | actin filament reorganization(GO:0090527) |
| 0.5 | 0.5 | GO:0002408 | myeloid dendritic cell chemotaxis(GO:0002408) |
| 0.5 | 0.5 | GO:0046219 | indole-containing compound biosynthetic process(GO:0042435) indolalkylamine biosynthetic process(GO:0046219) |
| 0.5 | 0.5 | GO:0044062 | regulation of excretion(GO:0044062) |
| 0.5 | 1.0 | GO:0090034 | regulation of chaperone-mediated protein complex assembly(GO:0090034) positive regulation of chaperone-mediated protein complex assembly(GO:0090035) |
| 0.5 | 1.0 | GO:0030157 | pancreatic juice secretion(GO:0030157) |
| 0.5 | 12.4 | GO:0033173 | calcineurin-NFAT signaling cascade(GO:0033173) |
| 0.5 | 0.5 | GO:0042148 | strand invasion(GO:0042148) |
| 0.5 | 4.9 | GO:0000463 | maturation of LSU-rRNA from tricistronic rRNA transcript (SSU-rRNA, 5.8S rRNA, LSU-rRNA)(GO:0000463) |
| 0.5 | 6.9 | GO:0006896 | Golgi to vacuole transport(GO:0006896) |
| 0.5 | 1.0 | GO:0042160 | lipoprotein modification(GO:0042160) lipoprotein oxidation(GO:0042161) |
| 0.5 | 1.0 | GO:0060024 | rhythmic synaptic transmission(GO:0060024) |
| 0.5 | 2.9 | GO:0009642 | response to light intensity(GO:0009642) |
| 0.5 | 2.0 | GO:0010644 | cell communication by electrical coupling(GO:0010644) |
| 0.5 | 1.5 | GO:0060536 | cartilage morphogenesis(GO:0060536) |
| 0.5 | 2.4 | GO:0060157 | urinary bladder development(GO:0060157) |
| 0.5 | 4.8 | GO:0006068 | ethanol catabolic process(GO:0006068) |
| 0.5 | 1.4 | GO:0033364 | mast cell secretory granule organization(GO:0033364) |
| 0.5 | 1.9 | GO:1903059 | regulation of protein lipidation(GO:1903059) positive regulation of protein lipidation(GO:1903061) |
| 0.5 | 1.4 | GO:0046271 | phenylpropanoid catabolic process(GO:0046271) |
| 0.5 | 1.0 | GO:0051410 | detoxification of nitrogen compound(GO:0051410) cellular detoxification of nitrogen compound(GO:0070458) |
| 0.5 | 4.3 | GO:0034453 | microtubule anchoring(GO:0034453) |
| 0.5 | 2.4 | GO:0006041 | glucosamine metabolic process(GO:0006041) |
| 0.5 | 5.2 | GO:0034770 | histone H4-K20 methylation(GO:0034770) |
| 0.5 | 1.9 | GO:0000451 | rRNA 2'-O-methylation(GO:0000451) |
| 0.5 | 1.4 | GO:0051414 | response to cortisol(GO:0051414) |
| 0.5 | 2.7 | GO:0061088 | regulation of sequestering of zinc ion(GO:0061088) |
| 0.5 | 2.7 | GO:0072383 | plus-end-directed vesicle transport along microtubule(GO:0072383) |
| 0.5 | 2.3 | GO:0071420 | cellular response to histamine(GO:0071420) |
| 0.5 | 18.5 | GO:0009583 | detection of light stimulus(GO:0009583) |
| 0.5 | 9.0 | GO:0035635 | entry of bacterium into host cell(GO:0035635) |
| 0.4 | 1.3 | GO:0050957 | equilibrioception(GO:0050957) |
| 0.4 | 1.3 | GO:0042756 | drinking behavior(GO:0042756) |
| 0.4 | 2.7 | GO:0042340 | keratan sulfate catabolic process(GO:0042340) |
| 0.4 | 21.1 | GO:0006891 | intra-Golgi vesicle-mediated transport(GO:0006891) |
| 0.4 | 0.9 | GO:0044805 | late nucleophagy(GO:0044805) |
| 0.4 | 1.3 | GO:0007016 | cytoskeletal anchoring at plasma membrane(GO:0007016) |
| 0.4 | 0.9 | GO:0051918 | negative regulation of fibrinolysis(GO:0051918) |
| 0.4 | 3.4 | GO:0061709 | reticulophagy(GO:0061709) |
| 0.4 | 0.4 | GO:0070459 | prolactin secretion(GO:0070459) |
| 0.4 | 3.4 | GO:0046512 | diol biosynthetic process(GO:0034312) sphingosine biosynthetic process(GO:0046512) sphingoid biosynthetic process(GO:0046520) |
| 0.4 | 1.7 | GO:0036058 | filtration diaphragm assembly(GO:0036058) slit diaphragm assembly(GO:0036060) negative regulation of retinal ganglion cell axon guidance(GO:0090260) |
| 0.4 | 3.4 | GO:0032534 | regulation of microvillus assembly(GO:0032534) |
| 0.4 | 4.2 | GO:0007270 | neuron-neuron synaptic transmission(GO:0007270) |
| 0.4 | 8.5 | GO:0019433 | triglyceride catabolic process(GO:0019433) |
| 0.4 | 5.5 | GO:0007187 | G-protein coupled receptor signaling pathway, coupled to cyclic nucleotide second messenger(GO:0007187) |
| 0.4 | 0.4 | GO:0042938 | dipeptide transport(GO:0042938) |
| 0.4 | 4.2 | GO:0042738 | exogenous drug catabolic process(GO:0042738) |
| 0.4 | 0.8 | GO:0030242 | pexophagy(GO:0030242) |
| 0.4 | 1.7 | GO:0060484 | lung-associated mesenchyme development(GO:0060484) |
| 0.4 | 2.1 | GO:0019720 | Mo-molybdopterin cofactor biosynthetic process(GO:0006777) Mo-molybdopterin cofactor metabolic process(GO:0019720) |
| 0.4 | 2.1 | GO:0009713 | catechol-containing compound biosynthetic process(GO:0009713) catecholamine biosynthetic process(GO:0042423) |
| 0.4 | 1.2 | GO:0015798 | myo-inositol transport(GO:0015798) |
| 0.4 | 2.5 | GO:0071105 | response to interleukin-11(GO:0071105) |
| 0.4 | 5.8 | GO:0016601 | Rac protein signal transduction(GO:0016601) |
| 0.4 | 49.9 | GO:0035023 | regulation of Rho protein signal transduction(GO:0035023) |
| 0.4 | 0.8 | GO:0018298 | protein-chromophore linkage(GO:0018298) |
| 0.4 | 2.8 | GO:1904779 | regulation of protein localization to centrosome(GO:1904779) |
| 0.4 | 1.2 | GO:0055099 | detection of hormone stimulus(GO:0009720) detection of endogenous stimulus(GO:0009726) response to high density lipoprotein particle(GO:0055099) |
| 0.4 | 1.2 | GO:0032815 | negative regulation of natural killer cell activation(GO:0032815) |
| 0.4 | 3.5 | GO:0033234 | negative regulation of protein sumoylation(GO:0033234) |
| 0.4 | 1.2 | GO:0046603 | negative regulation of mitotic centrosome separation(GO:0046603) |
| 0.4 | 0.8 | GO:0051531 | NFAT protein import into nucleus(GO:0051531) negative regulation of NFAT protein import into nucleus(GO:0051534) |
| 0.4 | 1.2 | GO:0035048 | splicing factor protein import into nucleus(GO:0035048) |
| 0.4 | 1.5 | GO:0032581 | ER-dependent peroxisome organization(GO:0032581) |
| 0.4 | 0.8 | GO:0032494 | response to peptidoglycan(GO:0032494) |
| 0.4 | 10.4 | GO:0046580 | negative regulation of Ras protein signal transduction(GO:0046580) |
| 0.4 | 1.1 | GO:0070943 | neutrophil mediated cytotoxicity(GO:0070942) neutrophil mediated killing of symbiont cell(GO:0070943) neutrophil mediated killing of bacterium(GO:0070944) |
| 0.4 | 0.8 | GO:0002439 | chronic inflammatory response to antigenic stimulus(GO:0002439) positive regulation of chronic inflammatory response(GO:0002678) regulation of chronic inflammatory response to antigenic stimulus(GO:0002874) positive regulation of chronic inflammatory response to antigenic stimulus(GO:0002876) |
| 0.4 | 0.8 | GO:0018125 | peptidyl-cysteine methylation(GO:0018125) |
| 0.4 | 0.4 | GO:0016098 | monoterpenoid metabolic process(GO:0016098) |
| 0.4 | 1.9 | GO:0072610 | interleukin-12 secretion(GO:0072610) positive regulation of interleukin-12 secretion(GO:2001184) |
| 0.4 | 0.8 | GO:0072248 | metanephric glomerular epithelium development(GO:0072244) metanephric glomerular visceral epithelial cell differentiation(GO:0072248) metanephric glomerular visceral epithelial cell development(GO:0072249) metanephric glomerular epithelial cell differentiation(GO:0072312) metanephric glomerular epithelial cell development(GO:0072313) |
| 0.4 | 2.6 | GO:0061037 | negative regulation of chondrocyte differentiation(GO:0032331) negative regulation of cartilage development(GO:0061037) |
| 0.4 | 47.4 | GO:0007156 | homophilic cell adhesion via plasma membrane adhesion molecules(GO:0007156) |
| 0.4 | 2.9 | GO:0048240 | sperm capacitation(GO:0048240) |
| 0.4 | 0.4 | GO:0060677 | ureteric bud elongation(GO:0060677) |
| 0.4 | 1.8 | GO:0060046 | regulation of acrosome reaction(GO:0060046) |
| 0.4 | 7.1 | GO:0034035 | purine ribonucleoside bisphosphate metabolic process(GO:0034035) 3'-phosphoadenosine 5'-phosphosulfate metabolic process(GO:0050427) |
| 0.4 | 5.3 | GO:0017156 | calcium ion regulated exocytosis(GO:0017156) |
| 0.4 | 2.5 | GO:0071492 | cellular response to UV-A(GO:0071492) |
| 0.3 | 0.7 | GO:2000479 | regulation of cAMP-dependent protein kinase activity(GO:2000479) |
| 0.3 | 4.8 | GO:0006768 | biotin metabolic process(GO:0006768) |
| 0.3 | 1.4 | GO:1990845 | adaptive thermogenesis(GO:1990845) |
| 0.3 | 1.0 | GO:0090521 | glomerular visceral epithelial cell migration(GO:0090521) |
| 0.3 | 1.7 | GO:0015791 | polyol transport(GO:0015791) |
| 0.3 | 1.0 | GO:0051446 | positive regulation of meiotic cell cycle(GO:0051446) |
| 0.3 | 0.7 | GO:0060972 | left/right pattern formation(GO:0060972) |
| 0.3 | 1.6 | GO:2001013 | epithelial cell proliferation involved in renal tubule morphogenesis(GO:2001013) |
| 0.3 | 1.0 | GO:0007185 | transmembrane receptor protein tyrosine phosphatase signaling pathway(GO:0007185) |
| 0.3 | 1.0 | GO:0060710 | chorio-allantoic fusion(GO:0060710) |
| 0.3 | 7.0 | GO:2000785 | regulation of autophagosome assembly(GO:2000785) |
| 0.3 | 11.1 | GO:0035036 | sperm-egg recognition(GO:0035036) |
| 0.3 | 1.6 | GO:0043117 | positive regulation of vascular permeability(GO:0043117) |
| 0.3 | 39.5 | GO:0006958 | complement activation, classical pathway(GO:0006958) |
| 0.3 | 5.6 | GO:0007200 | phospholipase C-activating G-protein coupled receptor signaling pathway(GO:0007200) |
| 0.3 | 1.6 | GO:0097039 | protein linear polyubiquitination(GO:0097039) |
| 0.3 | 0.9 | GO:0008212 | mineralocorticoid biosynthetic process(GO:0006705) mineralocorticoid metabolic process(GO:0008212) |
| 0.3 | 1.9 | GO:0071285 | cellular response to lithium ion(GO:0071285) |
| 0.3 | 0.9 | GO:0006287 | base-excision repair, gap-filling(GO:0006287) |
| 0.3 | 0.6 | GO:1900228 | biofilm formation(GO:0042710) single-species biofilm formation(GO:0044010) single-species biofilm formation in or on host organism(GO:0044407) regulation of single-species biofilm formation(GO:1900190) negative regulation of single-species biofilm formation(GO:1900191) regulation of single-species biofilm formation in or on host organism(GO:1900228) negative regulation of single-species biofilm formation in or on host organism(GO:1900229) |
| 0.3 | 0.3 | GO:0031914 | negative regulation of synaptic plasticity(GO:0031914) |
| 0.3 | 0.9 | GO:0007635 | chemosensory behavior(GO:0007635) |
| 0.3 | 3.0 | GO:0051457 | maintenance of protein location in nucleus(GO:0051457) |
| 0.3 | 0.9 | GO:0015847 | putrescine transport(GO:0015847) |
| 0.3 | 0.9 | GO:0045345 | positive regulation of MHC class I biosynthetic process(GO:0045345) |
| 0.3 | 0.9 | GO:0006701 | progesterone biosynthetic process(GO:0006701) |
| 0.3 | 2.6 | GO:0035493 | SNARE complex assembly(GO:0035493) |
| 0.3 | 6.3 | GO:0072488 | ammonium transmembrane transport(GO:0072488) |
| 0.3 | 1.1 | GO:0002644 | negative regulation of tolerance induction(GO:0002644) |
| 0.3 | 0.6 | GO:0003199 | endocardial cushion to mesenchymal transition involved in heart valve formation(GO:0003199) |
| 0.3 | 0.8 | GO:1900452 | regulation of long term synaptic depression(GO:1900452) |
| 0.3 | 1.1 | GO:2000158 | positive regulation of ubiquitin-specific protease activity(GO:2000158) |
| 0.3 | 2.5 | GO:0072592 | oxygen metabolic process(GO:0072592) |
| 0.3 | 0.5 | GO:0032430 | positive regulation of phospholipase A2 activity(GO:0032430) |
| 0.3 | 11.2 | GO:1902476 | chloride transmembrane transport(GO:1902476) |
| 0.3 | 1.6 | GO:0042753 | positive regulation of circadian rhythm(GO:0042753) |
| 0.3 | 4.0 | GO:0001502 | cartilage condensation(GO:0001502) |
| 0.3 | 1.6 | GO:0006398 | mRNA 3'-end processing by stem-loop binding and cleavage(GO:0006398) |
| 0.3 | 0.5 | GO:0010759 | positive regulation of macrophage chemotaxis(GO:0010759) |
| 0.3 | 2.1 | GO:0032713 | negative regulation of interleukin-4 production(GO:0032713) |
| 0.3 | 1.3 | GO:2000251 | positive regulation of actin cytoskeleton reorganization(GO:2000251) |
| 0.3 | 0.8 | GO:0019046 | release from viral latency(GO:0019046) |
| 0.3 | 2.8 | GO:0006054 | N-acetylneuraminate metabolic process(GO:0006054) |
| 0.2 | 0.5 | GO:0045064 | T-helper 2 cell differentiation(GO:0045064) |
| 0.2 | 3.7 | GO:0006706 | steroid catabolic process(GO:0006706) |
| 0.2 | 2.0 | GO:0006813 | potassium ion transport(GO:0006813) |
| 0.2 | 2.2 | GO:0045003 | DNA recombinase assembly(GO:0000730) double-strand break repair via synthesis-dependent strand annealing(GO:0045003) |
| 0.2 | 2.7 | GO:0098789 | pre-mRNA cleavage required for polyadenylation(GO:0098789) |
| 0.2 | 0.7 | GO:0014735 | regulation of muscle atrophy(GO:0014735) |
| 0.2 | 2.6 | GO:0007026 | negative regulation of microtubule depolymerization(GO:0007026) regulation of microtubule depolymerization(GO:0031114) |
| 0.2 | 1.2 | GO:0007056 | spindle assembly involved in female meiosis(GO:0007056) |
| 0.2 | 3.8 | GO:0006198 | cAMP catabolic process(GO:0006198) |
| 0.2 | 4.7 | GO:0030866 | cortical actin cytoskeleton organization(GO:0030866) |
| 0.2 | 2.3 | GO:0032703 | negative regulation of interleukin-2 production(GO:0032703) |
| 0.2 | 0.9 | GO:1902715 | positive regulation of interferon-gamma secretion(GO:1902715) |
| 0.2 | 1.8 | GO:2000042 | negative regulation of double-strand break repair via homologous recombination(GO:2000042) |
| 0.2 | 0.2 | GO:1903242 | regulation of cardiac muscle adaptation(GO:0010612) regulation of cardiac muscle hypertrophy in response to stress(GO:1903242) |
| 0.2 | 12.0 | GO:0030490 | maturation of SSU-rRNA(GO:0030490) |
| 0.2 | 0.2 | GO:0038145 | macrophage colony-stimulating factor signaling pathway(GO:0038145) |
| 0.2 | 0.9 | GO:0014894 | response to muscle inactivity involved in regulation of muscle adaptation(GO:0014877) response to denervation involved in regulation of muscle adaptation(GO:0014894) |
| 0.2 | 1.1 | GO:0035095 | behavioral response to nicotine(GO:0035095) |
| 0.2 | 1.5 | GO:0030207 | chondroitin sulfate catabolic process(GO:0030207) |
| 0.2 | 0.4 | GO:0036342 | post-anal tail morphogenesis(GO:0036342) |
| 0.2 | 0.4 | GO:0061002 | negative regulation of dendritic spine morphogenesis(GO:0061002) |
| 0.2 | 1.4 | GO:0015813 | L-glutamate transport(GO:0015813) |
| 0.2 | 1.0 | GO:1901350 | cell-cell signaling involved in cell-cell junction organization(GO:1901350) |
| 0.2 | 1.0 | GO:0070673 | response to interleukin-18(GO:0070673) |
| 0.2 | 6.7 | GO:0007266 | Rho protein signal transduction(GO:0007266) |
| 0.2 | 3.5 | GO:0050873 | brown fat cell differentiation(GO:0050873) |
| 0.2 | 0.4 | GO:0089718 | amino acid import across plasma membrane(GO:0089718) |
| 0.2 | 1.1 | GO:1904978 | regulation of endosome organization(GO:1904978) |
| 0.2 | 1.9 | GO:0006975 | DNA damage induced protein phosphorylation(GO:0006975) |
| 0.2 | 0.8 | GO:0006704 | glucocorticoid biosynthetic process(GO:0006704) |
| 0.2 | 0.4 | GO:0035754 | B cell chemotaxis(GO:0035754) |
| 0.2 | 1.8 | GO:0031645 | negative regulation of myelination(GO:0031642) negative regulation of neurological system process(GO:0031645) |
| 0.2 | 0.7 | GO:1902043 | positive regulation of extrinsic apoptotic signaling pathway via death domain receptors(GO:1902043) |
| 0.2 | 1.1 | GO:0097354 | protein prenylation(GO:0018342) prenylation(GO:0097354) |
| 0.2 | 2.1 | GO:0030388 | fructose 1,6-bisphosphate metabolic process(GO:0030388) |
| 0.2 | 0.9 | GO:0060482 | lobar bronchus epithelium development(GO:0060481) lobar bronchus development(GO:0060482) |
| 0.2 | 0.3 | GO:0045591 | positive regulation of regulatory T cell differentiation(GO:0045591) |
| 0.2 | 3.3 | GO:0052695 | cellular glucuronidation(GO:0052695) |
| 0.2 | 1.5 | GO:0006071 | glycerol metabolic process(GO:0006071) |
| 0.2 | 0.8 | GO:0090131 | mesenchyme migration(GO:0090131) |
| 0.2 | 1.3 | GO:0060219 | camera-type eye photoreceptor cell differentiation(GO:0060219) |
| 0.2 | 0.6 | GO:1902775 | mitochondrial ribosome assembly(GO:0061668) mitochondrial large ribosomal subunit assembly(GO:1902775) |
| 0.2 | 9.2 | GO:0005977 | glycogen metabolic process(GO:0005977) |
| 0.2 | 0.8 | GO:0007638 | mechanosensory behavior(GO:0007638) |
| 0.2 | 1.0 | GO:0042780 | tRNA 3'-end processing(GO:0042780) |
| 0.2 | 0.8 | GO:0019627 | urea cycle(GO:0000050) urea metabolic process(GO:0019627) |
| 0.2 | 0.8 | GO:0030860 | regulation of polarized epithelial cell differentiation(GO:0030860) |
| 0.2 | 1.1 | GO:0031848 | protection from non-homologous end joining at telomere(GO:0031848) |
| 0.1 | 0.3 | GO:0002581 | regulation of antigen processing and presentation of peptide or polysaccharide antigen via MHC class II(GO:0002580) negative regulation of antigen processing and presentation of peptide or polysaccharide antigen via MHC class II(GO:0002581) regulation of antigen processing and presentation of peptide antigen via MHC class II(GO:0002586) |
| 0.1 | 0.4 | GO:0008615 | pyridoxine metabolic process(GO:0008614) pyridoxine biosynthetic process(GO:0008615) vitamin B6 biosynthetic process(GO:0042819) |
| 0.1 | 3.5 | GO:0007274 | neuromuscular synaptic transmission(GO:0007274) |
| 0.1 | 0.3 | GO:0071104 | response to interleukin-9(GO:0071104) |
| 0.1 | 0.6 | GO:0009298 | GDP-mannose biosynthetic process(GO:0009298) |
| 0.1 | 0.3 | GO:0034182 | regulation of maintenance of sister chromatid cohesion(GO:0034091) regulation of maintenance of mitotic sister chromatid cohesion(GO:0034182) |
| 0.1 | 0.4 | GO:0001946 | lymphangiogenesis(GO:0001946) |
| 0.1 | 1.1 | GO:0042226 | interleukin-6 biosynthetic process(GO:0042226) |
| 0.1 | 0.6 | GO:0035308 | negative regulation of protein dephosphorylation(GO:0035308) |
| 0.1 | 1.2 | GO:0042269 | regulation of natural killer cell mediated cytotoxicity(GO:0042269) |
| 0.1 | 0.6 | GO:0032202 | telomere assembly(GO:0032202) |
| 0.1 | 0.4 | GO:0060017 | parathyroid gland development(GO:0060017) |
| 0.1 | 0.2 | GO:0046015 | regulation of transcription by glucose(GO:0046015) |
| 0.1 | 0.6 | GO:0032971 | regulation of muscle filament sliding(GO:0032971) |
| 0.1 | 0.2 | GO:0060332 | positive regulation of response to interferon-gamma(GO:0060332) positive regulation of interferon-gamma-mediated signaling pathway(GO:0060335) |
| 0.1 | 1.0 | GO:0043517 | positive regulation of DNA damage response, signal transduction by p53 class mediator(GO:0043517) |
| 0.1 | 0.4 | GO:0060363 | cranial suture morphogenesis(GO:0060363) |
| 0.1 | 0.2 | GO:0035372 | protein localization to microtubule(GO:0035372) |
| 0.1 | 4.1 | GO:0032755 | positive regulation of interleukin-6 production(GO:0032755) |
| 0.1 | 1.2 | GO:0016558 | protein import into peroxisome matrix(GO:0016558) |
| 0.1 | 0.3 | GO:0045625 | regulation of T-helper 1 cell differentiation(GO:0045625) |
| 0.1 | 0.2 | GO:0060003 | copper ion export(GO:0060003) |
| 0.1 | 1.3 | GO:0016226 | iron-sulfur cluster assembly(GO:0016226) metallo-sulfur cluster assembly(GO:0031163) |
| 0.1 | 0.1 | GO:0035963 | response to interleukin-13(GO:0035962) cellular response to interleukin-13(GO:0035963) |
| 0.1 | 0.6 | GO:0045837 | negative regulation of mitochondrial membrane potential(GO:0010917) negative regulation of membrane potential(GO:0045837) |
| 0.1 | 0.3 | GO:0009786 | regulation of asymmetric cell division(GO:0009786) |
| 0.1 | 0.7 | GO:0051898 | negative regulation of protein kinase B signaling(GO:0051898) |
| 0.1 | 0.3 | GO:0060122 | inner ear receptor stereocilium organization(GO:0060122) |
| 0.1 | 0.2 | GO:0090086 | negative regulation of protein deubiquitination(GO:0090086) |
| 0.1 | 0.7 | GO:0031111 | negative regulation of microtubule polymerization or depolymerization(GO:0031111) |
| 0.1 | 0.6 | GO:0018410 | C-terminal protein amino acid modification(GO:0018410) |
| 0.1 | 0.2 | GO:0001575 | globoside metabolic process(GO:0001575) |
| 0.1 | 0.2 | GO:1990418 | response to insulin-like growth factor stimulus(GO:1990418) |
| 0.1 | 0.3 | GO:0016998 | cell wall macromolecule catabolic process(GO:0016998) |
| 0.1 | 0.4 | GO:0051026 | chiasma assembly(GO:0051026) |
| 0.1 | 2.4 | GO:0045600 | positive regulation of fat cell differentiation(GO:0045600) |
| 0.1 | 0.3 | GO:0060285 | cilium-dependent cell motility(GO:0060285) |
| 0.1 | 0.8 | GO:0039702 | viral budding via host ESCRT complex(GO:0039702) |
| 0.1 | 0.4 | GO:0007598 | blood coagulation, extrinsic pathway(GO:0007598) |
| 0.1 | 1.9 | GO:0035914 | skeletal muscle cell differentiation(GO:0035914) |
| 0.1 | 0.1 | GO:0006288 | base-excision repair, DNA ligation(GO:0006288) |
| 0.1 | 0.2 | GO:0030578 | PML body organization(GO:0030578) |
| 0.1 | 0.3 | GO:0045602 | negative regulation of endothelial cell differentiation(GO:0045602) |
| 0.1 | 0.4 | GO:0006108 | malate metabolic process(GO:0006108) |
| 0.1 | 0.1 | GO:0072600 | establishment of protein localization to Golgi(GO:0072600) |
| 0.1 | 0.2 | GO:0035721 | intraciliary retrograde transport(GO:0035721) |
| 0.0 | 0.4 | GO:0002475 | antigen processing and presentation via MHC class Ib(GO:0002475) |
| 0.0 | 0.2 | GO:0070940 | dephosphorylation of RNA polymerase II C-terminal domain(GO:0070940) |
| 0.0 | 0.2 | GO:0070120 | ciliary neurotrophic factor-mediated signaling pathway(GO:0070120) |
| 0.0 | 0.3 | GO:0002438 | acute inflammatory response to antigenic stimulus(GO:0002438) |
| 0.0 | 0.3 | GO:0043030 | regulation of macrophage activation(GO:0043030) |
| 0.0 | 4.0 | GO:0050911 | detection of chemical stimulus involved in sensory perception of smell(GO:0050911) |
| 0.0 | 0.8 | GO:0030488 | tRNA methylation(GO:0030488) |
| 0.0 | 0.3 | GO:0001573 | ganglioside metabolic process(GO:0001573) |
| 0.0 | 0.1 | GO:1903565 | negative regulation of protein localization to cilium(GO:1903565) regulation of protein localization to ciliary membrane(GO:1903567) negative regulation of protein localization to ciliary membrane(GO:1903568) |
| 0.0 | 0.8 | GO:0042073 | intraciliary transport(GO:0042073) |
| 0.0 | 0.4 | GO:0032212 | positive regulation of telomere maintenance via telomerase(GO:0032212) |
| 0.0 | 0.6 | GO:1901685 | glutathione derivative metabolic process(GO:1901685) glutathione derivative biosynthetic process(GO:1901687) |
| 0.0 | 0.2 | GO:0034656 | nucleobase-containing small molecule catabolic process(GO:0034656) |
| 0.0 | 0.1 | GO:0048664 | neuron fate determination(GO:0048664) |
| 0.0 | 0.1 | GO:0032510 | endosome to lysosome transport via multivesicular body sorting pathway(GO:0032510) |
| 0.0 | 0.0 | GO:0060457 | negative regulation of digestive system process(GO:0060457) |
| 0.0 | 0.0 | GO:0021535 | cell migration in hindbrain(GO:0021535) |
| 0.0 | 0.0 | GO:0097534 | lymphoid lineage cell migration(GO:0097534) lymphoid lineage cell migration into thymus(GO:0097535) |
Gene overrepresentation in cellular component category:
| Log-likelihood per target | Total log-likelihood | Term | Description |
|---|---|---|---|
| 46.7 | 187.0 | GO:0038039 | G-protein coupled receptor heterodimeric complex(GO:0038039) |
| 32.4 | 162.0 | GO:0072534 | perineuronal net(GO:0072534) |
| 19.8 | 59.5 | GO:0098843 | postsynaptic endocytic zone(GO:0098843) |
| 14.5 | 232.4 | GO:0097512 | cardiac myofibril(GO:0097512) |
| 12.7 | 38.1 | GO:0034455 | t-UTP complex(GO:0034455) |
| 12.2 | 61.1 | GO:0060200 | clathrin-sculpted acetylcholine transport vesicle(GO:0060200) clathrin-sculpted acetylcholine transport vesicle membrane(GO:0060201) |
| 11.6 | 46.3 | GO:0070032 | synaptobrevin 2-SNAP-25-syntaxin-1a-complexin I complex(GO:0070032) |
| 11.5 | 57.4 | GO:0048787 | presynaptic active zone membrane(GO:0048787) |
| 11.4 | 22.8 | GO:0060203 | clathrin-sculpted glutamate transport vesicle(GO:0060199) clathrin-sculpted glutamate transport vesicle membrane(GO:0060203) |
| 10.3 | 31.0 | GO:0090571 | RNA polymerase II transcription repressor complex(GO:0090571) |
| 9.0 | 54.3 | GO:0005945 | 6-phosphofructokinase complex(GO:0005945) |
| 8.9 | 8.9 | GO:0019034 | viral replication complex(GO:0019034) |
| 8.9 | 71.0 | GO:0044327 | dendritic spine head(GO:0044327) |
| 8.5 | 34.2 | GO:0033596 | TSC1-TSC2 complex(GO:0033596) |
| 8.1 | 48.8 | GO:0045298 | tubulin complex(GO:0045298) |
| 7.7 | 84.6 | GO:0098563 | integral component of synaptic vesicle membrane(GO:0030285) intrinsic component of synaptic vesicle membrane(GO:0098563) |
| 7.5 | 188.5 | GO:0043194 | axon initial segment(GO:0043194) |
| 7.0 | 34.9 | GO:0031673 | H zone(GO:0031673) |
| 6.9 | 96.1 | GO:0098839 | postsynaptic density membrane(GO:0098839) |
| 6.7 | 134.0 | GO:0001518 | voltage-gated sodium channel complex(GO:0001518) |
| 6.4 | 19.1 | GO:0070701 | mucus layer(GO:0070701) |
| 6.2 | 6.2 | GO:0005883 | neurofilament(GO:0005883) |
| 6.1 | 18.4 | GO:0044224 | juxtaparanode region of axon(GO:0044224) |
| 6.1 | 24.5 | GO:0034365 | discoidal high-density lipoprotein particle(GO:0034365) |
| 6.1 | 18.3 | GO:0000333 | telomerase catalytic core complex(GO:0000333) |
| 6.0 | 35.7 | GO:0032584 | growth cone membrane(GO:0032584) |
| 5.9 | 47.1 | GO:0097418 | neurofibrillary tangle(GO:0097418) |
| 5.8 | 69.5 | GO:0060077 | inhibitory synapse(GO:0060077) |
| 5.8 | 75.0 | GO:0033270 | paranode region of axon(GO:0033270) |
| 5.6 | 90.2 | GO:0005890 | sodium:potassium-exchanging ATPase complex(GO:0005890) |
| 5.4 | 16.2 | GO:0031515 | tRNA (m1A) methyltransferase complex(GO:0031515) |
| 5.4 | 27.0 | GO:0036128 | CatSper complex(GO:0036128) |
| 5.2 | 10.4 | GO:0030314 | junctional membrane complex(GO:0030314) |
| 5.2 | 25.8 | GO:0033269 | internode region of axon(GO:0033269) |
| 5.0 | 29.9 | GO:1990682 | CSF1-CSF1R complex(GO:1990682) |
| 4.9 | 48.8 | GO:0035253 | ciliary rootlet(GO:0035253) |
| 4.8 | 311.8 | GO:0005891 | voltage-gated calcium channel complex(GO:0005891) |
| 4.7 | 99.0 | GO:0014731 | spectrin-associated cytoskeleton(GO:0014731) |
| 4.7 | 14.0 | GO:0097224 | sperm connecting piece(GO:0097224) |
| 4.6 | 18.4 | GO:0038038 | G-protein coupled receptor homodimeric complex(GO:0038038) |
| 4.5 | 18.0 | GO:0032144 | 4-aminobutyrate transaminase complex(GO:0032144) |
| 4.2 | 154.8 | GO:1902711 | GABA receptor complex(GO:1902710) GABA-A receptor complex(GO:1902711) |
| 4.1 | 37.1 | GO:1990761 | growth cone lamellipodium(GO:1990761) |
| 4.0 | 4.0 | GO:0016533 | cyclin-dependent protein kinase 5 holoenzyme complex(GO:0016533) |
| 4.0 | 48.0 | GO:0043083 | synaptic cleft(GO:0043083) |
| 3.8 | 11.5 | GO:0030991 | intraciliary transport particle A(GO:0030991) |
| 3.7 | 15.0 | GO:0000801 | central element(GO:0000801) |
| 3.7 | 259.2 | GO:0030672 | synaptic vesicle membrane(GO:0030672) exocytic vesicle membrane(GO:0099501) |
| 3.7 | 40.6 | GO:0030061 | mitochondrial crista(GO:0030061) |
| 3.6 | 10.9 | GO:0034991 | nuclear meiotic cohesin complex(GO:0034991) |
| 3.6 | 46.6 | GO:0036056 | filtration diaphragm(GO:0036056) slit diaphragm(GO:0036057) |
| 3.5 | 31.7 | GO:0033391 | chromatoid body(GO:0033391) |
| 3.5 | 6.9 | GO:0043291 | RAVE complex(GO:0043291) |
| 3.4 | 30.4 | GO:0031209 | SCAR complex(GO:0031209) |
| 3.4 | 30.3 | GO:0032591 | dendritic spine membrane(GO:0032591) |
| 3.3 | 20.0 | GO:1990316 | ATG1/ULK1 kinase complex(GO:1990316) |
| 3.2 | 16.2 | GO:0032444 | activin responsive factor complex(GO:0032444) |
| 3.2 | 35.0 | GO:0005955 | calcineurin complex(GO:0005955) |
| 3.2 | 136.2 | GO:0048786 | presynaptic active zone(GO:0048786) |
| 3.1 | 37.4 | GO:0017146 | NMDA selective glutamate receptor complex(GO:0017146) |
| 3.1 | 486.2 | GO:0043204 | perikaryon(GO:0043204) |
| 3.1 | 15.3 | GO:0071458 | integral component of cytoplasmic side of endoplasmic reticulum membrane(GO:0071458) |
| 3.0 | 6.1 | GO:0097025 | MPP7-DLG1-LIN7 complex(GO:0097025) |
| 3.0 | 45.0 | GO:0032839 | dendrite cytoplasm(GO:0032839) |
| 2.9 | 44.1 | GO:0044298 | neuronal cell body membrane(GO:0032809) cell body membrane(GO:0044298) |
| 2.9 | 20.4 | GO:0097209 | epidermal lamellar body(GO:0097209) |
| 2.9 | 8.7 | GO:0044609 | DBIRD complex(GO:0044609) |
| 2.9 | 8.6 | GO:0016939 | kinesin II complex(GO:0016939) |
| 2.8 | 28.2 | GO:0000235 | astral microtubule(GO:0000235) aster(GO:0005818) |
| 2.7 | 8.2 | GO:0031251 | PAN complex(GO:0031251) |
| 2.7 | 10.8 | GO:0097123 | cyclin A1-CDK2 complex(GO:0097123) |
| 2.7 | 56.2 | GO:0005952 | cAMP-dependent protein kinase complex(GO:0005952) |
| 2.7 | 2.7 | GO:0002139 | stereocilia coupling link(GO:0002139) |
| 2.7 | 632.2 | GO:0099572 | postsynaptic density(GO:0014069) postsynaptic specialization(GO:0099572) |
| 2.6 | 10.6 | GO:1990851 | Wnt-Frizzled-LRP5/6 complex(GO:1990851) |
| 2.6 | 456.6 | GO:0030426 | growth cone(GO:0030426) |
| 2.6 | 10.4 | GO:0097440 | apical dendrite(GO:0097440) |
| 2.6 | 159.8 | GO:0042734 | presynaptic membrane(GO:0042734) |
| 2.5 | 12.7 | GO:0032807 | DNA-dependent protein kinase-DNA ligase 4 complex(GO:0005958) DNA ligase IV complex(GO:0032807) |
| 2.5 | 7.5 | GO:0034686 | integrin alphav-beta8 complex(GO:0034686) |
| 2.5 | 2.5 | GO:0002945 | cyclin K-CDK13 complex(GO:0002945) |
| 2.5 | 2.5 | GO:0042599 | lamellar body(GO:0042599) |
| 2.4 | 21.7 | GO:0071953 | elastic fiber(GO:0071953) |
| 2.4 | 33.8 | GO:0031235 | intrinsic component of the cytoplasmic side of the plasma membrane(GO:0031235) |
| 2.4 | 19.2 | GO:0043203 | axon hillock(GO:0043203) |
| 2.4 | 4.7 | GO:1902937 | inward rectifier potassium channel complex(GO:1902937) |
| 2.4 | 11.8 | GO:0005854 | nascent polypeptide-associated complex(GO:0005854) |
| 2.4 | 7.1 | GO:0014802 | terminal cisterna(GO:0014802) |
| 2.3 | 27.6 | GO:0031594 | neuromuscular junction(GO:0031594) |
| 2.3 | 13.5 | GO:0034673 | inhibin-betaglycan-ActRII complex(GO:0034673) |
| 2.2 | 207.5 | GO:0008076 | voltage-gated potassium channel complex(GO:0008076) potassium channel complex(GO:0034705) |
| 2.2 | 13.4 | GO:0005967 | mitochondrial pyruvate dehydrogenase complex(GO:0005967) |
| 2.2 | 6.6 | GO:0097229 | sperm end piece(GO:0097229) |
| 2.2 | 2.2 | GO:0070044 | synaptobrevin 2-SNAP-25-syntaxin-1a complex(GO:0070044) |
| 2.2 | 10.9 | GO:0032593 | insulin-responsive compartment(GO:0032593) |
| 2.1 | 27.8 | GO:0098647 | collagen type VI trimer(GO:0005589) collagen beaded filament(GO:0098647) |
| 2.1 | 2.1 | GO:0031088 | platelet dense granule membrane(GO:0031088) |
| 2.1 | 14.4 | GO:0045252 | oxoglutarate dehydrogenase complex(GO:0045252) |
| 2.1 | 18.5 | GO:0045180 | basal cortex(GO:0045180) |
| 2.0 | 125.8 | GO:0031463 | Cul3-RING ubiquitin ligase complex(GO:0031463) |
| 2.0 | 18.2 | GO:0097427 | microtubule bundle(GO:0097427) |
| 2.0 | 19.6 | GO:0008091 | spectrin(GO:0008091) |
| 1.9 | 48.7 | GO:0097546 | ciliary base(GO:0097546) |
| 1.9 | 3.8 | GO:0043159 | acrosomal matrix(GO:0043159) |
| 1.9 | 36.2 | GO:0043198 | dendritic shaft(GO:0043198) |
| 1.9 | 20.7 | GO:0030130 | clathrin coat of trans-Golgi network vesicle(GO:0030130) |
| 1.8 | 16.4 | GO:0000137 | Golgi cis cisterna(GO:0000137) |
| 1.8 | 3.6 | GO:0010009 | cytoplasmic side of endosome membrane(GO:0010009) |
| 1.8 | 10.6 | GO:0009331 | glycerol-3-phosphate dehydrogenase complex(GO:0009331) |
| 1.8 | 8.8 | GO:0031232 | extrinsic component of external side of plasma membrane(GO:0031232) |
| 1.7 | 116.6 | GO:0005834 | heterotrimeric G-protein complex(GO:0005834) |
| 1.7 | 22.5 | GO:0005583 | fibrillar collagen trimer(GO:0005583) banded collagen fibril(GO:0098643) |
| 1.7 | 13.9 | GO:0005593 | FACIT collagen trimer(GO:0005593) |
| 1.7 | 6.9 | GO:0030893 | meiotic cohesin complex(GO:0030893) |
| 1.7 | 6.8 | GO:0000818 | nuclear MIS12/MIND complex(GO:0000818) |
| 1.6 | 35.9 | GO:0031312 | extrinsic component of organelle membrane(GO:0031312) |
| 1.6 | 6.4 | GO:0031092 | platelet alpha granule membrane(GO:0031092) |
| 1.6 | 279.2 | GO:0098793 | presynapse(GO:0098793) |
| 1.6 | 22.4 | GO:0048188 | Set1C/COMPASS complex(GO:0048188) |
| 1.6 | 6.3 | GO:1990578 | perinuclear endoplasmic reticulum membrane(GO:1990578) |
| 1.5 | 6.1 | GO:1990879 | CST complex(GO:1990879) |
| 1.5 | 12.1 | GO:0030868 | smooth endoplasmic reticulum membrane(GO:0030868) smooth endoplasmic reticulum part(GO:0097425) |
| 1.5 | 13.1 | GO:0090576 | RNA polymerase III transcription factor complex(GO:0090576) |
| 1.5 | 11.6 | GO:0035976 | AP1 complex(GO:0035976) |
| 1.4 | 41.2 | GO:0044322 | endoplasmic reticulum quality control compartment(GO:0044322) |
| 1.4 | 12.7 | GO:0001520 | outer dense fiber(GO:0001520) |
| 1.4 | 103.9 | GO:0005905 | clathrin-coated pit(GO:0005905) |
| 1.4 | 6.8 | GO:1990131 | EGO complex(GO:0034448) Gtr1-Gtr2 GTPase complex(GO:1990131) |
| 1.4 | 15.0 | GO:0042627 | chylomicron(GO:0042627) |
| 1.3 | 20.2 | GO:0008074 | guanylate cyclase complex, soluble(GO:0008074) |
| 1.3 | 6.7 | GO:0045160 | myosin I complex(GO:0045160) |
| 1.3 | 1.3 | GO:0032590 | dendrite membrane(GO:0032590) |
| 1.3 | 6.7 | GO:0001652 | granular component(GO:0001652) |
| 1.3 | 6.6 | GO:0000138 | Golgi trans cisterna(GO:0000138) |
| 1.3 | 6.5 | GO:0072687 | meiotic spindle(GO:0072687) |
| 1.3 | 16.9 | GO:0030478 | actin cap(GO:0030478) |
| 1.3 | 202.7 | GO:0031225 | anchored component of membrane(GO:0031225) |
| 1.3 | 8.9 | GO:1990130 | Iml1 complex(GO:1990130) |
| 1.3 | 12.5 | GO:0060076 | excitatory synapse(GO:0060076) |
| 1.3 | 22.5 | GO:0005922 | connexon complex(GO:0005922) |
| 1.2 | 5.0 | GO:0005879 | axonemal microtubule(GO:0005879) |
| 1.2 | 18.0 | GO:0098574 | cytoplasmic side of lysosomal membrane(GO:0098574) |
| 1.2 | 7.1 | GO:0060091 | kinocilium(GO:0060091) |
| 1.2 | 33.0 | GO:0001917 | photoreceptor inner segment(GO:0001917) |
| 1.2 | 11.7 | GO:0008024 | cyclin/CDK positive transcription elongation factor complex(GO:0008024) |
| 1.1 | 99.9 | GO:0036064 | ciliary basal body(GO:0036064) |
| 1.1 | 5.6 | GO:0031302 | intrinsic component of endosome membrane(GO:0031302) |
| 1.1 | 10.1 | GO:0032281 | AMPA glutamate receptor complex(GO:0032281) |
| 1.1 | 3.3 | GO:0036029 | protein C inhibitor-TMPRSS7 complex(GO:0036024) protein C inhibitor-TMPRSS11E complex(GO:0036025) protein C inhibitor-PLAT complex(GO:0036026) protein C inhibitor-PLAU complex(GO:0036027) protein C inhibitor-thrombin complex(GO:0036028) protein C inhibitor-KLK3 complex(GO:0036029) protein C inhibitor-plasma kallikrein complex(GO:0036030) serine protease inhibitor complex(GO:0097180) protein C inhibitor-coagulation factor V complex(GO:0097181) protein C inhibitor-coagulation factor Xa complex(GO:0097182) protein C inhibitor-coagulation factor XI complex(GO:0097183) |
| 1.1 | 3.3 | GO:0034464 | BBSome(GO:0034464) |
| 1.1 | 3.3 | GO:0035189 | Rb-E2F complex(GO:0035189) |
| 1.1 | 16.5 | GO:0005847 | mRNA cleavage and polyadenylation specificity factor complex(GO:0005847) |
| 1.1 | 3.3 | GO:0031933 | telomeric heterochromatin(GO:0031933) |
| 1.1 | 11.8 | GO:0000808 | origin recognition complex(GO:0000808) nuclear origin of replication recognition complex(GO:0005664) |
| 1.0 | 7.3 | GO:0090533 | cation-transporting ATPase complex(GO:0090533) |
| 1.0 | 14.6 | GO:0031588 | nucleotide-activated protein kinase complex(GO:0031588) |
| 1.0 | 9.3 | GO:0005672 | transcription factor TFIIA complex(GO:0005672) |
| 1.0 | 3.0 | GO:0043293 | apoptosome(GO:0043293) |
| 1.0 | 3.0 | GO:0016938 | kinesin I complex(GO:0016938) |
| 1.0 | 12.9 | GO:0000800 | lateral element(GO:0000800) |
| 1.0 | 2.9 | GO:0098536 | deuterosome(GO:0098536) |
| 1.0 | 22.1 | GO:0030673 | axolemma(GO:0030673) |
| 0.9 | 4.6 | GO:0070847 | core mediator complex(GO:0070847) |
| 0.9 | 4.6 | GO:0045293 | MIS complex(GO:0036396) mRNA editing complex(GO:0045293) |
| 0.9 | 0.9 | GO:0098592 | cytoplasmic side of apical plasma membrane(GO:0098592) |
| 0.9 | 5.5 | GO:1990452 | Parkin-FBXW7-Cul1 ubiquitin ligase complex(GO:1990452) |
| 0.9 | 2.7 | GO:0030430 | host cell cytoplasm(GO:0030430) host cell cytoplasm part(GO:0033655) |
| 0.9 | 11.7 | GO:0030123 | AP-3 adaptor complex(GO:0030123) |
| 0.9 | 4.5 | GO:0046696 | lipopolysaccharide receptor complex(GO:0046696) |
| 0.9 | 47.8 | GO:0005581 | collagen trimer(GO:0005581) |
| 0.9 | 16.7 | GO:0044306 | neuron projection terminus(GO:0044306) |
| 0.9 | 96.4 | GO:0045211 | postsynaptic membrane(GO:0045211) |
| 0.9 | 34.0 | GO:0033017 | sarcoplasmic reticulum membrane(GO:0033017) |
| 0.9 | 3.5 | GO:0070695 | FHF complex(GO:0070695) |
| 0.9 | 1.7 | GO:0097208 | alveolar lamellar body(GO:0097208) |
| 0.8 | 2.5 | GO:0005944 | phosphatidylinositol 3-kinase complex, class IB(GO:0005944) |
| 0.8 | 8.5 | GO:0042567 | insulin-like growth factor ternary complex(GO:0042567) |
| 0.8 | 15.0 | GO:0098827 | endoplasmic reticulum subcompartment(GO:0098827) |
| 0.8 | 35.5 | GO:0031901 | early endosome membrane(GO:0031901) |
| 0.8 | 3.3 | GO:0070876 | SOSS complex(GO:0070876) |
| 0.8 | 2.5 | GO:0031085 | BLOC-3 complex(GO:0031085) |
| 0.8 | 2.4 | GO:0030956 | glutamyl-tRNA(Gln) amidotransferase complex(GO:0030956) |
| 0.8 | 0.8 | GO:0036020 | endolysosome membrane(GO:0036020) |
| 0.8 | 5.3 | GO:0031233 | intrinsic component of external side of plasma membrane(GO:0031233) |
| 0.7 | 2.9 | GO:0033018 | sarcoplasmic reticulum lumen(GO:0033018) |
| 0.7 | 2.7 | GO:0070022 | transforming growth factor beta receptor homodimeric complex(GO:0070022) |
| 0.7 | 10.3 | GO:0005833 | hemoglobin complex(GO:0005833) |
| 0.7 | 12.2 | GO:0005942 | phosphatidylinositol 3-kinase complex(GO:0005942) |
| 0.7 | 2.7 | GO:0097431 | mitotic spindle pole(GO:0097431) |
| 0.7 | 4.7 | GO:0002116 | semaphorin receptor complex(GO:0002116) |
| 0.7 | 4.0 | GO:0031501 | mannosyltransferase complex(GO:0031501) |
| 0.7 | 2.6 | GO:0032777 | Piccolo NuA4 histone acetyltransferase complex(GO:0032777) |
| 0.7 | 142.6 | GO:0043025 | neuronal cell body(GO:0043025) |
| 0.6 | 1.9 | GO:0036398 | TCR signalosome(GO:0036398) |
| 0.6 | 8.9 | GO:0031082 | BLOC complex(GO:0031082) |
| 0.6 | 4.9 | GO:0072487 | MSL complex(GO:0072487) |
| 0.6 | 2.4 | GO:0035363 | histone locus body(GO:0035363) |
| 0.6 | 7.2 | GO:0043218 | compact myelin(GO:0043218) |
| 0.6 | 17.9 | GO:0005697 | telomerase holoenzyme complex(GO:0005697) |
| 0.6 | 9.3 | GO:0030057 | desmosome(GO:0030057) |
| 0.6 | 2.3 | GO:0097539 | ciliary transition fiber(GO:0097539) |
| 0.6 | 2.8 | GO:0002080 | acrosomal membrane(GO:0002080) |
| 0.5 | 8.1 | GO:0000164 | protein phosphatase type 1 complex(GO:0000164) |
| 0.5 | 3.8 | GO:0030427 | site of polarized growth(GO:0030427) |
| 0.5 | 2.1 | GO:0005965 | protein farnesyltransferase complex(GO:0005965) |
| 0.5 | 13.6 | GO:0097014 | axoneme(GO:0005930) ciliary plasm(GO:0097014) |
| 0.5 | 20.3 | GO:0005871 | kinesin complex(GO:0005871) |
| 0.5 | 12.8 | GO:0005791 | rough endoplasmic reticulum(GO:0005791) |
| 0.5 | 5.6 | GO:0016529 | sarcoplasmic reticulum(GO:0016529) |
| 0.5 | 1.5 | GO:0030897 | HOPS complex(GO:0030897) |
| 0.5 | 0.5 | GO:0097060 | synaptic membrane(GO:0097060) |
| 0.5 | 4.4 | GO:0072546 | ER membrane protein complex(GO:0072546) |
| 0.5 | 22.8 | GO:0005881 | cytoplasmic microtubule(GO:0005881) |
| 0.5 | 5.3 | GO:0044300 | cerebellar mossy fiber(GO:0044300) |
| 0.5 | 8.6 | GO:0016471 | vacuolar proton-transporting V-type ATPase complex(GO:0016471) |
| 0.5 | 1.4 | GO:0001931 | uropod(GO:0001931) cell trailing edge(GO:0031254) |
| 0.5 | 1.9 | GO:0030131 | clathrin adaptor complex(GO:0030131) |
| 0.5 | 110.7 | GO:0016323 | basolateral plasma membrane(GO:0016323) |
| 0.4 | 91.5 | GO:0005802 | trans-Golgi network(GO:0005802) |
| 0.4 | 4.0 | GO:0000813 | ESCRT I complex(GO:0000813) |
| 0.4 | 1.8 | GO:0034363 | intermediate-density lipoprotein particle(GO:0034363) |
| 0.4 | 19.2 | GO:0005902 | microvillus(GO:0005902) |
| 0.4 | 3.3 | GO:1905202 | 3-methylcrotonyl-CoA carboxylase complex, mitochondrial(GO:0002169) methylcrotonoyl-CoA carboxylase complex(GO:1905202) |
| 0.4 | 2.8 | GO:0031985 | Golgi cisterna(GO:0031985) |
| 0.4 | 10.8 | GO:0005682 | U5 snRNP(GO:0005682) |
| 0.4 | 0.8 | GO:0034385 | very-low-density lipoprotein particle(GO:0034361) triglyceride-rich lipoprotein particle(GO:0034385) |
| 0.4 | 1.6 | GO:0071797 | LUBAC complex(GO:0071797) |
| 0.4 | 3.0 | GO:0005579 | membrane attack complex(GO:0005579) |
| 0.4 | 4.4 | GO:0097486 | multivesicular body lumen(GO:0097486) |
| 0.4 | 1.4 | GO:1903439 | calcitonin family receptor complex(GO:1903439) amylin receptor complex(GO:1903440) |
| 0.3 | 1.4 | GO:0002177 | manchette(GO:0002177) |
| 0.3 | 0.7 | GO:0045179 | apical cortex(GO:0045179) |
| 0.3 | 1.0 | GO:0034362 | low-density lipoprotein particle(GO:0034362) |
| 0.3 | 1.9 | GO:0005869 | dynactin complex(GO:0005869) |
| 0.3 | 12.5 | GO:0016235 | aggresome(GO:0016235) |
| 0.3 | 5.7 | GO:0030904 | retromer complex(GO:0030904) |
| 0.3 | 20.7 | GO:0005814 | centriole(GO:0005814) |
| 0.3 | 0.9 | GO:0097058 | CRLF-CLCF1 complex(GO:0097058) |
| 0.3 | 2.4 | GO:0070776 | H3 histone acetyltransferase complex(GO:0070775) MOZ/MORF histone acetyltransferase complex(GO:0070776) |
| 0.3 | 43.1 | GO:0001650 | fibrillar center(GO:0001650) |
| 0.3 | 21.4 | GO:0005875 | microtubule associated complex(GO:0005875) |
| 0.3 | 1.5 | GO:0005921 | gap junction(GO:0005921) |
| 0.3 | 2.1 | GO:0097381 | photoreceptor disc membrane(GO:0097381) |
| 0.3 | 1.2 | GO:0016013 | syntrophin complex(GO:0016013) |
| 0.3 | 2.5 | GO:0005614 | interstitial matrix(GO:0005614) |
| 0.3 | 0.6 | GO:0000805 | X chromosome(GO:0000805) |
| 0.3 | 1.1 | GO:0032937 | SREBP-SCAP-Insig complex(GO:0032937) |
| 0.3 | 17.3 | GO:0044438 | microbody part(GO:0044438) peroxisomal part(GO:0044439) |
| 0.3 | 1.1 | GO:0005968 | Rab-protein geranylgeranyltransferase complex(GO:0005968) |
| 0.3 | 7.4 | GO:0031231 | integral component of peroxisomal membrane(GO:0005779) intrinsic component of peroxisomal membrane(GO:0031231) |
| 0.3 | 6.8 | GO:0036126 | sperm flagellum(GO:0036126) |
| 0.3 | 1.3 | GO:0061700 | Seh1-associated complex(GO:0035859) GATOR2 complex(GO:0061700) |
| 0.2 | 1.7 | GO:0070187 | telosome(GO:0070187) |
| 0.2 | 0.5 | GO:0032449 | CBM complex(GO:0032449) |
| 0.2 | 1.6 | GO:0031045 | dense core granule(GO:0031045) |
| 0.2 | 0.7 | GO:0034657 | GID complex(GO:0034657) |
| 0.2 | 2.3 | GO:0005964 | phosphorylase kinase complex(GO:0005964) |
| 0.2 | 3.6 | GO:0000974 | Prp19 complex(GO:0000974) |
| 0.2 | 1.8 | GO:0071437 | invadopodium(GO:0071437) |
| 0.2 | 912.2 | GO:0031224 | intrinsic component of membrane(GO:0031224) |
| 0.2 | 2.1 | GO:0031462 | Cul2-RING ubiquitin ligase complex(GO:0031462) |
| 0.2 | 0.4 | GO:0005828 | kinetochore microtubule(GO:0005828) |
| 0.2 | 13.4 | GO:0009897 | external side of plasma membrane(GO:0009897) |
| 0.2 | 0.4 | GO:0097679 | other organism cytoplasm(GO:0097679) |
| 0.2 | 0.7 | GO:0042272 | nuclear RNA export factor complex(GO:0042272) |
| 0.2 | 6.6 | GO:0055037 | recycling endosome(GO:0055037) |
| 0.1 | 0.7 | GO:0030896 | checkpoint clamp complex(GO:0030896) |
| 0.1 | 0.1 | GO:0034274 | Atg12-Atg5-Atg16 complex(GO:0034274) |
| 0.1 | 1.2 | GO:0036019 | endolysosome(GO:0036019) |
| 0.1 | 4.7 | GO:0045171 | intercellular bridge(GO:0045171) |
| 0.1 | 0.8 | GO:0016328 | lateral plasma membrane(GO:0016328) |
| 0.1 | 0.4 | GO:0001940 | male pronucleus(GO:0001940) |
| 0.1 | 0.1 | GO:1990723 | cytoplasmic periphery of the nuclear pore complex(GO:1990723) |
| 0.1 | 0.3 | GO:0031467 | Cul7-RING ubiquitin ligase complex(GO:0031467) |
| 0.1 | 0.3 | GO:0097524 | sperm plasma membrane(GO:0097524) |
| 0.1 | 1.9 | GO:0016592 | mediator complex(GO:0016592) |
| 0.1 | 0.3 | GO:0034388 | Pwp2p-containing subcomplex of 90S preribosome(GO:0034388) |
| 0.0 | 0.2 | GO:0005947 | mitochondrial alpha-ketoglutarate dehydrogenase complex(GO:0005947) |
| 0.0 | 0.5 | GO:1990752 | microtubule end(GO:1990752) |
Gene overrepresentation in molecular function category:
| Log-likelihood per target | Total log-likelihood | Term | Description |
|---|---|---|---|
| 46.7 | 187.0 | GO:0004965 | G-protein coupled GABA receptor activity(GO:0004965) |
| 16.5 | 66.1 | GO:0015018 | galactosylgalactosylxylosylprotein 3-beta-glucuronosyltransferase activity(GO:0015018) |
| 15.7 | 78.5 | GO:0086062 | voltage-gated sodium channel activity involved in Purkinje myocyte action potential(GO:0086062) |
| 14.0 | 112.2 | GO:0005332 | gamma-aminobutyric acid:sodium symporter activity(GO:0005332) gamma-aminobutyric acid transmembrane transporter activity(GO:0015185) |
| 13.7 | 41.2 | GO:0004782 | sulfinoalanine decarboxylase activity(GO:0004782) |
| 13.3 | 40.0 | GO:0030350 | iron-responsive element binding(GO:0030350) |
| 13.1 | 52.5 | GO:0005163 | nerve growth factor receptor binding(GO:0005163) |
| 12.8 | 51.3 | GO:0097001 | ceramide binding(GO:0097001) |
| 11.2 | 33.7 | GO:0031849 | olfactory receptor binding(GO:0031849) |
| 10.1 | 40.6 | GO:0042030 | ATPase inhibitor activity(GO:0042030) |
| 10.1 | 81.2 | GO:0004971 | AMPA glutamate receptor activity(GO:0004971) |
| 10.0 | 129.4 | GO:0005391 | sodium:potassium-exchanging ATPase activity(GO:0005391) |
| 9.6 | 28.7 | GO:0030226 | apolipoprotein receptor activity(GO:0030226) |
| 9.4 | 75.5 | GO:0031811 | G-protein coupled nucleotide receptor binding(GO:0031811) P2Y1 nucleotide receptor binding(GO:0031812) |
| 9.0 | 36.1 | GO:0035373 | chondroitin sulfate proteoglycan binding(GO:0035373) |
| 9.0 | 72.0 | GO:0004351 | glutamate decarboxylase activity(GO:0004351) |
| 8.7 | 26.0 | GO:0008427 | calcium-dependent protein kinase inhibitor activity(GO:0008427) |
| 8.7 | 34.7 | GO:0061628 | H3K27me3 modified histone binding(GO:0061628) |
| 8.6 | 34.5 | GO:0070326 | very-low-density lipoprotein particle receptor binding(GO:0070326) |
| 8.5 | 25.6 | GO:0086059 | voltage-gated calcium channel activity involved SA node cell action potential(GO:0086059) |
| 8.3 | 166.2 | GO:0097109 | neuroligin family protein binding(GO:0097109) |
| 8.2 | 65.7 | GO:0004865 | protein serine/threonine phosphatase inhibitor activity(GO:0004865) |
| 8.1 | 48.8 | GO:0060961 | phospholipase D inhibitor activity(GO:0060961) |
| 8.1 | 40.6 | GO:0000298 | endopolyphosphatase activity(GO:0000298) diphosphoinositol-polyphosphate diphosphatase activity(GO:0008486) bis(5'-adenosyl)-hexaphosphatase activity(GO:0034431) bis(5'-adenosyl)-pentaphosphatase activity(GO:0034432) inositol diphosphate tetrakisphosphate diphosphatase activity(GO:0052840) inositol bisdiphosphate tetrakisphosphate diphosphatase activity(GO:0052841) inositol diphosphate pentakisphosphate diphosphatase activity(GO:0052842) inositol-1-diphosphate-2,3,4,5,6-pentakisphosphate diphosphatase activity(GO:0052843) inositol-3-diphosphate-1,2,4,5,6-pentakisphosphate diphosphatase activity(GO:0052844) inositol-5-diphosphate-1,2,3,4,6-pentakisphosphate diphosphatase activity(GO:0052845) inositol-1,5-bisdiphosphate-2,3,4,6-tetrakisphosphate 1-diphosphatase activity(GO:0052846) inositol-1,5-bisdiphosphate-2,3,4,6-tetrakisphosphate 5-diphosphatase activity(GO:0052847) inositol-3,5-bisdiphosphate-2,3,4,6-tetrakisphosphate 5-diphosphatase activity(GO:0052848) |
| 8.1 | 8.1 | GO:0050682 | AF-2 domain binding(GO:0050682) |
| 8.1 | 250.1 | GO:0008331 | high voltage-gated calcium channel activity(GO:0008331) |
| 8.0 | 32.0 | GO:0099609 | microtubule lateral binding(GO:0099609) |
| 7.9 | 23.6 | GO:0044323 | retinoic acid-responsive element binding(GO:0044323) |
| 7.8 | 31.2 | GO:0000309 | nicotinamide-nucleotide adenylyltransferase activity(GO:0000309) |
| 7.7 | 100.3 | GO:0022851 | GABA-gated chloride ion channel activity(GO:0022851) |
| 7.5 | 225.7 | GO:0005212 | structural constituent of eye lens(GO:0005212) |
| 7.4 | 51.6 | GO:0010853 | cyclase activator activity(GO:0010853) guanylate cyclase activator activity(GO:0030250) |
| 7.2 | 7.2 | GO:0030618 | transforming growth factor beta receptor, pathway-specific cytoplasmic mediator activity(GO:0030618) |
| 7.0 | 21.1 | GO:0001641 | group II metabotropic glutamate receptor activity(GO:0001641) |
| 6.6 | 53.0 | GO:0003872 | 6-phosphofructokinase activity(GO:0003872) |
| 6.6 | 19.9 | GO:0004157 | dihydropyrimidinase activity(GO:0004157) |
| 6.6 | 85.8 | GO:0005432 | calcium:sodium antiporter activity(GO:0005432) |
| 6.6 | 203.5 | GO:0005001 | transmembrane receptor protein tyrosine phosphatase activity(GO:0005001) transmembrane receptor protein phosphatase activity(GO:0019198) |
| 6.5 | 19.6 | GO:0005128 | erythropoietin receptor binding(GO:0005128) |
| 6.3 | 69.7 | GO:0005030 | neurotrophin receptor activity(GO:0005030) |
| 6.3 | 56.6 | GO:0035727 | lysophosphatidic acid binding(GO:0035727) |
| 6.3 | 18.9 | GO:0031696 | alpha-2C adrenergic receptor binding(GO:0031696) |
| 6.3 | 69.1 | GO:0032051 | clathrin light chain binding(GO:0032051) |
| 6.3 | 87.6 | GO:0022820 | potassium:chloride symporter activity(GO:0015379) potassium ion symporter activity(GO:0022820) |
| 6.2 | 18.7 | GO:0033691 | sialic acid binding(GO:0033691) |
| 6.2 | 18.6 | GO:0098640 | integrin binding involved in cell-matrix adhesion(GO:0098640) |
| 6.2 | 129.6 | GO:0043274 | phospholipase binding(GO:0043274) |
| 6.1 | 55.0 | GO:0031697 | beta-1 adrenergic receptor binding(GO:0031697) |
| 6.1 | 110.0 | GO:0008179 | adenylate cyclase binding(GO:0008179) |
| 6.1 | 30.4 | GO:0070097 | delta-catenin binding(GO:0070097) |
| 6.0 | 29.9 | GO:0005157 | macrophage colony-stimulating factor receptor binding(GO:0005157) |
| 6.0 | 17.9 | GO:0086006 | voltage-gated sodium channel activity involved in cardiac muscle cell action potential(GO:0086006) |
| 5.9 | 53.1 | GO:0030274 | LIM domain binding(GO:0030274) |
| 5.9 | 46.9 | GO:0004111 | creatine kinase activity(GO:0004111) |
| 5.8 | 34.8 | GO:0008273 | calcium, potassium:sodium antiporter activity(GO:0008273) |
| 5.6 | 22.4 | GO:0061769 | ribosylnicotinamide kinase activity(GO:0050262) ribosylnicotinate kinase activity(GO:0061769) |
| 5.6 | 27.8 | GO:0004122 | cystathionine beta-synthase activity(GO:0004122) |
| 5.5 | 16.6 | GO:0016838 | carbon-oxygen lyase activity, acting on phosphates(GO:0016838) |
| 5.5 | 21.9 | GO:0004667 | prostaglandin-D synthase activity(GO:0004667) |
| 5.4 | 16.2 | GO:0016429 | tRNA (adenine-N1-)-methyltransferase activity(GO:0016429) |
| 5.3 | 26.7 | GO:0044729 | hemi-methylated DNA-binding(GO:0044729) |
| 5.2 | 15.7 | GO:0050405 | [hydroxymethylglutaryl-CoA reductase (NADPH)] kinase activity(GO:0047322) [acetyl-CoA carboxylase] kinase activity(GO:0050405) |
| 5.2 | 62.8 | GO:0019911 | structural constituent of myelin sheath(GO:0019911) |
| 5.2 | 62.7 | GO:0001206 | transcriptional repressor activity, RNA polymerase II distal enhancer sequence-specific binding(GO:0001206) |
| 5.1 | 15.2 | GO:0005017 | platelet-derived growth factor-activated receptor activity(GO:0005017) |
| 5.1 | 25.3 | GO:0015319 | sodium:inorganic phosphate symporter activity(GO:0015319) |
| 5.0 | 60.5 | GO:0008430 | selenium binding(GO:0008430) |
| 5.0 | 15.1 | GO:0016309 | 1-phosphatidylinositol-5-phosphate 4-kinase activity(GO:0016309) |
| 5.0 | 44.8 | GO:0015277 | kainate selective glutamate receptor activity(GO:0015277) |
| 4.8 | 14.4 | GO:0061697 | protein-malonyllysine demalonylase activity(GO:0036054) protein-succinyllysine desuccinylase activity(GO:0036055) protein-glutaryllysine deglutarylase activity(GO:0061697) |
| 4.8 | 9.6 | GO:0004999 | vasoactive intestinal polypeptide receptor activity(GO:0004999) |
| 4.8 | 14.3 | GO:0001640 | adenylate cyclase inhibiting G-protein coupled glutamate receptor activity(GO:0001640) G-protein coupled glutamate receptor activity(GO:0098988) |
| 4.7 | 18.9 | GO:0010385 | double-stranded methylated DNA binding(GO:0010385) |
| 4.7 | 14.0 | GO:0032027 | myosin light chain binding(GO:0032027) |
| 4.6 | 83.0 | GO:0004089 | carbonate dehydratase activity(GO:0004089) |
| 4.5 | 18.2 | GO:0046592 | polyamine oxidase activity(GO:0046592) spermine:oxygen oxidoreductase (spermidine-forming) activity(GO:0052901) |
| 4.5 | 18.0 | GO:0004741 | [pyruvate dehydrogenase (lipoamide)] phosphatase activity(GO:0004741) |
| 4.5 | 18.0 | GO:0032145 | 4-aminobutyrate transaminase activity(GO:0003867) succinate-semialdehyde dehydrogenase binding(GO:0032145) (S)-3-amino-2-methylpropionate transaminase activity(GO:0047298) |
| 4.4 | 26.6 | GO:0016900 | oxidoreductase activity, acting on the CH-OH group of donors, disulfide as acceptor(GO:0016900) vitamin-K-epoxide reductase (warfarin-sensitive) activity(GO:0047057) |
| 4.4 | 30.6 | GO:0003828 | alpha-N-acetylneuraminate alpha-2,8-sialyltransferase activity(GO:0003828) |
| 4.4 | 21.8 | GO:1902282 | voltage-gated potassium channel activity involved in ventricular cardiac muscle cell action potential repolarization(GO:1902282) |
| 4.3 | 52.0 | GO:0004118 | cGMP-stimulated cyclic-nucleotide phosphodiesterase activity(GO:0004118) |
| 4.3 | 38.4 | GO:0046975 | histone methyltransferase activity (H3-K36 specific)(GO:0046975) |
| 4.2 | 88.2 | GO:0001087 | transcription factor activity, sequence-specific DNA binding, RNA polymerase recruiting(GO:0001011) transcription factor activity, TFIIB-class binding(GO:0001087) |
| 4.2 | 54.1 | GO:0004705 | JUN kinase activity(GO:0004705) SAP kinase activity(GO:0016909) |
| 4.2 | 29.1 | GO:0030160 | GKAP/Homer scaffold activity(GO:0030160) |
| 4.2 | 108.0 | GO:0005545 | 1-phosphatidylinositol binding(GO:0005545) |
| 4.1 | 28.8 | GO:0000155 | phosphorelay sensor kinase activity(GO:0000155) |
| 4.1 | 57.6 | GO:0015501 | glutamate:sodium symporter activity(GO:0015501) |
| 4.0 | 20.2 | GO:0004522 | ribonuclease A activity(GO:0004522) |
| 4.0 | 52.1 | GO:0031681 | G-protein beta-subunit binding(GO:0031681) |
| 4.0 | 28.0 | GO:0043812 | phosphatidylinositol-4-phosphate phosphatase activity(GO:0043812) |
| 4.0 | 24.0 | GO:0099583 | neurotransmitter receptor activity involved in regulation of postsynaptic cytosolic calcium ion concentration(GO:0099583) |
| 4.0 | 20.0 | GO:0042903 | tubulin deacetylase activity(GO:0042903) |
| 3.9 | 109.9 | GO:0016917 | GABA-A receptor activity(GO:0004890) GABA receptor activity(GO:0016917) |
| 3.9 | 11.7 | GO:0033142 | progesterone receptor binding(GO:0033142) |
| 3.8 | 23.1 | GO:0003998 | acylphosphatase activity(GO:0003998) |
| 3.7 | 3.7 | GO:0016647 | oxidoreductase activity, acting on the CH-NH group of donors, oxygen as acceptor(GO:0016647) |
| 3.7 | 70.7 | GO:0031005 | filamin binding(GO:0031005) |
| 3.7 | 33.4 | GO:0016206 | catechol O-methyltransferase activity(GO:0016206) |
| 3.7 | 29.6 | GO:0052832 | inositol monophosphate 1-phosphatase activity(GO:0008934) inositol monophosphate 3-phosphatase activity(GO:0052832) inositol monophosphate 4-phosphatase activity(GO:0052833) inositol monophosphate phosphatase activity(GO:0052834) |
| 3.7 | 18.3 | GO:0004591 | oxoglutarate dehydrogenase (succinyl-transferring) activity(GO:0004591) |
| 3.6 | 14.6 | GO:0035939 | microsatellite binding(GO:0035939) |
| 3.6 | 10.7 | GO:0036505 | prosaposin receptor activity(GO:0036505) |
| 3.5 | 17.7 | GO:0034714 | type III transforming growth factor beta receptor binding(GO:0034714) |
| 3.5 | 10.6 | GO:1904928 | coreceptor activity involved in canonical Wnt signaling pathway(GO:1904928) |
| 3.5 | 14.1 | GO:0016639 | oxidoreductase activity, acting on the CH-NH2 group of donors, NAD or NADP as acceptor(GO:0016639) |
| 3.5 | 10.4 | GO:0008169 | C-methyltransferase activity(GO:0008169) |
| 3.5 | 20.7 | GO:0004359 | glutaminase activity(GO:0004359) |
| 3.4 | 13.7 | GO:0047288 | monosialoganglioside sialyltransferase activity(GO:0047288) |
| 3.4 | 13.7 | GO:0003990 | acetylcholinesterase activity(GO:0003990) |
| 3.4 | 10.1 | GO:0017129 | triglyceride binding(GO:0017129) |
| 3.3 | 188.0 | GO:0030507 | spectrin binding(GO:0030507) |
| 3.3 | 13.2 | GO:0000995 | transcription factor activity, core RNA polymerase III binding(GO:0000995) |
| 3.3 | 9.8 | GO:0016497 | substance K receptor activity(GO:0016497) |
| 3.2 | 32.1 | GO:0004972 | NMDA glutamate receptor activity(GO:0004972) |
| 3.2 | 9.6 | GO:0008321 | Ral guanyl-nucleotide exchange factor activity(GO:0008321) |
| 3.2 | 9.5 | GO:0015275 | stretch-activated, cation-selective, calcium channel activity(GO:0015275) |
| 3.1 | 43.7 | GO:0042800 | histone methyltransferase activity (H3-K4 specific)(GO:0042800) |
| 3.1 | 15.6 | GO:0070051 | fibrinogen binding(GO:0070051) |
| 3.1 | 12.3 | GO:0015057 | thrombin receptor activity(GO:0015057) |
| 3.1 | 21.5 | GO:0001517 | N-acetylglucosamine 6-O-sulfotransferase activity(GO:0001517) |
| 3.1 | 12.3 | GO:0072320 | volume-sensitive chloride channel activity(GO:0072320) |
| 3.1 | 18.4 | GO:0005219 | ryanodine-sensitive calcium-release channel activity(GO:0005219) |
| 3.1 | 48.9 | GO:0031821 | G-protein coupled serotonin receptor binding(GO:0031821) |
| 3.0 | 15.1 | GO:0016841 | ammonia-lyase activity(GO:0016841) |
| 3.0 | 11.9 | GO:0032406 | MutLbeta complex binding(GO:0032406) MutSbeta complex binding(GO:0032408) |
| 2.9 | 23.1 | GO:0060228 | phosphatidylcholine-sterol O-acyltransferase activator activity(GO:0060228) |
| 2.9 | 40.3 | GO:0086080 | protein binding involved in heterotypic cell-cell adhesion(GO:0086080) |
| 2.9 | 40.3 | GO:0005078 | MAP-kinase scaffold activity(GO:0005078) |
| 2.9 | 14.4 | GO:0005052 | peroxisome matrix targeting signal-1 binding(GO:0005052) |
| 2.9 | 8.6 | GO:0001601 | peptide YY receptor activity(GO:0001601) |
| 2.9 | 42.8 | GO:0008140 | cAMP response element binding protein binding(GO:0008140) |
| 2.8 | 25.5 | GO:0097322 | 7SK snRNA binding(GO:0097322) |
| 2.8 | 56.1 | GO:0003708 | retinoic acid receptor activity(GO:0003708) |
| 2.8 | 14.0 | GO:0004045 | aminoacyl-tRNA hydrolase activity(GO:0004045) |
| 2.7 | 16.5 | GO:0031735 | CCR10 chemokine receptor binding(GO:0031735) |
| 2.7 | 10.9 | GO:0004341 | gluconolactonase activity(GO:0004341) |
| 2.7 | 5.4 | GO:0061629 | RNA polymerase II sequence-specific DNA binding transcription factor binding(GO:0061629) |
| 2.7 | 43.2 | GO:0005245 | voltage-gated calcium channel activity(GO:0005245) |
| 2.7 | 27.0 | GO:0022841 | potassium ion leak channel activity(GO:0022841) |
| 2.7 | 10.7 | GO:0004079 | biotin-[acetyl-CoA-carboxylase] ligase activity(GO:0004077) biotin-[methylcrotonoyl-CoA-carboxylase] ligase activity(GO:0004078) biotin-[methylmalonyl-CoA-carboxytransferase] ligase activity(GO:0004079) biotin-[propionyl-CoA-carboxylase (ATP-hydrolyzing)] ligase activity(GO:0004080) biotin-protein ligase activity(GO:0018271) |
| 2.7 | 10.6 | GO:0052591 | sn-glycerol-3-phosphate:ubiquinone oxidoreductase activity(GO:0052590) sn-glycerol-3-phosphate:ubiquinone-8 oxidoreductase activity(GO:0052591) |
| 2.7 | 34.5 | GO:0030306 | ADP-ribosylation factor binding(GO:0030306) |
| 2.6 | 15.9 | GO:0004740 | pyruvate dehydrogenase (acetyl-transferring) kinase activity(GO:0004740) |
| 2.6 | 23.7 | GO:0046935 | 1-phosphatidylinositol-3-kinase regulator activity(GO:0046935) |
| 2.6 | 50.0 | GO:0047555 | 3',5'-cyclic-GMP phosphodiesterase activity(GO:0047555) |
| 2.6 | 7.9 | GO:0047391 | alkylglycerophosphoethanolamine phosphodiesterase activity(GO:0047391) |
| 2.6 | 23.3 | GO:0015272 | ATP-activated inward rectifier potassium channel activity(GO:0015272) |
| 2.5 | 12.6 | GO:0031871 | proteinase activated receptor binding(GO:0031871) |
| 2.5 | 15.1 | GO:0042285 | UDP-xylosyltransferase activity(GO:0035252) xylosyltransferase activity(GO:0042285) |
| 2.5 | 12.6 | GO:0005105 | type 1 fibroblast growth factor receptor binding(GO:0005105) |
| 2.5 | 9.9 | GO:0032184 | SUMO polymer binding(GO:0032184) |
| 2.4 | 21.9 | GO:0034711 | inhibin binding(GO:0034711) |
| 2.4 | 4.9 | GO:0004938 | alpha2-adrenergic receptor activity(GO:0004938) |
| 2.4 | 70.0 | GO:0005388 | calcium-transporting ATPase activity(GO:0005388) |
| 2.4 | 12.1 | GO:0005298 | proline:sodium symporter activity(GO:0005298) |
| 2.4 | 57.6 | GO:0005248 | voltage-gated sodium channel activity(GO:0005248) voltage-gated ion channel activity involved in regulation of postsynaptic membrane potential(GO:1905030) |
| 2.4 | 26.4 | GO:0051864 | histone demethylase activity (H3-K36 specific)(GO:0051864) |
| 2.4 | 21.5 | GO:0046920 | alpha-(1->3)-fucosyltransferase activity(GO:0046920) |
| 2.4 | 7.1 | GO:0033188 | sphingomyelin synthase activity(GO:0033188) ceramide cholinephosphotransferase activity(GO:0047493) |
| 2.4 | 16.7 | GO:0042500 | aspartic endopeptidase activity, intramembrane cleaving(GO:0042500) |
| 2.4 | 26.0 | GO:0017034 | Rap guanyl-nucleotide exchange factor activity(GO:0017034) |
| 2.4 | 11.8 | GO:0051120 | hepoxilin A3 synthase activity(GO:0051120) |
| 2.4 | 16.5 | GO:0008440 | inositol-1,4,5-trisphosphate 3-kinase activity(GO:0008440) |
| 2.3 | 49.3 | GO:0005112 | Notch binding(GO:0005112) |
| 2.3 | 7.0 | GO:0052810 | 1-phosphatidylinositol-5-kinase activity(GO:0052810) |
| 2.3 | 9.3 | GO:0097108 | hedgehog family protein binding(GO:0097108) |
| 2.3 | 9.3 | GO:0004698 | calcium-dependent protein kinase C activity(GO:0004698) |
| 2.3 | 30.2 | GO:0004723 | calcium-dependent protein serine/threonine phosphatase activity(GO:0004723) |
| 2.3 | 20.9 | GO:0008597 | calcium-dependent protein serine/threonine phosphatase regulator activity(GO:0008597) |
| 2.3 | 16.2 | GO:1903763 | gap junction channel activity involved in cell communication by electrical coupling(GO:1903763) |
| 2.3 | 9.2 | GO:0031716 | calcitonin receptor binding(GO:0031716) |
| 2.3 | 16.1 | GO:0015252 | hydrogen ion channel activity(GO:0015252) |
| 2.3 | 11.5 | GO:0016941 | natriuretic peptide receptor activity(GO:0016941) |
| 2.3 | 2.3 | GO:0004800 | thyroxine 5'-deiodinase activity(GO:0004800) |
| 2.3 | 11.4 | GO:0005152 | interleukin-1 receptor antagonist activity(GO:0005152) |
| 2.2 | 2.2 | GO:0003943 | N-acetylgalactosamine-4-sulfatase activity(GO:0003943) |
| 2.2 | 13.3 | GO:0004305 | ethanolamine kinase activity(GO:0004305) |
| 2.2 | 6.6 | GO:0031687 | A2A adenosine receptor binding(GO:0031687) |
| 2.2 | 6.6 | GO:0051766 | inositol tetrakisphosphate 1-kinase activity(GO:0047325) inositol tetrakisphosphate kinase activity(GO:0051765) inositol trisphosphate kinase activity(GO:0051766) inositol-1,3,4-trisphosphate 6-kinase activity(GO:0052725) inositol-1,3,4-trisphosphate 5-kinase activity(GO:0052726) inositol-1,3,4,5,6-pentakisphosphate 1-phosphatase activity(GO:0052825) inositol-1,3,4,6-tetrakisphosphate 6-phosphatase activity(GO:0052830) inositol-1,3,4,6-tetrakisphosphate 1-phosphatase activity(GO:0052831) inositol-3,4,6-trisphosphate 1-kinase activity(GO:0052835) |
| 2.2 | 17.6 | GO:0038064 | collagen receptor activity(GO:0038064) |
| 2.2 | 43.8 | GO:0008603 | cAMP-dependent protein kinase regulator activity(GO:0008603) |
| 2.2 | 15.3 | GO:0071558 | histone demethylase activity (H3-K27 specific)(GO:0071558) |
| 2.1 | 10.7 | GO:0001025 | RNA polymerase III transcription factor binding(GO:0001025) |
| 2.1 | 6.4 | GO:0098519 | nucleotide phosphatase activity, acting on free nucleotides(GO:0098519) |
| 2.1 | 10.6 | GO:0022858 | L-alanine transmembrane transporter activity(GO:0015180) alanine transmembrane transporter activity(GO:0022858) |
| 2.1 | 48.3 | GO:0005251 | delayed rectifier potassium channel activity(GO:0005251) |
| 2.1 | 8.4 | GO:0032795 | heterotrimeric G-protein binding(GO:0032795) |
| 2.1 | 75.1 | GO:0071837 | HMG box domain binding(GO:0071837) |
| 2.1 | 6.2 | GO:0042806 | fucose binding(GO:0042806) |
| 2.1 | 12.4 | GO:0031708 | endothelin B receptor binding(GO:0031708) |
| 2.0 | 20.5 | GO:0004707 | MAP kinase activity(GO:0004707) |
| 2.0 | 8.1 | GO:0016215 | stearoyl-CoA 9-desaturase activity(GO:0004768) acyl-CoA desaturase activity(GO:0016215) |
| 2.0 | 8.1 | GO:0004449 | isocitrate dehydrogenase (NAD+) activity(GO:0004449) |
| 2.0 | 22.1 | GO:0048407 | platelet-derived growth factor binding(GO:0048407) |
| 2.0 | 6.0 | GO:0070290 | N-acylphosphatidylethanolamine-specific phospholipase D activity(GO:0070290) |
| 2.0 | 12.0 | GO:0016929 | SUMO-specific protease activity(GO:0016929) |
| 2.0 | 8.0 | GO:0016793 | dGTPase activity(GO:0008832) triphosphoric monoester hydrolase activity(GO:0016793) guanyl deoxyribonucleotide binding(GO:0032560) dGTP binding(GO:0032567) |
| 2.0 | 40.0 | GO:0008510 | sodium:bicarbonate symporter activity(GO:0008510) |
| 2.0 | 17.9 | GO:0043533 | inositol 1,3,4,5 tetrakisphosphate binding(GO:0043533) |
| 1.9 | 9.7 | GO:0008066 | glutamate receptor activity(GO:0008066) |
| 1.9 | 7.7 | GO:0001626 | nociceptin receptor activity(GO:0001626) |
| 1.9 | 71.2 | GO:0043015 | gamma-tubulin binding(GO:0043015) |
| 1.9 | 5.8 | GO:0004144 | diacylglycerol O-acyltransferase activity(GO:0004144) |
| 1.9 | 23.0 | GO:0004075 | biotin carboxylase activity(GO:0004075) |
| 1.9 | 30.6 | GO:0004716 | receptor signaling protein tyrosine kinase activity(GO:0004716) |
| 1.9 | 9.5 | GO:0015333 | peptide:proton symporter activity(GO:0015333) proton-dependent peptide secondary active transmembrane transporter activity(GO:0022897) |
| 1.9 | 18.9 | GO:0022821 | potassium ion antiporter activity(GO:0022821) |
| 1.9 | 28.3 | GO:0005229 | intracellular calcium activated chloride channel activity(GO:0005229) |
| 1.9 | 16.8 | GO:0070679 | inositol 1,4,5 trisphosphate binding(GO:0070679) |
| 1.9 | 9.3 | GO:0004803 | transposase activity(GO:0004803) |
| 1.8 | 7.4 | GO:0047192 | 1-alkylglycerophosphocholine O-acetyltransferase activity(GO:0047192) |
| 1.8 | 40.5 | GO:0004115 | 3',5'-cyclic-AMP phosphodiesterase activity(GO:0004115) |
| 1.8 | 16.5 | GO:0060072 | large conductance calcium-activated potassium channel activity(GO:0060072) |
| 1.8 | 14.7 | GO:0017147 | Wnt-protein binding(GO:0017147) |
| 1.8 | 122.8 | GO:0070412 | R-SMAD binding(GO:0070412) |
| 1.8 | 1.8 | GO:0008900 | hydrogen:potassium-exchanging ATPase activity(GO:0008900) |
| 1.8 | 19.8 | GO:0008061 | chitinase activity(GO:0004568) chitin binding(GO:0008061) |
| 1.8 | 10.8 | GO:0004430 | 1-phosphatidylinositol 4-kinase activity(GO:0004430) |
| 1.8 | 5.3 | GO:0016833 | oxo-acid-lyase activity(GO:0016833) |
| 1.8 | 7.1 | GO:0004668 | protein-arginine deiminase activity(GO:0004668) |
| 1.8 | 12.4 | GO:0055102 | lipase inhibitor activity(GO:0055102) |
| 1.8 | 17.5 | GO:0016286 | small conductance calcium-activated potassium channel activity(GO:0016286) |
| 1.7 | 8.7 | GO:0000182 | rDNA binding(GO:0000182) |
| 1.7 | 26.2 | GO:0015250 | water channel activity(GO:0015250) |
| 1.7 | 7.0 | GO:0050119 | N-acetylglucosamine deacetylase activity(GO:0050119) |
| 1.7 | 7.0 | GO:0071987 | WD40-repeat domain binding(GO:0071987) |
| 1.7 | 7.0 | GO:1903135 | cupric ion binding(GO:1903135) |
| 1.7 | 119.8 | GO:0022843 | voltage-gated cation channel activity(GO:0022843) |
| 1.7 | 43.0 | GO:0043325 | phosphatidylinositol-3,4-bisphosphate binding(GO:0043325) |
| 1.7 | 8.5 | GO:0097016 | L27 domain binding(GO:0097016) |
| 1.7 | 16.8 | GO:0017151 | DEAD/H-box RNA helicase binding(GO:0017151) |
| 1.7 | 196.8 | GO:0005089 | Rho guanyl-nucleotide exchange factor activity(GO:0005089) |
| 1.7 | 8.4 | GO:0030553 | cGMP binding(GO:0030553) |
| 1.7 | 41.7 | GO:0051010 | microtubule plus-end binding(GO:0051010) |
| 1.6 | 6.6 | GO:0015056 | corticotrophin-releasing factor receptor activity(GO:0015056) |
| 1.6 | 6.5 | GO:0016176 | superoxide-generating NADPH oxidase activator activity(GO:0016176) |
| 1.6 | 16.3 | GO:0008131 | primary amine oxidase activity(GO:0008131) |
| 1.6 | 4.9 | GO:0008422 | beta-glucosidase activity(GO:0008422) |
| 1.6 | 4.9 | GO:0017153 | sodium:dicarboxylate symporter activity(GO:0017153) |
| 1.6 | 4.8 | GO:0004874 | aryl hydrocarbon receptor activity(GO:0004874) |
| 1.6 | 19.3 | GO:0097027 | ubiquitin-protein transferase activator activity(GO:0097027) |
| 1.6 | 30.4 | GO:0031489 | myosin V binding(GO:0031489) |
| 1.6 | 19.2 | GO:0004065 | arylsulfatase activity(GO:0004065) |
| 1.6 | 101.8 | GO:0001540 | beta-amyloid binding(GO:0001540) |
| 1.6 | 11.1 | GO:0005499 | vitamin D binding(GO:0005499) |
| 1.6 | 7.9 | GO:0004370 | glycerol kinase activity(GO:0004370) |
| 1.6 | 6.3 | GO:0004461 | lactose synthase activity(GO:0004461) |
| 1.6 | 6.3 | GO:0044736 | acid-sensing ion channel activity(GO:0044736) |
| 1.6 | 9.4 | GO:0005220 | inositol 1,4,5-trisphosphate-sensitive calcium-release channel activity(GO:0005220) |
| 1.5 | 4.6 | GO:0035241 | protein-arginine omega-N monomethyltransferase activity(GO:0035241) |
| 1.5 | 46.2 | GO:0005086 | ARF guanyl-nucleotide exchange factor activity(GO:0005086) |
| 1.5 | 40.0 | GO:0008239 | dipeptidyl-peptidase activity(GO:0008239) |
| 1.5 | 21.4 | GO:0050811 | GABA receptor binding(GO:0050811) |
| 1.5 | 4.6 | GO:1904047 | mRNA (2'-O-methyladenosine-N6-)-methyltransferase activity(GO:0016422) S-adenosyl-L-methionine binding(GO:1904047) |
| 1.5 | 6.1 | GO:0004983 | neuropeptide Y receptor activity(GO:0004983) |
| 1.5 | 25.2 | GO:1990380 | Lys48-specific deubiquitinase activity(GO:1990380) |
| 1.5 | 13.3 | GO:0004565 | beta-galactosidase activity(GO:0004565) |
| 1.5 | 5.8 | GO:0046404 | ATP-dependent polydeoxyribonucleotide 5'-hydroxyl-kinase activity(GO:0046404) polydeoxyribonucleotide kinase activity(GO:0051733) ATP-dependent polynucleotide kinase activity(GO:0051734) |
| 1.5 | 4.4 | GO:0019959 | interleukin-8 binding(GO:0019959) |
| 1.4 | 20.2 | GO:0055056 | D-glucose transmembrane transporter activity(GO:0055056) |
| 1.4 | 15.9 | GO:0017162 | aryl hydrocarbon receptor binding(GO:0017162) |
| 1.4 | 4.3 | GO:0005026 | transforming growth factor beta receptor activity, type II(GO:0005026) |
| 1.4 | 25.5 | GO:0048306 | calcium-dependent protein binding(GO:0048306) |
| 1.4 | 15.6 | GO:0042043 | neurexin family protein binding(GO:0042043) |
| 1.4 | 38.2 | GO:0004708 | MAP kinase kinase activity(GO:0004708) |
| 1.4 | 34.8 | GO:0043014 | alpha-tubulin binding(GO:0043014) |
| 1.4 | 16.7 | GO:0099604 | calcium-release channel activity(GO:0015278) ligand-gated calcium channel activity(GO:0099604) |
| 1.4 | 31.9 | GO:0008574 | ATP-dependent microtubule motor activity, plus-end-directed(GO:0008574) |
| 1.4 | 4.2 | GO:0035473 | lipase binding(GO:0035473) |
| 1.4 | 16.3 | GO:0005007 | fibroblast growth factor-activated receptor activity(GO:0005007) |
| 1.4 | 6.8 | GO:0070915 | lysophosphatidic acid receptor activity(GO:0070915) |
| 1.4 | 8.1 | GO:0045029 | UDP-activated nucleotide receptor activity(GO:0045029) |
| 1.3 | 10.8 | GO:0030169 | low-density lipoprotein particle binding(GO:0030169) |
| 1.3 | 16.2 | GO:0035035 | histone acetyltransferase binding(GO:0035035) |
| 1.3 | 5.4 | GO:0042289 | MHC class II protein binding(GO:0042289) |
| 1.3 | 4.0 | GO:0008480 | sarcosine dehydrogenase activity(GO:0008480) oxidoreductase activity, acting on the CH-NH group of donors, flavin as acceptor(GO:0046997) |
| 1.3 | 4.0 | GO:0016534 | cyclin-dependent protein kinase 5 activator activity(GO:0016534) |
| 1.3 | 17.3 | GO:0052742 | 1-phosphatidylinositol-3-kinase activity(GO:0016303) phosphatidylinositol kinase activity(GO:0052742) |
| 1.3 | 10.6 | GO:0004935 | adrenergic receptor activity(GO:0004935) |
| 1.3 | 4.0 | GO:0004584 | dolichyl-phosphate-mannose-glycolipid alpha-mannosyltransferase activity(GO:0004584) |
| 1.3 | 5.3 | GO:0008467 | [heparan sulfate]-glucosamine 3-sulfotransferase 1 activity(GO:0008467) |
| 1.3 | 5.2 | GO:0008568 | microtubule-severing ATPase activity(GO:0008568) |
| 1.3 | 5.2 | GO:0004852 | uroporphyrinogen-III synthase activity(GO:0004852) |
| 1.3 | 1.3 | GO:1990239 | steroid hormone binding(GO:1990239) |
| 1.3 | 5.2 | GO:0061676 | importin-alpha family protein binding(GO:0061676) |
| 1.3 | 32.4 | GO:0004012 | phospholipid-translocating ATPase activity(GO:0004012) |
| 1.3 | 6.5 | GO:0008889 | glycerophosphodiester phosphodiesterase activity(GO:0008889) |
| 1.3 | 36.2 | GO:0005540 | hyaluronic acid binding(GO:0005540) |
| 1.3 | 19.2 | GO:0005344 | oxygen transporter activity(GO:0005344) |
| 1.3 | 17.9 | GO:1990459 | transferrin receptor binding(GO:1990459) |
| 1.3 | 7.6 | GO:0004614 | phosphoglucomutase activity(GO:0004614) |
| 1.3 | 22.7 | GO:0005326 | neurotransmitter transporter activity(GO:0005326) |
| 1.3 | 7.5 | GO:0016402 | pristanoyl-CoA oxidase activity(GO:0016402) |
| 1.2 | 11.2 | GO:0070840 | dynein complex binding(GO:0070840) |
| 1.2 | 3.7 | GO:0016812 | hydrolase activity, acting on carbon-nitrogen (but not peptide) bonds, in cyclic amides(GO:0016812) |
| 1.2 | 40.9 | GO:0004709 | MAP kinase kinase kinase activity(GO:0004709) |
| 1.2 | 12.3 | GO:0004691 | cyclic nucleotide-dependent protein kinase activity(GO:0004690) cAMP-dependent protein kinase activity(GO:0004691) |
| 1.2 | 19.7 | GO:0004861 | cyclin-dependent protein serine/threonine kinase inhibitor activity(GO:0004861) |
| 1.2 | 7.3 | GO:0044547 | DNA topoisomerase binding(GO:0044547) |
| 1.2 | 14.4 | GO:0019869 | chloride channel inhibitor activity(GO:0019869) |
| 1.2 | 1.2 | GO:0042813 | Wnt-activated receptor activity(GO:0042813) |
| 1.2 | 7.2 | GO:0097643 | amylin receptor activity(GO:0097643) |
| 1.2 | 6.0 | GO:0046899 | nucleoside triphosphate adenylate kinase activity(GO:0046899) |
| 1.2 | 9.5 | GO:0004634 | phosphopyruvate hydratase activity(GO:0004634) |
| 1.2 | 5.9 | GO:1903136 | cuprous ion binding(GO:1903136) |
| 1.2 | 17.6 | GO:0070300 | phosphatidic acid binding(GO:0070300) |
| 1.2 | 8.2 | GO:0003910 | DNA ligase (ATP) activity(GO:0003910) |
| 1.1 | 3.4 | GO:0050698 | proteoglycan sulfotransferase activity(GO:0050698) |
| 1.1 | 10.2 | GO:0008526 | phosphatidylinositol transporter activity(GO:0008526) |
| 1.1 | 8.0 | GO:0003810 | protein-glutamine gamma-glutamyltransferase activity(GO:0003810) |
| 1.1 | 3.4 | GO:0001225 | RNA polymerase II transcription coactivator binding(GO:0001225) |
| 1.1 | 3.4 | GO:0080019 | fatty-acyl-CoA reductase (alcohol-forming) activity(GO:0080019) |
| 1.1 | 4.5 | GO:0016495 | C-X3-C chemokine receptor activity(GO:0016495) |
| 1.1 | 9.0 | GO:0043995 | histone acetyltransferase activity (H4-K5 specific)(GO:0043995) histone acetyltransferase activity (H4-K8 specific)(GO:0043996) histone acetyltransferase activity (H4-K16 specific)(GO:0046972) |
| 1.1 | 12.3 | GO:0003836 | beta-galactoside (CMP) alpha-2,3-sialyltransferase activity(GO:0003836) |
| 1.1 | 3.4 | GO:0004750 | ribulose-phosphate 3-epimerase activity(GO:0004750) |
| 1.1 | 38.8 | GO:0005109 | frizzled binding(GO:0005109) |
| 1.1 | 4.4 | GO:0004142 | diacylglycerol cholinephosphotransferase activity(GO:0004142) |
| 1.1 | 2.2 | GO:0004365 | glyceraldehyde-3-phosphate dehydrogenase (NAD+) (phosphorylating) activity(GO:0004365) glyceraldehyde-3-phosphate dehydrogenase (NAD(P)+) (phosphorylating) activity(GO:0043891) |
| 1.1 | 3.2 | GO:0008502 | melatonin receptor activity(GO:0008502) |
| 1.1 | 1.1 | GO:0019841 | retinol binding(GO:0019841) |
| 1.1 | 26.8 | GO:0102391 | decanoate--CoA ligase activity(GO:0102391) |
| 1.1 | 4.2 | GO:0042731 | PH domain binding(GO:0042731) |
| 1.1 | 43.5 | GO:0004683 | calmodulin-dependent protein kinase activity(GO:0004683) |
| 1.1 | 2.1 | GO:0004660 | protein farnesyltransferase activity(GO:0004660) |
| 1.1 | 3.2 | GO:0047223 | beta-1,3-galactosyl-O-glycosyl-glycoprotein beta-1,3-N-acetylglucosaminyltransferase activity(GO:0047223) |
| 1.0 | 3.1 | GO:0004468 | lysine N-acetyltransferase activity, acting on acetyl phosphate as donor(GO:0004468) |
| 1.0 | 7.3 | GO:0051525 | NFAT protein binding(GO:0051525) |
| 1.0 | 4.2 | GO:0003875 | ADP-ribosylarginine hydrolase activity(GO:0003875) |
| 1.0 | 6.2 | GO:0030172 | troponin C binding(GO:0030172) |
| 1.0 | 4.1 | GO:0042799 | histone methyltransferase activity (H4-K20 specific)(GO:0042799) |
| 1.0 | 5.1 | GO:0004991 | parathyroid hormone receptor activity(GO:0004991) |
| 1.0 | 8.1 | GO:0017081 | chloride channel regulator activity(GO:0017081) |
| 1.0 | 1.0 | GO:0004887 | thyroid hormone receptor activity(GO:0004887) |
| 1.0 | 4.0 | GO:0047708 | biotinidase activity(GO:0047708) |
| 1.0 | 7.9 | GO:0005000 | vasopressin receptor activity(GO:0005000) |
| 1.0 | 3.9 | GO:0008184 | glycogen phosphorylase activity(GO:0008184) |
| 1.0 | 4.8 | GO:0004974 | leukotriene receptor activity(GO:0004974) |
| 1.0 | 38.3 | GO:0004712 | protein serine/threonine/tyrosine kinase activity(GO:0004712) |
| 1.0 | 4.8 | GO:0043546 | molybdopterin cofactor binding(GO:0043546) |
| 1.0 | 2.9 | GO:0004687 | myosin light chain kinase activity(GO:0004687) |
| 1.0 | 2.9 | GO:0005502 | 11-cis retinal binding(GO:0005502) |
| 0.9 | 6.6 | GO:0004137 | deoxycytidine kinase activity(GO:0004137) |
| 0.9 | 2.8 | GO:0080130 | L-phenylalanine:2-oxoglutarate aminotransferase activity(GO:0080130) |
| 0.9 | 16.0 | GO:0015095 | magnesium ion transmembrane transporter activity(GO:0015095) |
| 0.9 | 2.8 | GO:0070996 | type 1 melanocortin receptor binding(GO:0070996) |
| 0.9 | 5.6 | GO:0004882 | androgen receptor activity(GO:0004882) |
| 0.9 | 2.8 | GO:0061649 | ubiquitinated histone binding(GO:0061649) |
| 0.9 | 5.5 | GO:0016416 | O-palmitoyltransferase activity(GO:0016416) |
| 0.9 | 18.3 | GO:0005522 | profilin binding(GO:0005522) |
| 0.9 | 7.3 | GO:0015232 | heme transporter activity(GO:0015232) |
| 0.9 | 20.9 | GO:0005246 | calcium channel regulator activity(GO:0005246) |
| 0.9 | 6.4 | GO:0002114 | interleukin-33 receptor activity(GO:0002114) |
| 0.9 | 10.9 | GO:0051378 | amine binding(GO:0043176) serotonin binding(GO:0051378) |
| 0.9 | 18.1 | GO:0031210 | phosphatidylcholine binding(GO:0031210) |
| 0.9 | 2.7 | GO:0008336 | gamma-butyrobetaine dioxygenase activity(GO:0008336) |
| 0.9 | 2.7 | GO:0004963 | follicle-stimulating hormone receptor activity(GO:0004963) |
| 0.9 | 5.3 | GO:0017040 | ceramidase activity(GO:0017040) |
| 0.9 | 6.1 | GO:0008172 | S-methyltransferase activity(GO:0008172) |
| 0.9 | 4.3 | GO:0036312 | phosphatidylinositol 3-kinase regulatory subunit binding(GO:0036312) |
| 0.9 | 0.9 | GO:0030109 | HLA-B specific inhibitory MHC class I receptor activity(GO:0030109) |
| 0.9 | 1.7 | GO:0050692 | DBD domain binding(GO:0050692) |
| 0.9 | 5.1 | GO:0018685 | alkane 1-monooxygenase activity(GO:0018685) |
| 0.9 | 6.8 | GO:0004198 | calcium-dependent cysteine-type endopeptidase activity(GO:0004198) |
| 0.8 | 1.7 | GO:0050473 | arachidonate 15-lipoxygenase activity(GO:0050473) |
| 0.8 | 0.8 | GO:0010851 | cyclase regulator activity(GO:0010851) |
| 0.8 | 5.0 | GO:0071074 | eukaryotic initiation factor eIF2 binding(GO:0071074) |
| 0.8 | 23.2 | GO:0005104 | fibroblast growth factor receptor binding(GO:0005104) |
| 0.8 | 5.0 | GO:0047696 | beta-adrenergic receptor kinase activity(GO:0047696) |
| 0.8 | 1.7 | GO:0031731 | CCR6 chemokine receptor binding(GO:0031731) |
| 0.8 | 3.3 | GO:0060002 | plus-end directed microfilament motor activity(GO:0060002) |
| 0.8 | 9.8 | GO:0046870 | cadmium ion binding(GO:0046870) |
| 0.8 | 9.0 | GO:0005159 | insulin-like growth factor receptor binding(GO:0005159) |
| 0.8 | 2.4 | GO:0070573 | metallodipeptidase activity(GO:0070573) |
| 0.8 | 3.2 | GO:0004925 | prolactin receptor activity(GO:0004925) |
| 0.8 | 2.4 | GO:0050567 | glutaminyl-tRNA synthase (glutamine-hydrolyzing) activity(GO:0050567) |
| 0.8 | 7.2 | GO:0001223 | transcription coactivator binding(GO:0001223) |
| 0.8 | 16.7 | GO:0070008 | serine-type exopeptidase activity(GO:0070008) |
| 0.8 | 6.3 | GO:0046974 | histone methyltransferase activity (H3-K9 specific)(GO:0046974) |
| 0.8 | 6.3 | GO:0005243 | gap junction channel activity(GO:0005243) |
| 0.8 | 2.4 | GO:0004961 | thromboxane receptor activity(GO:0004960) thromboxane A2 receptor activity(GO:0004961) |
| 0.8 | 1.6 | GO:0004995 | tachykinin receptor activity(GO:0004995) |
| 0.8 | 31.1 | GO:0019894 | kinesin binding(GO:0019894) |
| 0.8 | 1.5 | GO:0004962 | endothelin receptor activity(GO:0004962) |
| 0.8 | 5.3 | GO:0030552 | cAMP binding(GO:0030552) |
| 0.8 | 6.9 | GO:0043395 | heparan sulfate proteoglycan binding(GO:0043395) |
| 0.8 | 9.9 | GO:0045159 | myosin II binding(GO:0045159) |
| 0.7 | 11.1 | GO:0042809 | vitamin D receptor binding(GO:0042809) |
| 0.7 | 1.5 | GO:0019912 | cyclin-dependent protein kinase activating kinase activity(GO:0019912) |
| 0.7 | 11.8 | GO:0017110 | nucleoside-diphosphatase activity(GO:0017110) |
| 0.7 | 2.2 | GO:1990430 | extracellular matrix protein binding(GO:1990430) |
| 0.7 | 6.6 | GO:0042975 | peroxisome proliferator activated receptor binding(GO:0042975) |
| 0.7 | 0.7 | GO:0000822 | inositol hexakisphosphate binding(GO:0000822) |
| 0.7 | 5.1 | GO:0004645 | phosphorylase activity(GO:0004645) |
| 0.7 | 2.2 | GO:0031711 | angiotensin type I receptor activity(GO:0001596) bradykinin receptor binding(GO:0031711) |
| 0.7 | 8.0 | GO:0036310 | annealing helicase activity(GO:0036310) |
| 0.7 | 5.1 | GO:0030020 | extracellular matrix structural constituent conferring tensile strength(GO:0030020) |
| 0.7 | 2.1 | GO:0060001 | minus-end directed microfilament motor activity(GO:0060001) |
| 0.7 | 3.5 | GO:0043394 | proteoglycan binding(GO:0043394) |
| 0.7 | 2.1 | GO:0005477 | pyruvate secondary active transmembrane transporter activity(GO:0005477) |
| 0.7 | 8.3 | GO:0097371 | MDM2/MDM4 family protein binding(GO:0097371) |
| 0.7 | 10.3 | GO:0045294 | alpha-catenin binding(GO:0045294) |
| 0.7 | 2.7 | GO:0070740 | tubulin-glutamic acid ligase activity(GO:0070740) |
| 0.7 | 2.1 | GO:0042610 | CD8 receptor binding(GO:0042610) |
| 0.7 | 2.0 | GO:0004060 | arylamine N-acetyltransferase activity(GO:0004060) |
| 0.7 | 2.0 | GO:0015616 | DNA translocase activity(GO:0015616) |
| 0.7 | 66.9 | GO:0003707 | steroid hormone receptor activity(GO:0003707) |
| 0.7 | 4.0 | GO:0004489 | methylenetetrahydrofolate reductase (NAD(P)H) activity(GO:0004489) |
| 0.7 | 0.7 | GO:0047787 | delta4-3-oxosteroid 5beta-reductase activity(GO:0047787) |
| 0.7 | 3.3 | GO:0098821 | BMP receptor activity(GO:0098821) |
| 0.7 | 10.6 | GO:0004190 | aspartic-type endopeptidase activity(GO:0004190) aspartic-type peptidase activity(GO:0070001) |
| 0.7 | 6.6 | GO:0035005 | 1-phosphatidylinositol-4-phosphate 3-kinase activity(GO:0035005) |
| 0.7 | 2.0 | GO:0015204 | urea transmembrane transporter activity(GO:0015204) |
| 0.7 | 1.3 | GO:0052871 | tocopherol omega-hydroxylase activity(GO:0052870) alpha-tocopherol omega-hydroxylase activity(GO:0052871) 20-hydroxy-leukotriene B4 omega oxidase activity(GO:0097258) 20-aldehyde-leukotriene B4 20-monooxygenase activity(GO:0097259) |
| 0.7 | 24.8 | GO:0005158 | insulin receptor binding(GO:0005158) |
| 0.7 | 3.3 | GO:0047238 | glucuronosyl-N-acetylgalactosaminyl-proteoglycan 4-beta-N-acetylgalactosaminyltransferase activity(GO:0047238) |
| 0.7 | 9.1 | GO:0019992 | diacylglycerol binding(GO:0019992) |
| 0.7 | 3.9 | GO:0008310 | single-stranded DNA 3'-5' exodeoxyribonuclease activity(GO:0008310) |
| 0.7 | 32.5 | GO:0042169 | SH2 domain binding(GO:0042169) |
| 0.6 | 1.9 | GO:0005350 | pyrimidine nucleobase transmembrane transporter activity(GO:0005350) pyrimidine- and adenine-specific:sodium symporter activity(GO:0015389) |
| 0.6 | 8.3 | GO:0043522 | leucine zipper domain binding(GO:0043522) |
| 0.6 | 6.4 | GO:0047498 | calcium-dependent phospholipase A2 activity(GO:0047498) |
| 0.6 | 1.9 | GO:0004878 | complement component C5a receptor activity(GO:0004878) |
| 0.6 | 1.9 | GO:0070039 | rRNA (guanosine-2'-O-)-methyltransferase activity(GO:0070039) |
| 0.6 | 4.4 | GO:0016641 | oxidoreductase activity, acting on the CH-NH2 group of donors, oxygen as acceptor(GO:0016641) |
| 0.6 | 3.1 | GO:0030060 | L-malate dehydrogenase activity(GO:0030060) |
| 0.6 | 11.2 | GO:0004062 | aryl sulfotransferase activity(GO:0004062) |
| 0.6 | 5.6 | GO:0045503 | dynein light chain binding(GO:0045503) |
| 0.6 | 7.5 | GO:0008020 | G-protein coupled photoreceptor activity(GO:0008020) |
| 0.6 | 6.1 | GO:0003774 | motor activity(GO:0003774) |
| 0.6 | 3.6 | GO:0004013 | adenosylhomocysteinase activity(GO:0004013) trialkylsulfonium hydrolase activity(GO:0016802) |
| 0.6 | 4.2 | GO:0070891 | lipoteichoic acid binding(GO:0070891) |
| 0.6 | 8.4 | GO:0031702 | type 1 angiotensin receptor binding(GO:0031702) |
| 0.6 | 2.4 | GO:0043237 | laminin-1 binding(GO:0043237) |
| 0.6 | 1.8 | GO:0034713 | type I transforming growth factor beta receptor binding(GO:0034713) |
| 0.6 | 2.9 | GO:0046538 | bisphosphoglycerate mutase activity(GO:0004082) phosphoglycerate mutase activity(GO:0004619) 2,3-bisphosphoglycerate-dependent phosphoglycerate mutase activity(GO:0046538) |
| 0.6 | 21.0 | GO:0003777 | microtubule motor activity(GO:0003777) |
| 0.6 | 6.4 | GO:0003964 | telomerase activity(GO:0003720) RNA-directed DNA polymerase activity(GO:0003964) |
| 0.6 | 1.7 | GO:0070643 | vitamin D3 25-hydroxylase activity(GO:0030343) vitamin D 25-hydroxylase activity(GO:0070643) |
| 0.6 | 7.4 | GO:0045125 | sphingosine-1-phosphate receptor activity(GO:0038036) bioactive lipid receptor activity(GO:0045125) |
| 0.6 | 1.7 | GO:0004421 | hydroxymethylglutaryl-CoA synthase activity(GO:0004421) |
| 0.6 | 5.1 | GO:0004767 | sphingomyelin phosphodiesterase activity(GO:0004767) |
| 0.6 | 7.8 | GO:0017136 | NAD-dependent histone deacetylase activity(GO:0017136) |
| 0.5 | 7.1 | GO:0070700 | BMP receptor binding(GO:0070700) |
| 0.5 | 1.6 | GO:0008294 | calcium- and calmodulin-responsive adenylate cyclase activity(GO:0008294) |
| 0.5 | 1.1 | GO:0016868 | intramolecular transferase activity, phosphotransferases(GO:0016868) |
| 0.5 | 16.6 | GO:0008395 | steroid hydroxylase activity(GO:0008395) |
| 0.5 | 2.1 | GO:0034041 | sterol-transporting ATPase activity(GO:0034041) |
| 0.5 | 8.5 | GO:0004143 | diacylglycerol kinase activity(GO:0004143) |
| 0.5 | 1.6 | GO:0010698 | acetyltransferase activator activity(GO:0010698) |
| 0.5 | 1.6 | GO:0033906 | hyaluronoglucuronidase activity(GO:0033906) |
| 0.5 | 19.2 | GO:0005044 | scavenger receptor activity(GO:0005044) |
| 0.5 | 1.6 | GO:0050501 | hyaluronan synthase activity(GO:0050501) |
| 0.5 | 17.5 | GO:0005184 | neuropeptide hormone activity(GO:0005184) |
| 0.5 | 3.6 | GO:0009008 | DNA-methyltransferase activity(GO:0009008) |
| 0.5 | 9.2 | GO:0046875 | ephrin receptor binding(GO:0046875) |
| 0.5 | 69.9 | GO:0005516 | calmodulin binding(GO:0005516) |
| 0.5 | 1.5 | GO:0070735 | protein-glycine ligase activity(GO:0070735) |
| 0.5 | 5.5 | GO:0004993 | G-protein coupled serotonin receptor activity(GO:0004993) |
| 0.5 | 8.0 | GO:0017075 | syntaxin-1 binding(GO:0017075) |
| 0.5 | 0.5 | GO:0042165 | neurotransmitter binding(GO:0042165) |
| 0.5 | 7.3 | GO:0015101 | organic cation transmembrane transporter activity(GO:0015101) |
| 0.5 | 2.9 | GO:0016015 | morphogen activity(GO:0016015) |
| 0.5 | 1.5 | GO:0008384 | IkappaB kinase activity(GO:0008384) |
| 0.5 | 6.7 | GO:0008253 | 5'-nucleotidase activity(GO:0008253) |
| 0.5 | 1.4 | GO:0004117 | calmodulin-dependent cyclic-nucleotide phosphodiesterase activity(GO:0004117) |
| 0.5 | 4.2 | GO:0016918 | retinal binding(GO:0016918) |
| 0.5 | 19.7 | GO:0004385 | guanylate kinase activity(GO:0004385) |
| 0.5 | 0.9 | GO:0015172 | L-glutamate transmembrane transporter activity(GO:0005313) acidic amino acid transmembrane transporter activity(GO:0015172) |
| 0.5 | 1.4 | GO:0031862 | prostanoid receptor binding(GO:0031862) |
| 0.5 | 180.4 | GO:0004930 | G-protein coupled receptor activity(GO:0004930) |
| 0.5 | 10.7 | GO:0001972 | retinoic acid binding(GO:0001972) |
| 0.5 | 121.9 | GO:0004252 | serine-type endopeptidase activity(GO:0004252) |
| 0.5 | 2.3 | GO:0008160 | protein tyrosine phosphatase activator activity(GO:0008160) |
| 0.5 | 2.3 | GO:0005314 | high-affinity glutamate transmembrane transporter activity(GO:0005314) |
| 0.5 | 4.6 | GO:0035612 | AP-2 adaptor complex binding(GO:0035612) |
| 0.5 | 3.2 | GO:0034235 | GPI anchor binding(GO:0034235) |
| 0.5 | 2.3 | GO:0008046 | axon guidance receptor activity(GO:0008046) |
| 0.5 | 7.2 | GO:0015269 | calcium-activated potassium channel activity(GO:0015269) |
| 0.4 | 4.0 | GO:0001162 | RNA polymerase II intronic transcription regulatory region sequence-specific DNA binding(GO:0001162) |
| 0.4 | 7.9 | GO:0008519 | ammonium transmembrane transporter activity(GO:0008519) |
| 0.4 | 3.1 | GO:0008417 | fucosyltransferase activity(GO:0008417) |
| 0.4 | 1.3 | GO:0070984 | SET domain binding(GO:0070984) |
| 0.4 | 1.7 | GO:0042608 | T cell receptor binding(GO:0042608) |
| 0.4 | 1.7 | GO:0004862 | cAMP-dependent protein kinase inhibitor activity(GO:0004862) |
| 0.4 | 5.0 | GO:0003996 | acyl-CoA ligase activity(GO:0003996) |
| 0.4 | 1.2 | GO:0008466 | glycogenin glucosyltransferase activity(GO:0008466) |
| 0.4 | 37.6 | GO:0004222 | metalloendopeptidase activity(GO:0004222) |
| 0.4 | 6.5 | GO:0001102 | RNA polymerase II activating transcription factor binding(GO:0001102) |
| 0.4 | 1.2 | GO:0060422 | peptidyl-dipeptidase inhibitor activity(GO:0060422) |
| 0.4 | 3.2 | GO:0071855 | neuropeptide receptor binding(GO:0071855) |
| 0.4 | 1.6 | GO:0008035 | high-density lipoprotein particle binding(GO:0008035) |
| 0.4 | 2.0 | GO:0005237 | inhibitory extracellular ligand-gated ion channel activity(GO:0005237) |
| 0.4 | 16.0 | GO:0008009 | chemokine activity(GO:0008009) |
| 0.4 | 7.8 | GO:0050780 | dopamine receptor binding(GO:0050780) |
| 0.4 | 1.5 | GO:0061714 | folic acid receptor activity(GO:0061714) |
| 0.4 | 3.8 | GO:0070181 | small ribosomal subunit rRNA binding(GO:0070181) |
| 0.4 | 2.6 | GO:0005324 | long-chain fatty acid transporter activity(GO:0005324) |
| 0.4 | 1.9 | GO:0004024 | alcohol dehydrogenase activity, zinc-dependent(GO:0004024) |
| 0.4 | 10.0 | GO:0070034 | telomerase RNA binding(GO:0070034) |
| 0.4 | 5.2 | GO:0016805 | dipeptidase activity(GO:0016805) |
| 0.4 | 4.4 | GO:0005452 | inorganic anion exchanger activity(GO:0005452) |
| 0.4 | 1.5 | GO:0035276 | ethanol binding(GO:0035276) |
| 0.4 | 15.3 | GO:0005544 | calcium-dependent phospholipid binding(GO:0005544) |
| 0.4 | 1.1 | GO:0004663 | Rab geranylgeranyltransferase activity(GO:0004663) |
| 0.4 | 5.4 | GO:0035497 | cAMP response element binding(GO:0035497) |
| 0.4 | 5.3 | GO:0003688 | DNA replication origin binding(GO:0003688) |
| 0.3 | 3.1 | GO:0032453 | histone demethylase activity (H3-K4 specific)(GO:0032453) |
| 0.3 | 1.3 | GO:0030492 | hemoglobin binding(GO:0030492) |
| 0.3 | 2.7 | GO:0015349 | thyroid hormone transmembrane transporter activity(GO:0015349) |
| 0.3 | 8.6 | GO:0022848 | acetylcholine-gated cation channel activity(GO:0022848) |
| 0.3 | 3.3 | GO:0051184 | cofactor transporter activity(GO:0051184) |
| 0.3 | 1.6 | GO:0003835 | beta-galactoside alpha-2,6-sialyltransferase activity(GO:0003835) |
| 0.3 | 2.6 | GO:0030345 | extracellular matrix structural constituent conferring compression resistance(GO:0030021) structural constituent of tooth enamel(GO:0030345) |
| 0.3 | 2.2 | GO:0004169 | dolichyl-phosphate-mannose-protein mannosyltransferase activity(GO:0004169) |
| 0.3 | 1.0 | GO:0042954 | lipoprotein transporter activity(GO:0042954) |
| 0.3 | 4.5 | GO:0003906 | DNA-(apurinic or apyrimidinic site) lyase activity(GO:0003906) |
| 0.3 | 0.6 | GO:0016638 | oxidoreductase activity, acting on the CH-NH2 group of donors(GO:0016638) |
| 0.3 | 1.3 | GO:0042015 | interleukin-20 binding(GO:0042015) |
| 0.3 | 5.9 | GO:0035925 | mRNA 3'-UTR AU-rich region binding(GO:0035925) |
| 0.3 | 0.9 | GO:0034056 | estrogen response element binding(GO:0034056) |
| 0.3 | 7.0 | GO:0004812 | aminoacyl-tRNA ligase activity(GO:0004812) ligase activity, forming carbon-oxygen bonds(GO:0016875) ligase activity, forming aminoacyl-tRNA and related compounds(GO:0016876) |
| 0.3 | 1.8 | GO:0004035 | alkaline phosphatase activity(GO:0004035) |
| 0.3 | 1.2 | GO:0034353 | RNA pyrophosphohydrolase activity(GO:0034353) |
| 0.3 | 6.4 | GO:0070888 | E-box binding(GO:0070888) |
| 0.3 | 27.2 | GO:0004867 | serine-type endopeptidase inhibitor activity(GO:0004867) |
| 0.3 | 0.3 | GO:0005166 | neurotrophin p75 receptor binding(GO:0005166) |
| 0.3 | 0.6 | GO:0005168 | neurotrophin TRKA receptor binding(GO:0005168) |
| 0.3 | 0.8 | GO:0003845 | 11-beta-hydroxysteroid dehydrogenase [NAD(P)] activity(GO:0003845) |
| 0.3 | 1.4 | GO:0043199 | sulfate binding(GO:0043199) |
| 0.3 | 3.7 | GO:0043024 | ribosomal small subunit binding(GO:0043024) |
| 0.3 | 8.6 | GO:0005262 | calcium channel activity(GO:0005262) |
| 0.3 | 16.8 | GO:0008186 | RNA helicase activity(GO:0003724) ATP-dependent RNA helicase activity(GO:0004004) RNA-dependent ATPase activity(GO:0008186) |
| 0.3 | 1.5 | GO:0033130 | acetylcholine receptor binding(GO:0033130) |
| 0.2 | 0.5 | GO:0051880 | G-quadruplex DNA binding(GO:0051880) |
| 0.2 | 3.4 | GO:0047372 | acylglycerol lipase activity(GO:0047372) |
| 0.2 | 1.2 | GO:0050693 | LBD domain binding(GO:0050693) |
| 0.2 | 1.4 | GO:0061665 | SUMO ligase activity(GO:0061665) |
| 0.2 | 0.8 | GO:0004505 | phenylalanine 4-monooxygenase activity(GO:0004505) |
| 0.2 | 41.7 | GO:0015631 | tubulin binding(GO:0015631) |
| 0.2 | 0.6 | GO:0030272 | 5-formyltetrahydrofolate cyclo-ligase activity(GO:0030272) |
| 0.2 | 1.3 | GO:0051787 | misfolded protein binding(GO:0051787) |
| 0.2 | 12.4 | GO:0004860 | protein kinase inhibitor activity(GO:0004860) |
| 0.2 | 0.8 | GO:0004909 | interleukin-1, Type I, activating receptor activity(GO:0004909) |
| 0.2 | 1.4 | GO:0047045 | testosterone 17-beta-dehydrogenase (NADP+) activity(GO:0047045) |
| 0.2 | 25.9 | GO:0017137 | Rab GTPase binding(GO:0017137) |
| 0.2 | 0.6 | GO:0008267 | poly-glutamine tract binding(GO:0008267) |
| 0.2 | 2.5 | GO:0005003 | ephrin receptor activity(GO:0005003) |
| 0.2 | 2.1 | GO:0004332 | fructose-bisphosphate aldolase activity(GO:0004332) |
| 0.2 | 6.0 | GO:0005160 | transforming growth factor beta receptor binding(GO:0005160) |
| 0.2 | 0.8 | GO:0051373 | FATZ binding(GO:0051373) |
| 0.2 | 2.8 | GO:0005247 | voltage-gated chloride channel activity(GO:0005247) |
| 0.2 | 1.9 | GO:0031683 | G-protein beta/gamma-subunit complex binding(GO:0031683) |
| 0.2 | 0.3 | GO:0070052 | collagen V binding(GO:0070052) |
| 0.2 | 1.0 | GO:0004897 | ciliary neurotrophic factor receptor activity(GO:0004897) |
| 0.2 | 3.3 | GO:0004806 | triglyceride lipase activity(GO:0004806) |
| 0.2 | 2.7 | GO:0004181 | metallocarboxypeptidase activity(GO:0004181) |
| 0.2 | 1.1 | GO:0019210 | kinase inhibitor activity(GO:0019210) |
| 0.2 | 0.6 | GO:0031432 | titin binding(GO:0031432) |
| 0.2 | 0.3 | GO:0032427 | GBD domain binding(GO:0032427) |
| 0.1 | 0.6 | GO:0030976 | thiamine pyrophosphate binding(GO:0030976) |
| 0.1 | 0.7 | GO:0047066 | phospholipid-hydroperoxide glutathione peroxidase activity(GO:0047066) |
| 0.1 | 0.3 | GO:0070653 | high-density lipoprotein particle receptor binding(GO:0070653) |
| 0.1 | 0.4 | GO:0005042 | netrin receptor activity(GO:0005042) |
| 0.1 | 0.5 | GO:0003956 | NAD(P)+-protein-arginine ADP-ribosyltransferase activity(GO:0003956) |
| 0.1 | 0.4 | GO:0015181 | arginine transmembrane transporter activity(GO:0015181) |
| 0.1 | 0.3 | GO:0042008 | interleukin-18 receptor activity(GO:0042008) |
| 0.1 | 1.6 | GO:0036374 | glutathione hydrolase activity(GO:0036374) |
| 0.1 | 0.6 | GO:0016453 | C-acetyltransferase activity(GO:0016453) |
| 0.1 | 2.0 | GO:0004659 | prenyltransferase activity(GO:0004659) |
| 0.1 | 0.1 | GO:0003909 | DNA ligase activity(GO:0003909) |
| 0.1 | 2.5 | GO:0030742 | GTP-dependent protein binding(GO:0030742) |
| 0.1 | 0.6 | GO:0034483 | heparan sulfate sulfotransferase activity(GO:0034483) |
| 0.1 | 1.1 | GO:0009982 | pseudouridine synthase activity(GO:0009982) |
| 0.1 | 0.2 | GO:0005006 | epidermal growth factor-activated receptor activity(GO:0005006) |
| 0.1 | 59.8 | GO:0005509 | calcium ion binding(GO:0005509) |
| 0.1 | 0.4 | GO:0032422 | purine-rich negative regulatory element binding(GO:0032422) |
| 0.1 | 1.0 | GO:0002162 | dystroglycan binding(GO:0002162) |
| 0.1 | 0.2 | GO:0004008 | copper-exporting ATPase activity(GO:0004008) copper-transporting ATPase activity(GO:0043682) |
| 0.1 | 1.5 | GO:0005132 | type I interferon receptor binding(GO:0005132) |
| 0.1 | 0.8 | GO:0017134 | fibroblast growth factor binding(GO:0017134) |
| 0.1 | 0.5 | GO:0008607 | phosphorylase kinase regulator activity(GO:0008607) |
| 0.1 | 1.4 | GO:0019706 | protein-cysteine S-palmitoyltransferase activity(GO:0019706) protein-cysteine S-acyltransferase activity(GO:0019707) |
| 0.1 | 0.3 | GO:0008158 | hedgehog receptor activity(GO:0008158) |
| 0.1 | 0.3 | GO:0008532 | N-acetyllactosaminide beta-1,3-N-acetylglucosaminyltransferase activity(GO:0008532) |
| 0.1 | 0.2 | GO:0005457 | GDP-fucose transmembrane transporter activity(GO:0005457) purine nucleotide-sugar transmembrane transporter activity(GO:0036080) |
| 0.1 | 0.2 | GO:0005011 | macrophage colony-stimulating factor receptor activity(GO:0005011) |
| 0.1 | 0.3 | GO:0003796 | lysozyme activity(GO:0003796) |
| 0.1 | 0.1 | GO:0015111 | iodide transmembrane transporter activity(GO:0015111) |
| 0.1 | 0.4 | GO:0016594 | glycine binding(GO:0016594) |
| 0.1 | 1.5 | GO:0044769 | ATPase activity, coupled to transmembrane movement of ions, rotational mechanism(GO:0044769) proton-transporting ATPase activity, rotational mechanism(GO:0046961) |
| 0.1 | 0.4 | GO:0032052 | bile acid binding(GO:0032052) |
| 0.1 | 0.4 | GO:0016712 | oxidoreductase activity, acting on paired donors, with incorporation or reduction of molecular oxygen, reduced flavin or flavoprotein as one donor, and incorporation of one atom of oxygen(GO:0016712) aromatase activity(GO:0070330) |
| 0.1 | 0.3 | GO:0008853 | exodeoxyribonuclease III activity(GO:0008853) |
| 0.1 | 0.5 | GO:0004340 | glucokinase activity(GO:0004340) hexokinase activity(GO:0004396) fructokinase activity(GO:0008865) mannokinase activity(GO:0019158) |
| 0.0 | 0.4 | GO:0030882 | lipid antigen binding(GO:0030882) endogenous lipid antigen binding(GO:0030883) exogenous lipid antigen binding(GO:0030884) |
| 0.0 | 0.4 | GO:0016724 | ferroxidase activity(GO:0004322) oxidoreductase activity, oxidizing metal ions, oxygen as acceptor(GO:0016724) |
| 0.0 | 0.1 | GO:0004165 | dodecenoyl-CoA delta-isomerase activity(GO:0004165) |
| 0.0 | 0.4 | GO:0008499 | UDP-galactose:beta-N-acetylglucosamine beta-1,3-galactosyltransferase activity(GO:0008499) |
| 0.0 | 10.2 | GO:0001077 | transcriptional activator activity, RNA polymerase II core promoter proximal region sequence-specific binding(GO:0001077) |
| 0.0 | 0.1 | GO:0047144 | 2-acylglycerol-3-phosphate O-acyltransferase activity(GO:0047144) |
| 0.0 | 0.2 | GO:0032794 | GTPase activating protein binding(GO:0032794) |
| 0.0 | 0.2 | GO:0005127 | ciliary neurotrophic factor receptor binding(GO:0005127) |
| 0.0 | 1.4 | GO:0001190 | transcriptional activator activity, RNA polymerase II transcription factor binding(GO:0001190) transcriptional repressor activity, RNA polymerase II activating transcription factor binding(GO:0098811) |
| 0.0 | 0.0 | GO:0022835 | transmitter-gated ion channel activity(GO:0022824) transmitter-gated channel activity(GO:0022835) |
| 0.0 | 0.2 | GO:0005230 | extracellular ligand-gated ion channel activity(GO:0005230) |
| 0.0 | 0.0 | GO:0008269 | JAK pathway signal transduction adaptor activity(GO:0008269) |
| 0.0 | 0.3 | GO:0016709 | oxidoreductase activity, acting on paired donors, with incorporation or reduction of molecular oxygen, NAD(P)H as one donor, and incorporation of one atom of oxygen(GO:0016709) |
Gene overrepresentation in curated gene sets: canonical pathways category:
| Log-likelihood per target | Total log-likelihood | Term | Description |
|---|---|---|---|
| 4.6 | 13.7 | PID PDGFRA PATHWAY | PDGFR-alpha signaling pathway |
| 3.3 | 33.1 | PID SYNDECAN 2 PATHWAY | Syndecan-2-mediated signaling events |
| 3.1 | 12.3 | PID THROMBIN PAR4 PATHWAY | PAR4-mediated thrombin signaling events |
| 2.7 | 75.7 | PID S1P S1P4 PATHWAY | S1P4 pathway |
| 2.6 | 156.4 | PID NCADHERIN PATHWAY | N-cadherin signaling events |
| 2.4 | 128.7 | ST GA13 PATHWAY | G alpha 13 Pathway |
| 2.4 | 132.1 | SIG CD40PATHWAYMAP | Genes related to CD40 signaling |
| 2.2 | 30.8 | PID HEDGEHOG GLI PATHWAY | Hedgehog signaling events mediated by Gli proteins |
| 2.2 | 19.5 | PID ATF2 PATHWAY | ATF-2 transcription factor network |
| 2.2 | 4.3 | PID TXA2PATHWAY | Thromboxane A2 receptor signaling |
| 2.1 | 96.3 | PID LKB1 PATHWAY | LKB1 signaling events |
| 2.0 | 22.1 | PID P38 GAMMA DELTA PATHWAY | Signaling mediated by p38-gamma and p38-delta |
| 1.9 | 100.8 | PID RXR VDR PATHWAY | RXR and RAR heterodimerization with other nuclear receptor |
| 1.7 | 13.9 | ST G ALPHA S PATHWAY | G alpha s Pathway |
| 1.7 | 10.0 | ST G ALPHA I PATHWAY | G alpha i Pathway |
| 1.7 | 31.6 | PID ERBB2 ERBB3 PATHWAY | ErbB2/ErbB3 signaling events |
| 1.6 | 4.9 | PID HIV NEF PATHWAY | HIV-1 Nef: Negative effector of Fas and TNF-alpha |
| 1.5 | 9.2 | SA TRKA RECEPTOR | The TrkA receptor binds nerve growth factor to activate MAP kinase pathways and promote cell growth. |
| 1.5 | 36.7 | PID IL8 CXCR1 PATHWAY | IL8- and CXCR1-mediated signaling events |
| 1.5 | 33.7 | PID MAPK TRK PATHWAY | Trk receptor signaling mediated by the MAPK pathway |
| 1.4 | 18.6 | ST PAC1 RECEPTOR PATHWAY | PAC1 Receptor Pathway |
| 1.4 | 4.1 | PID TCR JNK PATHWAY | JNK signaling in the CD4+ TCR pathway |
| 1.3 | 52.4 | ST WNT BETA CATENIN PATHWAY | Wnt/beta-catenin Pathway |
| 1.3 | 2.7 | PID WNT NONCANONICAL PATHWAY | Noncanonical Wnt signaling pathway |
| 1.3 | 34.9 | PID SYNDECAN 3 PATHWAY | Syndecan-3-mediated signaling events |
| 1.3 | 80.7 | PID CDC42 REG PATHWAY | Regulation of CDC42 activity |
| 1.2 | 18.6 | ST ADRENERGIC | Adrenergic Pathway |
| 1.2 | 20.9 | PID ENDOTHELIN PATHWAY | Endothelins |
| 1.2 | 15.7 | PID PI3K PLC TRK PATHWAY | Trk receptor signaling mediated by PI3K and PLC-gamma |
| 1.2 | 21.1 | PID RAC1 PATHWAY | RAC1 signaling pathway |
| 1.1 | 34.2 | PID EPHB FWD PATHWAY | EPHB forward signaling |
| 1.1 | 31.5 | ST WNT CA2 CYCLIC GMP PATHWAY | Wnt/Ca2+/cyclic GMP signaling. |
| 1.1 | 5.6 | PID AR NONGENOMIC PATHWAY | Nongenotropic Androgen signaling |
| 1.1 | 45.5 | PID RAS PATHWAY | Regulation of Ras family activation |
| 1.1 | 39.6 | PID P38 ALPHA BETA PATHWAY | Regulation of p38-alpha and p38-beta |
| 1.1 | 2.2 | ST STAT3 PATHWAY | STAT3 Pathway |
| 1.1 | 8.6 | PID UPA UPAR PATHWAY | Urokinase-type plasminogen activator (uPA) and uPAR-mediated signaling |
| 1.1 | 35.6 | PID NETRIN PATHWAY | Netrin-mediated signaling events |
| 1.0 | 4.1 | PID CXCR3 PATHWAY | CXCR3-mediated signaling events |
| 1.0 | 14.1 | PID INTEGRIN5 PATHWAY | Beta5 beta6 beta7 and beta8 integrin cell surface interactions |
| 1.0 | 18.4 | PID TELOMERASE PATHWAY | Regulation of Telomerase |
| 0.9 | 45.5 | NABA COLLAGENS | Genes encoding collagen proteins |
| 0.9 | 16.5 | PID LYSOPHOSPHOLIPID PATHWAY | LPA receptor mediated events |
| 0.9 | 2.7 | PID EPO PATHWAY | EPO signaling pathway |
| 0.9 | 62.7 | PID RHOA REG PATHWAY | Regulation of RhoA activity |
| 0.9 | 35.5 | PID SHP2 PATHWAY | SHP2 signaling |
| 0.9 | 7.1 | PID TCR RAS PATHWAY | Ras signaling in the CD4+ TCR pathway |
| 0.9 | 17.6 | PID FAS PATHWAY | FAS (CD95) signaling pathway |
| 0.9 | 16.5 | PID ER NONGENOMIC PATHWAY | Plasma membrane estrogen receptor signaling |
| 0.8 | 7.6 | PID A6B1 A6B4 INTEGRIN PATHWAY | a6b1 and a6b4 Integrin signaling |
| 0.7 | 5.1 | ST MYOCYTE AD PATHWAY | Myocyte Adrenergic Pathway is a specific case of the generalized Adrenergic Pathway. |
| 0.7 | 100.2 | PID MYC REPRESS PATHWAY | Validated targets of C-MYC transcriptional repression |
| 0.7 | 37.9 | PID ARF6 TRAFFICKING PATHWAY | Arf6 trafficking events |
| 0.7 | 36.7 | PID TCR CALCIUM PATHWAY | Calcium signaling in the CD4+ TCR pathway |
| 0.6 | 1.9 | PID LYMPH ANGIOGENESIS PATHWAY | VEGFR3 signaling in lymphatic endothelium |
| 0.6 | 10.2 | PID LPA4 PATHWAY | LPA4-mediated signaling events |
| 0.6 | 22.9 | PID FRA PATHWAY | Validated transcriptional targets of AP1 family members Fra1 and Fra2 |
| 0.6 | 19.3 | PID HDAC CLASSIII PATHWAY | Signaling events mediated by HDAC Class III |
| 0.6 | 6.2 | ST GA12 PATHWAY | G alpha 12 Pathway |
| 0.6 | 2.2 | ST B CELL ANTIGEN RECEPTOR | B Cell Antigen Receptor |
| 0.5 | 13.9 | PID AVB3 INTEGRIN PATHWAY | Integrins in angiogenesis |
| 0.5 | 3.6 | ST INTERFERON GAMMA PATHWAY | Interferon gamma pathway. |
| 0.5 | 7.1 | PID INTEGRIN A9B1 PATHWAY | Alpha9 beta1 integrin signaling events |
| 0.5 | 11.4 | PID WNT CANONICAL PATHWAY | Canonical Wnt signaling pathway |
| 0.5 | 28.8 | PID AR TF PATHWAY | Regulation of Androgen receptor activity |
| 0.5 | 5.3 | PID EPHA FWDPATHWAY | EPHA forward signaling |
| 0.5 | 17.5 | SA CASPASE CASCADE | Apoptosis is mediated by caspases, cysteine proteases arranged in a proteolytic cascade. |
| 0.5 | 10.5 | PID HEDGEHOG 2PATHWAY | Signaling events mediated by the Hedgehog family |
| 0.5 | 16.0 | PID ARF6 PATHWAY | Arf6 signaling events |
| 0.4 | 11.7 | PID REELIN PATHWAY | Reelin signaling pathway |
| 0.4 | 26.6 | PID FGF PATHWAY | FGF signaling pathway |
| 0.4 | 10.9 | PID RHODOPSIN PATHWAY | Visual signal transduction: Rods |
| 0.4 | 20.8 | PID P75 NTR PATHWAY | p75(NTR)-mediated signaling |
| 0.4 | 3.3 | PID ERBB NETWORK PATHWAY | ErbB receptor signaling network |
| 0.4 | 9.5 | PID GLYPICAN 1PATHWAY | Glypican 1 network |
| 0.3 | 2.1 | ST DIFFERENTIATION PATHWAY IN PC12 CELLS | Differentiation Pathway in PC12 Cells; this is a specific case of PAC1 Receptor Pathway. |
| 0.3 | 2.2 | SA FAS SIGNALING | The TNF-type receptor Fas induces apoptosis on ligand binding. |
| 0.3 | 3.7 | ST INTEGRIN SIGNALING PATHWAY | Integrin Signaling Pathway |
| 0.3 | 1.2 | PID CD8 TCR PATHWAY | TCR signaling in naïve CD8+ T cells |
| 0.3 | 4.4 | PID IL1 PATHWAY | IL1-mediated signaling events |
| 0.3 | 7.8 | ST T CELL SIGNAL TRANSDUCTION | T Cell Signal Transduction |
| 0.3 | 4.8 | PID RET PATHWAY | Signaling events regulated by Ret tyrosine kinase |
| 0.3 | 3.5 | PID RAC1 REG PATHWAY | Regulation of RAC1 activity |
| 0.3 | 10.0 | PID FCER1 PATHWAY | Fc-epsilon receptor I signaling in mast cells |
| 0.2 | 8.8 | PID TRKR PATHWAY | Neurotrophic factor-mediated Trk receptor signaling |
| 0.2 | 3.1 | PID KIT PATHWAY | Signaling events mediated by Stem cell factor receptor (c-Kit) |
| 0.2 | 0.6 | PID S1P S1P2 PATHWAY | S1P2 pathway |
| 0.2 | 2.3 | PID NEPHRIN NEPH1 PATHWAY | Nephrin/Neph1 signaling in the kidney podocyte |
| 0.2 | 6.3 | PID ALPHA SYNUCLEIN PATHWAY | Alpha-synuclein signaling |
| 0.2 | 5.7 | PID IL23 PATHWAY | IL23-mediated signaling events |
| 0.2 | 0.7 | PID ARF6 DOWNSTREAM PATHWAY | Arf6 downstream pathway |
| 0.1 | 4.8 | PID INTEGRIN A4B1 PATHWAY | Alpha4 beta1 integrin signaling events |
| 0.1 | 3.0 | PID PDGFRB PATHWAY | PDGFR-beta signaling pathway |
| 0.1 | 36.0 | NABA SECRETED FACTORS | Genes encoding secreted soluble factors |
| 0.1 | 0.6 | PID MET PATHWAY | Signaling events mediated by Hepatocyte Growth Factor Receptor (c-Met) |
| 0.1 | 1.1 | PID P38 MKK3 6PATHWAY | p38 MAPK signaling pathway |
| 0.1 | 0.4 | PID INSULIN PATHWAY | Insulin Pathway |
| 0.0 | 9.3 | NABA ECM REGULATORS | Genes encoding enzymes and their regulators involved in the remodeling of the extracellular matrix |
Gene overrepresentation in curated gene sets: REACTOME pathways category:
| Log-likelihood per target | Total log-likelihood | Term | Description |
|---|---|---|---|
| 12.6 | 251.8 | REACTOME CLASS C 3 METABOTROPIC GLUTAMATE PHEROMONE RECEPTORS | Genes involved in Class C/3 (Metabotropic glutamate/pheromone receptors) |
| 8.9 | 354.4 | REACTOME GABA SYNTHESIS RELEASE REUPTAKE AND DEGRADATION | Genes involved in GABA synthesis, release, reuptake and degradation |
| 6.3 | 169.0 | REACTOME PLATELET CALCIUM HOMEOSTASIS | Genes involved in Platelet calcium homeostasis |
| 6.0 | 227.3 | REACTOME GABA A RECEPTOR ACTIVATION | Genes involved in GABA A receptor activation |
| 5.5 | 236.9 | REACTOME INTERACTION BETWEEN L1 AND ANKYRINS | Genes involved in Interaction between L1 and Ankyrins |
| 4.3 | 4.3 | REACTOME PROSTACYCLIN SIGNALLING THROUGH PROSTACYCLIN RECEPTOR | Genes involved in Prostacyclin signalling through prostacyclin receptor |
| 4.1 | 131.3 | REACTOME UNBLOCKING OF NMDA RECEPTOR GLUTAMATE BINDING AND ACTIVATION | Genes involved in Unblocking of NMDA receptor, glutamate binding and activation |
| 4.0 | 166.3 | REACTOME ION TRANSPORT BY P TYPE ATPASES | Genes involved in Ion transport by P-type ATPases |
| 3.9 | 11.6 | REACTOME NOREPINEPHRINE NEUROTRANSMITTER RELEASE CYCLE | Genes involved in Norepinephrine Neurotransmitter Release Cycle |
| 3.6 | 7.3 | REACTOME JNK C JUN KINASES PHOSPHORYLATION AND ACTIVATION MEDIATED BY ACTIVATED HUMAN TAK1 | Genes involved in JNK (c-Jun kinases) phosphorylation and activation mediated by activated human TAK1 |
| 3.5 | 7.1 | REACTOME SIGNALLING TO RAS | Genes involved in Signalling to RAS |
| 3.4 | 262.0 | REACTOME NCAM1 INTERACTIONS | Genes involved in NCAM1 interactions |
| 3.4 | 6.8 | REACTOME RAS ACTIVATION UOPN CA2 INFUX THROUGH NMDA RECEPTOR | Genes involved in Ras activation uopn Ca2+ infux through NMDA receptor |
| 3.1 | 15.5 | REACTOME DOPAMINE NEUROTRANSMITTER RELEASE CYCLE | Genes involved in Dopamine Neurotransmitter Release Cycle |
| 2.9 | 42.9 | REACTOME GLUTAMATE NEUROTRANSMITTER RELEASE CYCLE | Genes involved in Glutamate Neurotransmitter Release Cycle |
| 2.7 | 144.0 | REACTOME VOLTAGE GATED POTASSIUM CHANNELS | Genes involved in Voltage gated Potassium channels |
| 2.6 | 123.5 | REACTOME REGULATION OF GENE EXPRESSION IN BETA CELLS | Genes involved in Regulation of gene expression in beta cells |
| 2.6 | 5.2 | REACTOME PECAM1 INTERACTIONS | Genes involved in PECAM1 interactions |
| 2.6 | 119.5 | REACTOME CGMP EFFECTS | Genes involved in cGMP effects |
| 2.4 | 83.6 | REACTOME IONOTROPIC ACTIVITY OF KAINATE RECEPTORS | Genes involved in Ionotropic activity of Kainate Receptors |
| 2.4 | 63.7 | REACTOME ACTIVATION OF THE AP1 FAMILY OF TRANSCRIPTION FACTORS | Genes involved in Activation of the AP-1 family of transcription factors |
| 2.3 | 103.5 | REACTOME AMYLOIDS | Genes involved in Amyloids |
| 2.3 | 73.2 | REACTOME TRAFFICKING OF AMPA RECEPTORS | Genes involved in Trafficking of AMPA receptors |
| 2.1 | 147.2 | REACTOME MYOGENESIS | Genes involved in Myogenesis |
| 2.1 | 63.9 | REACTOME SULFUR AMINO ACID METABOLISM | Genes involved in Sulfur amino acid metabolism |
| 2.0 | 30.5 | REACTOME ACYL CHAIN REMODELLING OF PS | Genes involved in Acyl chain remodelling of PS |
| 2.0 | 30.0 | REACTOME GAP JUNCTION DEGRADATION | Genes involved in Gap junction degradation |
| 1.9 | 11.6 | REACTOME NUCLEAR SIGNALING BY ERBB4 | Genes involved in Nuclear signaling by ERBB4 |
| 1.9 | 57.0 | REACTOME KERATAN SULFATE BIOSYNTHESIS | Genes involved in Keratan sulfate biosynthesis |
| 1.9 | 94.7 | REACTOME DARPP 32 EVENTS | Genes involved in DARPP-32 events |
| 1.9 | 52.8 | REACTOME CRMPS IN SEMA3A SIGNALING | Genes involved in CRMPs in Sema3A signaling |
| 1.8 | 12.8 | REACTOME CIRCADIAN REPRESSION OF EXPRESSION BY REV ERBA | Genes involved in Circadian Repression of Expression by REV-ERBA |
| 1.8 | 23.8 | REACTOME PASSIVE TRANSPORT BY AQUAPORINS | Genes involved in Passive Transport by Aquaporins |
| 1.8 | 231.3 | REACTOME TRANSPORT OF INORGANIC CATIONS ANIONS AND AMINO ACIDS OLIGOPEPTIDES | Genes involved in Transport of inorganic cations/anions and amino acids/oligopeptides |
| 1.7 | 46.9 | REACTOME ADHERENS JUNCTIONS INTERACTIONS | Genes involved in Adherens junctions interactions |
| 1.7 | 55.9 | REACTOME INHIBITION OF INSULIN SECRETION BY ADRENALINE NORADRENALINE | Genes involved in Inhibition of Insulin Secretion by Adrenaline/Noradrenaline |
| 1.6 | 13.1 | REACTOME THROMBOXANE SIGNALLING THROUGH TP RECEPTOR | Genes involved in Thromboxane signalling through TP receptor |
| 1.6 | 13.0 | REACTOME ACYL CHAIN REMODELLING OF PE | Genes involved in Acyl chain remodelling of PE |
| 1.5 | 6.2 | REACTOME CONVERSION FROM APC C CDC20 TO APC C CDH1 IN LATE ANAPHASE | Genes involved in Conversion from APC/C:Cdc20 to APC/C:Cdh1 in late anaphase |
| 1.5 | 10.8 | REACTOME FGFR2C LIGAND BINDING AND ACTIVATION | Genes involved in FGFR2c ligand binding and activation |
| 1.5 | 1.5 | REACTOME GAB1 SIGNALOSOME | Genes involved in GAB1 signalosome |
| 1.4 | 68.8 | REACTOME POTASSIUM CHANNELS | Genes involved in Potassium Channels |
| 1.4 | 33.6 | REACTOME INTRINSIC PATHWAY | Genes involved in Intrinsic Pathway |
| 1.3 | 7.8 | REACTOME ACTIVATION OF IRF3 IRF7 MEDIATED BY TBK1 IKK EPSILON | Genes involved in Activation of IRF3/IRF7 mediated by TBK1/IKK epsilon |
| 1.3 | 24.7 | REACTOME INITIAL TRIGGERING OF COMPLEMENT | Genes involved in Initial triggering of complement |
| 1.2 | 23.2 | REACTOME REGULATION OF RHEB GTPASE ACTIVITY BY AMPK | Genes involved in Regulation of Rheb GTPase activity by AMPK |
| 1.2 | 23.2 | REACTOME SIGNALING BY FGFR3 MUTANTS | Genes involved in Signaling by FGFR3 mutants |
| 1.2 | 1.2 | REACTOME E2F ENABLED INHIBITION OF PRE REPLICATION COMPLEX FORMATION | Genes involved in E2F-enabled inhibition of pre-replication complex formation |
| 1.2 | 15.6 | REACTOME THE ACTIVATION OF ARYLSULFATASES | Genes involved in The activation of arylsulfatases |
| 1.2 | 18.7 | REACTOME REVERSIBLE HYDRATION OF CARBON DIOXIDE | Genes involved in Reversible Hydration of Carbon Dioxide |
| 1.2 | 15.2 | REACTOME G PROTEIN ACTIVATION | Genes involved in G-protein activation |
| 1.1 | 105.8 | REACTOME TRANSMISSION ACROSS CHEMICAL SYNAPSES | Genes involved in Transmission across Chemical Synapses |
| 1.1 | 19.1 | REACTOME REGULATION OF PYRUVATE DEHYDROGENASE PDH COMPLEX | Genes involved in Regulation of pyruvate dehydrogenase (PDH) complex |
| 1.1 | 41.4 | REACTOME A TETRASACCHARIDE LINKER SEQUENCE IS REQUIRED FOR GAG SYNTHESIS | Genes involved in A tetrasaccharide linker sequence is required for GAG synthesis |
| 1.1 | 26.7 | REACTOME REGULATION OF INSULIN LIKE GROWTH FACTOR IGF ACTIVITY BY INSULIN LIKE GROWTH FACTOR BINDING PROTEINS IGFBPS | Genes involved in Regulation of Insulin-like Growth Factor (IGF) Activity by Insulin-like Growth Factor Binding Proteins (IGFBPs) |
| 1.1 | 4.3 | REACTOME VEGF LIGAND RECEPTOR INTERACTIONS | Genes involved in VEGF ligand-receptor interactions |
| 1.0 | 18.9 | REACTOME GLUCAGON TYPE LIGAND RECEPTORS | Genes involved in Glucagon-type ligand receptors |
| 1.0 | 103.4 | REACTOME NUCLEAR RECEPTOR TRANSCRIPTION PATHWAY | Genes involved in Nuclear Receptor transcription pathway |
| 1.0 | 17.7 | REACTOME CHYLOMICRON MEDIATED LIPID TRANSPORT | Genes involved in Chylomicron-mediated lipid transport |
| 1.0 | 20.8 | REACTOME FACILITATIVE NA INDEPENDENT GLUCOSE TRANSPORTERS | Genes involved in Facilitative Na+-independent glucose transporters |
| 1.0 | 8.3 | REACTOME REGULATION OF KIT SIGNALING | Genes involved in Regulation of KIT signaling |
| 1.0 | 15.4 | REACTOME PYRIMIDINE CATABOLISM | Genes involved in Pyrimidine catabolism |
| 1.0 | 2.0 | REACTOME PD1 SIGNALING | Genes involved in PD-1 signaling |
| 1.0 | 14.3 | REACTOME SEROTONIN RECEPTORS | Genes involved in Serotonin receptors |
| 1.0 | 2.0 | REACTOME ACYL CHAIN REMODELLING OF PI | Genes involved in Acyl chain remodelling of PI |
| 1.0 | 15.8 | REACTOME SYNTHESIS OF PE | Genes involved in Synthesis of PE |
| 1.0 | 43.8 | REACTOME GLYCOLYSIS | Genes involved in Glycolysis |
| 1.0 | 28.7 | REACTOME TRANSFERRIN ENDOCYTOSIS AND RECYCLING | Genes involved in Transferrin endocytosis and recycling |
| 0.9 | 14.2 | REACTOME ROLE OF DCC IN REGULATING APOPTOSIS | Genes involved in Role of DCC in regulating apoptosis |
| 0.9 | 6.5 | REACTOME RETROGRADE NEUROTROPHIN SIGNALLING | Genes involved in Retrograde neurotrophin signalling |
| 0.9 | 37.0 | REACTOME NOTCH1 INTRACELLULAR DOMAIN REGULATES TRANSCRIPTION | Genes involved in NOTCH1 Intracellular Domain Regulates Transcription |
| 0.9 | 3.4 | REACTOME SEMA3A PLEXIN REPULSION SIGNALING BY INHIBITING INTEGRIN ADHESION | Genes involved in SEMA3A-Plexin repulsion signaling by inhibiting Integrin adhesion |
| 0.8 | 2.5 | REACTOME SIGNALING BY ACTIVATED POINT MUTANTS OF FGFR1 | Genes involved in Signaling by activated point mutants of FGFR1 |
| 0.8 | 11.3 | REACTOME CHEMOKINE RECEPTORS BIND CHEMOKINES | Genes involved in Chemokine receptors bind chemokines |
| 0.8 | 14.4 | REACTOME ACTIVATED AMPK STIMULATES FATTY ACID OXIDATION IN MUSCLE | Genes involved in Activated AMPK stimulates fatty-acid oxidation in muscle |
| 0.8 | 2.3 | REACTOME COSTIMULATION BY THE CD28 FAMILY | Genes involved in Costimulation by the CD28 family |
| 0.7 | 9.7 | REACTOME CIRCADIAN CLOCK | Genes involved in Circadian Clock |
| 0.7 | 20.0 | REACTOME AMINE LIGAND BINDING RECEPTORS | Genes involved in Amine ligand-binding receptors |
| 0.7 | 27.0 | REACTOME CLASS B 2 SECRETIN FAMILY RECEPTORS | Genes involved in Class B/2 (Secretin family receptors) |
| 0.7 | 2.2 | REACTOME PLATELET AGGREGATION PLUG FORMATION | Genes involved in Platelet Aggregation (Plug Formation) |
| 0.7 | 16.5 | REACTOME EGFR DOWNREGULATION | Genes involved in EGFR downregulation |
| 0.7 | 37.1 | REACTOME G ALPHA S SIGNALLING EVENTS | Genes involved in G alpha (s) signalling events |
| 0.7 | 11.8 | REACTOME ENDOGENOUS STEROLS | Genes involved in Endogenous sterols |
| 0.7 | 17.3 | REACTOME SIGNALING BY BMP | Genes involved in Signaling by BMP |
| 0.7 | 4.8 | REACTOME IL 7 SIGNALING | Genes involved in Interleukin-7 signaling |
| 0.7 | 121.1 | REACTOME G ALPHA Q SIGNALLING EVENTS | Genes involved in G alpha (q) signalling events |
| 0.7 | 11.2 | REACTOME HS GAG BIOSYNTHESIS | Genes involved in HS-GAG biosynthesis |
| 0.6 | 7.6 | REACTOME PEPTIDE LIGAND BINDING RECEPTORS | Genes involved in Peptide ligand-binding receptors |
| 0.6 | 30.1 | REACTOME SIGNALING BY ROBO RECEPTOR | Genes involved in Signaling by Robo receptor |
| 0.6 | 83.6 | REACTOME G ALPHA I SIGNALLING EVENTS | Genes involved in G alpha (i) signalling events |
| 0.6 | 13.6 | REACTOME G ALPHA Z SIGNALLING EVENTS | Genes involved in G alpha (z) signalling events |
| 0.6 | 6.7 | REACTOME NA CL DEPENDENT NEUROTRANSMITTER TRANSPORTERS | Genes involved in Na+/Cl- dependent neurotransmitter transporters |
| 0.6 | 10.4 | REACTOME AMINE DERIVED HORMONES | Genes involved in Amine-derived hormones |
| 0.6 | 8.9 | REACTOME SYNTHESIS OF SUBSTRATES IN N GLYCAN BIOSYTHESIS | Genes involved in Synthesis of substrates in N-glycan biosythesis |
| 0.6 | 7.2 | REACTOME CDC6 ASSOCIATION WITH THE ORC ORIGIN COMPLEX | Genes involved in CDC6 association with the ORC:origin complex |
| 0.6 | 1.7 | REACTOME NEF MEDIATED DOWNREGULATION OF MHC CLASS I COMPLEX CELL SURFACE EXPRESSION | Genes involved in Nef mediated downregulation of MHC class I complex cell surface expression |
| 0.5 | 35.3 | REACTOME PHASE1 FUNCTIONALIZATION OF COMPOUNDS | Genes involved in Phase 1 - Functionalization of compounds |
| 0.5 | 10.9 | REACTOME FORMATION OF FIBRIN CLOT CLOTTING CASCADE | Genes involved in Formation of Fibrin Clot (Clotting Cascade) |
| 0.5 | 17.2 | REACTOME SYNTHESIS OF PIPS AT THE PLASMA MEMBRANE | Genes involved in Synthesis of PIPs at the plasma membrane |
| 0.5 | 9.4 | REACTOME MRNA DECAY BY 5 TO 3 EXORIBONUCLEASE | Genes involved in mRNA Decay by 5' to 3' Exoribonuclease |
| 0.5 | 8.9 | REACTOME NEPHRIN INTERACTIONS | Genes involved in Nephrin interactions |
| 0.4 | 7.0 | REACTOME GAP JUNCTION ASSEMBLY | Genes involved in Gap junction assembly |
| 0.4 | 7.0 | REACTOME MITOCHONDRIAL TRNA AMINOACYLATION | Genes involved in Mitochondrial tRNA aminoacylation |
| 0.4 | 1.3 | REACTOME SYNTHESIS OF PA | Genes involved in Synthesis of PA |
| 0.4 | 0.4 | REACTOME DAG AND IP3 SIGNALING | Genes involved in DAG and IP3 signaling |
| 0.4 | 3.7 | REACTOME REGULATION OF INSULIN SECRETION BY GLUCAGON LIKE PEPTIDE1 | Genes involved in Regulation of Insulin Secretion by Glucagon-like Peptide-1 |
| 0.3 | 9.3 | REACTOME KINESINS | Genes involved in Kinesins |
| 0.3 | 10.9 | REACTOME PI3K EVENTS IN ERBB2 SIGNALING | Genes involved in PI3K events in ERBB2 signaling |
| 0.3 | 6.3 | REACTOME INSULIN SYNTHESIS AND PROCESSING | Genes involved in Insulin Synthesis and Processing |
| 0.3 | 6.4 | REACTOME PROCESSING OF INTRONLESS PRE MRNAS | Genes involved in Processing of Intronless Pre-mRNAs |
| 0.3 | 7.2 | REACTOME CYTOSOLIC SULFONATION OF SMALL MOLECULES | Genes involved in Cytosolic sulfonation of small molecules |
| 0.3 | 15.2 | REACTOME NRAGE SIGNALS DEATH THROUGH JNK | Genes involved in NRAGE signals death through JNK |
| 0.3 | 6.1 | REACTOME BASE FREE SUGAR PHOSPHATE REMOVAL VIA THE SINGLE NUCLEOTIDE REPLACEMENT PATHWAY | Genes involved in Base-free sugar-phosphate removal via the single-nucleotide replacement pathway |
| 0.3 | 2.4 | REACTOME NITRIC OXIDE STIMULATES GUANYLATE CYCLASE | Genes involved in Nitric oxide stimulates guanylate cyclase |
| 0.3 | 2.0 | REACTOME LIGAND GATED ION CHANNEL TRANSPORT | Genes involved in Ligand-gated ion channel transport |
| 0.3 | 2.3 | REACTOME REGULATION OF THE FANCONI ANEMIA PATHWAY | Genes involved in Regulation of the Fanconi anemia pathway |
| 0.3 | 0.8 | REACTOME GASTRIN CREB SIGNALLING PATHWAY VIA PKC AND MAPK | Genes involved in Gastrin-CREB signalling pathway via PKC and MAPK |
| 0.3 | 7.5 | REACTOME GLUTATHIONE CONJUGATION | Genes involved in Glutathione conjugation |
| 0.2 | 2.0 | REACTOME AMINE COMPOUND SLC TRANSPORTERS | Genes involved in Amine compound SLC transporters |
| 0.2 | 21.5 | REACTOME RECRUITMENT OF MITOTIC CENTROSOME PROTEINS AND COMPLEXES | Genes involved in Recruitment of mitotic centrosome proteins and complexes |
| 0.2 | 3.3 | REACTOME PRE NOTCH PROCESSING IN GOLGI | Genes involved in Pre-NOTCH Processing in Golgi |
| 0.2 | 6.2 | REACTOME GPVI MEDIATED ACTIVATION CASCADE | Genes involved in GPVI-mediated activation cascade |
| 0.2 | 1.6 | REACTOME TRANSLOCATION OF ZAP 70 TO IMMUNOLOGICAL SYNAPSE | Genes involved in Translocation of ZAP-70 to Immunological synapse |
| 0.2 | 1.1 | REACTOME TRAF6 MEDIATED IRF7 ACTIVATION | Genes involved in TRAF6 mediated IRF7 activation |
| 0.2 | 1.5 | REACTOME BETA DEFENSINS | Genes involved in Beta defensins |
| 0.2 | 1.7 | REACTOME PACKAGING OF TELOMERE ENDS | Genes involved in Packaging Of Telomere Ends |
| 0.2 | 5.3 | REACTOME DOWNREGULATION OF ERBB2 ERBB3 SIGNALING | Genes involved in Downregulation of ERBB2:ERBB3 signaling |
| 0.2 | 3.7 | REACTOME STEROID HORMONES | Genes involved in Steroid hormones |
| 0.2 | 0.8 | REACTOME ANTIGEN ACTIVATES B CELL RECEPTOR LEADING TO GENERATION OF SECOND MESSENGERS | Genes involved in Antigen Activates B Cell Receptor Leading to Generation of Second Messengers |
| 0.2 | 1.4 | REACTOME THE ROLE OF NEF IN HIV1 REPLICATION AND DISEASE PATHOGENESIS | Genes involved in The role of Nef in HIV-1 replication and disease pathogenesis |
| 0.2 | 1.9 | REACTOME SYNTHESIS OF PIPS AT THE GOLGI MEMBRANE | Genes involved in Synthesis of PIPs at the Golgi membrane |
| 0.2 | 3.4 | REACTOME GLYCOGEN BREAKDOWN GLYCOGENOLYSIS | Genes involved in Glycogen breakdown (glycogenolysis) |
| 0.2 | 3.0 | REACTOME TERMINATION OF O GLYCAN BIOSYNTHESIS | Genes involved in Termination of O-glycan biosynthesis |
| 0.1 | 0.7 | REACTOME SYNTHESIS OF BILE ACIDS AND BILE SALTS VIA 24 HYDROXYCHOLESTEROL | Genes involved in Synthesis of bile acids and bile salts via 24-hydroxycholesterol |
| 0.1 | 0.6 | REACTOME TRAF6 MEDIATED IRF7 ACTIVATION IN TLR7 8 OR 9 SIGNALING | Genes involved in TRAF6 mediated IRF7 activation in TLR7/8 or 9 signaling |
| 0.1 | 0.9 | REACTOME CD28 DEPENDENT PI3K AKT SIGNALING | Genes involved in CD28 dependent PI3K/Akt signaling |
| 0.1 | 2.3 | REACTOME LYSOSOME VESICLE BIOGENESIS | Genes involved in Lysosome Vesicle Biogenesis |
| 0.1 | 1.4 | REACTOME RNA POL I TRANSCRIPTION INITIATION | Genes involved in RNA Polymerase I Transcription Initiation |
| 0.1 | 1.6 | REACTOME ABCA TRANSPORTERS IN LIPID HOMEOSTASIS | Genes involved in ABCA transporters in lipid homeostasis |
| 0.1 | 0.1 | REACTOME PRE NOTCH EXPRESSION AND PROCESSING | Genes involved in Pre-NOTCH Expression and Processing |
| 0.1 | 0.1 | REACTOME RESOLUTION OF AP SITES VIA THE SINGLE NUCLEOTIDE REPLACEMENT PATHWAY | Genes involved in Resolution of AP sites via the single-nucleotide replacement pathway |
| 0.0 | 4.0 | REACTOME OLFACTORY SIGNALING PATHWAY | Genes involved in Olfactory Signaling Pathway |
| 0.0 | 0.3 | REACTOME ACTIVATION OF NF KAPPAB IN B CELLS | Genes involved in Activation of NF-kappaB in B Cells |
| 0.0 | 0.1 | REACTOME SIGNALING BY ERBB2 | Genes involved in Signaling by ERBB2 |
| 0.0 | 0.6 | REACTOME RNA POL II TRANSCRIPTION PRE INITIATION AND PROMOTER OPENING | Genes involved in RNA Polymerase II Transcription Pre-Initiation And Promoter Opening |