Project
GNF SymAtlas + NCI-60 cancer cell lines, human (Su, 2004; Ross, 2000)
Navigation
Downloads
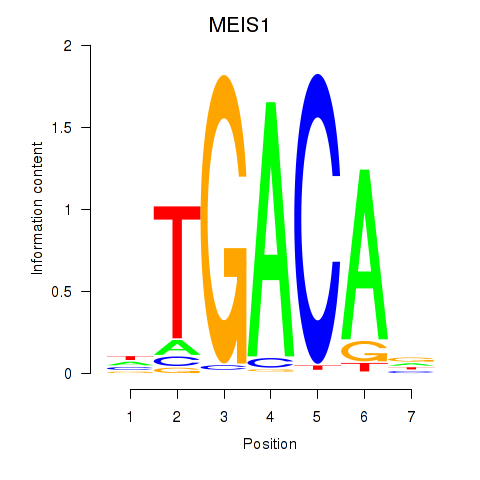
Results for MEIS1
Z-value: 1.18
Motif logo
Transcription factors associated with MEIS1
| Gene Symbol | Gene ID | Gene Info |
|---|---|---|
|
MEIS1
|
ENSG00000143995.20 | MEIS1 |
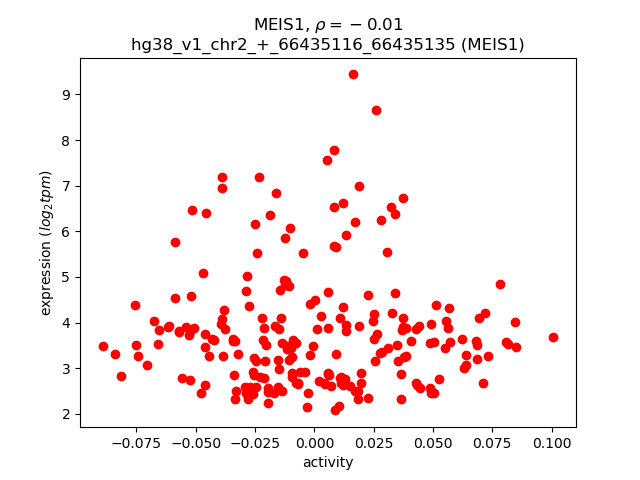
Activity-expression correlation:
| Gene | Promoter | Pearson corr. coef. | P-value | Plot |
|---|---|---|---|---|
| MEIS1 | hg38_v1_chr2_+_66435116_66435135, hg38_v1_chr2_+_66435558_66435686, hg38_v1_chr2_+_66439294_66439330 | -0.01 | 9.0e-01 | Click! |
Activity profile of MEIS1 motif
Sorted Z-values of MEIS1 motif
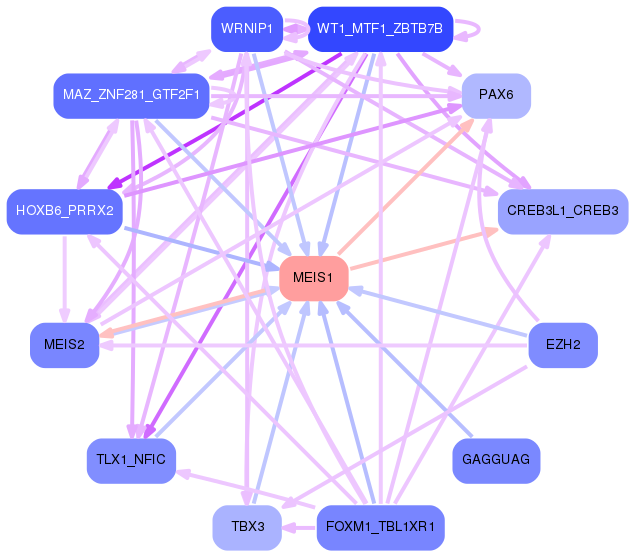
Network of associatons between targets according to the STRING database.

First level regulatory network of MEIS1
Gene Ontology Analysis
Gene overrepresentation in biological process category:
| Log-likelihood per target | Total log-likelihood | Term | Description |
|---|---|---|---|
| 9.6 | 28.8 | GO:2000866 | positive regulation of estrogen secretion(GO:2000863) positive regulation of estradiol secretion(GO:2000866) |
| 5.8 | 17.5 | GO:0009996 | negative regulation of Wnt signaling pathway involved in heart development(GO:0003308) negative regulation of cell fate specification(GO:0009996) |
| 5.0 | 20.2 | GO:1905205 | positive regulation of connective tissue replacement(GO:1905205) |
| 4.2 | 12.5 | GO:0060221 | retinal rod cell differentiation(GO:0060221) positive regulation of skeletal muscle acetylcholine-gated channel clustering(GO:1904395) negative regulation of neuromuscular junction development(GO:1904397) |
| 3.5 | 31.6 | GO:0070315 | G1 to G0 transition involved in cell differentiation(GO:0070315) |
| 3.4 | 10.1 | GO:0098746 | fast, calcium ion-dependent exocytosis of neurotransmitter(GO:0098746) |
| 3.1 | 28.1 | GO:0045039 | protein import into mitochondrial inner membrane(GO:0045039) |
| 3.0 | 9.0 | GO:0060739 | mesenchymal-epithelial cell signaling involved in prostate gland development(GO:0060739) |
| 3.0 | 29.9 | GO:0036371 | protein localization to M-band(GO:0036309) protein localization to T-tubule(GO:0036371) |
| 2.6 | 7.9 | GO:1903937 | response to acrylamide(GO:1903937) |
| 2.6 | 44.5 | GO:0003322 | pancreatic A cell development(GO:0003322) |
| 2.6 | 10.3 | GO:2000035 | regulation of stem cell division(GO:2000035) |
| 2.4 | 9.7 | GO:0021514 | ventral spinal cord interneuron differentiation(GO:0021514) |
| 2.3 | 11.6 | GO:0003025 | regulation of systemic arterial blood pressure by baroreceptor feedback(GO:0003025) |
| 2.3 | 11.6 | GO:1902766 | skeletal muscle satellite cell migration(GO:1902766) |
| 2.3 | 6.9 | GO:0043311 | positive regulation of eosinophil degranulation(GO:0043311) positive regulation of eosinophil activation(GO:1902568) |
| 2.3 | 15.9 | GO:0048050 | post-embryonic eye morphogenesis(GO:0048050) |
| 2.2 | 17.5 | GO:0060373 | regulation of ventricular cardiac muscle cell membrane depolarization(GO:0060373) |
| 2.2 | 28.2 | GO:1900623 | regulation of monocyte aggregation(GO:1900623) positive regulation of monocyte aggregation(GO:1900625) |
| 2.2 | 12.9 | GO:0015853 | adenine transport(GO:0015853) |
| 2.1 | 6.2 | GO:0046586 | regulation of calcium-dependent cell-cell adhesion(GO:0046586) |
| 2.0 | 8.1 | GO:0018032 | peptide amidation(GO:0001519) protein amidation(GO:0018032) peptide modification(GO:0031179) |
| 1.9 | 5.6 | GO:0019287 | isopentenyl diphosphate biosynthetic process, mevalonate pathway(GO:0019287) |
| 1.9 | 9.3 | GO:0006850 | mitochondrial pyruvate transport(GO:0006850) mitochondrial pyruvate transmembrane transport(GO:1902361) |
| 1.8 | 9.2 | GO:0001971 | negative regulation of activation of membrane attack complex(GO:0001971) |
| 1.8 | 12.8 | GO:2000324 | positive regulation of glucocorticoid receptor signaling pathway(GO:2000324) |
| 1.8 | 16.4 | GO:2000124 | regulation of endocannabinoid signaling pathway(GO:2000124) |
| 1.8 | 9.1 | GO:1904764 | negative regulation of fibril organization(GO:1902904) chaperone-mediated autophagy translocation complex disassembly(GO:1904764) |
| 1.8 | 5.3 | GO:0006781 | succinyl-CoA pathway(GO:0006781) |
| 1.7 | 6.9 | GO:1904980 | positive regulation of endosome organization(GO:1904980) |
| 1.7 | 5.2 | GO:0071206 | establishment of protein localization to juxtaparanode region of axon(GO:0071206) |
| 1.7 | 5.2 | GO:1901805 | beta-glucoside metabolic process(GO:1901804) beta-glucoside catabolic process(GO:1901805) positive regulation of neuronal action potential(GO:1904457) |
| 1.7 | 13.5 | GO:0061709 | reticulophagy(GO:0061709) |
| 1.7 | 8.3 | GO:0044533 | induction of programmed cell death(GO:0012502) positive regulation of apoptotic process in other organism(GO:0044533) positive regulation by symbiont of host programmed cell death(GO:0052042) positive regulation by organism of programmed cell death in other organism involved in symbiotic interaction(GO:0052330) positive regulation by organism of apoptotic process in other organism involved in symbiotic interaction(GO:0052501) |
| 1.5 | 7.6 | GO:0030070 | insulin processing(GO:0030070) |
| 1.4 | 7.1 | GO:0061732 | mitochondrial acetyl-CoA biosynthetic process from pyruvate(GO:0061732) |
| 1.4 | 23.8 | GO:0090360 | platelet-derived growth factor production(GO:0090360) regulation of platelet-derived growth factor production(GO:0090361) |
| 1.4 | 20.8 | GO:0034638 | phosphatidylcholine catabolic process(GO:0034638) |
| 1.4 | 5.5 | GO:0018106 | peptidyl-histidine phosphorylation(GO:0018106) |
| 1.4 | 4.1 | GO:1901624 | negative regulation of lymphocyte chemotaxis(GO:1901624) |
| 1.4 | 5.4 | GO:1904116 | response to vasopressin(GO:1904116) cellular response to vasopressin(GO:1904117) |
| 1.3 | 8.0 | GO:0051012 | microtubule sliding(GO:0051012) |
| 1.3 | 41.3 | GO:0015988 | energy coupled proton transmembrane transport, against electrochemical gradient(GO:0015988) ATP hydrolysis coupled proton transport(GO:0015991) |
| 1.3 | 4.0 | GO:0044376 | RNA polymerase II complex import to nucleus(GO:0044376) RNA polymerase III complex localization to nucleus(GO:1990022) |
| 1.3 | 19.8 | GO:0043562 | cellular response to nitrogen starvation(GO:0006995) cellular response to nitrogen levels(GO:0043562) |
| 1.3 | 9.2 | GO:0090204 | protein localization to nuclear pore(GO:0090204) |
| 1.3 | 33.3 | GO:0032802 | low-density lipoprotein particle receptor catabolic process(GO:0032802) |
| 1.3 | 3.8 | GO:1904387 | response to human chorionic gonadotropin(GO:0044752) cellular response to thyroxine stimulus(GO:0097069) cellular response to L-phenylalanine derivative(GO:1904387) |
| 1.3 | 17.6 | GO:0051964 | negative regulation of synapse assembly(GO:0051964) |
| 1.3 | 3.8 | GO:1900154 | positive regulation of transcription from RNA polymerase II promoter involved in myocardial precursor cell differentiation(GO:0003257) regulation of bone trabecula formation(GO:1900154) negative regulation of bone trabecula formation(GO:1900155) positive regulation of transcription from RNA polymerase II promoter involved in heart development(GO:1901228) |
| 1.2 | 18.6 | GO:0007258 | JUN phosphorylation(GO:0007258) |
| 1.2 | 3.7 | GO:1903778 | positive regulation of histamine secretion by mast cell(GO:1903595) protein localization to vacuolar membrane(GO:1903778) |
| 1.2 | 5.8 | GO:0006177 | GMP biosynthetic process(GO:0006177) |
| 1.2 | 4.7 | GO:2000639 | regulation of SREBP signaling pathway(GO:2000638) negative regulation of SREBP signaling pathway(GO:2000639) |
| 1.2 | 4.6 | GO:1900147 | Schwann cell migration(GO:0036135) regulation of Schwann cell migration(GO:1900147) |
| 1.2 | 8.1 | GO:0033353 | S-adenosylmethionine cycle(GO:0033353) |
| 1.1 | 3.4 | GO:1904247 | positive regulation of polynucleotide adenylyltransferase activity(GO:1904247) |
| 1.1 | 3.4 | GO:1902498 | regulation of protein autoubiquitination(GO:1902498) |
| 1.1 | 3.4 | GO:0098582 | innate vocalization behavior(GO:0098582) |
| 1.1 | 18.5 | GO:0007021 | tubulin complex assembly(GO:0007021) |
| 1.1 | 9.7 | GO:0070836 | caveola assembly(GO:0070836) |
| 1.1 | 9.5 | GO:1902902 | negative regulation of autophagosome assembly(GO:1902902) |
| 1.1 | 7.4 | GO:0008295 | spermidine biosynthetic process(GO:0008295) |
| 1.1 | 3.2 | GO:0050760 | negative regulation of thymidylate synthase biosynthetic process(GO:0050760) |
| 1.0 | 6.3 | GO:0043103 | hypoxanthine salvage(GO:0043103) |
| 1.0 | 1.0 | GO:0090149 | mitochondrial membrane fission(GO:0090149) |
| 1.0 | 3.1 | GO:0060559 | positive regulation of vitamin metabolic process(GO:0046136) positive regulation of vitamin D biosynthetic process(GO:0060557) positive regulation of calcidiol 1-monooxygenase activity(GO:0060559) |
| 1.0 | 7.2 | GO:0006990 | positive regulation of transcription from RNA polymerase II promoter involved in unfolded protein response(GO:0006990) |
| 1.0 | 4.1 | GO:1903758 | positive regulation of dendritic spine maintenance(GO:1902952) regulation of transcription from RNA polymerase II promoter by histone modification(GO:1903756) negative regulation of transcription from RNA polymerase II promoter by histone modification(GO:1903758) |
| 1.0 | 11.2 | GO:0097116 | gephyrin clustering involved in postsynaptic density assembly(GO:0097116) |
| 1.0 | 5.0 | GO:0003056 | regulation of vascular smooth muscle contraction(GO:0003056) negative regulation of vasoconstriction(GO:0045906) |
| 1.0 | 9.9 | GO:0071787 | endoplasmic reticulum tubular network assembly(GO:0071787) |
| 0.9 | 36.6 | GO:0048665 | neuron fate specification(GO:0048665) |
| 0.9 | 10.3 | GO:0050703 | interleukin-1 alpha secretion(GO:0050703) |
| 0.9 | 5.6 | GO:0032468 | Golgi calcium ion homeostasis(GO:0032468) |
| 0.9 | 2.8 | GO:1903567 | negative regulation of protein localization to cilium(GO:1903565) regulation of protein localization to ciliary membrane(GO:1903567) negative regulation of protein localization to ciliary membrane(GO:1903568) |
| 0.9 | 3.7 | GO:0071733 | transcriptional activation by promoter-enhancer looping(GO:0071733) gene looping(GO:0090202) dsDNA loop formation(GO:0090579) |
| 0.9 | 8.3 | GO:0060125 | negative regulation of growth hormone secretion(GO:0060125) |
| 0.9 | 3.7 | GO:0002188 | translation reinitiation(GO:0002188) |
| 0.9 | 3.6 | GO:0021691 | cerebellar Purkinje cell layer maturation(GO:0021691) |
| 0.9 | 7.0 | GO:0016128 | phytosteroid metabolic process(GO:0016128) phytosteroid biosynthetic process(GO:0016129) |
| 0.9 | 4.3 | GO:0035426 | extracellular matrix-cell signaling(GO:0035426) |
| 0.9 | 9.5 | GO:0042262 | DNA protection(GO:0042262) |
| 0.9 | 6.0 | GO:0048280 | vesicle fusion with Golgi apparatus(GO:0048280) |
| 0.8 | 2.5 | GO:0043490 | malate-aspartate shuttle(GO:0043490) |
| 0.8 | 8.4 | GO:0009449 | gamma-aminobutyric acid biosynthetic process(GO:0009449) |
| 0.8 | 5.8 | GO:2001205 | negative regulation of osteoclast development(GO:2001205) |
| 0.8 | 6.6 | GO:0009597 | detection of virus(GO:0009597) |
| 0.8 | 2.4 | GO:0038155 | interleukin-23-mediated signaling pathway(GO:0038155) |
| 0.8 | 7.1 | GO:0043402 | glucocorticoid mediated signaling pathway(GO:0043402) |
| 0.8 | 5.5 | GO:0031914 | negative regulation of synaptic plasticity(GO:0031914) |
| 0.8 | 2.3 | GO:0000965 | mitochondrial RNA 3'-end processing(GO:0000965) |
| 0.8 | 7.6 | GO:0043951 | negative regulation of cAMP-mediated signaling(GO:0043951) |
| 0.8 | 3.0 | GO:0044791 | modulation by host of viral release from host cell(GO:0044789) positive regulation by host of viral release from host cell(GO:0044791) |
| 0.7 | 6.7 | GO:0001915 | negative regulation of T cell mediated cytotoxicity(GO:0001915) |
| 0.7 | 3.7 | GO:0010513 | positive regulation of phosphatidylinositol biosynthetic process(GO:0010513) |
| 0.7 | 3.7 | GO:0061762 | CAMKK-AMPK signaling cascade(GO:0061762) |
| 0.7 | 1.4 | GO:0070256 | negative regulation of neurotrophin production(GO:0032900) negative regulation of circadian sleep/wake cycle, non-REM sleep(GO:0042323) negative regulation of mucus secretion(GO:0070256) |
| 0.7 | 2.1 | GO:1903644 | regulation of chaperone-mediated protein folding(GO:1903644) |
| 0.7 | 6.3 | GO:0030951 | establishment or maintenance of microtubule cytoskeleton polarity(GO:0030951) |
| 0.7 | 2.8 | GO:0048205 | COPI-coated vesicle budding(GO:0035964) Golgi transport vesicle coating(GO:0048200) COPI coating of Golgi vesicle(GO:0048205) |
| 0.7 | 14.2 | GO:0048268 | clathrin coat assembly(GO:0048268) |
| 0.7 | 4.0 | GO:0032487 | regulation of Rap protein signal transduction(GO:0032487) |
| 0.7 | 2.6 | GO:0045218 | zonula adherens maintenance(GO:0045218) |
| 0.6 | 2.5 | GO:0009224 | CMP salvage(GO:0006238) CMP biosynthetic process(GO:0009224) CMP metabolic process(GO:0046035) |
| 0.6 | 5.0 | GO:0035694 | mitochondrial protein catabolic process(GO:0035694) |
| 0.6 | 5.6 | GO:2000580 | regulation of ATP-dependent microtubule motor activity, plus-end-directed(GO:2000580) positive regulation of ATP-dependent microtubule motor activity, plus-end-directed(GO:2000582) |
| 0.6 | 3.6 | GO:0010732 | protein glutathionylation(GO:0010731) regulation of protein glutathionylation(GO:0010732) negative regulation of protein glutathionylation(GO:0010734) |
| 0.6 | 9.1 | GO:0098870 | neuronal action potential propagation(GO:0019227) action potential propagation(GO:0098870) |
| 0.6 | 4.7 | GO:0090160 | Golgi to lysosome transport(GO:0090160) |
| 0.6 | 4.7 | GO:0015014 | heparan sulfate proteoglycan biosynthetic process, polysaccharide chain biosynthetic process(GO:0015014) |
| 0.6 | 3.5 | GO:0070101 | epithelial cell differentiation involved in mammary gland alveolus development(GO:0061030) positive regulation of chemokine-mediated signaling pathway(GO:0070101) |
| 0.6 | 1.1 | GO:0060120 | auditory receptor cell fate commitment(GO:0009912) inner ear receptor cell fate commitment(GO:0060120) |
| 0.6 | 5.1 | GO:0034551 | respiratory chain complex III assembly(GO:0017062) mitochondrial respiratory chain complex III assembly(GO:0034551) |
| 0.6 | 4.5 | GO:0021902 | commitment of neuronal cell to specific neuron type in forebrain(GO:0021902) |
| 0.6 | 4.5 | GO:0002191 | cap-dependent translational initiation(GO:0002191) |
| 0.5 | 1.1 | GO:1901420 | negative regulation of response to alcohol(GO:1901420) |
| 0.5 | 3.2 | GO:0035726 | common myeloid progenitor cell proliferation(GO:0035726) |
| 0.5 | 3.7 | GO:0000720 | pyrimidine dimer repair by nucleotide-excision repair(GO:0000720) positive regulation of t-circle formation(GO:1904431) |
| 0.5 | 4.3 | GO:0030091 | protein repair(GO:0030091) |
| 0.5 | 1.6 | GO:0060392 | negative regulation of SMAD protein import into nucleus(GO:0060392) |
| 0.5 | 14.3 | GO:0032012 | regulation of ARF protein signal transduction(GO:0032012) |
| 0.5 | 2.6 | GO:0090206 | negative regulation of cholesterol biosynthetic process(GO:0045541) negative regulation of cholesterol metabolic process(GO:0090206) |
| 0.5 | 2.1 | GO:1903385 | regulation of homophilic cell adhesion(GO:1903385) |
| 0.5 | 1.6 | GO:2000562 | negative regulation of CD4-positive, alpha-beta T cell proliferation(GO:2000562) |
| 0.5 | 12.5 | GO:0070262 | peptidyl-serine dephosphorylation(GO:0070262) |
| 0.5 | 2.1 | GO:0035610 | protein side chain deglutamylation(GO:0035610) |
| 0.5 | 6.1 | GO:1904322 | response to forskolin(GO:1904321) cellular response to forskolin(GO:1904322) |
| 0.5 | 4.6 | GO:1902455 | negative regulation of stem cell population maintenance(GO:1902455) |
| 0.5 | 11.4 | GO:0090190 | positive regulation of branching involved in ureteric bud morphogenesis(GO:0090190) |
| 0.5 | 1.0 | GO:2001202 | negative regulation of transforming growth factor-beta secretion(GO:2001202) |
| 0.5 | 3.5 | GO:0071475 | cellular hyperosmotic salinity response(GO:0071475) |
| 0.5 | 1.5 | GO:0006106 | fumarate metabolic process(GO:0006106) |
| 0.5 | 5.3 | GO:1902746 | regulation of lens fiber cell differentiation(GO:1902746) |
| 0.5 | 2.9 | GO:0061767 | negative regulation of lung blood pressure(GO:0061767) |
| 0.5 | 3.8 | GO:0016191 | synaptic vesicle uncoating(GO:0016191) |
| 0.5 | 8.9 | GO:0006782 | protoporphyrinogen IX biosynthetic process(GO:0006782) |
| 0.5 | 3.7 | GO:0033211 | adiponectin-activated signaling pathway(GO:0033211) |
| 0.5 | 30.3 | GO:0006120 | mitochondrial electron transport, NADH to ubiquinone(GO:0006120) |
| 0.5 | 5.5 | GO:0016081 | synaptic vesicle docking(GO:0016081) |
| 0.5 | 14.6 | GO:0060261 | positive regulation of transcription initiation from RNA polymerase II promoter(GO:0060261) |
| 0.5 | 1.8 | GO:0035965 | cardiolipin acyl-chain remodeling(GO:0035965) |
| 0.5 | 2.3 | GO:0014005 | microglia differentiation(GO:0014004) microglia development(GO:0014005) |
| 0.4 | 1.8 | GO:0098923 | positive regulation of circadian sleep/wake cycle, wakefulness(GO:0010841) NMDA glutamate receptor clustering(GO:0097114) retrograde trans-synaptic signaling by soluble gas(GO:0098923) trans-synaptic signaling by soluble gas(GO:0099543) positive regulation of synaptic vesicle exocytosis(GO:2000302) |
| 0.4 | 1.3 | GO:1903336 | negative regulation of vacuolar transport(GO:1903336) |
| 0.4 | 6.7 | GO:1900119 | positive regulation of execution phase of apoptosis(GO:1900119) |
| 0.4 | 1.3 | GO:0001545 | primary ovarian follicle growth(GO:0001545) |
| 0.4 | 1.8 | GO:1902463 | protein localization to cell leading edge(GO:1902463) |
| 0.4 | 3.1 | GO:0019800 | peptide cross-linking via chondroitin 4-sulfate glycosaminoglycan(GO:0019800) |
| 0.4 | 4.8 | GO:0042407 | cristae formation(GO:0042407) |
| 0.4 | 3.8 | GO:0042118 | endothelial cell activation(GO:0042118) |
| 0.4 | 3.4 | GO:1904781 | positive regulation of protein localization to centrosome(GO:1904781) |
| 0.4 | 1.7 | GO:0030952 | establishment or maintenance of cytoskeleton polarity(GO:0030952) |
| 0.4 | 13.4 | GO:0006099 | tricarboxylic acid cycle(GO:0006099) |
| 0.4 | 1.2 | GO:0051835 | positive regulation of synapse structural plasticity(GO:0051835) |
| 0.4 | 5.9 | GO:0051823 | regulation of synapse structural plasticity(GO:0051823) |
| 0.4 | 1.2 | GO:0045212 | negative regulation of synaptic transmission, cholinergic(GO:0032223) neurotransmitter receptor biosynthetic process(GO:0045212) |
| 0.4 | 3.9 | GO:0045542 | positive regulation of cholesterol biosynthetic process(GO:0045542) |
| 0.4 | 2.7 | GO:2000230 | negative regulation of pancreatic stellate cell proliferation(GO:2000230) |
| 0.4 | 5.8 | GO:0010839 | negative regulation of keratinocyte proliferation(GO:0010839) |
| 0.4 | 3.7 | GO:2000270 | negative regulation of fibroblast apoptotic process(GO:2000270) |
| 0.4 | 1.5 | GO:0034773 | histone H4-K20 trimethylation(GO:0034773) |
| 0.4 | 32.2 | GO:0006521 | regulation of cellular amino acid metabolic process(GO:0006521) |
| 0.4 | 1.1 | GO:0051821 | negative regulation of transcription from RNA polymerase II promoter in response to UV-induced DNA damage(GO:0010768) transmission of virus(GO:0019089) dissemination or transmission of symbiont from host(GO:0044007) development involved in symbiotic interaction(GO:0044111) dissemination or transmission of organism from other organism involved in symbiotic interaction(GO:0051821) |
| 0.4 | 8.9 | GO:0010592 | positive regulation of lamellipodium assembly(GO:0010592) |
| 0.3 | 1.4 | GO:0090076 | relaxation of skeletal muscle(GO:0090076) |
| 0.3 | 1.4 | GO:0032252 | secretory granule localization(GO:0032252) |
| 0.3 | 3.7 | GO:2001288 | positive regulation of caveolin-mediated endocytosis(GO:2001288) |
| 0.3 | 2.0 | GO:0030579 | ubiquitin-dependent SMAD protein catabolic process(GO:0030579) |
| 0.3 | 1.0 | GO:0007538 | primary sex determination(GO:0007538) |
| 0.3 | 3.9 | GO:0071550 | death-inducing signaling complex assembly(GO:0071550) |
| 0.3 | 6.8 | GO:0006144 | purine nucleobase metabolic process(GO:0006144) |
| 0.3 | 1.3 | GO:0032377 | regulation of intracellular lipid transport(GO:0032377) regulation of intracellular sterol transport(GO:0032380) regulation of intracellular cholesterol transport(GO:0032383) |
| 0.3 | 1.3 | GO:0050915 | sensory perception of sour taste(GO:0050915) |
| 0.3 | 1.9 | GO:0072367 | regulation of lipid transport by regulation of transcription from RNA polymerase II promoter(GO:0072367) |
| 0.3 | 3.4 | GO:0021730 | trigeminal sensory nucleus development(GO:0021730) principal sensory nucleus of trigeminal nerve development(GO:0021740) negative regulation of epithelial cell proliferation involved in lung morphogenesis(GO:2000795) |
| 0.3 | 8.1 | GO:0035774 | positive regulation of insulin secretion involved in cellular response to glucose stimulus(GO:0035774) |
| 0.3 | 3.7 | GO:0007175 | negative regulation of epidermal growth factor-activated receptor activity(GO:0007175) |
| 0.3 | 0.9 | GO:1903028 | positive regulation of opsonization(GO:1903028) |
| 0.3 | 9.5 | GO:0006607 | NLS-bearing protein import into nucleus(GO:0006607) |
| 0.3 | 4.8 | GO:0045116 | protein neddylation(GO:0045116) |
| 0.3 | 1.2 | GO:0021957 | corticospinal tract morphogenesis(GO:0021957) |
| 0.3 | 3.0 | GO:0051601 | exocyst localization(GO:0051601) |
| 0.3 | 2.1 | GO:0045741 | positive regulation of epidermal growth factor-activated receptor activity(GO:0045741) |
| 0.3 | 1.5 | GO:0015692 | lead ion transport(GO:0015692) |
| 0.3 | 2.1 | GO:1904798 | regulation of core promoter binding(GO:1904796) positive regulation of core promoter binding(GO:1904798) |
| 0.3 | 2.0 | GO:0051388 | positive regulation of neurotrophin TRK receptor signaling pathway(GO:0051388) |
| 0.3 | 1.4 | GO:1903027 | regulation of opsonization(GO:1903027) |
| 0.3 | 2.0 | GO:0036438 | maintenance of lens transparency(GO:0036438) |
| 0.3 | 1.1 | GO:1903788 | mycotoxin catabolic process(GO:0043387) aflatoxin catabolic process(GO:0046223) organic heteropentacyclic compound catabolic process(GO:1901377) regulation of glutathione biosynthetic process(GO:1903786) positive regulation of glutathione biosynthetic process(GO:1903788) |
| 0.3 | 4.5 | GO:0007253 | cytoplasmic sequestering of NF-kappaB(GO:0007253) |
| 0.3 | 2.0 | GO:0051490 | negative regulation of filopodium assembly(GO:0051490) |
| 0.3 | 2.2 | GO:0045176 | apical protein localization(GO:0045176) |
| 0.3 | 6.7 | GO:0030208 | dermatan sulfate biosynthetic process(GO:0030208) |
| 0.3 | 0.8 | GO:0045918 | negative regulation of cytolysis(GO:0045918) |
| 0.3 | 2.4 | GO:0046940 | nucleoside monophosphate phosphorylation(GO:0046940) |
| 0.3 | 10.3 | GO:0042417 | dopamine metabolic process(GO:0042417) |
| 0.3 | 5.0 | GO:0071294 | cellular response to zinc ion(GO:0071294) |
| 0.3 | 2.9 | GO:0051531 | NFAT protein import into nucleus(GO:0051531) |
| 0.3 | 1.8 | GO:0006499 | N-terminal protein myristoylation(GO:0006499) |
| 0.3 | 4.4 | GO:0033148 | positive regulation of intracellular estrogen receptor signaling pathway(GO:0033148) |
| 0.3 | 0.8 | GO:0014736 | negative regulation of muscle atrophy(GO:0014736) response to injury involved in regulation of muscle adaptation(GO:0014876) |
| 0.3 | 1.5 | GO:0051005 | negative regulation of lipoprotein lipase activity(GO:0051005) |
| 0.3 | 2.3 | GO:0061343 | cell adhesion involved in heart morphogenesis(GO:0061343) |
| 0.2 | 10.3 | GO:0006699 | bile acid biosynthetic process(GO:0006699) |
| 0.2 | 0.2 | GO:0009441 | glycolate metabolic process(GO:0009441) |
| 0.2 | 1.0 | GO:0046485 | ether lipid metabolic process(GO:0046485) |
| 0.2 | 2.4 | GO:0008090 | retrograde axonal transport(GO:0008090) |
| 0.2 | 2.6 | GO:0021860 | pyramidal neuron differentiation(GO:0021859) pyramidal neuron development(GO:0021860) |
| 0.2 | 2.4 | GO:1903003 | positive regulation of protein deubiquitination(GO:1903003) |
| 0.2 | 1.8 | GO:0048262 | determination of dorsal/ventral asymmetry(GO:0048262) |
| 0.2 | 6.6 | GO:0008045 | motor neuron axon guidance(GO:0008045) |
| 0.2 | 2.9 | GO:0060837 | blood vessel endothelial cell differentiation(GO:0060837) arterial endothelial cell differentiation(GO:0060842) |
| 0.2 | 5.3 | GO:1903861 | positive regulation of dendrite extension(GO:1903861) |
| 0.2 | 1.8 | GO:0001887 | selenium compound metabolic process(GO:0001887) |
| 0.2 | 1.3 | GO:0015986 | energy coupled proton transport, down electrochemical gradient(GO:0015985) ATP synthesis coupled proton transport(GO:0015986) |
| 0.2 | 1.3 | GO:0071105 | response to interleukin-11(GO:0071105) |
| 0.2 | 6.8 | GO:0008038 | neuron recognition(GO:0008038) |
| 0.2 | 4.1 | GO:0010971 | positive regulation of G2/M transition of mitotic cell cycle(GO:0010971) |
| 0.2 | 1.2 | GO:0006348 | chromatin silencing at telomere(GO:0006348) |
| 0.2 | 0.8 | GO:0035803 | egg coat formation(GO:0035803) |
| 0.2 | 1.6 | GO:0016557 | peroxisome membrane biogenesis(GO:0016557) |
| 0.2 | 1.2 | GO:0010032 | meiotic chromosome condensation(GO:0010032) |
| 0.2 | 1.6 | GO:0045329 | carnitine biosynthetic process(GO:0045329) |
| 0.2 | 2.2 | GO:0070307 | lens fiber cell development(GO:0070307) |
| 0.2 | 4.9 | GO:0021846 | cell proliferation in forebrain(GO:0021846) |
| 0.2 | 15.1 | GO:0051965 | positive regulation of synapse assembly(GO:0051965) |
| 0.2 | 0.8 | GO:1904428 | negative regulation of tubulin deacetylation(GO:1904428) |
| 0.2 | 0.4 | GO:0010454 | negative regulation of cell fate commitment(GO:0010454) |
| 0.2 | 5.3 | GO:0007095 | mitotic G2 DNA damage checkpoint(GO:0007095) |
| 0.2 | 2.4 | GO:2000059 | negative regulation of protein ubiquitination involved in ubiquitin-dependent protein catabolic process(GO:2000059) |
| 0.2 | 2.7 | GO:0000338 | protein deneddylation(GO:0000338) |
| 0.2 | 5.1 | GO:0042730 | fibrinolysis(GO:0042730) |
| 0.2 | 0.4 | GO:1900454 | positive regulation of norepinephrine secretion(GO:0010701) positive regulation of long term synaptic depression(GO:1900454) |
| 0.2 | 3.9 | GO:0006465 | signal peptide processing(GO:0006465) |
| 0.2 | 0.7 | GO:0003199 | endocardial cushion to mesenchymal transition involved in heart valve formation(GO:0003199) |
| 0.2 | 1.1 | GO:0017055 | negative regulation of RNA polymerase II transcriptional preinitiation complex assembly(GO:0017055) |
| 0.2 | 2.5 | GO:0003334 | keratinocyte development(GO:0003334) |
| 0.2 | 0.7 | GO:0006808 | regulation of nitrogen utilization(GO:0006808) nitrogen utilization(GO:0019740) negative regulation of cellular pH reduction(GO:0032848) CD8-positive, alpha-beta T cell lineage commitment(GO:0043375) negative regulation of retinal cell programmed cell death(GO:0046671) |
| 0.2 | 1.2 | GO:0014877 | response to muscle inactivity involved in regulation of muscle adaptation(GO:0014877) response to denervation involved in regulation of muscle adaptation(GO:0014894) |
| 0.2 | 6.0 | GO:1900449 | regulation of glutamate receptor signaling pathway(GO:1900449) |
| 0.2 | 16.8 | GO:0007368 | determination of left/right symmetry(GO:0007368) |
| 0.2 | 3.9 | GO:0048791 | calcium ion-regulated exocytosis of neurotransmitter(GO:0048791) |
| 0.2 | 0.8 | GO:0006574 | valine catabolic process(GO:0006574) |
| 0.2 | 1.9 | GO:0089711 | L-glutamate transmembrane transport(GO:0089711) |
| 0.2 | 0.6 | GO:2000786 | positive regulation of autophagosome assembly(GO:2000786) |
| 0.2 | 1.7 | GO:0060670 | branching involved in labyrinthine layer morphogenesis(GO:0060670) |
| 0.2 | 6.6 | GO:0007190 | activation of adenylate cyclase activity(GO:0007190) |
| 0.2 | 3.6 | GO:0072662 | protein targeting to peroxisome(GO:0006625) protein localization to peroxisome(GO:0072662) establishment of protein localization to peroxisome(GO:0072663) |
| 0.2 | 1.5 | GO:0033683 | nucleotide-excision repair, DNA incision(GO:0033683) |
| 0.2 | 7.4 | GO:0048278 | vesicle docking(GO:0048278) |
| 0.1 | 11.3 | GO:0070125 | mitochondrial translational elongation(GO:0070125) |
| 0.1 | 7.7 | GO:0007632 | visual behavior(GO:0007632) |
| 0.1 | 1.4 | GO:0000463 | maturation of LSU-rRNA from tricistronic rRNA transcript (SSU-rRNA, 5.8S rRNA, LSU-rRNA)(GO:0000463) |
| 0.1 | 1.4 | GO:0043457 | regulation of cellular respiration(GO:0043457) |
| 0.1 | 3.5 | GO:0000185 | activation of MAPKKK activity(GO:0000185) |
| 0.1 | 1.2 | GO:0060056 | mammary gland involution(GO:0060056) |
| 0.1 | 0.8 | GO:0016255 | attachment of GPI anchor to protein(GO:0016255) |
| 0.1 | 1.4 | GO:0042226 | interleukin-6 biosynthetic process(GO:0042226) |
| 0.1 | 4.5 | GO:0061178 | regulation of insulin secretion involved in cellular response to glucose stimulus(GO:0061178) |
| 0.1 | 2.4 | GO:0006895 | Golgi to endosome transport(GO:0006895) |
| 0.1 | 2.7 | GO:0019511 | peptidyl-proline hydroxylation(GO:0019511) |
| 0.1 | 20.1 | GO:0007156 | homophilic cell adhesion via plasma membrane adhesion molecules(GO:0007156) |
| 0.1 | 2.1 | GO:1902083 | negative regulation of peptidyl-cysteine S-nitrosylation(GO:1902083) |
| 0.1 | 3.6 | GO:0031581 | hemidesmosome assembly(GO:0031581) |
| 0.1 | 0.6 | GO:0051725 | protein de-ADP-ribosylation(GO:0051725) |
| 0.1 | 3.1 | GO:0009060 | aerobic respiration(GO:0009060) |
| 0.1 | 5.6 | GO:0070979 | protein K11-linked ubiquitination(GO:0070979) |
| 0.1 | 4.6 | GO:0045104 | intermediate filament cytoskeleton organization(GO:0045104) |
| 0.1 | 2.3 | GO:0061003 | positive regulation of dendritic spine morphogenesis(GO:0061003) |
| 0.1 | 2.6 | GO:0015937 | coenzyme A biosynthetic process(GO:0015937) |
| 0.1 | 2.6 | GO:0001919 | regulation of receptor recycling(GO:0001919) |
| 0.1 | 0.9 | GO:0019367 | fatty acid elongation, saturated fatty acid(GO:0019367) fatty acid elongation, unsaturated fatty acid(GO:0019368) fatty acid elongation, monounsaturated fatty acid(GO:0034625) fatty acid elongation, polyunsaturated fatty acid(GO:0034626) |
| 0.1 | 2.6 | GO:2000675 | negative regulation of type B pancreatic cell apoptotic process(GO:2000675) |
| 0.1 | 0.3 | GO:0042357 | thiamine diphosphate metabolic process(GO:0042357) |
| 0.1 | 0.7 | GO:0032483 | regulation of Rab protein signal transduction(GO:0032483) |
| 0.1 | 7.2 | GO:0006892 | post-Golgi vesicle-mediated transport(GO:0006892) |
| 0.1 | 8.0 | GO:0000381 | regulation of alternative mRNA splicing, via spliceosome(GO:0000381) |
| 0.1 | 5.9 | GO:0018208 | peptidyl-proline modification(GO:0018208) |
| 0.1 | 5.3 | GO:1902600 | hydrogen ion transmembrane transport(GO:1902600) |
| 0.1 | 5.0 | GO:0072583 | clathrin-mediated endocytosis(GO:0072583) |
| 0.1 | 5.4 | GO:0000281 | mitotic cytokinesis(GO:0000281) |
| 0.1 | 3.3 | GO:0006622 | protein targeting to lysosome(GO:0006622) |
| 0.1 | 0.8 | GO:0071286 | cellular response to magnesium ion(GO:0071286) |
| 0.1 | 0.5 | GO:0090080 | positive regulation of MAPKKK cascade by fibroblast growth factor receptor signaling pathway(GO:0090080) |
| 0.1 | 3.6 | GO:0050435 | beta-amyloid metabolic process(GO:0050435) |
| 0.1 | 7.6 | GO:0042273 | ribosomal large subunit biogenesis(GO:0042273) |
| 0.1 | 0.7 | GO:0048243 | norepinephrine secretion(GO:0048243) |
| 0.1 | 0.5 | GO:0031119 | tRNA pseudouridine synthesis(GO:0031119) |
| 0.1 | 0.7 | GO:0006621 | protein retention in ER lumen(GO:0006621) |
| 0.1 | 0.4 | GO:0050747 | positive regulation of lipoprotein metabolic process(GO:0050747) |
| 0.1 | 0.5 | GO:0034498 | early endosome to Golgi transport(GO:0034498) |
| 0.1 | 1.7 | GO:0042753 | positive regulation of circadian rhythm(GO:0042753) |
| 0.1 | 1.3 | GO:0021542 | dentate gyrus development(GO:0021542) |
| 0.1 | 0.8 | GO:0044341 | sodium-dependent phosphate transport(GO:0044341) |
| 0.1 | 0.1 | GO:0032048 | cardiolipin metabolic process(GO:0032048) |
| 0.1 | 2.2 | GO:0060612 | adipose tissue development(GO:0060612) |
| 0.1 | 4.5 | GO:0030516 | regulation of axon extension(GO:0030516) |
| 0.1 | 0.8 | GO:0071313 | cellular response to caffeine(GO:0071313) |
| 0.1 | 0.2 | GO:1903031 | regulation of microtubule plus-end binding(GO:1903031) positive regulation of microtubule plus-end binding(GO:1903033) |
| 0.1 | 1.2 | GO:0007077 | mitotic nuclear envelope disassembly(GO:0007077) |
| 0.1 | 3.7 | GO:0007032 | endosome organization(GO:0007032) |
| 0.1 | 0.3 | GO:0051013 | microtubule severing(GO:0051013) |
| 0.1 | 1.1 | GO:0048025 | negative regulation of mRNA splicing, via spliceosome(GO:0048025) |
| 0.1 | 12.8 | GO:0006888 | ER to Golgi vesicle-mediated transport(GO:0006888) |
| 0.1 | 2.8 | GO:0010972 | negative regulation of G2/M transition of mitotic cell cycle(GO:0010972) |
| 0.1 | 0.3 | GO:1990502 | dense core granule maturation(GO:1990502) |
| 0.1 | 1.1 | GO:0031163 | iron-sulfur cluster assembly(GO:0016226) metallo-sulfur cluster assembly(GO:0031163) |
| 0.1 | 2.8 | GO:0070884 | regulation of calcineurin-NFAT signaling cascade(GO:0070884) |
| 0.1 | 0.1 | GO:0033512 | L-lysine catabolic process to acetyl-CoA via saccharopine(GO:0033512) |
| 0.1 | 2.7 | GO:0046839 | phospholipid dephosphorylation(GO:0046839) |
| 0.1 | 0.6 | GO:0031087 | deadenylation-independent decapping of nuclear-transcribed mRNA(GO:0031087) |
| 0.1 | 0.7 | GO:0008627 | intrinsic apoptotic signaling pathway in response to osmotic stress(GO:0008627) |
| 0.1 | 1.7 | GO:0050819 | negative regulation of coagulation(GO:0050819) |
| 0.1 | 2.6 | GO:0006458 | 'de novo' protein folding(GO:0006458) |
| 0.1 | 2.6 | GO:0051865 | protein autoubiquitination(GO:0051865) |
| 0.1 | 0.4 | GO:0042791 | 5S class rRNA transcription from RNA polymerase III type 1 promoter(GO:0042791) tRNA transcription from RNA polymerase III promoter(GO:0042797) |
| 0.1 | 1.3 | GO:0051894 | positive regulation of focal adhesion assembly(GO:0051894) |
| 0.1 | 1.0 | GO:0042276 | error-prone translesion synthesis(GO:0042276) |
| 0.1 | 0.5 | GO:0051451 | myoblast migration(GO:0051451) |
| 0.1 | 1.9 | GO:0001958 | endochondral ossification(GO:0001958) replacement ossification(GO:0036075) |
| 0.0 | 1.8 | GO:0043928 | exonucleolytic nuclear-transcribed mRNA catabolic process involved in deadenylation-dependent decay(GO:0043928) |
| 0.0 | 0.6 | GO:0007252 | I-kappaB phosphorylation(GO:0007252) |
| 0.0 | 1.4 | GO:0048024 | regulation of mRNA splicing, via spliceosome(GO:0048024) |
| 0.0 | 1.0 | GO:0042769 | DNA damage response, detection of DNA damage(GO:0042769) |
| 0.0 | 0.4 | GO:0036010 | protein localization to endosome(GO:0036010) |
| 0.0 | 1.0 | GO:0006700 | C21-steroid hormone biosynthetic process(GO:0006700) |
| 0.0 | 0.7 | GO:0006012 | galactose metabolic process(GO:0006012) |
| 0.0 | 0.6 | GO:0030150 | protein import into mitochondrial matrix(GO:0030150) |
| 0.0 | 2.0 | GO:0046847 | filopodium assembly(GO:0046847) |
| 0.0 | 0.2 | GO:0010571 | positive regulation of nuclear cell cycle DNA replication(GO:0010571) |
| 0.0 | 6.8 | GO:0000086 | G2/M transition of mitotic cell cycle(GO:0000086) |
| 0.0 | 3.9 | GO:0034605 | cellular response to heat(GO:0034605) |
| 0.0 | 0.1 | GO:0032930 | positive regulation of superoxide anion generation(GO:0032930) |
| 0.0 | 2.7 | GO:0006672 | ceramide metabolic process(GO:0006672) |
| 0.0 | 0.6 | GO:0051016 | barbed-end actin filament capping(GO:0051016) |
| 0.0 | 0.1 | GO:1901910 | diadenosine polyphosphate metabolic process(GO:0015959) diadenosine polyphosphate catabolic process(GO:0015961) diphosphoinositol polyphosphate metabolic process(GO:0071543) diadenosine pentaphosphate metabolic process(GO:1901906) diadenosine pentaphosphate catabolic process(GO:1901907) diadenosine hexaphosphate metabolic process(GO:1901908) diadenosine hexaphosphate catabolic process(GO:1901909) adenosine 5'-(hexahydrogen pentaphosphate) metabolic process(GO:1901910) adenosine 5'-(hexahydrogen pentaphosphate) catabolic process(GO:1901911) |
| 0.0 | 8.3 | GO:0000398 | RNA splicing, via transesterification reactions with bulged adenosine as nucleophile(GO:0000377) mRNA splicing, via spliceosome(GO:0000398) |
| 0.0 | 0.9 | GO:0030032 | lamellipodium assembly(GO:0030032) |
| 0.0 | 1.2 | GO:0034446 | substrate adhesion-dependent cell spreading(GO:0034446) |
| 0.0 | 2.2 | GO:0046854 | phosphatidylinositol phosphorylation(GO:0046854) |
| 0.0 | 2.1 | GO:0030705 | cytoskeleton-dependent intracellular transport(GO:0030705) |
| 0.0 | 0.2 | GO:1902236 | negative regulation of endoplasmic reticulum stress-induced intrinsic apoptotic signaling pathway(GO:1902236) |
| 0.0 | 0.1 | GO:0043568 | positive regulation of insulin-like growth factor receptor signaling pathway(GO:0043568) |
| 0.0 | 0.8 | GO:0000188 | inactivation of MAPK activity(GO:0000188) |
| 0.0 | 0.2 | GO:0071799 | response to prostaglandin D(GO:0071798) cellular response to prostaglandin D stimulus(GO:0071799) |
| 0.0 | 0.7 | GO:0010738 | regulation of protein kinase A signaling(GO:0010738) |
| 0.0 | 2.0 | GO:0006261 | DNA-dependent DNA replication(GO:0006261) |
| 0.0 | 0.7 | GO:0008543 | fibroblast growth factor receptor signaling pathway(GO:0008543) |
| 0.0 | 0.2 | GO:0032515 | negative regulation of phosphoprotein phosphatase activity(GO:0032515) |
| 0.0 | 0.2 | GO:0016048 | detection of temperature stimulus(GO:0016048) |
| 0.0 | 3.7 | GO:0007266 | Rho protein signal transduction(GO:0007266) |
| 0.0 | 1.3 | GO:0032392 | DNA geometric change(GO:0032392) |
| 0.0 | 0.6 | GO:0072337 | modified amino acid transport(GO:0072337) |
| 0.0 | 1.0 | GO:0050806 | positive regulation of synaptic transmission(GO:0050806) |
| 0.0 | 2.5 | GO:0031032 | actomyosin structure organization(GO:0031032) |
| 0.0 | 0.9 | GO:0036498 | IRE1-mediated unfolded protein response(GO:0036498) |
| 0.0 | 1.2 | GO:0043488 | regulation of mRNA stability(GO:0043488) |
| 0.0 | 0.0 | GO:0090647 | modulation of age-related behavioral decline(GO:0090647) |
Gene overrepresentation in cellular component category:
| Log-likelihood per target | Total log-likelihood | Term | Description |
|---|---|---|---|
| 4.7 | 18.9 | GO:0000221 | vacuolar proton-transporting V-type ATPase, V1 domain(GO:0000221) |
| 4.7 | 28.1 | GO:0042721 | mitochondrial inner membrane protein insertion complex(GO:0042721) |
| 3.0 | 32.8 | GO:0035692 | macrophage migration inhibitory factor receptor complex(GO:0035692) |
| 3.0 | 8.9 | GO:0036195 | muscle cell projection(GO:0036194) muscle cell projection membrane(GO:0036195) |
| 2.4 | 26.9 | GO:0005955 | calcineurin complex(GO:0005955) |
| 2.1 | 6.2 | GO:0016939 | kinesin II complex(GO:0016939) |
| 2.1 | 8.2 | GO:0000308 | cytoplasmic cyclin-dependent protein kinase holoenzyme complex(GO:0000308) |
| 2.0 | 10.1 | GO:0060201 | clathrin-sculpted acetylcholine transport vesicle(GO:0060200) clathrin-sculpted acetylcholine transport vesicle membrane(GO:0060201) |
| 2.0 | 7.9 | GO:0033596 | TSC1-TSC2 complex(GO:0033596) |
| 2.0 | 19.8 | GO:0005614 | interstitial matrix(GO:0005614) |
| 1.8 | 5.4 | GO:1990723 | cytoplasmic periphery of the nuclear pore complex(GO:1990723) |
| 1.6 | 6.5 | GO:0071817 | MMXD complex(GO:0071817) |
| 1.6 | 34.7 | GO:0030122 | AP-2 adaptor complex(GO:0030122) |
| 1.5 | 4.4 | GO:0070931 | Golgi-associated vesicle lumen(GO:0070931) |
| 1.4 | 7.2 | GO:0045272 | plasma membrane respiratory chain complex I(GO:0045272) |
| 1.4 | 4.2 | GO:0034515 | proteasome storage granule(GO:0034515) |
| 1.4 | 6.8 | GO:1902560 | GMP reductase complex(GO:1902560) |
| 1.3 | 3.8 | GO:0017109 | glutamate-cysteine ligase complex(GO:0017109) |
| 1.2 | 14.6 | GO:0019773 | proteasome core complex, alpha-subunit complex(GO:0019773) |
| 1.2 | 1.2 | GO:0000938 | GARP complex(GO:0000938) EARP complex(GO:1990745) |
| 1.2 | 4.7 | GO:0070695 | FHF complex(GO:0070695) |
| 1.2 | 4.7 | GO:0043541 | UDP-N-acetylglucosamine transferase complex(GO:0043541) |
| 1.2 | 18.6 | GO:0033179 | proton-transporting two-sector ATPase complex, proton-transporting domain(GO:0033177) proton-transporting V-type ATPase, V0 domain(GO:0033179) |
| 1.2 | 6.9 | GO:0030132 | clathrin coat of coated pit(GO:0030132) |
| 1.1 | 9.1 | GO:0098575 | lumenal side of lysosomal membrane(GO:0098575) |
| 1.1 | 14.9 | GO:0030130 | clathrin coat of trans-Golgi network vesicle(GO:0030130) |
| 0.9 | 23.0 | GO:0001518 | voltage-gated sodium channel complex(GO:0001518) |
| 0.9 | 3.6 | GO:0008537 | proteasome activator complex(GO:0008537) |
| 0.9 | 2.6 | GO:0097441 | basilar dendrite(GO:0097441) |
| 0.9 | 12.1 | GO:0035253 | ciliary rootlet(GO:0035253) |
| 0.9 | 7.7 | GO:0072546 | ER membrane protein complex(GO:0072546) |
| 0.8 | 8.4 | GO:0031595 | nuclear proteasome complex(GO:0031595) |
| 0.8 | 4.2 | GO:0016533 | cyclin-dependent protein kinase 5 holoenzyme complex(GO:0016533) |
| 0.8 | 3.3 | GO:0005971 | ribonucleoside-diphosphate reductase complex(GO:0005971) |
| 0.8 | 5.8 | GO:0016272 | prefoldin complex(GO:0016272) |
| 0.8 | 2.4 | GO:0072536 | interleukin-23 receptor complex(GO:0072536) |
| 0.8 | 12.9 | GO:0097512 | cardiac myofibril(GO:0097512) |
| 0.8 | 4.8 | GO:0061617 | MICOS complex(GO:0061617) |
| 0.7 | 10.1 | GO:0005869 | dynactin complex(GO:0005869) |
| 0.7 | 2.9 | GO:1990578 | perinuclear endoplasmic reticulum membrane(GO:1990578) |
| 0.7 | 3.5 | GO:0043564 | Ku70:Ku80 complex(GO:0043564) |
| 0.7 | 4.6 | GO:0036157 | outer dynein arm(GO:0036157) |
| 0.7 | 23.5 | GO:0000421 | autophagosome membrane(GO:0000421) |
| 0.6 | 11.7 | GO:0005838 | proteasome regulatory particle(GO:0005838) |
| 0.6 | 3.2 | GO:1990761 | growth cone lamellipodium(GO:1990761) |
| 0.6 | 60.2 | GO:0030315 | T-tubule(GO:0030315) |
| 0.6 | 7.1 | GO:0045254 | pyruvate dehydrogenase complex(GO:0045254) |
| 0.6 | 4.5 | GO:0016012 | sarcoglycan complex(GO:0016012) |
| 0.6 | 3.9 | GO:0033180 | proton-transporting V-type ATPase, V1 domain(GO:0033180) |
| 0.5 | 3.7 | GO:0005956 | protein kinase CK2 complex(GO:0005956) |
| 0.5 | 3.6 | GO:0005610 | laminin-5 complex(GO:0005610) |
| 0.5 | 3.0 | GO:0009331 | glycerol-3-phosphate dehydrogenase complex(GO:0009331) |
| 0.5 | 2.4 | GO:0031673 | H zone(GO:0031673) |
| 0.5 | 1.9 | GO:0032937 | SREBP-SCAP-Insig complex(GO:0032937) |
| 0.5 | 5.6 | GO:0008290 | F-actin capping protein complex(GO:0008290) |
| 0.5 | 3.7 | GO:0070522 | ERCC4-ERCC1 complex(GO:0070522) |
| 0.4 | 1.3 | GO:0097443 | sorting endosome(GO:0097443) |
| 0.4 | 16.0 | GO:0005640 | nuclear outer membrane(GO:0005640) |
| 0.4 | 23.1 | GO:0030964 | mitochondrial respiratory chain complex I(GO:0005747) NADH dehydrogenase complex(GO:0030964) respiratory chain complex I(GO:0045271) |
| 0.4 | 12.4 | GO:0031307 | integral component of mitochondrial outer membrane(GO:0031307) |
| 0.4 | 2.4 | GO:0070761 | pre-snoRNP complex(GO:0070761) |
| 0.4 | 3.7 | GO:0005787 | signal peptidase complex(GO:0005787) |
| 0.4 | 9.3 | GO:0035371 | microtubule plus-end(GO:0035371) |
| 0.4 | 5.2 | GO:0033268 | node of Ranvier(GO:0033268) |
| 0.4 | 9.2 | GO:0031362 | anchored component of external side of plasma membrane(GO:0031362) |
| 0.4 | 22.2 | GO:0031201 | SNARE complex(GO:0031201) |
| 0.4 | 15.7 | GO:0032420 | stereocilium(GO:0032420) |
| 0.4 | 3.7 | GO:0070852 | cell body fiber(GO:0070852) |
| 0.4 | 3.7 | GO:0097255 | R2TP complex(GO:0097255) |
| 0.4 | 3.3 | GO:0044754 | autolysosome(GO:0044754) |
| 0.4 | 6.4 | GO:0016281 | eukaryotic translation initiation factor 4F complex(GO:0016281) |
| 0.3 | 5.1 | GO:0097433 | dense body(GO:0097433) |
| 0.3 | 4.0 | GO:0030126 | COPI vesicle coat(GO:0030126) |
| 0.3 | 7.3 | GO:0071141 | SMAD protein complex(GO:0071141) |
| 0.3 | 1.2 | GO:0071595 | Nem1-Spo7 phosphatase complex(GO:0071595) |
| 0.3 | 8.5 | GO:0005763 | organellar small ribosomal subunit(GO:0000314) mitochondrial small ribosomal subunit(GO:0005763) |
| 0.3 | 1.5 | GO:0070826 | paraferritin complex(GO:0070826) |
| 0.3 | 2.1 | GO:1990452 | Parkin-FBXW7-Cul1 ubiquitin ligase complex(GO:1990452) |
| 0.3 | 1.4 | GO:0033503 | HULC complex(GO:0033503) |
| 0.3 | 15.5 | GO:0005801 | cis-Golgi network(GO:0005801) |
| 0.3 | 10.9 | GO:0005746 | mitochondrial respiratory chain(GO:0005746) |
| 0.3 | 5.6 | GO:0046930 | pore complex(GO:0046930) |
| 0.3 | 1.8 | GO:0017146 | NMDA selective glutamate receptor complex(GO:0017146) |
| 0.3 | 1.8 | GO:1990726 | Lsm1-7-Pat1 complex(GO:1990726) |
| 0.3 | 1.8 | GO:0032593 | insulin-responsive compartment(GO:0032593) |
| 0.3 | 10.1 | GO:0000159 | protein phosphatase type 2A complex(GO:0000159) |
| 0.2 | 5.4 | GO:0005868 | cytoplasmic dynein complex(GO:0005868) |
| 0.2 | 1.7 | GO:0070436 | Grb2-EGFR complex(GO:0070436) |
| 0.2 | 7.9 | GO:0030687 | preribosome, large subunit precursor(GO:0030687) |
| 0.2 | 5.2 | GO:0071782 | endoplasmic reticulum tubular network(GO:0071782) |
| 0.2 | 1.4 | GO:1990357 | terminal web(GO:1990357) |
| 0.2 | 4.2 | GO:0030140 | trans-Golgi network transport vesicle(GO:0030140) |
| 0.2 | 1.3 | GO:0005594 | collagen type IX trimer(GO:0005594) |
| 0.2 | 0.8 | GO:0042765 | GPI-anchor transamidase complex(GO:0042765) |
| 0.2 | 0.8 | GO:0032144 | 4-aminobutyrate transaminase complex(GO:0032144) |
| 0.2 | 2.1 | GO:0097550 | transcriptional preinitiation complex(GO:0097550) |
| 0.2 | 4.5 | GO:0031305 | intrinsic component of mitochondrial inner membrane(GO:0031304) integral component of mitochondrial inner membrane(GO:0031305) |
| 0.2 | 1.0 | GO:0008622 | epsilon DNA polymerase complex(GO:0008622) |
| 0.2 | 2.3 | GO:0031464 | Cul4A-RING E3 ubiquitin ligase complex(GO:0031464) |
| 0.2 | 3.9 | GO:0032591 | dendritic spine membrane(GO:0032591) |
| 0.2 | 4.1 | GO:0035327 | transcriptionally active chromatin(GO:0035327) |
| 0.2 | 1.3 | GO:0016589 | NURF complex(GO:0016589) |
| 0.2 | 3.0 | GO:0000145 | exocyst(GO:0000145) |
| 0.2 | 10.1 | GO:0033116 | endoplasmic reticulum-Golgi intermediate compartment membrane(GO:0033116) |
| 0.2 | 3.4 | GO:0044300 | cerebellar mossy fiber(GO:0044300) |
| 0.2 | 25.2 | GO:0008021 | synaptic vesicle(GO:0008021) |
| 0.2 | 15.7 | GO:0042734 | presynaptic membrane(GO:0042734) |
| 0.2 | 15.6 | GO:0005604 | basement membrane(GO:0005604) |
| 0.2 | 6.1 | GO:0008180 | COP9 signalosome(GO:0008180) |
| 0.2 | 1.2 | GO:0000796 | condensin complex(GO:0000796) |
| 0.2 | 67.2 | GO:0005874 | microtubule(GO:0005874) |
| 0.1 | 6.1 | GO:0099738 | cell cortex region(GO:0099738) |
| 0.1 | 25.2 | GO:0031968 | mitochondrial outer membrane(GO:0005741) organelle outer membrane(GO:0031968) |
| 0.1 | 9.3 | GO:0031903 | peroxisomal membrane(GO:0005778) microbody membrane(GO:0031903) |
| 0.1 | 15.8 | GO:0031901 | early endosome membrane(GO:0031901) |
| 0.1 | 2.2 | GO:0000974 | Prp19 complex(GO:0000974) |
| 0.1 | 0.7 | GO:0000835 | ER ubiquitin ligase complex(GO:0000835) Hrd1p ubiquitin ligase complex(GO:0000836) |
| 0.1 | 8.5 | GO:0005905 | clathrin-coated pit(GO:0005905) |
| 0.1 | 9.9 | GO:0005777 | peroxisome(GO:0005777) microbody(GO:0042579) |
| 0.1 | 3.7 | GO:0044665 | MLL1/2 complex(GO:0044665) MLL1 complex(GO:0071339) |
| 0.1 | 3.5 | GO:1904115 | axon cytoplasm(GO:1904115) |
| 0.1 | 2.2 | GO:0043198 | dendritic shaft(GO:0043198) |
| 0.1 | 2.3 | GO:0032281 | AMPA glutamate receptor complex(GO:0032281) |
| 0.1 | 6.1 | GO:0055038 | recycling endosome membrane(GO:0055038) |
| 0.1 | 3.5 | GO:0071564 | npBAF complex(GO:0071564) |
| 0.1 | 10.1 | GO:0001725 | stress fiber(GO:0001725) contractile actin filament bundle(GO:0097517) |
| 0.1 | 18.8 | GO:0099572 | postsynaptic density(GO:0014069) postsynaptic specialization(GO:0099572) |
| 0.1 | 14.7 | GO:0030427 | site of polarized growth(GO:0030427) |
| 0.1 | 0.9 | GO:0002193 | MAML1-RBP-Jkappa- ICN1 complex(GO:0002193) |
| 0.1 | 0.7 | GO:0002116 | semaphorin receptor complex(GO:0002116) |
| 0.1 | 4.6 | GO:0055037 | recycling endosome(GO:0055037) |
| 0.1 | 0.4 | GO:0044305 | calyx of Held(GO:0044305) |
| 0.1 | 1.7 | GO:0031932 | TORC2 complex(GO:0031932) |
| 0.1 | 3.1 | GO:0000502 | proteasome complex(GO:0000502) |
| 0.1 | 10.0 | GO:0043204 | perikaryon(GO:0043204) |
| 0.1 | 49.2 | GO:0048471 | perinuclear region of cytoplasm(GO:0048471) |
| 0.1 | 3.8 | GO:0005771 | multivesicular body(GO:0005771) |
| 0.1 | 0.6 | GO:0031465 | Cul4B-RING E3 ubiquitin ligase complex(GO:0031465) |
| 0.1 | 0.9 | GO:0042641 | actomyosin(GO:0042641) |
| 0.1 | 1.3 | GO:0042405 | nuclear inclusion body(GO:0042405) |
| 0.1 | 0.4 | GO:0031616 | spindle pole centrosome(GO:0031616) |
| 0.1 | 4.4 | GO:0044306 | neuron projection terminus(GO:0044306) |
| 0.1 | 3.4 | GO:0030864 | cortical actin cytoskeleton(GO:0030864) |
| 0.1 | 0.4 | GO:0070369 | beta-catenin-TCF7L2 complex(GO:0070369) |
| 0.1 | 0.4 | GO:0000127 | transcription factor TFIIIC complex(GO:0000127) |
| 0.1 | 6.9 | GO:0005770 | late endosome(GO:0005770) |
| 0.1 | 1.7 | GO:0033017 | sarcoplasmic reticulum membrane(GO:0033017) |
| 0.1 | 0.6 | GO:0008385 | IkappaB kinase complex(GO:0008385) |
| 0.1 | 0.7 | GO:0000164 | protein phosphatase type 1 complex(GO:0000164) |
| 0.1 | 8.7 | GO:0005819 | spindle(GO:0005819) |
| 0.1 | 2.1 | GO:0009295 | nucleoid(GO:0009295) mitochondrial nucleoid(GO:0042645) |
| 0.1 | 4.2 | GO:0031985 | Golgi cisterna(GO:0031985) |
| 0.0 | 0.8 | GO:0016529 | sarcoplasmic reticulum(GO:0016529) |
| 0.0 | 2.1 | GO:0016234 | inclusion body(GO:0016234) |
| 0.0 | 0.6 | GO:0005776 | autophagosome(GO:0005776) |
| 0.0 | 3.8 | GO:0001650 | fibrillar center(GO:0001650) |
| 0.0 | 4.9 | GO:0031965 | nuclear membrane(GO:0031965) |
| 0.0 | 0.4 | GO:0005669 | transcription factor TFIID complex(GO:0005669) |
| 0.0 | 0.0 | GO:0043194 | axon initial segment(GO:0043194) |
| 0.0 | 0.2 | GO:0060076 | excitatory synapse(GO:0060076) |
| 0.0 | 1.4 | GO:0022625 | cytosolic large ribosomal subunit(GO:0022625) |
| 0.0 | 1.1 | GO:0000118 | histone deacetylase complex(GO:0000118) |
| 0.0 | 0.1 | GO:1990130 | Iml1 complex(GO:1990130) |
| 0.0 | 3.5 | GO:0016324 | apical plasma membrane(GO:0016324) |
| 0.0 | 1.0 | GO:0043209 | myelin sheath(GO:0043209) |
Gene overrepresentation in molecular function category:
| Log-likelihood per target | Total log-likelihood | Term | Description |
|---|---|---|---|
| 5.8 | 23.3 | GO:0047391 | alkylglycerophosphoethanolamine phosphodiesterase activity(GO:0047391) |
| 4.8 | 14.5 | GO:0004157 | dihydropyrimidinase activity(GO:0004157) |
| 4.0 | 15.9 | GO:0005006 | epidermal growth factor-activated receptor activity(GO:0005006) |
| 3.1 | 12.5 | GO:0035373 | chondroitin sulfate proteoglycan binding(GO:0035373) |
| 3.0 | 26.9 | GO:0033192 | calmodulin-dependent protein phosphatase activity(GO:0033192) |
| 2.2 | 8.9 | GO:0004853 | uroporphyrinogen decarboxylase activity(GO:0004853) |
| 2.2 | 6.5 | GO:0052836 | inositol 5-diphosphate pentakisphosphate 5-kinase activity(GO:0052836) inositol diphosphate tetrakisphosphate kinase activity(GO:0052839) |
| 2.1 | 14.8 | GO:0046912 | transferase activity, transferring acyl groups, acyl groups converted into alkyl on transfer(GO:0046912) |
| 2.0 | 8.1 | GO:0004598 | peptidylglycine monooxygenase activity(GO:0004504) peptidylamidoglycolate lyase activity(GO:0004598) |
| 2.0 | 10.1 | GO:0030348 | syntaxin-3 binding(GO:0030348) |
| 1.9 | 31.6 | GO:0031432 | titin binding(GO:0031432) |
| 1.8 | 9.1 | GO:0008553 | hydrogen-exporting ATPase activity, phosphorylative mechanism(GO:0008553) |
| 1.8 | 48.6 | GO:0050750 | low-density lipoprotein particle receptor binding(GO:0050750) |
| 1.8 | 7.1 | GO:0004739 | pyruvate dehydrogenase (acetyl-transferring) activity(GO:0004739) |
| 1.7 | 6.9 | GO:0016230 | sphingomyelin phosphodiesterase activator activity(GO:0016230) |
| 1.7 | 5.1 | GO:0030549 | acetylcholine receptor activator activity(GO:0030549) |
| 1.7 | 13.3 | GO:0086006 | voltage-gated sodium channel activity involved in cardiac muscle cell action potential(GO:0086006) |
| 1.6 | 6.5 | GO:0005471 | ATP:ADP antiporter activity(GO:0005471) adenine transmembrane transporter activity(GO:0015207) |
| 1.6 | 4.7 | GO:0050509 | N-acetylglucosaminyl-proteoglycan 4-beta-glucuronosyltransferase activity(GO:0050509) |
| 1.5 | 32.2 | GO:0044769 | hydrogen-exporting ATPase activity(GO:0036442) ATPase activity, coupled to transmembrane movement of ions, rotational mechanism(GO:0044769) proton-transporting ATPase activity, rotational mechanism(GO:0046961) |
| 1.5 | 5.8 | GO:0003938 | IMP dehydrogenase activity(GO:0003938) |
| 1.4 | 18.6 | GO:0004705 | JUN kinase activity(GO:0004705) SAP kinase activity(GO:0016909) |
| 1.4 | 7.1 | GO:0004883 | glucocorticoid receptor activity(GO:0004883) glucocorticoid-activated RNA polymerase II transcription factor binding transcription factor activity(GO:0038051) |
| 1.4 | 12.4 | GO:0008597 | calcium-dependent protein serine/threonine phosphatase regulator activity(GO:0008597) |
| 1.4 | 6.8 | GO:0003920 | GMP reductase activity(GO:0003920) oxidoreductase activity, acting on NAD(P)H, nitrogenous group as acceptor(GO:0016657) |
| 1.3 | 8.1 | GO:0016802 | adenosylhomocysteinase activity(GO:0004013) trialkylsulfonium hydrolase activity(GO:0016802) |
| 1.3 | 5.3 | GO:0004775 | succinate-CoA ligase (ADP-forming) activity(GO:0004775) |
| 1.3 | 9.2 | GO:0043812 | phosphatidylinositol-4-phosphate phosphatase activity(GO:0043812) |
| 1.3 | 5.2 | GO:0004348 | glucosylceramidase activity(GO:0004348) |
| 1.3 | 3.8 | GO:0004357 | glutamate-cysteine ligase activity(GO:0004357) |
| 1.2 | 9.3 | GO:0050833 | pyruvate transmembrane transporter activity(GO:0050833) |
| 1.1 | 4.4 | GO:0008798 | beta-aspartyl-peptidase activity(GO:0008798) |
| 1.1 | 16.4 | GO:0047372 | acylglycerol lipase activity(GO:0047372) |
| 1.1 | 7.5 | GO:0030614 | oxidoreductase activity, acting on phosphorus or arsenic in donors(GO:0030613) oxidoreductase activity, acting on phosphorus or arsenic in donors, disulfide as acceptor(GO:0030614) |
| 0.9 | 19.7 | GO:0050811 | GABA receptor binding(GO:0050811) |
| 0.9 | 2.8 | GO:0004766 | spermidine synthase activity(GO:0004766) |
| 0.9 | 8.4 | GO:0036402 | proteasome-activating ATPase activity(GO:0036402) |
| 0.9 | 17.6 | GO:0008432 | JUN kinase binding(GO:0008432) |
| 0.9 | 4.6 | GO:1990254 | keratin filament binding(GO:1990254) |
| 0.9 | 7.3 | GO:0045545 | syndecan binding(GO:0045545) |
| 0.9 | 9.1 | GO:0055131 | C3HC4-type RING finger domain binding(GO:0055131) |
| 0.9 | 2.6 | GO:0035529 | NADH pyrophosphatase activity(GO:0035529) |
| 0.9 | 4.3 | GO:0051998 | carboxyl-O-methyltransferase activity(GO:0010340) protein carboxyl O-methyltransferase activity(GO:0051998) |
| 0.8 | 7.6 | GO:0030346 | protein phosphatase 2B binding(GO:0030346) |
| 0.8 | 10.1 | GO:0010314 | phosphatidylinositol-5-phosphate binding(GO:0010314) |
| 0.8 | 3.3 | GO:0016728 | ribonucleoside-diphosphate reductase activity, thioredoxin disulfide as acceptor(GO:0004748) oxidoreductase activity, acting on CH or CH2 groups, disulfide as acceptor(GO:0016728) ribonucleoside-diphosphate reductase activity(GO:0061731) |
| 0.8 | 2.4 | GO:0042019 | interleukin-23 binding(GO:0042019) interleukin-23 receptor activity(GO:0042020) |
| 0.8 | 4.9 | GO:0051996 | farnesyl-diphosphate farnesyltransferase activity(GO:0004310) squalene synthase activity(GO:0051996) |
| 0.8 | 3.2 | GO:0004668 | protein-arginine deiminase activity(GO:0004668) |
| 0.8 | 28.7 | GO:0005540 | hyaluronic acid binding(GO:0005540) |
| 0.7 | 3.7 | GO:0043141 | ATP-dependent 5'-3' DNA helicase activity(GO:0043141) |
| 0.7 | 8.8 | GO:0022889 | L-serine transmembrane transporter activity(GO:0015194) serine transmembrane transporter activity(GO:0022889) |
| 0.7 | 4.4 | GO:0035500 | MH2 domain binding(GO:0035500) |
| 0.7 | 5.7 | GO:0050816 | phosphothreonine binding(GO:0050816) |
| 0.7 | 2.1 | GO:0010698 | acetyltransferase activator activity(GO:0010698) |
| 0.7 | 12.1 | GO:0042043 | neurexin family protein binding(GO:0042043) |
| 0.7 | 13.3 | GO:0051537 | 2 iron, 2 sulfur cluster binding(GO:0051537) |
| 0.7 | 10.3 | GO:1903136 | cuprous ion binding(GO:1903136) |
| 0.6 | 40.5 | GO:0070412 | R-SMAD binding(GO:0070412) |
| 0.6 | 1.9 | GO:0005280 | hydrogen:amino acid symporter activity(GO:0005280) |
| 0.6 | 2.5 | GO:0015183 | L-aspartate transmembrane transporter activity(GO:0015183) |
| 0.6 | 3.8 | GO:0043184 | vascular endothelial growth factor receptor 2 binding(GO:0043184) |
| 0.6 | 1.9 | GO:0000247 | C-8 sterol isomerase activity(GO:0000247) |
| 0.6 | 3.1 | GO:0047134 | protein-disulfide reductase activity(GO:0047134) |
| 0.6 | 17.2 | GO:0005212 | structural constituent of eye lens(GO:0005212) |
| 0.6 | 5.5 | GO:0004673 | protein histidine kinase activity(GO:0004673) |
| 0.6 | 4.9 | GO:0015288 | porin activity(GO:0015288) |
| 0.6 | 25.4 | GO:0017091 | AU-rich element binding(GO:0017091) |
| 0.6 | 2.4 | GO:0008440 | inositol-1,4,5-trisphosphate 3-kinase activity(GO:0008440) |
| 0.6 | 5.2 | GO:0032050 | clathrin heavy chain binding(GO:0032050) |
| 0.6 | 13.7 | GO:0051010 | microtubule plus-end binding(GO:0051010) |
| 0.6 | 15.4 | GO:0008574 | ATP-dependent microtubule motor activity, plus-end-directed(GO:0008574) |
| 0.6 | 6.8 | GO:0019869 | chloride channel inhibitor activity(GO:0019869) |
| 0.6 | 48.9 | GO:0050840 | extracellular matrix binding(GO:0050840) |
| 0.6 | 7.8 | GO:0005545 | 1-phosphatidylinositol binding(GO:0005545) |
| 0.6 | 3.4 | GO:0017040 | ceramidase activity(GO:0017040) |
| 0.5 | 1.6 | GO:0008336 | gamma-butyrobetaine dioxygenase activity(GO:0008336) |
| 0.5 | 11.4 | GO:0070300 | phosphatidic acid binding(GO:0070300) |
| 0.5 | 7.6 | GO:0015501 | glutamate:sodium symporter activity(GO:0015501) |
| 0.5 | 31.7 | GO:0030507 | spectrin binding(GO:0030507) |
| 0.5 | 14.6 | GO:0070003 | threonine-type endopeptidase activity(GO:0004298) threonine-type peptidase activity(GO:0070003) |
| 0.5 | 1.5 | GO:0070336 | flap-structured DNA binding(GO:0070336) |
| 0.5 | 3.6 | GO:0061133 | endopeptidase activator activity(GO:0061133) |
| 0.5 | 16.0 | GO:0005086 | ARF guanyl-nucleotide exchange factor activity(GO:0005086) |
| 0.5 | 2.0 | GO:0032184 | SUMO polymer binding(GO:0032184) |
| 0.5 | 3.5 | GO:0051575 | 5'-deoxyribose-5-phosphate lyase activity(GO:0051575) |
| 0.5 | 3.9 | GO:0016775 | creatine kinase activity(GO:0004111) phosphotransferase activity, nitrogenous group as acceptor(GO:0016775) |
| 0.5 | 16.8 | GO:0001786 | phosphatidylserine binding(GO:0001786) |
| 0.5 | 3.7 | GO:1990599 | 3' overhang single-stranded DNA endodeoxyribonuclease activity(GO:1990599) |
| 0.5 | 2.3 | GO:0004176 | ATP-dependent peptidase activity(GO:0004176) |
| 0.5 | 7.9 | GO:0008179 | adenylate cyclase binding(GO:0008179) |
| 0.5 | 14.8 | GO:0030676 | Rac guanyl-nucleotide exchange factor activity(GO:0030676) |
| 0.5 | 5.1 | GO:0008429 | phosphatidylethanolamine binding(GO:0008429) |
| 0.5 | 1.8 | GO:0016509 | long-chain-3-hydroxyacyl-CoA dehydrogenase activity(GO:0016509) |
| 0.5 | 1.8 | GO:0010861 | thyroid hormone receptor activator activity(GO:0010861) thyroid hormone receptor coactivator activity(GO:0030375) |
| 0.5 | 4.1 | GO:0016312 | inositol bisphosphate phosphatase activity(GO:0016312) |
| 0.4 | 16.0 | GO:0070182 | DNA polymerase binding(GO:0070182) |
| 0.4 | 1.3 | GO:0004963 | follicle-stimulating hormone receptor activity(GO:0004963) |
| 0.4 | 2.6 | GO:0000285 | 1-phosphatidylinositol-3-phosphate 5-kinase activity(GO:0000285) |
| 0.4 | 1.3 | GO:0000253 | 3-keto sterol reductase activity(GO:0000253) |
| 0.4 | 2.2 | GO:0047280 | nicotinamide phosphoribosyltransferase activity(GO:0047280) |
| 0.4 | 3.0 | GO:0005072 | transforming growth factor beta receptor, cytoplasmic mediator activity(GO:0005072) |
| 0.4 | 3.9 | GO:0036312 | phosphatidylinositol 3-kinase regulatory subunit binding(GO:0036312) |
| 0.4 | 7.2 | GO:0035497 | cAMP response element binding(GO:0035497) |
| 0.4 | 1.6 | GO:0019797 | procollagen-proline 3-dioxygenase activity(GO:0019797) |
| 0.4 | 11.2 | GO:0097109 | neuroligin family protein binding(GO:0097109) |
| 0.4 | 7.2 | GO:0070410 | co-SMAD binding(GO:0070410) |
| 0.4 | 20.5 | GO:0019894 | kinesin binding(GO:0019894) |
| 0.4 | 19.1 | GO:0050136 | NADH dehydrogenase (ubiquinone) activity(GO:0008137) NADH dehydrogenase (quinone) activity(GO:0050136) |
| 0.4 | 6.1 | GO:0031821 | G-protein coupled serotonin receptor binding(GO:0031821) |
| 0.4 | 9.7 | GO:0005248 | voltage-gated sodium channel activity(GO:0005248) voltage-gated ion channel activity involved in regulation of postsynaptic membrane potential(GO:1905030) |
| 0.4 | 5.5 | GO:0035615 | clathrin adaptor activity(GO:0035615) endocytic adaptor activity(GO:0098748) |
| 0.4 | 2.5 | GO:0004849 | uridine kinase activity(GO:0004849) |
| 0.4 | 3.6 | GO:0070679 | inositol 1,4,5 trisphosphate binding(GO:0070679) |
| 0.3 | 3.7 | GO:0019871 | sodium channel inhibitor activity(GO:0019871) |
| 0.3 | 5.7 | GO:0000400 | four-way junction DNA binding(GO:0000400) |
| 0.3 | 2.6 | GO:1990939 | ATP-dependent microtubule motor activity(GO:1990939) |
| 0.3 | 1.0 | GO:0030156 | benzodiazepine receptor binding(GO:0030156) |
| 0.3 | 1.3 | GO:0044736 | acid-sensing ion channel activity(GO:0044736) |
| 0.3 | 2.2 | GO:0015280 | ligand-gated sodium channel activity(GO:0015280) |
| 0.3 | 41.9 | GO:0017048 | Rho GTPase binding(GO:0017048) |
| 0.3 | 5.8 | GO:0048156 | tau protein binding(GO:0048156) |
| 0.3 | 2.4 | GO:0050145 | nucleoside phosphate kinase activity(GO:0050145) |
| 0.3 | 1.5 | GO:0015319 | sodium:inorganic phosphate symporter activity(GO:0015319) |
| 0.3 | 7.7 | GO:0005527 | macrolide binding(GO:0005527) FK506 binding(GO:0005528) |
| 0.3 | 11.0 | GO:0050699 | WW domain binding(GO:0050699) |
| 0.3 | 10.3 | GO:0015248 | sterol transporter activity(GO:0015248) |
| 0.3 | 1.5 | GO:0015086 | cadmium ion transmembrane transporter activity(GO:0015086) cobalt ion transmembrane transporter activity(GO:0015087) lead ion transmembrane transporter activity(GO:0015094) ferrous iron uptake transmembrane transporter activity(GO:0015639) |
| 0.3 | 5.0 | GO:0050786 | RAGE receptor binding(GO:0050786) |
| 0.3 | 1.4 | GO:0032795 | heterotrimeric G-protein binding(GO:0032795) |
| 0.3 | 2.5 | GO:0089720 | caspase binding(GO:0089720) |
| 0.3 | 2.7 | GO:0050692 | DBD domain binding(GO:0050692) |
| 0.3 | 40.4 | GO:0005200 | structural constituent of cytoskeleton(GO:0005200) |
| 0.3 | 0.8 | GO:0003860 | 3-hydroxyisobutyryl-CoA hydrolase activity(GO:0003860) |
| 0.3 | 5.5 | GO:0044548 | S100 protein binding(GO:0044548) |
| 0.3 | 1.5 | GO:0010465 | nerve growth factor receptor activity(GO:0010465) |
| 0.2 | 5.2 | GO:0008536 | Ran GTPase binding(GO:0008536) |
| 0.2 | 7.7 | GO:0001848 | complement binding(GO:0001848) |
| 0.2 | 1.2 | GO:0004045 | aminoacyl-tRNA hydrolase activity(GO:0004045) |
| 0.2 | 5.1 | GO:0001011 | transcription factor activity, sequence-specific DNA binding, RNA polymerase recruiting(GO:0001011) transcription factor activity, TFIIB-class binding(GO:0001087) |
| 0.2 | 5.6 | GO:0005388 | calcium-transporting ATPase activity(GO:0005388) |
| 0.2 | 17.9 | GO:0019003 | GDP binding(GO:0019003) |
| 0.2 | 0.7 | GO:0033858 | N-acetylgalactosamine kinase activity(GO:0033858) |
| 0.2 | 4.5 | GO:0008190 | eukaryotic initiation factor 4E binding(GO:0008190) |
| 0.2 | 2.8 | GO:0042577 | lipid phosphatase activity(GO:0042577) |
| 0.2 | 2.8 | GO:0043024 | ribosomal small subunit binding(GO:0043024) |
| 0.2 | 7.6 | GO:0030276 | clathrin binding(GO:0030276) |
| 0.2 | 7.1 | GO:0015485 | cholesterol binding(GO:0015485) |
| 0.2 | 3.4 | GO:0031435 | mitogen-activated protein kinase kinase kinase binding(GO:0031435) |
| 0.2 | 7.2 | GO:0004709 | MAP kinase kinase kinase activity(GO:0004709) |
| 0.2 | 1.3 | GO:0004468 | lysine N-acetyltransferase activity, acting on acetyl phosphate as donor(GO:0004468) |
| 0.2 | 39.1 | GO:0001078 | transcriptional repressor activity, RNA polymerase II core promoter proximal region sequence-specific binding(GO:0001078) |
| 0.2 | 8.5 | GO:0005484 | SNAP receptor activity(GO:0005484) |
| 0.2 | 2.1 | GO:0010859 | calcium-dependent cysteine-type endopeptidase inhibitor activity(GO:0010859) |
| 0.2 | 2.9 | GO:0031386 | protein tag(GO:0031386) |
| 0.2 | 0.6 | GO:0016309 | 1-phosphatidylinositol-4-phosphate 5-kinase activity(GO:0016308) 1-phosphatidylinositol-5-phosphate 4-kinase activity(GO:0016309) 1-phosphatidylinositol-3-phosphate 4-kinase activity(GO:0052811) |
| 0.2 | 0.6 | GO:0008384 | IkappaB kinase activity(GO:0008384) |
| 0.2 | 0.8 | GO:0003923 | GPI-anchor transamidase activity(GO:0003923) |
| 0.2 | 0.8 | GO:0003867 | 4-aminobutyrate transaminase activity(GO:0003867) succinate-semialdehyde dehydrogenase binding(GO:0032145) (S)-3-amino-2-methylpropionate transaminase activity(GO:0047298) |
| 0.2 | 2.8 | GO:0017017 | MAP kinase tyrosine/serine/threonine phosphatase activity(GO:0017017) |
| 0.2 | 3.8 | GO:0017075 | syntaxin-1 binding(GO:0017075) |
| 0.2 | 1.8 | GO:0019784 | NEDD8-specific protease activity(GO:0019784) |
| 0.2 | 5.8 | GO:0044183 | protein binding involved in protein folding(GO:0044183) |
| 0.2 | 0.8 | GO:0005219 | ryanodine-sensitive calcium-release channel activity(GO:0005219) calcium-induced calcium release activity(GO:0048763) |
| 0.2 | 1.7 | GO:0005168 | neurotrophin TRKA receptor binding(GO:0005168) |
| 0.2 | 7.8 | GO:0017080 | sodium channel regulator activity(GO:0017080) |
| 0.2 | 5.3 | GO:0016676 | cytochrome-c oxidase activity(GO:0004129) heme-copper terminal oxidase activity(GO:0015002) oxidoreductase activity, acting on a heme group of donors, oxygen as acceptor(GO:0016676) |
| 0.2 | 5.9 | GO:0004198 | calcium-dependent cysteine-type endopeptidase activity(GO:0004198) |
| 0.2 | 23.6 | GO:0008565 | protein transporter activity(GO:0008565) |
| 0.2 | 8.2 | GO:0004683 | calmodulin-dependent protein kinase activity(GO:0004683) |
| 0.2 | 2.8 | GO:0005149 | interleukin-1 receptor binding(GO:0005149) |
| 0.2 | 6.6 | GO:0008157 | protein phosphatase 1 binding(GO:0008157) |
| 0.2 | 4.8 | GO:0043015 | gamma-tubulin binding(GO:0043015) |
| 0.2 | 2.4 | GO:0008253 | 5'-nucleotidase activity(GO:0008253) |
| 0.2 | 3.7 | GO:0004993 | G-protein coupled serotonin receptor activity(GO:0004993) |
| 0.2 | 2.6 | GO:0045505 | dynein intermediate chain binding(GO:0045505) |
| 0.2 | 0.6 | GO:0003875 | ADP-ribosylarginine hydrolase activity(GO:0003875) |
| 0.2 | 4.8 | GO:0005109 | frizzled binding(GO:0005109) |
| 0.1 | 7.0 | GO:0061631 | ubiquitin conjugating enzyme activity(GO:0061631) |
| 0.1 | 1.0 | GO:0019826 | oxygen sensor activity(GO:0019826) |
| 0.1 | 1.6 | GO:0001222 | transcription corepressor binding(GO:0001222) |
| 0.1 | 1.0 | GO:0016714 | oxidoreductase activity, acting on paired donors, with incorporation or reduction of molecular oxygen, reduced pteridine as one donor, and incorporation of one atom of oxygen(GO:0016714) |
| 0.1 | 5.2 | GO:0070888 | E-box binding(GO:0070888) |
| 0.1 | 2.3 | GO:0004549 | tRNA-specific ribonuclease activity(GO:0004549) |
| 0.1 | 0.5 | GO:0008422 | beta-glucosidase activity(GO:0008422) |
| 0.1 | 0.9 | GO:0000150 | recombinase activity(GO:0000150) |
| 0.1 | 0.4 | GO:0001034 | polymerase III regulatory region sequence-specific DNA binding(GO:0000992) RNA polymerase III type 1 promoter sequence-specific DNA binding(GO:0001002) RNA polymerase III type 2 promoter sequence-specific DNA binding(GO:0001003) RNA polymerase III transcription factor activity, sequence-specific DNA binding(GO:0001034) |
| 0.1 | 6.7 | GO:0016831 | carboxy-lyase activity(GO:0016831) |
| 0.1 | 4.6 | GO:0030332 | cyclin binding(GO:0030332) |
| 0.1 | 2.7 | GO:0005521 | lamin binding(GO:0005521) |
| 0.1 | 0.9 | GO:0102336 | fatty acid elongase activity(GO:0009922) 3-oxo-arachidoyl-CoA synthase activity(GO:0102336) 3-oxo-cerotoyl-CoA synthase activity(GO:0102337) 3-oxo-lignoceronyl-CoA synthase activity(GO:0102338) |
| 0.1 | 3.5 | GO:0051019 | mitogen-activated protein kinase binding(GO:0051019) |
| 0.1 | 2.9 | GO:0017025 | TBP-class protein binding(GO:0017025) |
| 0.1 | 3.7 | GO:0005546 | phosphatidylinositol-4,5-bisphosphate binding(GO:0005546) |
| 0.1 | 4.2 | GO:0001106 | RNA polymerase II transcription corepressor activity(GO:0001106) |
| 0.1 | 2.9 | GO:0005523 | tropomyosin binding(GO:0005523) |
| 0.1 | 1.1 | GO:0035251 | UDP-glucosyltransferase activity(GO:0035251) |
| 0.1 | 1.9 | GO:0001055 | RNA polymerase II activity(GO:0001055) |
| 0.1 | 7.1 | GO:0002039 | p53 binding(GO:0002039) |
| 0.1 | 1.9 | GO:0000339 | RNA cap binding(GO:0000339) |
| 0.1 | 5.3 | GO:0005507 | copper ion binding(GO:0005507) |
| 0.1 | 35.7 | GO:0045296 | cadherin binding(GO:0045296) |
| 0.1 | 0.8 | GO:0032190 | acrosin binding(GO:0032190) |
| 0.1 | 3.7 | GO:0003743 | translation initiation factor activity(GO:0003743) |
| 0.1 | 0.5 | GO:0004594 | pantothenate kinase activity(GO:0004594) |
| 0.1 | 5.7 | GO:0004722 | protein serine/threonine phosphatase activity(GO:0004722) |
| 0.1 | 0.2 | GO:0003973 | (S)-2-hydroxy-acid oxidase activity(GO:0003973) very-long-chain-(S)-2-hydroxy-acid oxidase activity(GO:0052852) long-chain-(S)-2-hydroxy-long-chain-acid oxidase activity(GO:0052853) medium-chain-(S)-2-hydroxy-acid oxidase activity(GO:0052854) |
| 0.1 | 0.4 | GO:0004430 | 1-phosphatidylinositol 4-kinase activity(GO:0004430) |
| 0.1 | 1.6 | GO:0008191 | metalloendopeptidase inhibitor activity(GO:0008191) |
| 0.1 | 2.2 | GO:0016628 | oxidoreductase activity, acting on the CH-CH group of donors, NAD or NADP as acceptor(GO:0016628) |
| 0.1 | 0.6 | GO:0097322 | 7SK snRNA binding(GO:0097322) |
| 0.1 | 0.6 | GO:0008097 | 5S rRNA binding(GO:0008097) |
| 0.1 | 0.7 | GO:0051434 | BH3 domain binding(GO:0051434) |
| 0.1 | 0.2 | GO:0070984 | SET domain binding(GO:0070984) |
| 0.1 | 9.8 | GO:0008201 | heparin binding(GO:0008201) |
| 0.1 | 2.5 | GO:0000049 | tRNA binding(GO:0000049) |
| 0.1 | 0.7 | GO:0017154 | semaphorin receptor activity(GO:0017154) |
| 0.1 | 1.0 | GO:0005112 | Notch binding(GO:0005112) |
| 0.1 | 0.2 | GO:0004958 | prostaglandin F receptor activity(GO:0004958) |
| 0.0 | 3.8 | GO:0005089 | Rho guanyl-nucleotide exchange factor activity(GO:0005089) |
| 0.0 | 0.2 | GO:0052650 | NADP-retinol dehydrogenase activity(GO:0052650) |
| 0.0 | 13.7 | GO:0005525 | GTP binding(GO:0005525) |
| 0.0 | 1.4 | GO:0046875 | ephrin receptor binding(GO:0046875) |
| 0.0 | 0.1 | GO:0015275 | stretch-activated, cation-selective, calcium channel activity(GO:0015275) |
| 0.0 | 0.3 | GO:0008568 | microtubule-severing ATPase activity(GO:0008568) |
| 0.0 | 4.7 | GO:0003697 | single-stranded DNA binding(GO:0003697) |
| 0.0 | 1.2 | GO:0015078 | hydrogen ion transmembrane transporter activity(GO:0015078) |
| 0.0 | 0.5 | GO:0009982 | pseudouridine synthase activity(GO:0009982) |
| 0.0 | 0.9 | GO:0008239 | dipeptidyl-peptidase activity(GO:0008239) |
| 0.0 | 0.2 | GO:0016423 | tRNA (guanine) methyltransferase activity(GO:0016423) |
| 0.0 | 0.2 | GO:0008607 | phosphorylase kinase regulator activity(GO:0008607) |
| 0.0 | 0.4 | GO:0080025 | phosphatidylinositol-3,5-bisphosphate binding(GO:0080025) |
| 0.0 | 0.3 | GO:0032266 | phosphatidylinositol-3-phosphate binding(GO:0032266) |
| 0.0 | 0.4 | GO:0030742 | GTP-dependent protein binding(GO:0030742) |
| 0.0 | 0.1 | GO:0034432 | endopolyphosphatase activity(GO:0000298) diphosphoinositol-polyphosphate diphosphatase activity(GO:0008486) bis(5'-adenosyl)-hexaphosphatase activity(GO:0034431) bis(5'-adenosyl)-pentaphosphatase activity(GO:0034432) inositol diphosphate tetrakisphosphate diphosphatase activity(GO:0052840) inositol bisdiphosphate tetrakisphosphate diphosphatase activity(GO:0052841) inositol diphosphate pentakisphosphate diphosphatase activity(GO:0052842) inositol-1-diphosphate-2,3,4,5,6-pentakisphosphate diphosphatase activity(GO:0052843) inositol-3-diphosphate-1,2,4,5,6-pentakisphosphate diphosphatase activity(GO:0052844) inositol-5-diphosphate-1,2,3,4,6-pentakisphosphate diphosphatase activity(GO:0052845) inositol-1,5-bisdiphosphate-2,3,4,6-tetrakisphosphate 1-diphosphatase activity(GO:0052846) inositol-1,5-bisdiphosphate-2,3,4,6-tetrakisphosphate 5-diphosphatase activity(GO:0052847) inositol-3,5-bisdiphosphate-2,3,4,6-tetrakisphosphate 5-diphosphatase activity(GO:0052848) |
| 0.0 | 0.6 | GO:0072349 | modified amino acid transmembrane transporter activity(GO:0072349) |
| 0.0 | 0.5 | GO:0043531 | ADP binding(GO:0043531) |
| 0.0 | 1.2 | GO:0003730 | mRNA 3'-UTR binding(GO:0003730) |
| 0.0 | 0.3 | GO:0005104 | fibroblast growth factor receptor binding(GO:0005104) |
| 0.0 | 0.3 | GO:0005537 | mannose binding(GO:0005537) |
| 0.0 | 0.1 | GO:0001515 | opioid peptide activity(GO:0001515) |
| 0.0 | 2.3 | GO:0008237 | metallopeptidase activity(GO:0008237) |
| 0.0 | 1.9 | GO:0003729 | mRNA binding(GO:0003729) poly(A) RNA binding(GO:0044822) |
| 0.0 | 0.1 | GO:0033038 | bitter taste receptor activity(GO:0033038) |
Gene overrepresentation in curated gene sets: canonical pathways category:
| Log-likelihood per target | Total log-likelihood | Term | Description |
|---|---|---|---|
| 1.1 | 30.5 | PID ARF 3PATHWAY | Arf1 pathway |
| 0.9 | 39.6 | PID INTEGRIN A9B1 PATHWAY | Alpha9 beta1 integrin signaling events |
| 0.9 | 33.6 | SA MMP CYTOKINE CONNECTION | Cytokines can induce activation of matrix metalloproteinases, which degrade extracellular matrix. |
| 0.8 | 29.6 | PID EPHA2 FWD PATHWAY | EPHA2 forward signaling |
| 0.6 | 38.7 | ST ADRENERGIC | Adrenergic Pathway |
| 0.5 | 14.3 | PID SYNDECAN 3 PATHWAY | Syndecan-3-mediated signaling events |
| 0.5 | 6.5 | ST G ALPHA S PATHWAY | G alpha s Pathway |
| 0.5 | 44.0 | PID P75 NTR PATHWAY | p75(NTR)-mediated signaling |
| 0.4 | 14.4 | PID WNT SIGNALING PATHWAY | Wnt signaling network |
| 0.4 | 25.3 | PID TCR CALCIUM PATHWAY | Calcium signaling in the CD4+ TCR pathway |
| 0.4 | 23.0 | PID EPHB FWD PATHWAY | EPHB forward signaling |
| 0.4 | 37.9 | PID CDC42 PATHWAY | CDC42 signaling events |
| 0.3 | 4.5 | SA CASPASE CASCADE | Apoptosis is mediated by caspases, cysteine proteases arranged in a proteolytic cascade. |
| 0.3 | 6.1 | SIG INSULIN RECEPTOR PATHWAY IN CARDIAC MYOCYTES | Genes related to the insulin receptor pathway |
| 0.3 | 8.6 | PID P38 MKK3 6PATHWAY | p38 MAPK signaling pathway |
| 0.2 | 1.7 | PID PI3KCI AKT PATHWAY | Class I PI3K signaling events mediated by Akt |
| 0.2 | 7.9 | PID INSULIN GLUCOSE PATHWAY | Insulin-mediated glucose transport |
| 0.2 | 11.4 | PID CDC42 REG PATHWAY | Regulation of CDC42 activity |
| 0.2 | 7.8 | PID AURORA A PATHWAY | Aurora A signaling |
| 0.2 | 6.6 | SIG CD40PATHWAYMAP | Genes related to CD40 signaling |
| 0.2 | 2.8 | SA G1 AND S PHASES | Cdk2, 4, and 6 bind cyclin D in G1, while cdk2/cyclin E promotes the G1/S transition. |
| 0.2 | 12.9 | ST FAS SIGNALING PATHWAY | Fas Signaling Pathway |
| 0.2 | 5.2 | PID TRAIL PATHWAY | TRAIL signaling pathway |
| 0.2 | 5.8 | PID DNA PK PATHWAY | DNA-PK pathway in nonhomologous end joining |
| 0.2 | 5.2 | PID HIF1A PATHWAY | Hypoxic and oxygen homeostasis regulation of HIF-1-alpha |
| 0.2 | 3.6 | PID INTEGRIN4 PATHWAY | Alpha6 beta4 integrin-ligand interactions |
| 0.2 | 18.3 | PID MYC REPRESS PATHWAY | Validated targets of C-MYC transcriptional repression |
| 0.2 | 7.5 | PID MYC PATHWAY | C-MYC pathway |
| 0.2 | 11.3 | PID HDAC CLASSII PATHWAY | Signaling events mediated by HDAC Class II |
| 0.2 | 8.4 | WNT SIGNALING | Genes related to Wnt-mediated signal transduction |
| 0.2 | 13.3 | PID ERA GENOMIC PATHWAY | Validated nuclear estrogen receptor alpha network |
| 0.2 | 2.7 | PID WNT NONCANONICAL PATHWAY | Noncanonical Wnt signaling pathway |
| 0.1 | 5.1 | PID LIS1 PATHWAY | Lissencephaly gene (LIS1) in neuronal migration and development |
| 0.1 | 3.6 | SIG REGULATION OF THE ACTIN CYTOSKELETON BY RHO GTPASES | Genes related to regulation of the actin cytoskeleton |
| 0.1 | 5.9 | PID AURORA B PATHWAY | Aurora B signaling |
| 0.1 | 7.1 | PID ATR PATHWAY | ATR signaling pathway |
| 0.1 | 7.4 | PID ARF6 TRAFFICKING PATHWAY | Arf6 trafficking events |
| 0.1 | 11.2 | PID MYC ACTIV PATHWAY | Validated targets of C-MYC transcriptional activation |
| 0.1 | 13.7 | PID BETA CATENIN NUC PATHWAY | Regulation of nuclear beta catenin signaling and target gene transcription |
| 0.1 | 2.0 | PID PS1 PATHWAY | Presenilin action in Notch and Wnt signaling |
| 0.1 | 0.3 | PID EPO PATHWAY | EPO signaling pathway |
| 0.1 | 4.2 | PID HNF3A PATHWAY | FOXA1 transcription factor network |
| 0.1 | 1.2 | PID ATF2 PATHWAY | ATF-2 transcription factor network |
| 0.1 | 2.8 | PID ARF6 PATHWAY | Arf6 signaling events |
| 0.1 | 4.9 | PID P73PATHWAY | p73 transcription factor network |
| 0.1 | 7.1 | PID SMAD2 3NUCLEAR PATHWAY | Regulation of nuclear SMAD2/3 signaling |
| 0.1 | 2.0 | PID RAC1 PATHWAY | RAC1 signaling pathway |
| 0.1 | 3.3 | PID E2F PATHWAY | E2F transcription factor network |
| 0.1 | 4.1 | PID TAP63 PATHWAY | Validated transcriptional targets of TAp63 isoforms |
| 0.1 | 4.1 | PID REG GR PATHWAY | Glucocorticoid receptor regulatory network |
| 0.1 | 3.5 | PID AR TF PATHWAY | Regulation of Androgen receptor activity |
| 0.1 | 4.8 | PID RHOA REG PATHWAY | Regulation of RhoA activity |
| 0.1 | 0.5 | PID THROMBIN PAR1 PATHWAY | PAR1-mediated thrombin signaling events |
| 0.1 | 1.3 | PID SMAD2 3PATHWAY | Regulation of cytoplasmic and nuclear SMAD2/3 signaling |
| 0.1 | 1.5 | PID RHOA PATHWAY | RhoA signaling pathway |
| 0.1 | 1.2 | ST DIFFERENTIATION PATHWAY IN PC12 CELLS | Differentiation Pathway in PC12 Cells; this is a specific case of PAC1 Receptor Pathway. |
| 0.1 | 2.5 | PID FGF PATHWAY | FGF signaling pathway |
| 0.1 | 11.7 | NABA ECM GLYCOPROTEINS | Genes encoding structural ECM glycoproteins |
| 0.1 | 5.7 | PID P53 DOWNSTREAM PATHWAY | Direct p53 effectors |
| 0.0 | 0.4 | PID AVB3 INTEGRIN PATHWAY | Integrins in angiogenesis |
| 0.0 | 1.5 | PID HIF2PATHWAY | HIF-2-alpha transcription factor network |
| 0.0 | 1.3 | PID IL23 PATHWAY | IL23-mediated signaling events |
| 0.0 | 0.9 | PID ILK PATHWAY | Integrin-linked kinase signaling |
| 0.0 | 0.1 | PID IL6 7 PATHWAY | IL6-mediated signaling events |
Gene overrepresentation in curated gene sets: REACTOME pathways category:
| Log-likelihood per target | Total log-likelihood | Term | Description |
|---|---|---|---|
| 1.6 | 32.9 | REACTOME GAP JUNCTION DEGRADATION | Genes involved in Gap junction degradation |
| 1.3 | 47.8 | REACTOME SYNTHESIS SECRETION AND INACTIVATION OF GIP | Genes involved in Synthesis, Secretion, and Inactivation of Glucose-dependent Insulinotropic Polypeptide (GIP) |
| 1.1 | 30.5 | REACTOME INSULIN RECEPTOR RECYCLING | Genes involved in Insulin receptor recycling |
| 0.8 | 24.7 | REACTOME BOTULINUM NEUROTOXICITY | Genes involved in Botulinum neurotoxicity |
| 0.8 | 48.5 | REACTOME MITOCHONDRIAL PROTEIN IMPORT | Genes involved in Mitochondrial Protein Import |
| 0.8 | 18.7 | REACTOME HYALURONAN UPTAKE AND DEGRADATION | Genes involved in Hyaluronan uptake and degradation |
| 0.7 | 18.6 | REACTOME P130CAS LINKAGE TO MAPK SIGNALING FOR INTEGRINS | Genes involved in p130Cas linkage to MAPK signaling for integrins |
| 0.6 | 45.2 | REACTOME NRAGE SIGNALS DEATH THROUGH JNK | Genes involved in NRAGE signals death through JNK |
| 0.6 | 18.6 | REACTOME JNK C JUN KINASES PHOSPHORYLATION AND ACTIVATION MEDIATED BY ACTIVATED HUMAN TAK1 | Genes involved in JNK (c-Jun kinases) phosphorylation and activation mediated by activated human TAK1 |
| 0.6 | 17.5 | REACTOME POST CHAPERONIN TUBULIN FOLDING PATHWAY | Genes involved in Post-chaperonin tubulin folding pathway |
| 0.6 | 52.4 | REACTOME DESTABILIZATION OF MRNA BY AUF1 HNRNP D0 | Genes involved in Destabilization of mRNA by AUF1 (hnRNP D0) |
| 0.6 | 13.7 | REACTOME HORMONE SENSITIVE LIPASE HSL MEDIATED TRIACYLGLYCEROL HYDROLYSIS | Genes involved in Hormone-sensitive lipase (HSL)-mediated triacylglycerol hydrolysis |
| 0.6 | 15.4 | REACTOME CRMPS IN SEMA3A SIGNALING | Genes involved in CRMPs in Sema3A signaling |
| 0.5 | 5.4 | REACTOME COPI MEDIATED TRANSPORT | Genes involved in COPI Mediated Transport |
| 0.5 | 9.1 | REACTOME INSULIN SYNTHESIS AND PROCESSING | Genes involved in Insulin Synthesis and Processing |
| 0.5 | 3.3 | REACTOME ERKS ARE INACTIVATED | Genes involved in ERKs are inactivated |
| 0.4 | 1.7 | REACTOME GRB2 SOS PROVIDES LINKAGE TO MAPK SIGNALING FOR INTERGRINS | Genes involved in GRB2:SOS provides linkage to MAPK signaling for Intergrins |
| 0.4 | 5.9 | REACTOME RETROGRADE NEUROTROPHIN SIGNALLING | Genes involved in Retrograde neurotrophin signalling |
| 0.4 | 7.1 | REACTOME REGULATION OF PYRUVATE DEHYDROGENASE PDH COMPLEX | Genes involved in Regulation of pyruvate dehydrogenase (PDH) complex |
| 0.4 | 12.5 | REACTOME RAS ACTIVATION UOPN CA2 INFUX THROUGH NMDA RECEPTOR | Genes involved in Ras activation uopn Ca2+ infux through NMDA receptor |
| 0.4 | 20.2 | REACTOME DARPP 32 EVENTS | Genes involved in DARPP-32 events |
| 0.4 | 7.5 | REACTOME ARMS MEDIATED ACTIVATION | Genes involved in ARMS-mediated activation |
| 0.4 | 5.8 | REACTOME PURINE RIBONUCLEOSIDE MONOPHOSPHATE BIOSYNTHESIS | Genes involved in Purine ribonucleoside monophosphate biosynthesis |
| 0.4 | 6.7 | REACTOME BMAL1 CLOCK NPAS2 ACTIVATES CIRCADIAN EXPRESSION | Genes involved in BMAL1:CLOCK/NPAS2 Activates Circadian Expression |
| 0.4 | 7.4 | REACTOME METABOLISM OF POLYAMINES | Genes involved in Metabolism of polyamines |
| 0.4 | 13.9 | REACTOME CHOLESTEROL BIOSYNTHESIS | Genes involved in Cholesterol biosynthesis |
| 0.4 | 8.7 | REACTOME PURINE SALVAGE | Genes involved in Purine salvage |
| 0.3 | 5.4 | REACTOME CITRIC ACID CYCLE TCA CYCLE | Genes involved in Citric acid cycle (TCA cycle) |
| 0.3 | 13.9 | REACTOME INTERACTION BETWEEN L1 AND ANKYRINS | Genes involved in Interaction between L1 and Ankyrins |
| 0.3 | 6.7 | REACTOME CS DS DEGRADATION | Genes involved in CS/DS degradation |
| 0.3 | 1.1 | REACTOME SIGNALING BY NOTCH3 | Genes involved in Signaling by NOTCH3 |
| 0.3 | 11.0 | REACTOME SEMA4D INDUCED CELL MIGRATION AND GROWTH CONE COLLAPSE | Genes involved in Sema4D induced cell migration and growth-cone collapse |
| 0.3 | 13.0 | REACTOME PROTEIN FOLDING | Genes involved in Protein folding |
| 0.3 | 8.8 | REACTOME SYNTHESIS AND INTERCONVERSION OF NUCLEOTIDE DI AND TRIPHOSPHATES | Genes involved in Synthesis and interconversion of nucleotide di- and triphosphates |
| 0.3 | 3.7 | REACTOME SEROTONIN RECEPTORS | Genes involved in Serotonin receptors |
| 0.3 | 5.1 | REACTOME ADENYLATE CYCLASE INHIBITORY PATHWAY | Genes involved in Adenylate cyclase inhibitory pathway |
| 0.3 | 21.5 | REACTOME RESPIRATORY ELECTRON TRANSPORT | Genes involved in Respiratory electron transport |
| 0.3 | 16.1 | REACTOME GOLGI ASSOCIATED VESICLE BIOGENESIS | Genes involved in Golgi Associated Vesicle Biogenesis |
| 0.2 | 6.9 | REACTOME IONOTROPIC ACTIVITY OF KAINATE RECEPTORS | Genes involved in Ionotropic activity of Kainate Receptors |
| 0.2 | 3.2 | REACTOME P53 DEPENDENT G1 DNA DAMAGE RESPONSE | Genes involved in p53-Dependent G1 DNA Damage Response |
| 0.2 | 6.2 | REACTOME KINESINS | Genes involved in Kinesins |
| 0.2 | 6.7 | REACTOME METABOLISM OF PORPHYRINS | Genes involved in Metabolism of porphyrins |
| 0.2 | 8.2 | REACTOME SYNTHESIS OF PIPS AT THE PLASMA MEMBRANE | Genes involved in Synthesis of PIPs at the plasma membrane |
| 0.2 | 27.3 | REACTOME SIGNALING BY PDGF | Genes involved in Signaling by PDGF |
| 0.2 | 3.9 | REACTOME SIGNALING BY FGFR3 MUTANTS | Genes involved in Signaling by FGFR3 mutants |
| 0.2 | 3.0 | REACTOME SYNTHESIS OF PIPS AT THE GOLGI MEMBRANE | Genes involved in Synthesis of PIPs at the Golgi membrane |
| 0.2 | 8.1 | REACTOME SIGNALING BY ROBO RECEPTOR | Genes involved in Signaling by Robo receptor |
| 0.2 | 4.2 | REACTOME APOPTOTIC CLEAVAGE OF CELL ADHESION PROTEINS | Genes involved in Apoptotic cleavage of cell adhesion proteins |
| 0.2 | 3.4 | REACTOME PROCESSING OF INTRONLESS PRE MRNAS | Genes involved in Processing of Intronless Pre-mRNAs |
| 0.2 | 6.9 | REACTOME P75 NTR RECEPTOR MEDIATED SIGNALLING | Genes involved in p75 NTR receptor-mediated signalling |
| 0.2 | 1.2 | REACTOME SYNTHESIS OF PIPS AT THE EARLY ENDOSOME MEMBRANE | Genes involved in Synthesis of PIPs at the early endosome membrane |
| 0.2 | 7.8 | REACTOME GLYCOSPHINGOLIPID METABOLISM | Genes involved in Glycosphingolipid metabolism |
| 0.2 | 3.8 | REACTOME SULFUR AMINO ACID METABOLISM | Genes involved in Sulfur amino acid metabolism |
| 0.1 | 3.0 | REACTOME P38MAPK EVENTS | Genes involved in p38MAPK events |
| 0.1 | 10.3 | REACTOME LOSS OF NLP FROM MITOTIC CENTROSOMES | Genes involved in Loss of Nlp from mitotic centrosomes |
| 0.1 | 4.5 | REACTOME OXYGEN DEPENDENT PROLINE HYDROXYLATION OF HYPOXIA INDUCIBLE FACTOR ALPHA | Genes involved in Oxygen-dependent Proline Hydroxylation of Hypoxia-inducible Factor Alpha |
| 0.1 | 1.8 | REACTOME TRANSCRIPTION COUPLED NER TC NER | Genes involved in Transcription-coupled NER (TC-NER) |
| 0.1 | 2.3 | REACTOME THE NLRP3 INFLAMMASOME | Genes involved in The NLRP3 inflammasome |
| 0.1 | 4.2 | REACTOME SYNTHESIS OF PA | Genes involved in Synthesis of PA |
| 0.1 | 2.4 | REACTOME MRNA DECAY BY 5 TO 3 EXORIBONUCLEASE | Genes involved in mRNA Decay by 5' to 3' Exoribonuclease |
| 0.1 | 4.0 | REACTOME DOWNREGULATION OF SMAD2 3 SMAD4 TRANSCRIPTIONAL ACTIVITY | Genes involved in Downregulation of SMAD2/3:SMAD4 transcriptional activity |
| 0.1 | 2.6 | REACTOME INTEGRIN ALPHAIIB BETA3 SIGNALING | Genes involved in Integrin alphaIIb beta3 signaling |
| 0.1 | 1.9 | REACTOME CTNNB1 PHOSPHORYLATION CASCADE | Genes involved in Beta-catenin phosphorylation cascade |
| 0.1 | 2.1 | REACTOME INTEGRATION OF PROVIRUS | Genes involved in Integration of provirus |
| 0.1 | 4.1 | REACTOME EXTENSION OF TELOMERES | Genes involved in Extension of Telomeres |
| 0.1 | 1.8 | REACTOME MITOCHONDRIAL FATTY ACID BETA OXIDATION | Genes involved in Mitochondrial Fatty Acid Beta-Oxidation |
| 0.1 | 5.7 | REACTOME ION TRANSPORT BY P TYPE ATPASES | Genes involved in Ion transport by P-type ATPases |
| 0.1 | 5.2 | REACTOME NCAM1 INTERACTIONS | Genes involved in NCAM1 interactions |
| 0.1 | 3.6 | REACTOME INTERACTIONS OF VPR WITH HOST CELLULAR PROTEINS | Genes involved in Interactions of Vpr with host cellular proteins |
| 0.1 | 1.3 | REACTOME HORMONE LIGAND BINDING RECEPTORS | Genes involved in Hormone ligand-binding receptors |
| 0.1 | 5.1 | REACTOME ANTIVIRAL MECHANISM BY IFN STIMULATED GENES | Genes involved in Antiviral mechanism by IFN-stimulated genes |
| 0.1 | 1.9 | REACTOME VIRAL MESSENGER RNA SYNTHESIS | Genes involved in Viral Messenger RNA Synthesis |
| 0.1 | 6.5 | REACTOME AMINO ACID AND OLIGOPEPTIDE SLC TRANSPORTERS | Genes involved in Amino acid and oligopeptide SLC transporters |
| 0.1 | 6.1 | REACTOME LATE PHASE OF HIV LIFE CYCLE | Genes involved in Late Phase of HIV Life Cycle |
| 0.1 | 7.4 | REACTOME SIGNALING BY RHO GTPASES | Genes involved in Signaling by Rho GTPases |
| 0.1 | 2.2 | REACTOME DEGRADATION OF THE EXTRACELLULAR MATRIX | Genes involved in Degradation of the extracellular matrix |
| 0.1 | 0.9 | REACTOME SIGNALING BY FGFR1 FUSION MUTANTS | Genes involved in Signaling by FGFR1 fusion mutants |
| 0.1 | 0.9 | REACTOME NOTCH HLH TRANSCRIPTION PATHWAY | Genes involved in Notch-HLH transcription pathway |
| 0.1 | 0.7 | REACTOME INFLAMMASOMES | Genes involved in Inflammasomes |
| 0.1 | 1.4 | REACTOME REGULATION OF COMPLEMENT CASCADE | Genes involved in Regulation of Complement cascade |
| 0.1 | 0.7 | REACTOME ACTIVATION OF CHAPERONE GENES BY ATF6 ALPHA | Genes involved in Activation of Chaperone Genes by ATF6-alpha |
| 0.0 | 1.3 | REACTOME CELL EXTRACELLULAR MATRIX INTERACTIONS | Genes involved in Cell-extracellular matrix interactions |
| 0.0 | 1.1 | REACTOME SIGNAL TRANSDUCTION BY L1 | Genes involved in Signal transduction by L1 |
| 0.0 | 2.1 | REACTOME MHC CLASS II ANTIGEN PRESENTATION | Genes involved in MHC class II antigen presentation |
| 0.0 | 0.5 | REACTOME VITAMIN B5 PANTOTHENATE METABOLISM | Genes involved in Vitamin B5 (pantothenate) metabolism |
| 0.0 | 0.6 | REACTOME NUCLEOTIDE LIKE PURINERGIC RECEPTORS | Genes involved in Nucleotide-like (purinergic) receptors |
| 0.0 | 0.4 | REACTOME DOWNSTREAM SIGNALING EVENTS OF B CELL RECEPTOR BCR | Genes involved in Downstream Signaling Events Of B Cell Receptor (BCR) |
| 0.0 | 0.9 | REACTOME RNA POL III TRANSCRIPTION | Genes involved in RNA Polymerase III Transcription |
| 0.0 | 0.9 | REACTOME MYOGENESIS | Genes involved in Myogenesis |
| 0.0 | 0.2 | REACTOME PROSTANOID LIGAND RECEPTORS | Genes involved in Prostanoid ligand receptors |