Project
GNF SymAtlas + NCI-60 cancer cell lines, human (Su, 2004; Ross, 2000)
Navigation
Downloads
Results for MEIS3_TGIF2LX
Z-value: 0.72
Motif logo
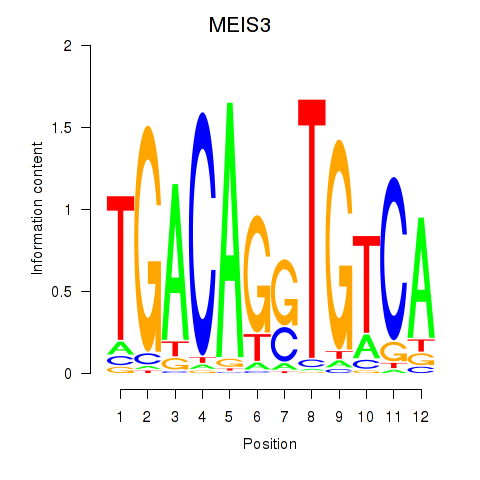
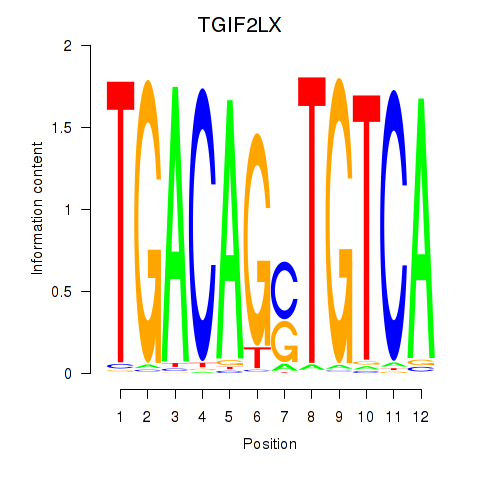
Transcription factors associated with MEIS3_TGIF2LX
| Gene Symbol | Gene ID | Gene Info |
|---|---|---|
|
MEIS3
|
ENSG00000105419.18 | MEIS3 |
|
TGIF2LX
|
ENSG00000153779.11 | TGIF2LX |
Activity profile of MEIS3_TGIF2LX motif
Sorted Z-values of MEIS3_TGIF2LX motif
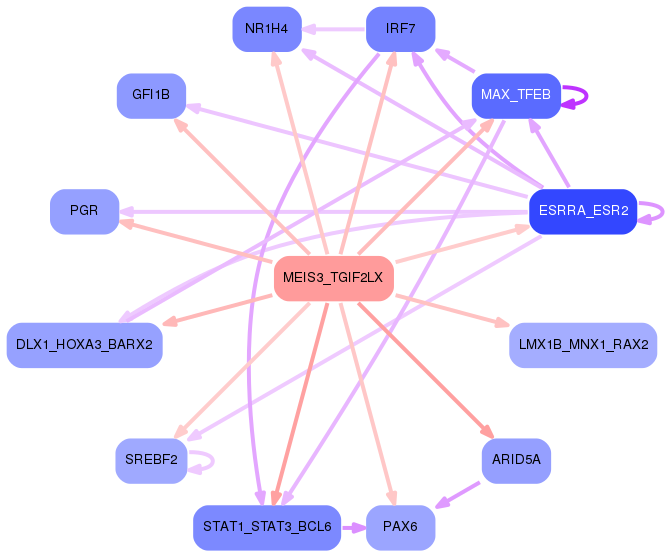
Network of associatons between targets according to the STRING database.

First level regulatory network of MEIS3_TGIF2LX
Gene Ontology Analysis
Gene overrepresentation in biological process category:
| Log-likelihood per target | Total log-likelihood | Term | Description |
|---|---|---|---|
| 2.9 | 8.6 | GO:0006982 | response to lipid hydroperoxide(GO:0006982) |
| 1.9 | 7.5 | GO:1902283 | negative regulation of primary amine oxidase activity(GO:1902283) |
| 1.7 | 5.0 | GO:2000296 | negative regulation of hydrogen peroxide catabolic process(GO:2000296) |
| 1.3 | 6.6 | GO:0070295 | renal water absorption(GO:0070295) |
| 1.2 | 3.5 | GO:1902303 | regulation of heart rate by hormone(GO:0003064) negative regulation of potassium ion export(GO:1902303) |
| 1.1 | 4.4 | GO:0048294 | negative regulation of mast cell cytokine production(GO:0032764) negative regulation of isotype switching to IgE isotypes(GO:0048294) |
| 0.9 | 4.5 | GO:0035995 | detection of muscle stretch(GO:0035995) |
| 0.9 | 4.4 | GO:0033277 | abortive mitotic cell cycle(GO:0033277) |
| 0.9 | 2.6 | GO:2000118 | regulation of sodium-dependent phosphate transport(GO:2000118) |
| 0.8 | 3.1 | GO:0015855 | pyrimidine nucleobase transport(GO:0015855) purine nucleobase transmembrane transport(GO:1904823) |
| 0.8 | 2.3 | GO:0035928 | mitochondrial RNA 3'-end processing(GO:0000965) miRNA catabolic process(GO:0010587) rRNA import into mitochondrion(GO:0035928) |
| 0.7 | 6.1 | GO:0042118 | endothelial cell activation(GO:0042118) |
| 0.6 | 1.8 | GO:1904017 | cellular response to Thyroglobulin triiodothyronine(GO:1904017) |
| 0.6 | 1.8 | GO:0002101 | tRNA wobble cytosine modification(GO:0002101) |
| 0.6 | 8.8 | GO:0045721 | negative regulation of gluconeogenesis(GO:0045721) |
| 0.6 | 4.7 | GO:0034316 | negative regulation of Arp2/3 complex-mediated actin nucleation(GO:0034316) |
| 0.6 | 2.3 | GO:1903413 | cellular response to bile acid(GO:1903413) |
| 0.6 | 8.5 | GO:0006600 | creatine metabolic process(GO:0006600) |
| 0.5 | 4.4 | GO:0015705 | iodide transport(GO:0015705) |
| 0.5 | 7.0 | GO:0071313 | cellular response to caffeine(GO:0071313) |
| 0.5 | 3.2 | GO:2000503 | positive regulation of natural killer cell chemotaxis(GO:2000503) |
| 0.5 | 1.6 | GO:0002143 | tRNA wobble position uridine thiolation(GO:0002143) |
| 0.5 | 2.0 | GO:0021615 | glossopharyngeal nerve morphogenesis(GO:0021615) |
| 0.5 | 1.5 | GO:1901877 | regulation of calcium ion binding(GO:1901876) negative regulation of calcium ion binding(GO:1901877) |
| 0.5 | 1.9 | GO:0060023 | soft palate development(GO:0060023) |
| 0.5 | 1.9 | GO:0038098 | sequestering of BMP from receptor via BMP binding(GO:0038098) |
| 0.4 | 1.3 | GO:0015917 | aminophospholipid transport(GO:0015917) |
| 0.4 | 3.0 | GO:1903433 | regulation of constitutive secretory pathway(GO:1903433) |
| 0.4 | 5.7 | GO:0046007 | negative regulation of activated T cell proliferation(GO:0046007) |
| 0.4 | 3.2 | GO:0010936 | negative regulation of macrophage cytokine production(GO:0010936) |
| 0.4 | 1.6 | GO:0090472 | viral protein processing(GO:0019082) regulation of nerve growth factor production(GO:0032903) negative regulation of nerve growth factor production(GO:0032904) dibasic protein processing(GO:0090472) |
| 0.4 | 2.6 | GO:0042421 | norepinephrine biosynthetic process(GO:0042421) |
| 0.4 | 2.9 | GO:1902951 | negative regulation of dendritic spine maintenance(GO:1902951) |
| 0.4 | 1.1 | GO:0072233 | thick ascending limb development(GO:0072023) metanephric thick ascending limb development(GO:0072233) |
| 0.4 | 2.1 | GO:0070092 | glucagon secretion(GO:0070091) regulation of glucagon secretion(GO:0070092) |
| 0.3 | 1.4 | GO:1900147 | Schwann cell migration(GO:0036135) regulation of Schwann cell migration(GO:1900147) |
| 0.3 | 2.9 | GO:0033578 | protein glycosylation in Golgi(GO:0033578) |
| 0.3 | 2.9 | GO:0086024 | adrenergic receptor signaling pathway involved in positive regulation of heart rate(GO:0086024) |
| 0.3 | 2.1 | GO:0046465 | dolichyl diphosphate biosynthetic process(GO:0006489) dolichyl diphosphate metabolic process(GO:0046465) |
| 0.3 | 3.6 | GO:0006451 | selenocysteine incorporation(GO:0001514) translational readthrough(GO:0006451) |
| 0.3 | 3.2 | GO:0048007 | antigen processing and presentation of lipid antigen via MHC class Ib(GO:0048003) antigen processing and presentation, exogenous lipid antigen via MHC class Ib(GO:0048007) |
| 0.3 | 10.8 | GO:0045730 | respiratory burst(GO:0045730) |
| 0.3 | 1.9 | GO:0021999 | neural plate anterior/posterior regionalization(GO:0021999) |
| 0.2 | 1.2 | GO:0060748 | tertiary branching involved in mammary gland duct morphogenesis(GO:0060748) |
| 0.2 | 1.2 | GO:0043456 | regulation of pentose-phosphate shunt(GO:0043456) |
| 0.2 | 1.2 | GO:2000110 | regulation of MyD88-dependent toll-like receptor signaling pathway(GO:0034124) negative regulation of macrophage apoptotic process(GO:2000110) |
| 0.2 | 0.8 | GO:0010760 | negative regulation of macrophage chemotaxis(GO:0010760) |
| 0.2 | 2.0 | GO:0034058 | endosomal vesicle fusion(GO:0034058) |
| 0.2 | 3.2 | GO:0019800 | peptide cross-linking via chondroitin 4-sulfate glycosaminoglycan(GO:0019800) |
| 0.2 | 5.6 | GO:1901687 | glutathione derivative metabolic process(GO:1901685) glutathione derivative biosynthetic process(GO:1901687) |
| 0.2 | 3.3 | GO:0031573 | intra-S DNA damage checkpoint(GO:0031573) |
| 0.2 | 2.9 | GO:0006702 | androgen biosynthetic process(GO:0006702) |
| 0.2 | 4.5 | GO:0045332 | lipid translocation(GO:0034204) phospholipid translocation(GO:0045332) |
| 0.2 | 11.2 | GO:0071391 | cellular response to estrogen stimulus(GO:0071391) |
| 0.2 | 5.9 | GO:0035338 | long-chain fatty-acyl-CoA biosynthetic process(GO:0035338) |
| 0.2 | 0.8 | GO:0009450 | gamma-aminobutyric acid catabolic process(GO:0009450) |
| 0.1 | 1.0 | GO:0046449 | creatinine metabolic process(GO:0046449) |
| 0.1 | 2.7 | GO:0010510 | regulation of acetyl-CoA biosynthetic process from pyruvate(GO:0010510) |
| 0.1 | 1.3 | GO:0046185 | aldehyde catabolic process(GO:0046185) |
| 0.1 | 2.1 | GO:1902260 | negative regulation of delayed rectifier potassium channel activity(GO:1902260) |
| 0.1 | 0.9 | GO:0002933 | lipid hydroxylation(GO:0002933) |
| 0.1 | 17.1 | GO:0030449 | regulation of complement activation(GO:0030449) |
| 0.1 | 1.5 | GO:0045075 | interleukin-12 biosynthetic process(GO:0042090) regulation of interleukin-12 biosynthetic process(GO:0045075) |
| 0.1 | 5.3 | GO:0043278 | response to isoquinoline alkaloid(GO:0014072) response to morphine(GO:0043278) |
| 0.1 | 0.6 | GO:1904565 | response to 1-oleoyl-sn-glycerol 3-phosphate(GO:1904565) cellular response to 1-oleoyl-sn-glycerol 3-phosphate(GO:1904566) |
| 0.1 | 0.9 | GO:0035694 | mitochondrial protein catabolic process(GO:0035694) |
| 0.1 | 1.8 | GO:0015732 | prostaglandin transport(GO:0015732) |
| 0.1 | 1.0 | GO:0035860 | glial cell-derived neurotrophic factor receptor signaling pathway(GO:0035860) |
| 0.1 | 1.6 | GO:0018298 | protein-chromophore linkage(GO:0018298) |
| 0.1 | 4.0 | GO:0035082 | axoneme assembly(GO:0035082) |
| 0.1 | 0.9 | GO:0031087 | deadenylation-independent decapping of nuclear-transcribed mRNA(GO:0031087) |
| 0.1 | 4.3 | GO:1904031 | positive regulation of cyclin-dependent protein kinase activity(GO:1904031) |
| 0.1 | 10.6 | GO:0005977 | glycogen metabolic process(GO:0005977) |
| 0.1 | 1.2 | GO:0006449 | regulation of translational termination(GO:0006449) |
| 0.1 | 1.5 | GO:0030277 | maintenance of gastrointestinal epithelium(GO:0030277) |
| 0.1 | 0.3 | GO:2000364 | cardiac muscle tissue regeneration(GO:0061026) regulation of STAT protein import into nucleus(GO:2000364) positive regulation of STAT protein import into nucleus(GO:2000366) |
| 0.1 | 0.4 | GO:0035521 | monoubiquitinated histone deubiquitination(GO:0035521) monoubiquitinated histone H2A deubiquitination(GO:0035522) |
| 0.1 | 0.9 | GO:0036155 | acylglycerol acyl-chain remodeling(GO:0036155) |
| 0.1 | 0.7 | GO:0010265 | SCF complex assembly(GO:0010265) |
| 0.1 | 2.1 | GO:0051895 | negative regulation of focal adhesion assembly(GO:0051895) |
| 0.1 | 1.2 | GO:2000353 | positive regulation of endothelial cell apoptotic process(GO:2000353) |
| 0.1 | 2.4 | GO:0033198 | response to ATP(GO:0033198) |
| 0.1 | 1.2 | GO:0005513 | detection of calcium ion(GO:0005513) |
| 0.1 | 0.2 | GO:0038195 | urokinase plasminogen activator signaling pathway(GO:0038195) |
| 0.1 | 2.3 | GO:0050982 | detection of mechanical stimulus(GO:0050982) |
| 0.1 | 0.5 | GO:0033629 | negative regulation of cell adhesion mediated by integrin(GO:0033629) |
| 0.1 | 3.2 | GO:0015701 | bicarbonate transport(GO:0015701) |
| 0.1 | 0.7 | GO:0098909 | regulation of cardiac muscle cell action potential involved in regulation of contraction(GO:0098909) |
| 0.1 | 2.1 | GO:0043276 | anoikis(GO:0043276) |
| 0.1 | 0.6 | GO:0043152 | induction of bacterial agglutination(GO:0043152) |
| 0.1 | 2.0 | GO:0071480 | cellular response to gamma radiation(GO:0071480) |
| 0.0 | 0.3 | GO:0000707 | meiotic DNA recombinase assembly(GO:0000707) |
| 0.0 | 0.3 | GO:0016554 | cytidine to uridine editing(GO:0016554) |
| 0.0 | 1.4 | GO:0010107 | potassium ion import(GO:0010107) |
| 0.0 | 1.8 | GO:0030212 | hyaluronan metabolic process(GO:0030212) |
| 0.0 | 0.9 | GO:0016973 | poly(A)+ mRNA export from nucleus(GO:0016973) |
| 0.0 | 0.9 | GO:0046597 | negative regulation of viral entry into host cell(GO:0046597) |
| 0.0 | 0.1 | GO:0090370 | negative regulation of cholesterol efflux(GO:0090370) |
| 0.0 | 7.3 | GO:0035725 | sodium ion transmembrane transport(GO:0035725) |
| 0.0 | 5.3 | GO:0022617 | extracellular matrix disassembly(GO:0022617) |
| 0.0 | 0.3 | GO:0070995 | NADPH oxidation(GO:0070995) |
| 0.0 | 1.1 | GO:0016338 | calcium-independent cell-cell adhesion via plasma membrane cell-adhesion molecules(GO:0016338) |
| 0.0 | 0.2 | GO:1901525 | negative regulation of macromitophagy(GO:1901525) |
| 0.0 | 1.7 | GO:0007040 | lysosome organization(GO:0007040) lytic vacuole organization(GO:0080171) |
| 0.0 | 1.0 | GO:0007340 | acrosome reaction(GO:0007340) |
| 0.0 | 0.8 | GO:1903846 | positive regulation of transforming growth factor beta receptor signaling pathway(GO:0030511) positive regulation of cellular response to transforming growth factor beta stimulus(GO:1903846) |
| 0.0 | 1.9 | GO:0010633 | negative regulation of epithelial cell migration(GO:0010633) |
| 0.0 | 1.6 | GO:0001895 | retina homeostasis(GO:0001895) |
| 0.0 | 0.4 | GO:0043517 | positive regulation of DNA damage response, signal transduction by p53 class mediator(GO:0043517) |
| 0.0 | 2.3 | GO:0050911 | detection of chemical stimulus involved in sensory perception of smell(GO:0050911) |
| 0.0 | 0.1 | GO:2001271 | negative regulation of cysteine-type endopeptidase activity involved in execution phase of apoptosis(GO:2001271) |
| 0.0 | 2.6 | GO:0007586 | digestion(GO:0007586) |
| 0.0 | 1.5 | GO:0032006 | regulation of TOR signaling(GO:0032006) |
| 0.0 | 0.4 | GO:0060080 | inhibitory postsynaptic potential(GO:0060080) |
| 0.0 | 0.6 | GO:0007271 | synaptic transmission, cholinergic(GO:0007271) |
| 0.0 | 2.0 | GO:0035335 | peptidyl-tyrosine dephosphorylation(GO:0035335) |
| 0.0 | 0.3 | GO:0060397 | JAK-STAT cascade involved in growth hormone signaling pathway(GO:0060397) |
| 0.0 | 2.9 | GO:0060271 | cilium morphogenesis(GO:0060271) |
| 0.0 | 1.2 | GO:0006334 | nucleosome assembly(GO:0006334) |
| 0.0 | 0.7 | GO:0019933 | cAMP-mediated signaling(GO:0019933) |
Gene overrepresentation in cellular component category:
| Log-likelihood per target | Total log-likelihood | Term | Description |
|---|---|---|---|
| 1.2 | 5.0 | GO:0031838 | haptoglobin-hemoglobin complex(GO:0031838) |
| 1.2 | 10.8 | GO:0032010 | phagolysosome(GO:0032010) |
| 0.7 | 2.9 | GO:1990393 | 3M complex(GO:1990393) |
| 0.7 | 3.5 | GO:1902937 | inward rectifier potassium channel complex(GO:1902937) |
| 0.6 | 1.9 | GO:0005592 | collagen type XI trimer(GO:0005592) |
| 0.5 | 1.5 | GO:0070701 | mucus layer(GO:0070701) |
| 0.4 | 2.7 | GO:0005967 | mitochondrial pyruvate dehydrogenase complex(GO:0005967) |
| 0.4 | 4.4 | GO:0042105 | alpha-beta T cell receptor complex(GO:0042105) |
| 0.4 | 7.0 | GO:1990454 | L-type voltage-gated calcium channel complex(GO:1990454) |
| 0.3 | 7.3 | GO:0044453 | integral component of nuclear inner membrane(GO:0005639) intrinsic component of nuclear inner membrane(GO:0031229) nuclear membrane part(GO:0044453) |
| 0.3 | 2.6 | GO:0042584 | chromaffin granule membrane(GO:0042584) |
| 0.2 | 2.0 | GO:0016012 | sarcoglycan complex(GO:0016012) |
| 0.2 | 0.9 | GO:0042272 | nuclear RNA export factor complex(GO:0042272) |
| 0.2 | 2.3 | GO:0042788 | polysomal ribosome(GO:0042788) |
| 0.2 | 3.3 | GO:0042589 | zymogen granule membrane(GO:0042589) |
| 0.2 | 0.7 | GO:0044307 | dendritic branch(GO:0044307) |
| 0.2 | 2.1 | GO:0008385 | IkappaB kinase complex(GO:0008385) |
| 0.2 | 2.0 | GO:0030897 | HOPS complex(GO:0030897) |
| 0.2 | 4.5 | GO:0090665 | dystrophin-associated glycoprotein complex(GO:0016010) glycoprotein complex(GO:0090665) |
| 0.1 | 0.4 | GO:0035517 | PR-DUB complex(GO:0035517) |
| 0.1 | 2.3 | GO:0001931 | uropod(GO:0001931) cell trailing edge(GO:0031254) |
| 0.1 | 2.9 | GO:0034451 | centriolar satellite(GO:0034451) |
| 0.1 | 7.2 | GO:0005902 | microvillus(GO:0005902) |
| 0.1 | 1.6 | GO:0097381 | photoreceptor disc membrane(GO:0097381) |
| 0.1 | 5.3 | GO:0005834 | heterotrimeric G-protein complex(GO:0005834) |
| 0.1 | 1.2 | GO:0000786 | nucleosome(GO:0000786) |
| 0.1 | 4.7 | GO:0005657 | replication fork(GO:0005657) |
| 0.1 | 0.3 | GO:1990031 | pinceau fiber(GO:1990031) |
| 0.1 | 2.9 | GO:0005891 | voltage-gated calcium channel complex(GO:0005891) |
| 0.1 | 1.4 | GO:0044295 | axonal growth cone(GO:0044295) |
| 0.0 | 2.2 | GO:0005796 | Golgi lumen(GO:0005796) |
| 0.0 | 0.6 | GO:0005577 | fibrinogen complex(GO:0005577) |
| 0.0 | 1.6 | GO:0030140 | trans-Golgi network transport vesicle(GO:0030140) |
| 0.0 | 4.0 | GO:0097014 | axoneme(GO:0005930) ciliary plasm(GO:0097014) |
| 0.0 | 1.8 | GO:0005762 | organellar large ribosomal subunit(GO:0000315) mitochondrial large ribosomal subunit(GO:0005762) |
| 0.0 | 3.2 | GO:0043202 | lysosomal lumen(GO:0043202) |
| 0.0 | 5.6 | GO:0034705 | voltage-gated potassium channel complex(GO:0008076) potassium channel complex(GO:0034705) |
| 0.0 | 5.0 | GO:0005884 | actin filament(GO:0005884) |
| 0.0 | 0.5 | GO:0005642 | annulate lamellae(GO:0005642) |
| 0.0 | 1.5 | GO:0033017 | sarcoplasmic reticulum membrane(GO:0033017) |
| 0.0 | 0.3 | GO:0032585 | multivesicular body membrane(GO:0032585) |
| 0.0 | 1.3 | GO:0035577 | azurophil granule membrane(GO:0035577) |
| 0.0 | 0.2 | GO:0005827 | polar microtubule(GO:0005827) |
| 0.0 | 45.1 | GO:0005615 | extracellular space(GO:0005615) |
| 0.0 | 0.6 | GO:0005892 | acetylcholine-gated channel complex(GO:0005892) |
| 0.0 | 3.1 | GO:0008021 | synaptic vesicle(GO:0008021) |
| 0.0 | 0.1 | GO:0032937 | SREBP-SCAP-Insig complex(GO:0032937) |
| 0.0 | 5.4 | GO:0098852 | lysosomal membrane(GO:0005765) lytic vacuole membrane(GO:0098852) |
| 0.0 | 0.6 | GO:0043198 | dendritic shaft(GO:0043198) |
| 0.0 | 6.9 | GO:0005929 | cilium(GO:0005929) |
| 0.0 | 7.7 | GO:0005911 | cell-cell junction(GO:0005911) |
| 0.0 | 1.3 | GO:0035579 | specific granule membrane(GO:0035579) |
| 0.0 | 2.5 | GO:0009897 | external side of plasma membrane(GO:0009897) |
| 0.0 | 2.7 | GO:0005578 | proteinaceous extracellular matrix(GO:0005578) |
| 0.0 | 0.7 | GO:0019005 | SCF ubiquitin ligase complex(GO:0019005) |
| 0.0 | 1.0 | GO:0031225 | anchored component of membrane(GO:0031225) |
| 0.0 | 0.3 | GO:0031904 | endosome lumen(GO:0031904) |
| 0.0 | 0.2 | GO:0071782 | endoplasmic reticulum tubular network(GO:0071782) |
| 0.0 | 0.4 | GO:1902711 | GABA-A receptor complex(GO:1902711) |
| 0.0 | 0.9 | GO:0005811 | lipid particle(GO:0005811) |
Gene overrepresentation in molecular function category:
| Log-likelihood per target | Total log-likelihood | Term | Description |
|---|---|---|---|
| 1.9 | 7.5 | GO:0052594 | tryptamine:oxygen oxidoreductase (deaminating) activity(GO:0052593) aminoacetone:oxygen oxidoreductase(deaminating) activity(GO:0052594) aliphatic-amine oxidase activity(GO:0052595) phenethylamine:oxygen oxidoreductase (deaminating) activity(GO:0052596) |
| 1.7 | 6.6 | GO:0015254 | glycerol channel activity(GO:0015254) |
| 1.4 | 10.8 | GO:0016176 | superoxide-generating NADPH oxidase activator activity(GO:0016176) |
| 1.3 | 10.6 | GO:0004865 | protein serine/threonine phosphatase inhibitor activity(GO:0004865) |
| 1.1 | 4.4 | GO:0015111 | iodide transmembrane transporter activity(GO:0015111) |
| 1.1 | 8.5 | GO:0004111 | creatine kinase activity(GO:0004111) |
| 1.0 | 3.1 | GO:0015389 | pyrimidine nucleobase transmembrane transporter activity(GO:0005350) pyrimidine- and adenine-specific:sodium symporter activity(GO:0015389) |
| 1.0 | 12.2 | GO:0008430 | selenium binding(GO:0008430) |
| 0.9 | 4.3 | GO:0019912 | cyclin-dependent protein kinase activating kinase activity(GO:0019912) |
| 0.8 | 2.4 | GO:0010698 | acetyltransferase activator activity(GO:0010698) |
| 0.7 | 5.0 | GO:0030492 | hemoglobin binding(GO:0030492) |
| 0.7 | 7.3 | GO:0035381 | extracellular ATP-gated cation channel activity(GO:0004931) ATP-gated ion channel activity(GO:0035381) |
| 0.6 | 3.2 | GO:0031726 | CCR1 chemokine receptor binding(GO:0031726) |
| 0.6 | 1.8 | GO:0033142 | progesterone receptor binding(GO:0033142) |
| 0.6 | 4.7 | GO:0071933 | Arp2/3 complex binding(GO:0071933) |
| 0.6 | 2.9 | GO:0042610 | CD8 receptor binding(GO:0042610) |
| 0.6 | 4.5 | GO:0071253 | connexin binding(GO:0071253) |
| 0.5 | 3.5 | GO:0000155 | phosphorelay sensor kinase activity(GO:0000155) |
| 0.5 | 2.5 | GO:0043208 | glycosphingolipid binding(GO:0043208) |
| 0.4 | 2.7 | GO:0004740 | pyruvate dehydrogenase (acetyl-transferring) kinase activity(GO:0004740) |
| 0.4 | 1.2 | GO:0005174 | CD40 receptor binding(GO:0005174) |
| 0.4 | 2.3 | GO:0034046 | poly(G) binding(GO:0034046) |
| 0.4 | 1.8 | GO:0016427 | tRNA (cytosine) methyltransferase activity(GO:0016427) |
| 0.4 | 3.2 | GO:0030882 | lipid antigen binding(GO:0030882) endogenous lipid antigen binding(GO:0030883) exogenous lipid antigen binding(GO:0030884) |
| 0.3 | 5.3 | GO:0031821 | G-protein coupled serotonin receptor binding(GO:0031821) |
| 0.3 | 4.4 | GO:0044213 | intronic transcription regulatory region sequence-specific DNA binding(GO:0001161) intronic transcription regulatory region DNA binding(GO:0044213) |
| 0.2 | 4.2 | GO:0009881 | photoreceptor activity(GO:0009881) |
| 0.2 | 5.9 | GO:0102391 | decanoate--CoA ligase activity(GO:0102391) |
| 0.2 | 1.2 | GO:0046538 | bisphosphoglycerate mutase activity(GO:0004082) phosphoglycerate mutase activity(GO:0004619) 2,3-bisphosphoglycerate-dependent phosphoglycerate mutase activity(GO:0046538) |
| 0.2 | 7.0 | GO:0008331 | high voltage-gated calcium channel activity(GO:0008331) |
| 0.2 | 5.9 | GO:0004012 | phospholipid-translocating ATPase activity(GO:0004012) |
| 0.2 | 1.9 | GO:0030020 | extracellular matrix structural constituent conferring tensile strength(GO:0030020) |
| 0.2 | 2.1 | GO:0031433 | telethonin binding(GO:0031433) |
| 0.2 | 7.5 | GO:0046966 | thyroid hormone receptor binding(GO:0046966) |
| 0.2 | 1.5 | GO:0035727 | lysophosphatidic acid binding(GO:0035727) |
| 0.2 | 3.2 | GO:0008510 | sodium:bicarbonate symporter activity(GO:0008510) |
| 0.2 | 3.3 | GO:0004185 | serine-type carboxypeptidase activity(GO:0004185) |
| 0.1 | 8.3 | GO:0005272 | sodium channel activity(GO:0005272) |
| 0.1 | 3.2 | GO:0008191 | metalloendopeptidase inhibitor activity(GO:0008191) |
| 0.1 | 1.8 | GO:0015245 | fatty acid transporter activity(GO:0015245) |
| 0.1 | 4.4 | GO:0019198 | transmembrane receptor protein tyrosine phosphatase activity(GO:0005001) transmembrane receptor protein phosphatase activity(GO:0019198) |
| 0.1 | 1.0 | GO:0016167 | glial cell-derived neurotrophic factor receptor activity(GO:0016167) |
| 0.1 | 38.9 | GO:0004252 | serine-type endopeptidase activity(GO:0004252) |
| 0.1 | 2.9 | GO:0016832 | aldehyde-lyase activity(GO:0016832) |
| 0.1 | 0.4 | GO:0005173 | stem cell factor receptor binding(GO:0005173) |
| 0.1 | 5.6 | GO:0004364 | glutathione transferase activity(GO:0004364) |
| 0.1 | 1.6 | GO:0016783 | sulfurtransferase activity(GO:0016783) |
| 0.1 | 1.7 | GO:0004030 | aldehyde dehydrogenase [NAD(P)+] activity(GO:0004030) |
| 0.1 | 3.5 | GO:0015269 | calcium-activated potassium channel activity(GO:0015269) |
| 0.1 | 2.9 | GO:0031698 | beta-2 adrenergic receptor binding(GO:0031698) |
| 0.1 | 0.7 | GO:0003747 | translation release factor activity(GO:0003747) translation termination factor activity(GO:0008079) |
| 0.1 | 2.9 | GO:0050750 | low-density lipoprotein particle receptor binding(GO:0050750) |
| 0.1 | 2.0 | GO:0052629 | phosphatidylinositol-3,5-bisphosphate 3-phosphatase activity(GO:0052629) |
| 0.1 | 2.1 | GO:0070530 | K63-linked polyubiquitin binding(GO:0070530) |
| 0.1 | 0.7 | GO:0016015 | morphogen activity(GO:0016015) |
| 0.1 | 0.2 | GO:0005135 | erythropoietin receptor binding(GO:0005128) interleukin-3 receptor binding(GO:0005135) |
| 0.1 | 1.1 | GO:0030215 | semaphorin receptor binding(GO:0030215) |
| 0.1 | 1.1 | GO:0019864 | IgG binding(GO:0019864) |
| 0.1 | 0.8 | GO:0005229 | intracellular calcium activated chloride channel activity(GO:0005229) |
| 0.1 | 0.2 | GO:0030549 | acetylcholine receptor activator activity(GO:0030549) |
| 0.1 | 0.8 | GO:0004861 | cyclin-dependent protein serine/threonine kinase inhibitor activity(GO:0004861) |
| 0.1 | 2.0 | GO:0071837 | HMG box domain binding(GO:0071837) |
| 0.1 | 12.1 | GO:0005261 | cation channel activity(GO:0005261) |
| 0.0 | 1.4 | GO:0030676 | Rac guanyl-nucleotide exchange factor activity(GO:0030676) |
| 0.0 | 4.8 | GO:0005070 | SH3/SH2 adaptor activity(GO:0005070) |
| 0.0 | 0.5 | GO:0019958 | C-X-C chemokine binding(GO:0019958) |
| 0.0 | 4.5 | GO:0004527 | exonuclease activity(GO:0004527) |
| 0.0 | 0.9 | GO:0070330 | aromatase activity(GO:0070330) |
| 0.0 | 0.3 | GO:0032051 | clathrin light chain binding(GO:0032051) |
| 0.0 | 0.9 | GO:0005521 | lamin binding(GO:0005521) |
| 0.0 | 0.5 | GO:0017070 | U6 snRNA binding(GO:0017070) |
| 0.0 | 0.7 | GO:0034237 | protein kinase A regulatory subunit binding(GO:0034237) |
| 0.0 | 0.1 | GO:0042289 | MHC class II protein binding(GO:0042289) |
| 0.0 | 0.1 | GO:0000247 | C-8 sterol isomerase activity(GO:0000247) |
| 0.0 | 0.6 | GO:0022848 | acetylcholine-gated cation channel activity(GO:0022848) |
| 0.0 | 2.3 | GO:0004984 | olfactory receptor activity(GO:0004984) |
| 0.0 | 2.0 | GO:0019905 | syntaxin binding(GO:0019905) |
| 0.0 | 0.4 | GO:0015377 | cation:chloride symporter activity(GO:0015377) |
| 0.0 | 1.9 | GO:0004222 | metalloendopeptidase activity(GO:0004222) |
| 0.0 | 0.9 | GO:0019894 | kinesin binding(GO:0019894) |
| 0.0 | 0.8 | GO:0016620 | oxidoreductase activity, acting on the aldehyde or oxo group of donors, NAD or NADP as acceptor(GO:0016620) |
| 0.0 | 0.3 | GO:0000150 | recombinase activity(GO:0000150) |
| 0.0 | 0.7 | GO:0030552 | cAMP binding(GO:0030552) |
| 0.0 | 1.2 | GO:0031491 | nucleosome binding(GO:0031491) |
| 0.0 | 1.8 | GO:0004867 | serine-type endopeptidase inhibitor activity(GO:0004867) |
| 0.0 | 0.3 | GO:0004716 | receptor signaling protein tyrosine kinase activity(GO:0004716) |
| 0.0 | 1.9 | GO:0003697 | single-stranded DNA binding(GO:0003697) |
| 0.0 | 0.2 | GO:0050786 | RAGE receptor binding(GO:0050786) |
| 0.0 | 1.2 | GO:0000979 | RNA polymerase II core promoter sequence-specific DNA binding(GO:0000979) |
| 0.0 | 1.2 | GO:0004879 | RNA polymerase II transcription factor activity, ligand-activated sequence-specific DNA binding(GO:0004879) transcription factor activity, direct ligand regulated sequence-specific DNA binding(GO:0098531) |
Gene overrepresentation in curated gene sets: canonical pathways category:
| Log-likelihood per target | Total log-likelihood | Term | Description |
|---|---|---|---|
| 0.2 | 5.3 | PID S1P S1P4 PATHWAY | S1P4 pathway |
| 0.2 | 11.7 | PID AMB2 NEUTROPHILS PATHWAY | amb2 Integrin signaling |
| 0.1 | 2.6 | PID CIRCADIAN PATHWAY | Circadian rhythm pathway |
| 0.1 | 5.3 | PID IL1 PATHWAY | IL1-mediated signaling events |
| 0.1 | 4.5 | PID PDGFRA PATHWAY | PDGFR-alpha signaling pathway |
| 0.1 | 7.2 | PID HDAC CLASSII PATHWAY | Signaling events mediated by HDAC Class II |
| 0.1 | 1.8 | PID ERB GENOMIC PATHWAY | Validated nuclear estrogen receptor beta network |
| 0.1 | 4.4 | PID EPO PATHWAY | EPO signaling pathway |
| 0.1 | 6.1 | PID RAC1 PATHWAY | RAC1 signaling pathway |
| 0.1 | 6.6 | PID ECADHERIN STABILIZATION PATHWAY | Stabilization and expansion of the E-cadherin adherens junction |
| 0.1 | 1.4 | PID EPHA2 FWD PATHWAY | EPHA2 forward signaling |
| 0.1 | 1.3 | PID ANTHRAX PATHWAY | Cellular roles of Anthrax toxin |
| 0.1 | 8.5 | PID RB 1PATHWAY | Regulation of retinoblastoma protein |
| 0.1 | 2.5 | SA MMP CYTOKINE CONNECTION | Cytokines can induce activation of matrix metalloproteinases, which degrade extracellular matrix. |
| 0.1 | 3.2 | NABA PROTEOGLYCANS | Genes encoding proteoglycans |
| 0.1 | 1.7 | PID INTEGRIN2 PATHWAY | Beta2 integrin cell surface interactions |
| 0.0 | 2.7 | PID RAC1 REG PATHWAY | Regulation of RAC1 activity |
| 0.0 | 3.2 | PID IL12 2PATHWAY | IL12-mediated signaling events |
| 0.0 | 2.1 | PID SMAD2 3NUCLEAR PATHWAY | Regulation of nuclear SMAD2/3 signaling |
| 0.0 | 1.9 | NABA COLLAGENS | Genes encoding collagen proteins |
| 0.0 | 4.2 | PID HIF1 TFPATHWAY | HIF-1-alpha transcription factor network |
| 0.0 | 1.5 | ST ERK1 ERK2 MAPK PATHWAY | ERK1/ERK2 MAPK Pathway |
| 0.0 | 2.1 | PID RHOA REG PATHWAY | Regulation of RhoA activity |
| 0.0 | 0.1 | SA CASPASE CASCADE | Apoptosis is mediated by caspases, cysteine proteases arranged in a proteolytic cascade. |
| 0.0 | 0.3 | PID ERBB NETWORK PATHWAY | ErbB receptor signaling network |
| 0.0 | 5.1 | NABA ECM REGULATORS | Genes encoding enzymes and their regulators involved in the remodeling of the extracellular matrix |
| 0.0 | 0.4 | PID KIT PATHWAY | Signaling events mediated by Stem cell factor receptor (c-Kit) |
| 0.0 | 4.7 | NABA SECRETED FACTORS | Genes encoding secreted soluble factors |
| 0.0 | 0.6 | PID LYSOPHOSPHOLIPID PATHWAY | LPA receptor mediated events |
Gene overrepresentation in curated gene sets: REACTOME pathways category:
| Log-likelihood per target | Total log-likelihood | Term | Description |
|---|---|---|---|
| 0.5 | 6.6 | REACTOME PASSIVE TRANSPORT BY AQUAPORINS | Genes involved in Passive Transport by Aquaporins |
| 0.5 | 10.6 | REACTOME AMINE DERIVED HORMONES | Genes involved in Amine-derived hormones |
| 0.4 | 7.4 | REACTOME PECAM1 INTERACTIONS | Genes involved in PECAM1 interactions |
| 0.2 | 10.8 | REACTOME LATENT INFECTION OF HOMO SAPIENS WITH MYCOBACTERIUM TUBERCULOSIS | Genes involved in Latent infection of Homo sapiens with Mycobacterium tuberculosis |
| 0.2 | 2.1 | REACTOME IRAK1 RECRUITS IKK COMPLEX | Genes involved in IRAK1 recruits IKK complex |
| 0.2 | 2.9 | REACTOME ANDROGEN BIOSYNTHESIS | Genes involved in Androgen biosynthesis |
| 0.2 | 5.9 | REACTOME SYNTHESIS OF VERY LONG CHAIN FATTY ACYL COAS | Genes involved in Synthesis of very long-chain fatty acyl-CoAs |
| 0.2 | 6.9 | REACTOME DEGRADATION OF THE EXTRACELLULAR MATRIX | Genes involved in Degradation of the extracellular matrix |
| 0.2 | 1.2 | REACTOME TRAF6 MEDIATED IRF7 ACTIVATION IN TLR7 8 OR 9 SIGNALING | Genes involved in TRAF6 mediated IRF7 activation in TLR7/8 or 9 signaling |
| 0.2 | 5.6 | REACTOME GLUTATHIONE CONJUGATION | Genes involved in Glutathione conjugation |
| 0.2 | 2.7 | REACTOME REGULATION OF PYRUVATE DEHYDROGENASE PDH COMPLEX | Genes involved in Regulation of pyruvate dehydrogenase (PDH) complex |
| 0.1 | 1.6 | REACTOME OPSINS | Genes involved in Opsins |
| 0.1 | 2.1 | REACTOME SYNTHESIS OF SUBSTRATES IN N GLYCAN BIOSYTHESIS | Genes involved in Synthesis of substrates in N-glycan biosythesis |
| 0.1 | 5.3 | REACTOME G PROTEIN ACTIVATION | Genes involved in G-protein activation |
| 0.1 | 2.3 | REACTOME THE NLRP3 INFLAMMASOME | Genes involved in The NLRP3 inflammasome |
| 0.1 | 7.9 | REACTOME NCAM1 INTERACTIONS | Genes involved in NCAM1 interactions |
| 0.1 | 4.9 | REACTOME TRANSPORT OF VITAMINS NUCLEOSIDES AND RELATED MOLECULES | Genes involved in Transport of vitamins, nucleosides, and related molecules |
| 0.1 | 5.9 | REACTOME ION TRANSPORT BY P TYPE ATPASES | Genes involved in Ion transport by P-type ATPases |
| 0.1 | 4.4 | REACTOME BMAL1 CLOCK NPAS2 ACTIVATES CIRCADIAN EXPRESSION | Genes involved in BMAL1:CLOCK/NPAS2 Activates Circadian Expression |
| 0.1 | 3.5 | REACTOME CGMP EFFECTS | Genes involved in cGMP effects |
| 0.1 | 3.2 | REACTOME IL1 SIGNALING | Genes involved in Interleukin-1 signaling |
| 0.1 | 3.8 | REACTOME VOLTAGE GATED POTASSIUM CHANNELS | Genes involved in Voltage gated Potassium channels |
| 0.1 | 2.1 | REACTOME SIGNALING BY FGFR1 FUSION MUTANTS | Genes involved in Signaling by FGFR1 fusion mutants |
| 0.1 | 3.7 | REACTOME CHEMOKINE RECEPTORS BIND CHEMOKINES | Genes involved in Chemokine receptors bind chemokines |
| 0.1 | 0.9 | REACTOME XENOBIOTICS | Genes involved in Xenobiotics |
| 0.0 | 2.9 | REACTOME DARPP 32 EVENTS | Genes involved in DARPP-32 events |
| 0.0 | 1.9 | REACTOME EXTRACELLULAR MATRIX ORGANIZATION | Genes involved in Extracellular matrix organization |
| 0.0 | 3.7 | REACTOME IMMUNOREGULATORY INTERACTIONS BETWEEN A LYMPHOID AND A NON LYMPHOID CELL | Genes involved in Immunoregulatory interactions between a Lymphoid and a non-Lymphoid cell |
| 0.0 | 0.6 | REACTOME COMMON PATHWAY | Genes involved in Common Pathway |
| 0.0 | 1.9 | REACTOME NUCLEAR SIGNALING BY ERBB4 | Genes involved in Nuclear signaling by ERBB4 |
| 0.0 | 1.1 | REACTOME TIGHT JUNCTION INTERACTIONS | Genes involved in Tight junction interactions |
| 0.0 | 0.6 | REACTOME PRESYNAPTIC NICOTINIC ACETYLCHOLINE RECEPTORS | Genes involved in Presynaptic nicotinic acetylcholine receptors |
| 0.0 | 0.7 | REACTOME RAS ACTIVATION UOPN CA2 INFUX THROUGH NMDA RECEPTOR | Genes involved in Ras activation uopn Ca2+ infux through NMDA receptor |
| 0.0 | 2.3 | REACTOME OLFACTORY SIGNALING PATHWAY | Genes involved in Olfactory Signaling Pathway |
| 0.0 | 3.2 | REACTOME TRANSPORT OF INORGANIC CATIONS ANIONS AND AMINO ACIDS OLIGOPEPTIDES | Genes involved in Transport of inorganic cations/anions and amino acids/oligopeptides |
| 0.0 | 0.7 | REACTOME REGULATION OF INSULIN SECRETION BY GLUCAGON LIKE PEPTIDE1 | Genes involved in Regulation of Insulin Secretion by Glucagon-like Peptide-1 |
| 0.0 | 0.8 | REACTOME GABA SYNTHESIS RELEASE REUPTAKE AND DEGRADATION | Genes involved in GABA synthesis, release, reuptake and degradation |
| 0.0 | 3.8 | REACTOME ANTIGEN PROCESSING UBIQUITINATION PROTEASOME DEGRADATION | Genes involved in Antigen processing: Ubiquitination & Proteasome degradation |
| 0.0 | 1.4 | REACTOME NRAGE SIGNALS DEATH THROUGH JNK | Genes involved in NRAGE signals death through JNK |
| 0.0 | 0.5 | REACTOME PTM GAMMA CARBOXYLATION HYPUSINE FORMATION AND ARYLSULFATASE ACTIVATION | Genes involved in PTM: gamma carboxylation, hypusine formation and arylsulfatase activation |
| 0.0 | 0.7 | REACTOME SYNTHESIS OF PIPS AT THE PLASMA MEMBRANE | Genes involved in Synthesis of PIPs at the plasma membrane |
| 0.0 | 0.8 | REACTOME G1 PHASE | Genes involved in G1 Phase |
| 0.0 | 3.0 | REACTOME METABOLISM OF AMINO ACIDS AND DERIVATIVES | Genes involved in Metabolism of amino acids and derivatives |