Project
GNF SymAtlas + NCI-60 cancer cell lines, human (Su, 2004; Ross, 2000)
Navigation
Downloads
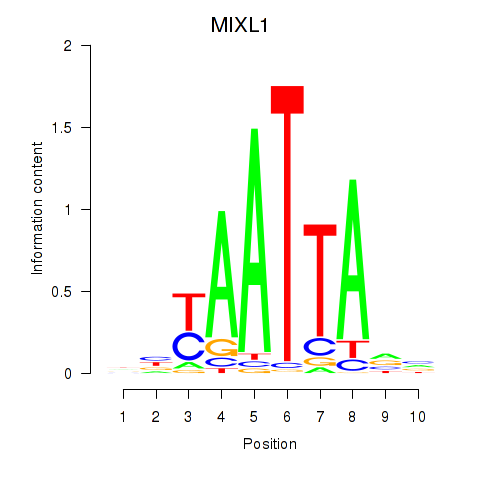
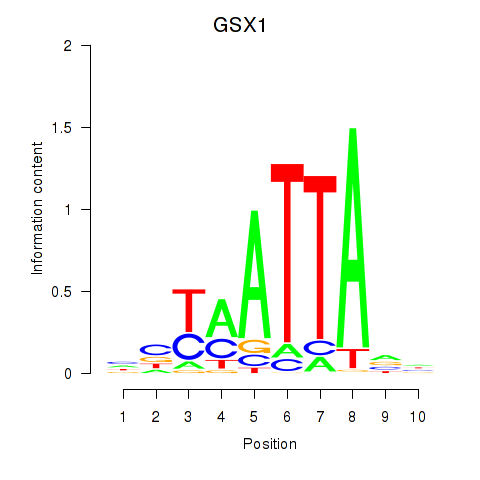
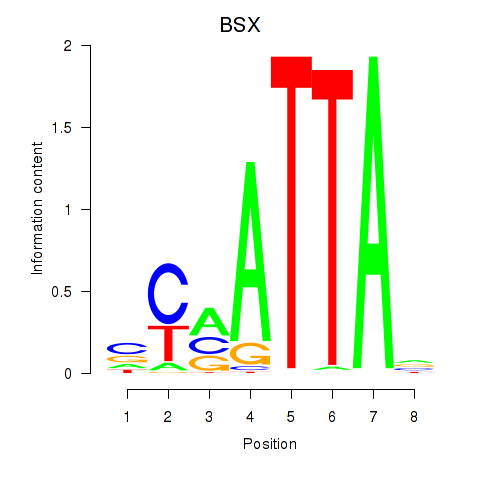
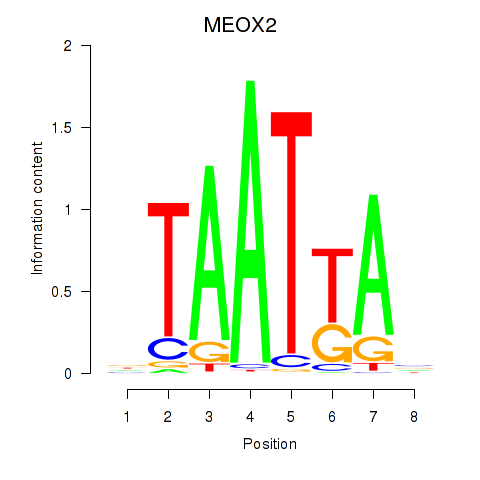
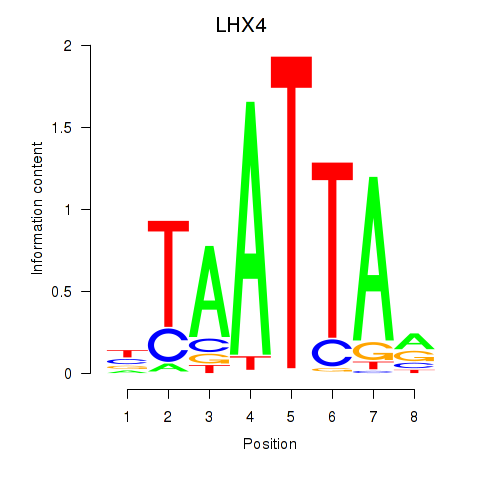
Results for MIXL1_GSX1_BSX_MEOX2_LHX4
Z-value: 0.80
Motif logo
Transcription factors associated with MIXL1_GSX1_BSX_MEOX2_LHX4
| Gene Symbol | Gene ID | Gene Info |
|---|---|---|
|
MIXL1
|
ENSG00000185155.12 | MIXL1 |
|
GSX1
|
ENSG00000169840.5 | GSX1 |
|
BSX
|
ENSG00000188909.5 | BSX |
|
MEOX2
|
ENSG00000106511.6 | MEOX2 |
|
LHX4
|
ENSG00000121454.6 | LHX4 |
Activity-expression correlation:
| Gene | Promoter | Pearson corr. coef. | P-value | Plot |
|---|---|---|---|---|
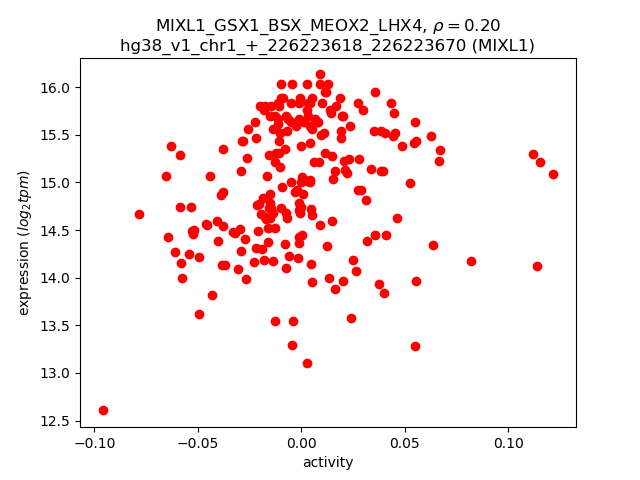
| MIXL1 | hg38_v1_chr1_+_226223618_226223670 | 0.20 | 2.4e-03 | Click! |
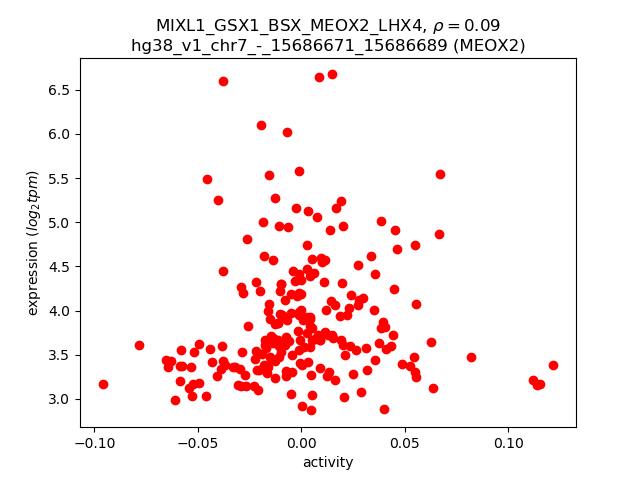
| MEOX2 | hg38_v1_chr7_-_15686671_15686689 | 0.09 | 2.1e-01 | Click! |
Activity profile of MIXL1_GSX1_BSX_MEOX2_LHX4 motif
Sorted Z-values of MIXL1_GSX1_BSX_MEOX2_LHX4 motif
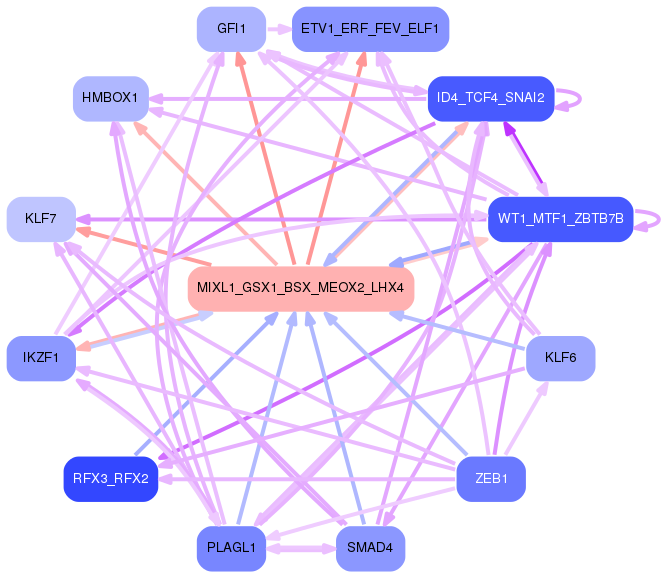
Network of associatons between targets according to the STRING database.

First level regulatory network of MIXL1_GSX1_BSX_MEOX2_LHX4
Gene Ontology Analysis
Gene overrepresentation in biological process category:
| Log-likelihood per target | Total log-likelihood | Term | Description |
|---|---|---|---|
| 7.3 | 21.9 | GO:0071461 | cellular response to redox state(GO:0071461) |
| 4.9 | 14.8 | GO:0034769 | basement membrane disassembly(GO:0034769) |
| 4.7 | 14.2 | GO:0070105 | positive regulation of interleukin-6-mediated signaling pathway(GO:0070105) |
| 3.8 | 11.3 | GO:0002378 | immunoglobulin biosynthetic process(GO:0002378) |
| 3.5 | 14.0 | GO:0002399 | MHC class II protein complex assembly(GO:0002399) |
| 3.3 | 19.9 | GO:0001920 | negative regulation of receptor recycling(GO:0001920) |
| 2.4 | 7.1 | GO:0002416 | IgG immunoglobulin transcytosis in epithelial cells mediated by FcRn immunoglobulin receptor(GO:0002416) |
| 2.0 | 6.1 | GO:1990418 | response to insulin-like growth factor stimulus(GO:1990418) |
| 2.0 | 5.9 | GO:0036292 | DNA rewinding(GO:0036292) |
| 1.8 | 5.5 | GO:0002304 | gamma-delta intraepithelial T cell differentiation(GO:0002304) CD8-positive, gamma-delta intraepithelial T cell differentiation(GO:0002305) |
| 1.8 | 7.2 | GO:0051697 | protein delipidation(GO:0051697) |
| 1.8 | 5.3 | GO:1902769 | regulation of choline O-acetyltransferase activity(GO:1902769) positive regulation of choline O-acetyltransferase activity(GO:1902771) negative regulation of tau-protein kinase activity(GO:1902948) positive regulation of early endosome to recycling endosome transport(GO:1902955) negative regulation of aspartic-type endopeptidase activity involved in amyloid precursor protein catabolic process(GO:1902960) negative regulation of neurofibrillary tangle assembly(GO:1902997) negative regulation of aspartic-type peptidase activity(GO:1905246) |
| 1.6 | 4.8 | GO:0001869 | regulation of complement activation, lectin pathway(GO:0001868) negative regulation of complement activation, lectin pathway(GO:0001869) |
| 1.6 | 4.7 | GO:0098582 | innate vocalization behavior(GO:0098582) |
| 1.5 | 4.5 | GO:0035470 | positive regulation of vascular wound healing(GO:0035470) |
| 1.5 | 6.0 | GO:0051037 | regulation of transcription involved in meiotic cell cycle(GO:0051037) |
| 1.4 | 4.2 | GO:0071139 | resolution of recombination intermediates(GO:0071139) resolution of mitotic recombination intermediates(GO:0071140) |
| 1.4 | 17.7 | GO:1900747 | negative regulation of vascular endothelial growth factor signaling pathway(GO:1900747) |
| 1.3 | 3.8 | GO:1990922 | regulation of hepatic stellate cell proliferation(GO:1904897) positive regulation of hepatic stellate cell proliferation(GO:1904899) hepatic stellate cell proliferation(GO:1990922) |
| 1.3 | 3.8 | GO:0002581 | negative regulation of antigen processing and presentation of peptide or polysaccharide antigen via MHC class II(GO:0002581) |
| 1.3 | 3.8 | GO:0050717 | positive regulation of interleukin-1 alpha secretion(GO:0050717) |
| 1.2 | 6.2 | GO:1903936 | cellular response to sodium arsenite(GO:1903936) |
| 1.2 | 5.9 | GO:0014738 | regulation of muscle hyperplasia(GO:0014738) |
| 1.1 | 34.0 | GO:0072643 | interferon-gamma secretion(GO:0072643) |
| 1.1 | 15.8 | GO:0043374 | CD8-positive, alpha-beta T cell differentiation(GO:0043374) |
| 1.1 | 3.4 | GO:0002326 | B cell lineage commitment(GO:0002326) |
| 1.1 | 5.5 | GO:0050861 | positive regulation of B cell receptor signaling pathway(GO:0050861) |
| 1.1 | 5.4 | GO:1903904 | negative regulation of establishment of T cell polarity(GO:1903904) negative regulation of Rho guanyl-nucleotide exchange factor activity(GO:2001107) |
| 1.0 | 11.1 | GO:0032277 | negative regulation of gonadotropin secretion(GO:0032277) |
| 1.0 | 3.9 | GO:0008628 | hormone-mediated apoptotic signaling pathway(GO:0008628) positive regulation of osteoclast proliferation(GO:0090290) negative regulation of bone mineralization involved in bone maturation(GO:1900158) |
| 1.0 | 2.9 | GO:0043973 | histone H3-K4 acetylation(GO:0043973) |
| 0.9 | 2.6 | GO:0044828 | negative regulation by host of viral genome replication(GO:0044828) |
| 0.9 | 2.6 | GO:0003218 | cardiac left ventricle formation(GO:0003218) |
| 0.9 | 17.6 | GO:0071803 | positive regulation of podosome assembly(GO:0071803) |
| 0.9 | 2.6 | GO:0099404 | negative regulation of maintenance of sister chromatid cohesion(GO:0034092) negative regulation of maintenance of mitotic sister chromatid cohesion(GO:0034183) maintenance of mitotic sister chromatid cohesion, telomeric(GO:0099403) mitotic sister chromatid cohesion, telomeric(GO:0099404) regulation of maintenance of mitotic sister chromatid cohesion, telomeric(GO:1904907) negative regulation of maintenance of mitotic sister chromatid cohesion, telomeric(GO:1904908) |
| 0.8 | 4.9 | GO:0097338 | response to clozapine(GO:0097338) |
| 0.8 | 3.2 | GO:1904381 | Golgi apparatus mannose trimming(GO:1904381) |
| 0.8 | 2.3 | GO:0033499 | galactose catabolic process via UDP-galactose(GO:0033499) |
| 0.7 | 5.1 | GO:0001550 | ovarian cumulus expansion(GO:0001550) fused antrum stage(GO:0048165) negative regulation of chondrocyte proliferation(GO:1902731) |
| 0.7 | 3.6 | GO:0042421 | norepinephrine biosynthetic process(GO:0042421) |
| 0.7 | 5.7 | GO:1901529 | positive regulation of anion channel activity(GO:1901529) |
| 0.7 | 2.8 | GO:1904749 | regulation of protein localization to nucleolus(GO:1904749) |
| 0.7 | 13.7 | GO:0097151 | positive regulation of inhibitory postsynaptic potential(GO:0097151) modulation of inhibitory postsynaptic potential(GO:0098828) |
| 0.7 | 1.3 | GO:2001027 | negative regulation of endothelial cell chemotaxis(GO:2001027) |
| 0.7 | 43.3 | GO:0034260 | negative regulation of GTPase activity(GO:0034260) |
| 0.7 | 15.1 | GO:1901741 | positive regulation of myoblast fusion(GO:1901741) |
| 0.6 | 1.9 | GO:1901876 | regulation of calcium ion binding(GO:1901876) negative regulation of calcium ion binding(GO:1901877) |
| 0.6 | 0.6 | GO:1903797 | positive regulation of inorganic anion transmembrane transport(GO:1903797) |
| 0.6 | 1.9 | GO:1990451 | cellular stress response to acidic pH(GO:1990451) |
| 0.6 | 1.9 | GO:0021913 | regulation of transcription from RNA polymerase II promoter involved in ventral spinal cord interneuron specification(GO:0021913) |
| 0.6 | 16.5 | GO:0050860 | negative regulation of T cell receptor signaling pathway(GO:0050860) |
| 0.6 | 2.3 | GO:1990167 | protein K27-linked deubiquitination(GO:1990167) |
| 0.6 | 1.1 | GO:1904845 | response to L-glutamine(GO:1904844) cellular response to L-glutamine(GO:1904845) |
| 0.6 | 0.6 | GO:0051919 | positive regulation of fibrinolysis(GO:0051919) |
| 0.6 | 1.7 | GO:0030187 | melatonin metabolic process(GO:0030186) melatonin biosynthetic process(GO:0030187) |
| 0.6 | 3.3 | GO:0072502 | cellular phosphate ion homeostasis(GO:0030643) cellular trivalent inorganic anion homeostasis(GO:0072502) |
| 0.5 | 3.3 | GO:1902261 | positive regulation of delayed rectifier potassium channel activity(GO:1902261) |
| 0.5 | 4.9 | GO:0060267 | positive regulation of respiratory burst(GO:0060267) |
| 0.5 | 4.9 | GO:0042904 | 9-cis-retinoic acid biosynthetic process(GO:0042904) 9-cis-retinoic acid metabolic process(GO:0042905) |
| 0.5 | 3.7 | GO:0051388 | positive regulation of neurotrophin TRK receptor signaling pathway(GO:0051388) |
| 0.5 | 1.1 | GO:0014835 | myoblast differentiation involved in skeletal muscle regeneration(GO:0014835) |
| 0.5 | 2.0 | GO:0060662 | tube lumen cavitation(GO:0060605) salivary gland cavitation(GO:0060662) |
| 0.5 | 1.5 | GO:1905000 | regulation of membrane repolarization during atrial cardiac muscle cell action potential(GO:1905000) |
| 0.5 | 4.4 | GO:1901409 | positive regulation of phosphorylation of RNA polymerase II C-terminal domain(GO:1901409) |
| 0.5 | 1.0 | GO:0019836 | hemolysis by symbiont of host erythrocytes(GO:0019836) hemolysis in other organism(GO:0044179) hemolysis in other organism involved in symbiotic interaction(GO:0052331) |
| 0.5 | 2.9 | GO:0046092 | deoxycytidine metabolic process(GO:0046092) |
| 0.5 | 1.0 | GO:0072501 | cellular divalent inorganic anion homeostasis(GO:0072501) |
| 0.5 | 1.4 | GO:0051295 | meiotic cell cycle phase transition(GO:0044771) establishment of meiotic spindle localization(GO:0051295) regulation of meiotic cell cycle phase transition(GO:1901993) negative regulation of meiotic cell cycle phase transition(GO:1901994) |
| 0.5 | 1.8 | GO:0002881 | negative regulation of chronic inflammatory response to non-antigenic stimulus(GO:0002881) |
| 0.4 | 1.3 | GO:0002912 | negative regulation of T cell tolerance induction(GO:0002665) negative regulation of T cell anergy(GO:0002668) negative regulation of lymphocyte anergy(GO:0002912) regulation of lymphotoxin A production(GO:0032681) positive regulation of lymphotoxin A production(GO:0032761) regulation of lymphotoxin A biosynthetic process(GO:0043016) positive regulation of lymphotoxin A biosynthetic process(GO:0043017) |
| 0.4 | 4.0 | GO:0006776 | vitamin A metabolic process(GO:0006776) |
| 0.4 | 3.0 | GO:0044245 | polysaccharide digestion(GO:0044245) |
| 0.4 | 2.6 | GO:1903232 | melanosome assembly(GO:1903232) |
| 0.4 | 1.3 | GO:0015888 | thiamine transport(GO:0015888) thiamine transmembrane transport(GO:0071934) |
| 0.4 | 5.9 | GO:0051661 | maintenance of centrosome location(GO:0051661) regulation of cardiac muscle cell action potential involved in regulation of contraction(GO:0098909) |
| 0.4 | 5.0 | GO:0046784 | viral mRNA export from host cell nucleus(GO:0046784) |
| 0.4 | 2.5 | GO:0042997 | negative regulation of low-density lipoprotein particle clearance(GO:0010989) negative regulation of Golgi to plasma membrane protein transport(GO:0042997) |
| 0.4 | 2.5 | GO:2000852 | corticosterone secretion(GO:0035934) regulation of corticosterone secretion(GO:2000852) |
| 0.4 | 6.5 | GO:1903861 | positive regulation of dendrite extension(GO:1903861) |
| 0.4 | 0.4 | GO:0002329 | pre-B cell differentiation(GO:0002329) pre-B cell allelic exclusion(GO:0002331) |
| 0.4 | 2.0 | GO:0070778 | L-aspartate transport(GO:0070778) L-aspartate transmembrane transport(GO:0089712) |
| 0.4 | 3.6 | GO:0048280 | vesicle fusion with Golgi apparatus(GO:0048280) |
| 0.4 | 2.8 | GO:1904879 | positive regulation of calcium ion transmembrane transport via high voltage-gated calcium channel(GO:1904879) |
| 0.4 | 2.3 | GO:2000158 | positive regulation of ubiquitin-specific protease activity(GO:2000158) |
| 0.4 | 0.4 | GO:0070662 | mast cell proliferation(GO:0070662) |
| 0.4 | 1.1 | GO:0030573 | bile acid catabolic process(GO:0030573) |
| 0.4 | 9.0 | GO:0007597 | blood coagulation, intrinsic pathway(GO:0007597) |
| 0.4 | 1.5 | GO:0002384 | hepatic immune response(GO:0002384) |
| 0.4 | 7.1 | GO:2000353 | positive regulation of endothelial cell apoptotic process(GO:2000353) |
| 0.4 | 1.1 | GO:1904204 | regulation of skeletal muscle hypertrophy(GO:1904204) |
| 0.4 | 2.6 | GO:2000324 | positive regulation of glucocorticoid receptor signaling pathway(GO:2000324) |
| 0.4 | 1.1 | GO:0021555 | midbrain-hindbrain boundary morphogenesis(GO:0021555) fourth ventricle development(GO:0021592) third ventricle development(GO:0021678) |
| 0.4 | 6.2 | GO:0035563 | positive regulation of chromatin binding(GO:0035563) |
| 0.4 | 1.1 | GO:0015860 | purine nucleoside transmembrane transport(GO:0015860) |
| 0.4 | 50.2 | GO:0006958 | complement activation, classical pathway(GO:0006958) |
| 0.3 | 2.8 | GO:0050882 | voluntary musculoskeletal movement(GO:0050882) |
| 0.3 | 1.0 | GO:0050917 | sensory perception of umami taste(GO:0050917) |
| 0.3 | 1.3 | GO:1900827 | maintenance of protein location in membrane(GO:0072658) maintenance of protein location in plasma membrane(GO:0072660) positive regulation of membrane depolarization during cardiac muscle cell action potential(GO:1900827) |
| 0.3 | 2.0 | GO:1990253 | cellular response to leucine starvation(GO:1990253) |
| 0.3 | 7.9 | GO:0046339 | diacylglycerol metabolic process(GO:0046339) |
| 0.3 | 4.2 | GO:2001300 | lipoxin metabolic process(GO:2001300) |
| 0.3 | 6.7 | GO:0030277 | maintenance of gastrointestinal epithelium(GO:0030277) |
| 0.3 | 0.6 | GO:0072106 | ureteric bud formation(GO:0060676) regulation of ureteric bud formation(GO:0072106) positive regulation of ureteric bud formation(GO:0072107) |
| 0.3 | 0.9 | GO:0006478 | peptidyl-tyrosine sulfation(GO:0006478) |
| 0.3 | 4.1 | GO:0033617 | mitochondrial respiratory chain complex IV assembly(GO:0033617) |
| 0.3 | 0.3 | GO:0007199 | G-protein coupled receptor signaling pathway coupled to cGMP nucleotide second messenger(GO:0007199) negative regulation of neurotrophin TRK receptor signaling pathway(GO:0051387) |
| 0.3 | 2.4 | GO:0060087 | relaxation of vascular smooth muscle(GO:0060087) |
| 0.3 | 4.4 | GO:0009642 | response to light intensity(GO:0009642) |
| 0.3 | 7.0 | GO:0007095 | mitotic G2 DNA damage checkpoint(GO:0007095) |
| 0.3 | 1.5 | GO:0051799 | negative regulation of hair follicle development(GO:0051799) |
| 0.3 | 2.3 | GO:0002074 | extraocular skeletal muscle development(GO:0002074) |
| 0.3 | 0.9 | GO:0072143 | renal interstitial fibroblast development(GO:0072141) mesangial cell development(GO:0072143) glomerular mesangial cell development(GO:0072144) |
| 0.3 | 1.1 | GO:0031339 | negative regulation of vesicle fusion(GO:0031339) |
| 0.3 | 1.7 | GO:0061743 | motor learning(GO:0061743) |
| 0.3 | 1.7 | GO:0010519 | negative regulation of phospholipase activity(GO:0010519) |
| 0.3 | 1.1 | GO:1904428 | negative regulation of tubulin deacetylation(GO:1904428) |
| 0.3 | 2.5 | GO:0031666 | positive regulation of lipopolysaccharide-mediated signaling pathway(GO:0031666) |
| 0.3 | 2.2 | GO:0006987 | activation of signaling protein activity involved in unfolded protein response(GO:0006987) |
| 0.3 | 1.1 | GO:0035948 | positive regulation of gluconeogenesis by positive regulation of transcription from RNA polymerase II promoter(GO:0035948) |
| 0.3 | 1.6 | GO:0061737 | leukotriene signaling pathway(GO:0061737) |
| 0.3 | 1.6 | GO:2000773 | negative regulation of cellular senescence(GO:2000773) |
| 0.3 | 0.5 | GO:1900365 | positive regulation of mRNA polyadenylation(GO:1900365) |
| 0.3 | 2.6 | GO:0034465 | response to carbon monoxide(GO:0034465) |
| 0.3 | 0.8 | GO:0060335 | positive regulation of response to interferon-gamma(GO:0060332) positive regulation of interferon-gamma-mediated signaling pathway(GO:0060335) |
| 0.2 | 1.2 | GO:0055059 | asymmetric neuroblast division(GO:0055059) |
| 0.2 | 2.0 | GO:1902951 | negative regulation of dendritic spine maintenance(GO:1902951) |
| 0.2 | 38.1 | GO:0002377 | immunoglobulin production(GO:0002377) |
| 0.2 | 19.4 | GO:2000649 | regulation of sodium ion transmembrane transporter activity(GO:2000649) |
| 0.2 | 1.7 | GO:0060054 | positive regulation of epithelial cell proliferation involved in wound healing(GO:0060054) |
| 0.2 | 1.0 | GO:0043091 | regulation of amino acid import(GO:0010958) L-arginine import(GO:0043091) arginine import(GO:0090467) L-arginine transport(GO:1902023) |
| 0.2 | 4.5 | GO:0007064 | mitotic sister chromatid cohesion(GO:0007064) |
| 0.2 | 1.4 | GO:0016554 | cytidine to uridine editing(GO:0016554) |
| 0.2 | 6.1 | GO:0097067 | cellular response to thyroid hormone stimulus(GO:0097067) |
| 0.2 | 4.7 | GO:0097186 | amelogenesis(GO:0097186) |
| 0.2 | 6.7 | GO:0045494 | photoreceptor cell maintenance(GO:0045494) |
| 0.2 | 0.7 | GO:0033326 | cerebrospinal fluid secretion(GO:0033326) |
| 0.2 | 3.2 | GO:0016024 | CDP-diacylglycerol biosynthetic process(GO:0016024) |
| 0.2 | 0.9 | GO:2000042 | negative regulation of double-strand break repair via homologous recombination(GO:2000042) |
| 0.2 | 2.1 | GO:0070475 | rRNA base methylation(GO:0070475) |
| 0.2 | 0.7 | GO:0010133 | proline catabolic process to glutamate(GO:0010133) |
| 0.2 | 2.9 | GO:0070307 | lens fiber cell development(GO:0070307) |
| 0.2 | 0.7 | GO:0035356 | cellular triglyceride homeostasis(GO:0035356) |
| 0.2 | 1.6 | GO:0006449 | regulation of translational termination(GO:0006449) |
| 0.2 | 1.1 | GO:0006041 | glucosamine metabolic process(GO:0006041) |
| 0.2 | 3.4 | GO:0030502 | negative regulation of bone mineralization(GO:0030502) |
| 0.2 | 0.9 | GO:0071351 | interleukin-18-mediated signaling pathway(GO:0035655) cellular response to interleukin-18(GO:0071351) |
| 0.2 | 11.2 | GO:0015701 | bicarbonate transport(GO:0015701) |
| 0.2 | 1.4 | GO:0055089 | fatty acid homeostasis(GO:0055089) |
| 0.2 | 1.4 | GO:0061087 | regulation of histone H3-K27 methylation(GO:0061085) positive regulation of histone H3-K27 methylation(GO:0061087) |
| 0.2 | 0.2 | GO:0035992 | tendon cell differentiation(GO:0035990) tendon formation(GO:0035992) |
| 0.2 | 1.2 | GO:1900113 | negative regulation of histone H3-K9 trimethylation(GO:1900113) |
| 0.2 | 3.8 | GO:1902894 | negative regulation of pri-miRNA transcription from RNA polymerase II promoter(GO:1902894) |
| 0.2 | 1.8 | GO:0086024 | adrenergic receptor signaling pathway involved in positive regulation of heart rate(GO:0086024) |
| 0.2 | 0.8 | GO:0098712 | D-aspartate transport(GO:0070777) D-aspartate import(GO:0070779) amino acid import across plasma membrane(GO:0089718) L-glutamate import across plasma membrane(GO:0098712) |
| 0.2 | 1.2 | GO:0048840 | otolith development(GO:0048840) |
| 0.2 | 0.6 | GO:1904386 | cellular response to mycotoxin(GO:0036146) response to thyroxine(GO:0097068) response to L-phenylalanine derivative(GO:1904386) response to cyclosporin A(GO:1905237) positive regulation of response to drug(GO:2001025) |
| 0.2 | 0.6 | GO:0022018 | subpallium cell proliferation in forebrain(GO:0022012) lateral ganglionic eminence cell proliferation(GO:0022018) lambdoid suture morphogenesis(GO:0060366) sagittal suture morphogenesis(GO:0060367) anterior semicircular canal development(GO:0060873) lateral semicircular canal development(GO:0060875) |
| 0.2 | 0.7 | GO:2000491 | positive regulation of hepatic stellate cell activation(GO:2000491) |
| 0.2 | 0.6 | GO:0072023 | thick ascending limb development(GO:0072023) metanephric thick ascending limb development(GO:0072233) |
| 0.2 | 1.5 | GO:0035878 | nail development(GO:0035878) |
| 0.2 | 0.4 | GO:0000965 | mitochondrial RNA 3'-end processing(GO:0000965) |
| 0.2 | 2.6 | GO:0070424 | regulation of nucleotide-binding oligomerization domain containing signaling pathway(GO:0070424) |
| 0.2 | 3.7 | GO:0006228 | UTP biosynthetic process(GO:0006228) |
| 0.2 | 0.7 | GO:0007499 | ectoderm and mesoderm interaction(GO:0007499) female genitalia morphogenesis(GO:0048807) |
| 0.2 | 0.4 | GO:0006288 | base-excision repair, DNA ligation(GO:0006288) |
| 0.2 | 0.4 | GO:0051142 | regulation of NK T cell proliferation(GO:0051140) positive regulation of NK T cell proliferation(GO:0051142) |
| 0.2 | 1.1 | GO:0007296 | vitellogenesis(GO:0007296) |
| 0.2 | 5.8 | GO:0070207 | protein homotrimerization(GO:0070207) |
| 0.2 | 0.4 | GO:0046533 | negative regulation of photoreceptor cell differentiation(GO:0046533) |
| 0.2 | 8.4 | GO:0007274 | neuromuscular synaptic transmission(GO:0007274) |
| 0.2 | 5.7 | GO:0045947 | negative regulation of translational initiation(GO:0045947) |
| 0.2 | 3.2 | GO:0002820 | negative regulation of adaptive immune response(GO:0002820) |
| 0.2 | 2.1 | GO:0048842 | positive regulation of axon extension involved in axon guidance(GO:0048842) |
| 0.2 | 2.9 | GO:0035493 | SNARE complex assembly(GO:0035493) |
| 0.2 | 0.3 | GO:0060369 | positive regulation of Fc receptor mediated stimulatory signaling pathway(GO:0060369) |
| 0.2 | 0.2 | GO:0014878 | response to electrical stimulus involved in regulation of muscle adaptation(GO:0014878) |
| 0.2 | 0.5 | GO:0060023 | soft palate development(GO:0060023) |
| 0.2 | 0.3 | GO:2000617 | positive regulation of histone H3-K9 acetylation(GO:2000617) |
| 0.2 | 16.3 | GO:0050911 | detection of chemical stimulus involved in sensory perception of smell(GO:0050911) |
| 0.2 | 1.3 | GO:0001867 | complement activation, lectin pathway(GO:0001867) |
| 0.2 | 0.9 | GO:0033133 | positive regulation of glucokinase activity(GO:0033133) |
| 0.2 | 0.2 | GO:0051970 | negative regulation of transmission of nerve impulse(GO:0051970) |
| 0.2 | 1.5 | GO:0039663 | fusion of virus membrane with host plasma membrane(GO:0019064) membrane fusion involved in viral entry into host cell(GO:0039663) multi-organism membrane fusion(GO:0044800) |
| 0.2 | 0.2 | GO:0035926 | chemokine (C-C motif) ligand 2 secretion(GO:0035926) chemokine (C-X-C motif) ligand 2 production(GO:0072567) regulation of chemokine (C-C motif) ligand 2 secretion(GO:1904207) positive regulation of chemokine (C-C motif) ligand 2 secretion(GO:1904209) regulation of chemokine (C-X-C motif) ligand 2 production(GO:2000341) positive regulation of chemokine (C-X-C motif) ligand 2 production(GO:2000343) |
| 0.2 | 0.5 | GO:0015842 | aminergic neurotransmitter loading into synaptic vesicle(GO:0015842) |
| 0.1 | 1.3 | GO:0043402 | glucocorticoid mediated signaling pathway(GO:0043402) |
| 0.1 | 0.4 | GO:1902310 | positive regulation of peptidyl-serine dephosphorylation(GO:1902310) |
| 0.1 | 1.0 | GO:0000712 | resolution of meiotic recombination intermediates(GO:0000712) |
| 0.1 | 0.9 | GO:0007000 | nucleolus organization(GO:0007000) |
| 0.1 | 1.6 | GO:1902083 | negative regulation of peptidyl-cysteine S-nitrosylation(GO:1902083) |
| 0.1 | 0.4 | GO:0018199 | peptidyl-glutamine modification(GO:0018199) |
| 0.1 | 2.2 | GO:0001562 | response to protozoan(GO:0001562) defense response to protozoan(GO:0042832) |
| 0.1 | 1.0 | GO:1901509 | regulation of endothelial tube morphogenesis(GO:1901509) |
| 0.1 | 1.6 | GO:0097116 | gephyrin clustering involved in postsynaptic density assembly(GO:0097116) |
| 0.1 | 1.1 | GO:0003185 | primary heart field specification(GO:0003138) sinoatrial valve development(GO:0003172) sinoatrial valve morphogenesis(GO:0003185) |
| 0.1 | 0.4 | GO:0046603 | negative regulation of mitotic centrosome separation(GO:0046603) |
| 0.1 | 0.8 | GO:0035063 | nuclear speck organization(GO:0035063) |
| 0.1 | 1.2 | GO:0006883 | cellular sodium ion homeostasis(GO:0006883) |
| 0.1 | 0.3 | GO:1903795 | regulation of inorganic anion transmembrane transport(GO:1903795) |
| 0.1 | 0.6 | GO:0061582 | intestinal epithelial cell migration(GO:0061582) |
| 0.1 | 0.8 | GO:0071896 | protein localization to adherens junction(GO:0071896) |
| 0.1 | 0.8 | GO:0072734 | response to staurosporine(GO:0072733) cellular response to staurosporine(GO:0072734) |
| 0.1 | 1.2 | GO:1902018 | negative regulation of cilium assembly(GO:1902018) |
| 0.1 | 0.5 | GO:0045348 | positive regulation of MHC class II biosynthetic process(GO:0045348) |
| 0.1 | 1.3 | GO:0015871 | choline transport(GO:0015871) |
| 0.1 | 0.4 | GO:0061011 | hepatic duct development(GO:0061011) |
| 0.1 | 5.4 | GO:0002260 | lymphocyte homeostasis(GO:0002260) |
| 0.1 | 0.4 | GO:0042427 | serotonin biosynthetic process(GO:0042427) |
| 0.1 | 1.4 | GO:0008627 | intrinsic apoptotic signaling pathway in response to osmotic stress(GO:0008627) |
| 0.1 | 0.8 | GO:0034587 | piRNA metabolic process(GO:0034587) |
| 0.1 | 2.0 | GO:0051256 | mitotic spindle midzone assembly(GO:0051256) |
| 0.1 | 1.0 | GO:0017182 | peptidyl-diphthamide metabolic process(GO:0017182) peptidyl-diphthamide biosynthetic process from peptidyl-histidine(GO:0017183) |
| 0.1 | 1.0 | GO:1904781 | positive regulation of protein localization to centrosome(GO:1904781) |
| 0.1 | 0.6 | GO:0021764 | amygdala development(GO:0021764) |
| 0.1 | 1.6 | GO:0030202 | heparin metabolic process(GO:0030202) heparin biosynthetic process(GO:0030210) |
| 0.1 | 0.6 | GO:0007197 | adenylate cyclase-inhibiting G-protein coupled acetylcholine receptor signaling pathway(GO:0007197) |
| 0.1 | 1.8 | GO:0034356 | NAD biosynthesis via nicotinamide riboside salvage pathway(GO:0034356) |
| 0.1 | 0.9 | GO:0044030 | regulation of DNA methylation(GO:0044030) |
| 0.1 | 0.9 | GO:0031573 | intra-S DNA damage checkpoint(GO:0031573) |
| 0.1 | 1.2 | GO:0003402 | planar cell polarity pathway involved in axis elongation(GO:0003402) |
| 0.1 | 0.6 | GO:0032525 | somite rostral/caudal axis specification(GO:0032525) |
| 0.1 | 3.0 | GO:0051131 | chaperone-mediated protein complex assembly(GO:0051131) |
| 0.1 | 0.3 | GO:0001983 | regulation of systemic arterial blood pressure by carotid sinus baroreceptor feedback(GO:0001978) baroreceptor response to increased systemic arterial blood pressure(GO:0001983) positive regulation of the force of heart contraction by chemical signal(GO:0003099) |
| 0.1 | 3.9 | GO:0001569 | patterning of blood vessels(GO:0001569) |
| 0.1 | 1.3 | GO:0048251 | elastic fiber assembly(GO:0048251) |
| 0.1 | 0.6 | GO:1903361 | protein localization to basolateral plasma membrane(GO:1903361) |
| 0.1 | 1.3 | GO:0046600 | negative regulation of centriole replication(GO:0046600) |
| 0.1 | 0.5 | GO:0060748 | tertiary branching involved in mammary gland duct morphogenesis(GO:0060748) |
| 0.1 | 1.0 | GO:0006032 | chitin metabolic process(GO:0006030) chitin catabolic process(GO:0006032) |
| 0.1 | 1.3 | GO:0043983 | histone H4-K12 acetylation(GO:0043983) |
| 0.1 | 0.5 | GO:0070233 | negative regulation of T cell apoptotic process(GO:0070233) |
| 0.1 | 1.8 | GO:0035589 | G-protein coupled purinergic nucleotide receptor signaling pathway(GO:0035589) |
| 0.1 | 1.4 | GO:0016576 | histone dephosphorylation(GO:0016576) |
| 0.1 | 0.3 | GO:0043353 | enucleate erythrocyte differentiation(GO:0043353) |
| 0.1 | 0.8 | GO:0048263 | determination of dorsal identity(GO:0048263) |
| 0.1 | 1.2 | GO:1903817 | negative regulation of delayed rectifier potassium channel activity(GO:1902260) negative regulation of voltage-gated potassium channel activity(GO:1903817) |
| 0.1 | 1.3 | GO:2000623 | regulation of nuclear-transcribed mRNA catabolic process, nonsense-mediated decay(GO:2000622) negative regulation of nuclear-transcribed mRNA catabolic process, nonsense-mediated decay(GO:2000623) |
| 0.1 | 0.5 | GO:0000707 | meiotic DNA recombinase assembly(GO:0000707) |
| 0.1 | 0.5 | GO:0046618 | drug export(GO:0046618) |
| 0.1 | 1.3 | GO:0060394 | negative regulation of pathway-restricted SMAD protein phosphorylation(GO:0060394) |
| 0.1 | 2.2 | GO:0019373 | epoxygenase P450 pathway(GO:0019373) |
| 0.1 | 0.3 | GO:0036233 | glycine import(GO:0036233) |
| 0.1 | 1.5 | GO:0035855 | megakaryocyte development(GO:0035855) |
| 0.1 | 0.7 | GO:0042539 | hypotonic salinity response(GO:0042539) cellular hypotonic salinity response(GO:0071477) |
| 0.1 | 0.8 | GO:0001887 | selenium compound metabolic process(GO:0001887) |
| 0.1 | 1.8 | GO:0050930 | induction of positive chemotaxis(GO:0050930) |
| 0.1 | 1.0 | GO:0010668 | ectodermal cell differentiation(GO:0010668) |
| 0.1 | 0.5 | GO:0051835 | positive regulation of synapse structural plasticity(GO:0051835) |
| 0.1 | 1.5 | GO:0034694 | response to prostaglandin(GO:0034694) |
| 0.1 | 0.8 | GO:2000467 | insulin receptor signaling pathway via phosphatidylinositol 3-kinase(GO:0038028) positive regulation of glycogen (starch) synthase activity(GO:2000467) |
| 0.1 | 0.2 | GO:1902358 | sulfate transmembrane transport(GO:1902358) |
| 0.1 | 1.7 | GO:0032515 | negative regulation of phosphoprotein phosphatase activity(GO:0032515) |
| 0.1 | 1.2 | GO:0035970 | peptidyl-threonine dephosphorylation(GO:0035970) |
| 0.1 | 0.9 | GO:0072539 | T-helper 17 cell differentiation(GO:0072539) |
| 0.1 | 0.3 | GO:0072183 | negative regulation by virus of viral protein levels in host cell(GO:0046725) negative regulation of nephron tubule epithelial cell differentiation(GO:0072183) negative regulation of metanephric nephron tubule epithelial cell differentiation(GO:0072308) negative regulation of epithelial cell differentiation involved in kidney development(GO:2000697) |
| 0.1 | 0.4 | GO:0010966 | regulation of phosphate transport(GO:0010966) |
| 0.1 | 1.3 | GO:0007196 | adenylate cyclase-inhibiting G-protein coupled glutamate receptor signaling pathway(GO:0007196) |
| 0.1 | 1.0 | GO:0015801 | aromatic amino acid transport(GO:0015801) |
| 0.1 | 0.3 | GO:0018874 | benzoate metabolic process(GO:0018874) butyrate metabolic process(GO:0019605) |
| 0.1 | 0.8 | GO:0097369 | sodium ion import(GO:0097369) sodium ion import across plasma membrane(GO:0098719) sodium ion import into cell(GO:1990118) |
| 0.1 | 1.0 | GO:0032740 | positive regulation of interleukin-17 production(GO:0032740) |
| 0.1 | 0.2 | GO:1900239 | phenotypic switching(GO:0036166) regulation of phenotypic switching(GO:1900239) |
| 0.1 | 0.4 | GO:0014809 | regulation of skeletal muscle contraction by regulation of release of sequestered calcium ion(GO:0014809) |
| 0.1 | 1.4 | GO:0010447 | response to acidic pH(GO:0010447) |
| 0.1 | 0.2 | GO:0042699 | follicle-stimulating hormone signaling pathway(GO:0042699) |
| 0.1 | 0.7 | GO:0002175 | protein localization to paranode region of axon(GO:0002175) |
| 0.1 | 0.5 | GO:0060745 | mammary gland branching involved in pregnancy(GO:0060745) epithelial cell proliferation involved in mammary gland duct elongation(GO:0060750) branch elongation involved in mammary gland duct branching(GO:0060751) |
| 0.1 | 3.2 | GO:0000083 | regulation of transcription involved in G1/S transition of mitotic cell cycle(GO:0000083) |
| 0.1 | 4.2 | GO:1904893 | negative regulation of JAK-STAT cascade(GO:0046426) negative regulation of STAT cascade(GO:1904893) |
| 0.1 | 0.3 | GO:0045986 | negative regulation of smooth muscle contraction(GO:0045986) |
| 0.1 | 1.3 | GO:0033189 | response to vitamin A(GO:0033189) |
| 0.1 | 1.1 | GO:0034505 | tooth mineralization(GO:0034505) |
| 0.1 | 0.5 | GO:2000253 | positive regulation of feeding behavior(GO:2000253) |
| 0.1 | 0.5 | GO:0007621 | negative regulation of female receptivity(GO:0007621) female courtship behavior(GO:0008050) |
| 0.1 | 0.9 | GO:0006069 | ethanol oxidation(GO:0006069) |
| 0.1 | 5.9 | GO:0000245 | spliceosomal complex assembly(GO:0000245) |
| 0.1 | 0.4 | GO:0043589 | skin morphogenesis(GO:0043589) |
| 0.1 | 0.5 | GO:0060484 | lung-associated mesenchyme development(GO:0060484) |
| 0.1 | 0.7 | GO:0034372 | very-low-density lipoprotein particle remodeling(GO:0034372) |
| 0.1 | 1.7 | GO:0048934 | peripheral nervous system neuron differentiation(GO:0048934) peripheral nervous system neuron development(GO:0048935) |
| 0.1 | 0.4 | GO:0001554 | luteolysis(GO:0001554) |
| 0.1 | 0.4 | GO:0061624 | fructose catabolic process(GO:0006001) fructose catabolic process to hydroxyacetone phosphate and glyceraldehyde-3-phosphate(GO:0061624) |
| 0.1 | 4.7 | GO:0031338 | regulation of vesicle fusion(GO:0031338) |
| 0.1 | 0.2 | GO:0072708 | response to sorbitol(GO:0072708) cellular response to sorbitol(GO:0072709) |
| 0.1 | 2.1 | GO:0016601 | Rac protein signal transduction(GO:0016601) |
| 0.1 | 0.2 | GO:2000296 | negative regulation of hydrogen peroxide catabolic process(GO:2000296) |
| 0.1 | 1.1 | GO:0010569 | regulation of double-strand break repair via homologous recombination(GO:0010569) |
| 0.1 | 2.3 | GO:0007257 | activation of JUN kinase activity(GO:0007257) |
| 0.1 | 1.7 | GO:0039694 | viral RNA genome replication(GO:0039694) RNA replication(GO:0039703) |
| 0.1 | 2.0 | GO:0022400 | regulation of rhodopsin mediated signaling pathway(GO:0022400) |
| 0.1 | 4.6 | GO:0030819 | positive regulation of cAMP biosynthetic process(GO:0030819) |
| 0.1 | 1.1 | GO:0030851 | granulocyte differentiation(GO:0030851) |
| 0.1 | 1.8 | GO:0050873 | brown fat cell differentiation(GO:0050873) |
| 0.1 | 0.2 | GO:2000342 | negative regulation of chemokine (C-X-C motif) ligand 2 production(GO:2000342) |
| 0.1 | 3.0 | GO:0019228 | neuronal action potential(GO:0019228) |
| 0.1 | 15.7 | GO:0065004 | protein-DNA complex assembly(GO:0065004) |
| 0.1 | 3.6 | GO:0007595 | lactation(GO:0007595) |
| 0.1 | 0.9 | GO:0019371 | cyclooxygenase pathway(GO:0019371) |
| 0.1 | 0.6 | GO:0060080 | inhibitory postsynaptic potential(GO:0060080) |
| 0.1 | 0.2 | GO:1902947 | regulation of tau-protein kinase activity(GO:1902947) |
| 0.1 | 1.2 | GO:0016254 | preassembly of GPI anchor in ER membrane(GO:0016254) |
| 0.1 | 1.0 | GO:0032464 | positive regulation of protein homooligomerization(GO:0032464) |
| 0.1 | 0.6 | GO:1900028 | negative regulation of ruffle assembly(GO:1900028) |
| 0.1 | 1.2 | GO:0021516 | dorsal spinal cord development(GO:0021516) |
| 0.1 | 0.1 | GO:0003162 | atrioventricular node development(GO:0003162) |
| 0.1 | 2.2 | GO:0018146 | keratan sulfate biosynthetic process(GO:0018146) |
| 0.1 | 0.2 | GO:0044339 | canonical Wnt signaling pathway involved in osteoblast differentiation(GO:0044339) |
| 0.1 | 0.7 | GO:0035269 | protein O-linked mannosylation(GO:0035269) |
| 0.1 | 0.4 | GO:0032754 | positive regulation of interleukin-5 production(GO:0032754) |
| 0.1 | 0.5 | GO:0035860 | gastro-intestinal system smooth muscle contraction(GO:0014831) glial cell-derived neurotrophic factor receptor signaling pathway(GO:0035860) negative regulation of fibroblast growth factor receptor signaling pathway(GO:0040037) |
| 0.1 | 1.2 | GO:0000387 | spliceosomal snRNP assembly(GO:0000387) |
| 0.1 | 1.7 | GO:0071108 | protein K48-linked deubiquitination(GO:0071108) |
| 0.1 | 0.4 | GO:0010452 | histone H3-K36 methylation(GO:0010452) |
| 0.1 | 0.2 | GO:0048022 | negative regulation of melanin biosynthetic process(GO:0048022) negative regulation of secondary metabolite biosynthetic process(GO:1900377) positive regulation of cAMP-dependent protein kinase activity(GO:2000481) positive regulation of dendritic cell apoptotic process(GO:2000670) |
| 0.1 | 0.1 | GO:0048541 | mucosal-associated lymphoid tissue development(GO:0048537) Peyer's patch development(GO:0048541) Peyer's patch morphogenesis(GO:0061146) |
| 0.1 | 3.4 | GO:0032755 | positive regulation of interleukin-6 production(GO:0032755) |
| 0.1 | 2.0 | GO:0010738 | regulation of protein kinase A signaling(GO:0010738) |
| 0.1 | 6.1 | GO:0008277 | regulation of G-protein coupled receptor protein signaling pathway(GO:0008277) |
| 0.1 | 1.1 | GO:0006491 | N-glycan processing(GO:0006491) |
| 0.1 | 0.4 | GO:0044320 | cellular response to leptin stimulus(GO:0044320) |
| 0.1 | 1.4 | GO:0032731 | positive regulation of interleukin-1 beta production(GO:0032731) |
| 0.1 | 5.3 | GO:0045471 | response to ethanol(GO:0045471) |
| 0.1 | 0.3 | GO:0038180 | nerve growth factor signaling pathway(GO:0038180) |
| 0.0 | 1.1 | GO:0000042 | protein targeting to Golgi(GO:0000042) |
| 0.0 | 0.5 | GO:1903071 | positive regulation of ER-associated ubiquitin-dependent protein catabolic process(GO:1903071) |
| 0.0 | 0.2 | GO:0060746 | maternal behavior(GO:0042711) parental behavior(GO:0060746) |
| 0.0 | 0.6 | GO:0015074 | DNA integration(GO:0015074) |
| 0.0 | 0.1 | GO:0003199 | endocardial cushion to mesenchymal transition involved in heart valve formation(GO:0003199) |
| 0.0 | 0.4 | GO:0035728 | response to hepatocyte growth factor(GO:0035728) |
| 0.0 | 2.7 | GO:0010923 | negative regulation of phosphatase activity(GO:0010923) |
| 0.0 | 0.1 | GO:0050928 | negative regulation of positive chemotaxis(GO:0050928) |
| 0.0 | 0.7 | GO:0070932 | histone H3 deacetylation(GO:0070932) |
| 0.0 | 3.9 | GO:0070301 | cellular response to hydrogen peroxide(GO:0070301) |
| 0.0 | 3.4 | GO:1905037 | autophagosome organization(GO:1905037) |
| 0.0 | 0.5 | GO:0033234 | negative regulation of protein sumoylation(GO:0033234) |
| 0.0 | 0.4 | GO:1903672 | positive regulation of sprouting angiogenesis(GO:1903672) |
| 0.0 | 1.8 | GO:0042475 | odontogenesis of dentin-containing tooth(GO:0042475) |
| 0.0 | 1.1 | GO:0061014 | positive regulation of mRNA catabolic process(GO:0061014) |
| 0.0 | 3.4 | GO:0030218 | erythrocyte differentiation(GO:0030218) |
| 0.0 | 0.7 | GO:0009584 | detection of visible light(GO:0009584) |
| 0.0 | 1.6 | GO:0007040 | lysosome organization(GO:0007040) lytic vacuole organization(GO:0080171) |
| 0.0 | 0.3 | GO:0032218 | riboflavin transport(GO:0032218) |
| 0.0 | 1.8 | GO:0010501 | RNA secondary structure unwinding(GO:0010501) |
| 0.0 | 0.8 | GO:0045761 | negative regulation of adenylate cyclase activity(GO:0007194) regulation of adenylate cyclase activity(GO:0045761) |
| 0.0 | 1.7 | GO:0045652 | regulation of megakaryocyte differentiation(GO:0045652) |
| 0.0 | 5.2 | GO:0043484 | regulation of RNA splicing(GO:0043484) |
| 0.0 | 3.1 | GO:1902600 | hydrogen ion transmembrane transport(GO:1902600) |
| 0.0 | 0.1 | GO:0007352 | zygotic specification of dorsal/ventral axis(GO:0007352) |
| 0.0 | 0.1 | GO:0051974 | negative regulation of telomerase activity(GO:0051974) |
| 0.0 | 0.9 | GO:0051457 | maintenance of protein location in nucleus(GO:0051457) |
| 0.0 | 0.2 | GO:0098870 | neuronal action potential propagation(GO:0019227) action potential propagation(GO:0098870) |
| 0.0 | 0.4 | GO:0086069 | bundle of His cell to Purkinje myocyte communication(GO:0086069) |
| 0.0 | 1.0 | GO:0009409 | response to cold(GO:0009409) |
| 0.0 | 11.8 | GO:0051056 | regulation of small GTPase mediated signal transduction(GO:0051056) |
| 0.0 | 2.1 | GO:0007218 | neuropeptide signaling pathway(GO:0007218) |
| 0.0 | 0.8 | GO:0045747 | positive regulation of Notch signaling pathway(GO:0045747) |
| 0.0 | 0.6 | GO:0051923 | sulfation(GO:0051923) |
| 0.0 | 0.4 | GO:0007039 | protein catabolic process in the vacuole(GO:0007039) |
| 0.0 | 0.4 | GO:0007258 | JUN phosphorylation(GO:0007258) |
| 0.0 | 0.3 | GO:0006848 | pyruvate transport(GO:0006848) pyruvate transmembrane transport(GO:1901475) |
| 0.0 | 0.0 | GO:0007217 | tachykinin receptor signaling pathway(GO:0007217) |
| 0.0 | 0.1 | GO:0072299 | visceral serous pericardium development(GO:0061032) negative regulation of glomerular mesangial cell proliferation(GO:0072125) posterior mesonephric tubule development(GO:0072166) metanephric glomerular mesangial cell proliferation involved in metanephros development(GO:0072262) regulation of metanephric glomerulus development(GO:0072298) negative regulation of metanephric glomerulus development(GO:0072299) regulation of metanephric glomerular mesangial cell proliferation(GO:0072301) negative regulation of metanephric glomerular mesangial cell proliferation(GO:0072302) negative regulation of glomerulus development(GO:0090194) negative regulation of cell proliferation involved in kidney development(GO:1901723) |
| 0.0 | 1.4 | GO:0035690 | cellular response to drug(GO:0035690) |
| 0.0 | 0.7 | GO:0045668 | negative regulation of osteoblast differentiation(GO:0045668) |
| 0.0 | 1.2 | GO:0000413 | protein peptidyl-prolyl isomerization(GO:0000413) |
| 0.0 | 2.0 | GO:0034614 | cellular response to reactive oxygen species(GO:0034614) |
| 0.0 | 0.9 | GO:0010761 | fibroblast migration(GO:0010761) |
| 0.0 | 1.2 | GO:0007528 | neuromuscular junction development(GO:0007528) |
| 0.0 | 1.3 | GO:0010107 | potassium ion import(GO:0010107) |
| 0.0 | 0.4 | GO:0034142 | toll-like receptor 4 signaling pathway(GO:0034142) |
| 0.0 | 0.1 | GO:0090080 | positive regulation of MAPKKK cascade by fibroblast growth factor receptor signaling pathway(GO:0090080) |
| 0.0 | 0.9 | GO:0019731 | antibacterial humoral response(GO:0019731) |
| 0.0 | 0.1 | GO:0032804 | viral protein processing(GO:0019082) regulation of low-density lipoprotein particle receptor catabolic process(GO:0032803) negative regulation of low-density lipoprotein particle receptor catabolic process(GO:0032804) negative regulation of neurotrophin production(GO:0032900) regulation of nerve growth factor production(GO:0032903) negative regulation of nerve growth factor production(GO:0032904) dibasic protein processing(GO:0090472) |
| 0.0 | 0.8 | GO:0014823 | response to activity(GO:0014823) |
| 0.0 | 1.0 | GO:0070671 | interleukin-12-mediated signaling pathway(GO:0035722) response to interleukin-12(GO:0070671) cellular response to interleukin-12(GO:0071349) |
| 0.0 | 0.7 | GO:0021983 | pituitary gland development(GO:0021983) |
| 0.0 | 0.2 | GO:0002726 | positive regulation of T cell cytokine production(GO:0002726) |
| 0.0 | 0.1 | GO:1901731 | positive regulation of platelet aggregation(GO:1901731) regulation of myofibroblast contraction(GO:1904328) myofibroblast contraction(GO:1990764) |
| 0.0 | 0.1 | GO:0006543 | glutamine catabolic process(GO:0006543) |
| 0.0 | 0.2 | GO:0032196 | transposition(GO:0032196) |
| 0.0 | 0.8 | GO:0018149 | peptide cross-linking(GO:0018149) |
| 0.0 | 0.0 | GO:0014832 | urinary bladder smooth muscle contraction(GO:0014832) urinary tract smooth muscle contraction(GO:0014848) |
| 0.0 | 0.2 | GO:0055070 | copper ion homeostasis(GO:0055070) |
| 0.0 | 0.7 | GO:0035196 | production of miRNAs involved in gene silencing by miRNA(GO:0035196) |
| 0.0 | 0.1 | GO:0043461 | proton-transporting ATP synthase complex assembly(GO:0043461) proton-transporting ATP synthase complex biogenesis(GO:0070272) |
| 0.0 | 0.1 | GO:0030579 | ubiquitin-dependent SMAD protein catabolic process(GO:0030579) |
| 0.0 | 0.2 | GO:0042423 | catechol-containing compound biosynthetic process(GO:0009713) catecholamine biosynthetic process(GO:0042423) |
| 0.0 | 0.2 | GO:0007608 | sensory perception of smell(GO:0007608) |
| 0.0 | 0.1 | GO:0045919 | positive regulation of cytolysis(GO:0045919) |
| 0.0 | 0.3 | GO:0006646 | phosphatidylethanolamine biosynthetic process(GO:0006646) |
| 0.0 | 0.3 | GO:0006703 | estrogen biosynthetic process(GO:0006703) |
| 0.0 | 0.4 | GO:0014047 | glutamate secretion(GO:0014047) |
| 0.0 | 0.1 | GO:0021942 | radial glia guided migration of Purkinje cell(GO:0021942) |
| 0.0 | 0.7 | GO:0048477 | oogenesis(GO:0048477) |
| 0.0 | 0.1 | GO:0021544 | subpallium development(GO:0021544) striatum development(GO:0021756) |
| 0.0 | 0.7 | GO:0021549 | cerebellum development(GO:0021549) |
| 0.0 | 0.6 | GO:1904837 | beta-catenin-TCF complex assembly(GO:1904837) |
| 0.0 | 0.1 | GO:0036508 | protein demannosylation(GO:0036507) protein alpha-1,2-demannosylation(GO:0036508) |
| 0.0 | 0.9 | GO:0043433 | negative regulation of sequence-specific DNA binding transcription factor activity(GO:0043433) |
| 0.0 | 0.1 | GO:0006668 | sphinganine-1-phosphate metabolic process(GO:0006668) |
| 0.0 | 0.8 | GO:0021987 | cerebral cortex development(GO:0021987) |
| 0.0 | 0.2 | GO:0010172 | embryonic body morphogenesis(GO:0010172) |
| 0.0 | 0.1 | GO:0008211 | glucocorticoid metabolic process(GO:0008211) |
Gene overrepresentation in cellular component category:
| Log-likelihood per target | Total log-likelihood | Term | Description |
|---|---|---|---|
| 2.6 | 7.7 | GO:0071754 | IgM immunoglobulin complex(GO:0071753) IgM immunoglobulin complex, circulating(GO:0071754) pentameric IgM immunoglobulin complex(GO:0071756) |
| 2.1 | 14.8 | GO:0036021 | endolysosome lumen(GO:0036021) |
| 1.5 | 19.7 | GO:0098647 | collagen type VI trimer(GO:0005589) collagen beaded filament(GO:0098647) |
| 1.5 | 5.9 | GO:0044307 | dendritic branch(GO:0044307) |
| 1.3 | 3.8 | GO:0072557 | IPAF inflammasome complex(GO:0072557) |
| 1.1 | 2.2 | GO:1990630 | IRE1-RACK1-PP2A complex(GO:1990630) |
| 1.0 | 6.8 | GO:0045252 | oxoglutarate dehydrogenase complex(GO:0045252) |
| 1.0 | 24.7 | GO:0001891 | phagocytic cup(GO:0001891) |
| 0.9 | 17.8 | GO:0042613 | MHC class II protein complex(GO:0042613) |
| 0.9 | 52.8 | GO:0001772 | immunological synapse(GO:0001772) |
| 0.9 | 2.6 | GO:0031933 | telomeric heterochromatin(GO:0031933) |
| 0.8 | 4.7 | GO:0033063 | DNA recombinase mediator complex(GO:0033061) Rad51B-Rad51C-Rad51D-XRCC2 complex(GO:0033063) |
| 0.8 | 23.9 | GO:0042101 | T cell receptor complex(GO:0042101) |
| 0.7 | 5.9 | GO:0043596 | nuclear replication fork(GO:0043596) |
| 0.7 | 2.6 | GO:0002945 | cyclin K-CDK13 complex(GO:0002945) |
| 0.7 | 7.2 | GO:0005853 | eukaryotic translation elongation factor 1 complex(GO:0005853) |
| 0.6 | 2.4 | GO:0005602 | complement component C1 complex(GO:0005602) |
| 0.6 | 4.7 | GO:0097504 | Gemini of coiled bodies(GO:0097504) |
| 0.6 | 5.0 | GO:0000347 | THO complex(GO:0000347) THO complex part of transcription export complex(GO:0000445) |
| 0.5 | 2.7 | GO:0089701 | U2AF(GO:0089701) |
| 0.5 | 5.5 | GO:0060171 | stereocilium membrane(GO:0060171) |
| 0.5 | 0.5 | GO:0005592 | collagen type XI trimer(GO:0005592) |
| 0.4 | 16.4 | GO:0005720 | nuclear heterochromatin(GO:0005720) |
| 0.4 | 6.8 | GO:0045277 | respiratory chain complex IV(GO:0045277) |
| 0.4 | 15.4 | GO:0090665 | dystrophin-associated glycoprotein complex(GO:0016010) glycoprotein complex(GO:0090665) |
| 0.4 | 2.8 | GO:0008282 | ATP-sensitive potassium channel complex(GO:0008282) |
| 0.4 | 3.1 | GO:0014701 | junctional sarcoplasmic reticulum membrane(GO:0014701) |
| 0.4 | 5.3 | GO:1990712 | HFE-transferrin receptor complex(GO:1990712) |
| 0.3 | 1.0 | GO:0071821 | FANCM-MHF complex(GO:0071821) |
| 0.3 | 2.0 | GO:1990131 | EGO complex(GO:0034448) Gtr1-Gtr2 GTPase complex(GO:1990131) |
| 0.3 | 1.3 | GO:0032144 | 4-aminobutyrate transaminase complex(GO:0032144) |
| 0.3 | 4.1 | GO:0005744 | mitochondrial inner membrane presequence translocase complex(GO:0005744) |
| 0.3 | 4.9 | GO:0005736 | DNA-directed RNA polymerase I complex(GO:0005736) |
| 0.3 | 0.3 | GO:0005826 | actomyosin contractile ring(GO:0005826) |
| 0.3 | 4.9 | GO:0005952 | cAMP-dependent protein kinase complex(GO:0005952) |
| 0.3 | 1.5 | GO:0005896 | interleukin-6 receptor complex(GO:0005896) |
| 0.3 | 14.4 | GO:0042571 | immunoglobulin complex, circulating(GO:0042571) |
| 0.3 | 0.9 | GO:0030485 | smooth muscle contractile fiber(GO:0030485) |
| 0.3 | 2.0 | GO:0060091 | kinocilium(GO:0060091) |
| 0.3 | 2.5 | GO:0031089 | platelet dense granule lumen(GO:0031089) |
| 0.3 | 4.2 | GO:0043020 | NADPH oxidase complex(GO:0043020) |
| 0.3 | 5.0 | GO:0042622 | photoreceptor outer segment membrane(GO:0042622) |
| 0.3 | 7.3 | GO:0032982 | myosin filament(GO:0032982) |
| 0.3 | 2.8 | GO:0005955 | calcineurin complex(GO:0005955) |
| 0.2 | 3.7 | GO:0030914 | STAGA complex(GO:0030914) |
| 0.2 | 1.8 | GO:0005579 | membrane attack complex(GO:0005579) |
| 0.2 | 0.4 | GO:0043159 | acrosomal matrix(GO:0043159) |
| 0.2 | 2.9 | GO:0033093 | Weibel-Palade body(GO:0033093) |
| 0.2 | 12.3 | GO:0048786 | presynaptic active zone(GO:0048786) |
| 0.2 | 1.4 | GO:0044530 | supraspliceosomal complex(GO:0044530) |
| 0.2 | 1.4 | GO:0097025 | MPP7-DLG1-LIN7 complex(GO:0097025) |
| 0.2 | 0.8 | GO:0070876 | SOSS complex(GO:0070876) |
| 0.2 | 1.0 | GO:0034688 | integrin alphaM-beta2 complex(GO:0034688) |
| 0.2 | 1.7 | GO:0071953 | elastic fiber(GO:0071953) |
| 0.2 | 1.5 | GO:0005593 | FACIT collagen trimer(GO:0005593) |
| 0.2 | 0.8 | GO:0071546 | pi-body(GO:0071546) |
| 0.2 | 2.3 | GO:0032045 | guanyl-nucleotide exchange factor complex(GO:0032045) |
| 0.2 | 1.2 | GO:1990635 | proximal dendrite(GO:1990635) |
| 0.2 | 4.3 | GO:0001518 | voltage-gated sodium channel complex(GO:0001518) |
| 0.2 | 1.2 | GO:0005721 | pericentric heterochromatin(GO:0005721) |
| 0.2 | 4.5 | GO:0005942 | phosphatidylinositol 3-kinase complex(GO:0005942) |
| 0.2 | 1.1 | GO:0042406 | extrinsic component of endoplasmic reticulum membrane(GO:0042406) |
| 0.1 | 0.9 | GO:0002177 | manchette(GO:0002177) |
| 0.1 | 2.0 | GO:0001673 | male germ cell nucleus(GO:0001673) |
| 0.1 | 0.6 | GO:0031232 | extrinsic component of external side of plasma membrane(GO:0031232) |
| 0.1 | 2.8 | GO:1990454 | L-type voltage-gated calcium channel complex(GO:1990454) |
| 0.1 | 1.1 | GO:0097442 | CA3 pyramidal cell dendrite(GO:0097442) |
| 0.1 | 19.8 | GO:0016363 | nuclear matrix(GO:0016363) |
| 0.1 | 0.4 | GO:0071062 | alphav-beta3 integrin-vitronectin complex(GO:0071062) |
| 0.1 | 0.7 | GO:0032437 | cuticular plate(GO:0032437) |
| 0.1 | 3.2 | GO:0034362 | low-density lipoprotein particle(GO:0034362) |
| 0.1 | 1.8 | GO:0046930 | pore complex(GO:0046930) |
| 0.1 | 1.1 | GO:0097452 | GAIT complex(GO:0097452) |
| 0.1 | 9.8 | GO:0071013 | catalytic step 2 spliceosome(GO:0071013) |
| 0.1 | 1.3 | GO:0005664 | origin recognition complex(GO:0000808) nuclear origin of replication recognition complex(GO:0005664) |
| 0.1 | 1.5 | GO:0036057 | filtration diaphragm(GO:0036056) slit diaphragm(GO:0036057) |
| 0.1 | 0.6 | GO:0005577 | fibrinogen complex(GO:0005577) |
| 0.1 | 0.5 | GO:0070081 | clathrin-sculpted monoamine transport vesicle(GO:0070081) clathrin-sculpted monoamine transport vesicle membrane(GO:0070083) |
| 0.1 | 1.1 | GO:0042567 | insulin-like growth factor ternary complex(GO:0042567) |
| 0.1 | 3.4 | GO:0030057 | desmosome(GO:0030057) |
| 0.1 | 1.6 | GO:0005689 | U12-type spliceosomal complex(GO:0005689) |
| 0.1 | 1.5 | GO:0031588 | nucleotide-activated protein kinase complex(GO:0031588) |
| 0.1 | 18.3 | GO:0032993 | protein-DNA complex(GO:0032993) |
| 0.1 | 2.0 | GO:0097440 | apical dendrite(GO:0097440) |
| 0.1 | 1.4 | GO:0031235 | intrinsic component of the cytoplasmic side of the plasma membrane(GO:0031235) |
| 0.1 | 5.3 | GO:0031201 | SNARE complex(GO:0031201) |
| 0.1 | 0.4 | GO:0014802 | terminal cisterna(GO:0014802) |
| 0.1 | 2.2 | GO:0005682 | U5 snRNP(GO:0005682) |
| 0.1 | 6.8 | GO:1904724 | tertiary granule lumen(GO:1904724) |
| 0.1 | 2.6 | GO:0005697 | telomerase holoenzyme complex(GO:0005697) |
| 0.1 | 1.5 | GO:0043194 | axon initial segment(GO:0043194) |
| 0.1 | 4.4 | GO:0005801 | cis-Golgi network(GO:0005801) |
| 0.1 | 0.6 | GO:0000439 | core TFIIH complex(GO:0000439) |
| 0.1 | 1.5 | GO:0000177 | cytoplasmic exosome (RNase complex)(GO:0000177) |
| 0.1 | 2.8 | GO:0034451 | centriolar satellite(GO:0034451) |
| 0.1 | 0.5 | GO:1990037 | Lewy body core(GO:1990037) |
| 0.1 | 6.0 | GO:0001750 | photoreceptor outer segment(GO:0001750) |
| 0.1 | 1.9 | GO:0090533 | cation-transporting ATPase complex(GO:0090533) |
| 0.1 | 11.5 | GO:0072562 | blood microparticle(GO:0072562) |
| 0.1 | 0.3 | GO:0030895 | apolipoprotein B mRNA editing enzyme complex(GO:0030895) |
| 0.1 | 1.7 | GO:0001533 | cornified envelope(GO:0001533) |
| 0.1 | 0.8 | GO:0033270 | paranode region of axon(GO:0033270) |
| 0.1 | 0.8 | GO:0042788 | polysomal ribosome(GO:0042788) |
| 0.1 | 1.8 | GO:0031093 | platelet alpha granule lumen(GO:0031093) |
| 0.1 | 3.1 | GO:0090544 | BAF-type complex(GO:0090544) |
| 0.1 | 2.5 | GO:0005796 | Golgi lumen(GO:0005796) |
| 0.1 | 1.5 | GO:0030673 | axolemma(GO:0030673) |
| 0.1 | 0.3 | GO:0000308 | cytoplasmic cyclin-dependent protein kinase holoenzyme complex(GO:0000308) |
| 0.1 | 0.4 | GO:0005879 | axonemal microtubule(GO:0005879) |
| 0.1 | 0.7 | GO:0072357 | PTW/PP1 phosphatase complex(GO:0072357) |
| 0.1 | 0.6 | GO:0046581 | intercellular canaliculus(GO:0046581) |
| 0.1 | 1.6 | GO:0032809 | neuronal cell body membrane(GO:0032809) cell body membrane(GO:0044298) |
| 0.1 | 2.8 | GO:0000307 | cyclin-dependent protein kinase holoenzyme complex(GO:0000307) |
| 0.1 | 2.8 | GO:0031904 | endosome lumen(GO:0031904) |
| 0.1 | 80.3 | GO:0005615 | extracellular space(GO:0005615) |
| 0.0 | 1.1 | GO:0032420 | stereocilium(GO:0032420) |
| 0.0 | 3.2 | GO:0042734 | presynaptic membrane(GO:0042734) |
| 0.0 | 13.7 | GO:0016324 | apical plasma membrane(GO:0016324) |
| 0.0 | 1.8 | GO:0005891 | voltage-gated calcium channel complex(GO:0005891) |
| 0.0 | 1.2 | GO:0080008 | Cul4-RING E3 ubiquitin ligase complex(GO:0080008) |
| 0.0 | 0.5 | GO:0044232 | organelle membrane contact site(GO:0044232) |
| 0.0 | 6.5 | GO:0005788 | endoplasmic reticulum lumen(GO:0005788) |
| 0.0 | 6.1 | GO:0031234 | extrinsic component of cytoplasmic side of plasma membrane(GO:0031234) |
| 0.0 | 0.5 | GO:0030122 | AP-2 adaptor complex(GO:0030122) |
| 0.0 | 0.2 | GO:0097038 | perinuclear endoplasmic reticulum(GO:0097038) |
| 0.0 | 0.4 | GO:0044224 | juxtaparanode region of axon(GO:0044224) |
| 0.0 | 3.7 | GO:0030176 | integral component of endoplasmic reticulum membrane(GO:0030176) |
| 0.0 | 0.3 | GO:0000242 | pericentriolar material(GO:0000242) |
| 0.0 | 0.9 | GO:0016592 | mediator complex(GO:0016592) |
| 0.0 | 0.4 | GO:0070971 | endoplasmic reticulum exit site(GO:0070971) |
| 0.0 | 1.5 | GO:0034707 | chloride channel complex(GO:0034707) |
| 0.0 | 0.6 | GO:0005892 | acetylcholine-gated channel complex(GO:0005892) |
| 0.0 | 0.2 | GO:0005581 | collagen trimer(GO:0005581) |
| 0.0 | 1.1 | GO:0008023 | transcription elongation factor complex(GO:0008023) |
| 0.0 | 0.2 | GO:0030015 | CCR4-NOT core complex(GO:0030015) |
| 0.0 | 1.1 | GO:0016459 | myosin complex(GO:0016459) |
| 0.0 | 1.3 | GO:0000794 | condensed nuclear chromosome(GO:0000794) |
| 0.0 | 0.4 | GO:0005680 | anaphase-promoting complex(GO:0005680) |
| 0.0 | 0.2 | GO:0008385 | IkappaB kinase complex(GO:0008385) |
| 0.0 | 0.1 | GO:0002193 | MAML1-RBP-Jkappa- ICN1 complex(GO:0002193) |
| 0.0 | 1.0 | GO:0010494 | cytoplasmic stress granule(GO:0010494) |
| 0.0 | 1.4 | GO:0005814 | centriole(GO:0005814) |
| 0.0 | 0.3 | GO:0097342 | ripoptosome(GO:0097342) |
| 0.0 | 0.3 | GO:0035371 | microtubule plus-end(GO:0035371) |
| 0.0 | 0.1 | GO:0044322 | endoplasmic reticulum quality control compartment(GO:0044322) |
| 0.0 | 1.3 | GO:0022625 | cytosolic large ribosomal subunit(GO:0022625) |
Gene overrepresentation in molecular function category:
| Log-likelihood per target | Total log-likelihood | Term | Description |
|---|---|---|---|
| 2.7 | 21.9 | GO:0005094 | Rho GDP-dissociation inhibitor activity(GO:0005094) |
| 2.4 | 7.3 | GO:0090555 | phosphatidylethanolamine-translocating ATPase activity(GO:0090555) |
| 2.4 | 7.1 | GO:0005174 | CD40 receptor binding(GO:0005174) |
| 1.8 | 7.1 | GO:0019770 | IgG receptor activity(GO:0019770) |
| 1.7 | 43.3 | GO:0005095 | GTPase inhibitor activity(GO:0005095) |
| 1.6 | 9.7 | GO:0008273 | calcium, potassium:sodium antiporter activity(GO:0008273) |
| 1.6 | 6.2 | GO:0061752 | telomeric repeat-containing RNA binding(GO:0061752) |
| 1.4 | 6.8 | GO:0004591 | oxoglutarate dehydrogenase (succinyl-transferring) activity(GO:0004591) |
| 1.2 | 20.6 | GO:0005068 | transmembrane receptor protein tyrosine kinase adaptor activity(GO:0005068) |
| 1.2 | 6.0 | GO:0048248 | CXCR3 chemokine receptor binding(GO:0048248) |
| 1.1 | 10.7 | GO:0004064 | arylesterase activity(GO:0004064) |
| 1.0 | 6.2 | GO:0047696 | beta-adrenergic receptor kinase activity(GO:0047696) |
| 0.9 | 4.6 | GO:0019862 | IgA binding(GO:0019862) |
| 0.9 | 5.5 | GO:0004699 | calcium-independent protein kinase C activity(GO:0004699) |
| 0.8 | 17.7 | GO:0001011 | transcription factor activity, sequence-specific DNA binding, RNA polymerase recruiting(GO:0001011) transcription factor activity, TFIIB-class binding(GO:0001087) |
| 0.8 | 4.2 | GO:0004464 | leukotriene-C4 synthase activity(GO:0004464) |
| 0.8 | 3.3 | GO:0000822 | inositol hexakisphosphate binding(GO:0000822) |
| 0.8 | 2.3 | GO:0015616 | DNA translocase activity(GO:0015616) |
| 0.7 | 2.8 | GO:0008281 | sulfonylurea receptor activity(GO:0008281) |
| 0.7 | 2.1 | GO:0070996 | type 1 melanocortin receptor binding(GO:0070996) |
| 0.7 | 20.5 | GO:0023026 | MHC class II protein complex binding(GO:0023026) |
| 0.7 | 2.7 | GO:0030628 | pre-mRNA 3'-splice site binding(GO:0030628) |
| 0.6 | 3.2 | GO:0023024 | MHC class I protein complex binding(GO:0023024) |
| 0.6 | 5.0 | GO:0030021 | extracellular matrix structural constituent conferring compression resistance(GO:0030021) structural constituent of tooth enamel(GO:0030345) |
| 0.6 | 1.9 | GO:0030171 | voltage-gated proton channel activity(GO:0030171) |
| 0.6 | 2.4 | GO:0005148 | prolactin receptor binding(GO:0005148) |
| 0.6 | 3.6 | GO:0016715 | oxidoreductase activity, acting on paired donors, with incorporation or reduction of molecular oxygen, reduced ascorbate as one donor, and incorporation of one atom of oxygen(GO:0016715) |
| 0.6 | 4.2 | GO:0008821 | crossover junction endodeoxyribonuclease activity(GO:0008821) |
| 0.6 | 1.7 | GO:0032093 | SAM domain binding(GO:0032093) |
| 0.6 | 5.7 | GO:0005549 | odorant binding(GO:0005549) |
| 0.6 | 6.2 | GO:0003720 | telomerase activity(GO:0003720) RNA-directed DNA polymerase activity(GO:0003964) |
| 0.5 | 5.9 | GO:0036310 | annealing helicase activity(GO:0036310) |
| 0.5 | 5.8 | GO:0004022 | alcohol dehydrogenase (NAD) activity(GO:0004022) |
| 0.5 | 2.1 | GO:0016434 | rRNA (cytosine) methyltransferase activity(GO:0016434) |
| 0.5 | 11.5 | GO:0019865 | immunoglobulin binding(GO:0019865) |
| 0.5 | 1.5 | GO:0070119 | ciliary neurotrophic factor binding(GO:0070119) |
| 0.5 | 0.5 | GO:0070052 | collagen V binding(GO:0070052) |
| 0.5 | 7.8 | GO:0004143 | diacylglycerol kinase activity(GO:0004143) |
| 0.5 | 2.4 | GO:0004692 | cGMP-dependent protein kinase activity(GO:0004692) |
| 0.5 | 1.4 | GO:0016262 | protein N-acetylglucosaminyltransferase activity(GO:0016262) |
| 0.5 | 2.4 | GO:0004558 | alpha-1,4-glucosidase activity(GO:0004558) |
| 0.5 | 2.8 | GO:0005220 | inositol 1,4,5-trisphosphate-sensitive calcium-release channel activity(GO:0005220) |
| 0.5 | 1.8 | GO:0016495 | C-X3-C chemokine receptor activity(GO:0016495) |
| 0.4 | 4.5 | GO:0035005 | 1-phosphatidylinositol-4-phosphate 3-kinase activity(GO:0035005) |
| 0.4 | 13.9 | GO:0034237 | protein kinase A regulatory subunit binding(GO:0034237) |
| 0.4 | 4.3 | GO:0070492 | oligosaccharide binding(GO:0070492) |
| 0.4 | 1.3 | GO:0015403 | thiamine transmembrane transporter activity(GO:0015234) thiamine uptake transmembrane transporter activity(GO:0015403) |
| 0.4 | 1.3 | GO:0004060 | arylamine N-acetyltransferase activity(GO:0004060) |
| 0.4 | 5.1 | GO:0005025 | transforming growth factor beta receptor activity, type I(GO:0005025) |
| 0.4 | 2.9 | GO:0004137 | deoxycytidine kinase activity(GO:0004137) thymidine kinase activity(GO:0004797) |
| 0.4 | 1.6 | GO:0001632 | leukotriene B4 receptor activity(GO:0001632) |
| 0.4 | 2.0 | GO:0015183 | L-aspartate transmembrane transporter activity(GO:0015183) |
| 0.4 | 2.0 | GO:0042610 | CD8 receptor binding(GO:0042610) |
| 0.4 | 77.0 | GO:0003823 | antigen binding(GO:0003823) |
| 0.4 | 2.3 | GO:0035800 | deubiquitinase activator activity(GO:0035800) |
| 0.4 | 14.2 | GO:0043236 | laminin binding(GO:0043236) |
| 0.4 | 4.9 | GO:0004690 | cyclic nucleotide-dependent protein kinase activity(GO:0004690) cAMP-dependent protein kinase activity(GO:0004691) |
| 0.4 | 1.1 | GO:0050528 | acyloxyacyl hydrolase activity(GO:0050528) |
| 0.3 | 2.8 | GO:0004571 | mannosyl-oligosaccharide 1,2-alpha-mannosidase activity(GO:0004571) |
| 0.3 | 1.4 | GO:0008508 | bile acid:sodium symporter activity(GO:0008508) |
| 0.3 | 1.4 | GO:0050119 | N-acetylglucosamine deacetylase activity(GO:0050119) |
| 0.3 | 10.9 | GO:0005001 | transmembrane receptor protein tyrosine phosphatase activity(GO:0005001) transmembrane receptor protein phosphatase activity(GO:0019198) |
| 0.3 | 1.4 | GO:0042030 | ATPase inhibitor activity(GO:0042030) |
| 0.3 | 5.3 | GO:0030306 | ADP-ribosylation factor binding(GO:0030306) |
| 0.3 | 0.6 | GO:0032564 | adenyl deoxyribonucleotide binding(GO:0032558) dATP binding(GO:0032564) |
| 0.3 | 1.3 | GO:0003867 | 4-aminobutyrate transaminase activity(GO:0003867) succinate-semialdehyde dehydrogenase binding(GO:0032145) (S)-3-amino-2-methylpropionate transaminase activity(GO:0047298) |
| 0.3 | 0.9 | GO:0008476 | protein-tyrosine sulfotransferase activity(GO:0008476) |
| 0.3 | 3.8 | GO:0050700 | CARD domain binding(GO:0050700) |
| 0.3 | 4.9 | GO:0001054 | RNA polymerase I activity(GO:0001054) |
| 0.3 | 20.2 | GO:0017080 | sodium channel regulator activity(GO:0017080) |
| 0.3 | 1.5 | GO:0034988 | Fc-gamma receptor I complex binding(GO:0034988) |
| 0.3 | 8.0 | GO:0003746 | translation elongation factor activity(GO:0003746) |
| 0.3 | 2.6 | GO:0060072 | large conductance calcium-activated potassium channel activity(GO:0060072) |
| 0.3 | 2.3 | GO:0030274 | LIM domain binding(GO:0030274) |
| 0.3 | 0.9 | GO:0042008 | interleukin-18 receptor activity(GO:0042008) |
| 0.3 | 1.1 | GO:0005415 | nucleoside:sodium symporter activity(GO:0005415) |
| 0.3 | 1.3 | GO:0004883 | glucocorticoid receptor activity(GO:0004883) glucocorticoid-activated RNA polymerase II transcription factor binding transcription factor activity(GO:0038051) |
| 0.3 | 5.0 | GO:0008190 | eukaryotic initiation factor 4E binding(GO:0008190) |
| 0.3 | 1.0 | GO:0002046 | opsin binding(GO:0002046) |
| 0.3 | 0.8 | GO:0047787 | delta4-3-oxosteroid 5beta-reductase activity(GO:0047787) |
| 0.2 | 3.2 | GO:0019841 | retinol binding(GO:0019841) |
| 0.2 | 3.8 | GO:0031435 | mitogen-activated protein kinase kinase kinase binding(GO:0031435) |
| 0.2 | 0.7 | GO:0004346 | glucose-6-phosphatase activity(GO:0004346) sugar-terminal-phosphatase activity(GO:0050309) |
| 0.2 | 0.7 | GO:1904455 | ubiquitin-specific protease activity involved in negative regulation of ERAD pathway(GO:1904455) |
| 0.2 | 0.7 | GO:0004556 | alpha-amylase activity(GO:0004556) amylase activity(GO:0016160) |
| 0.2 | 1.3 | GO:0039552 | RIG-I binding(GO:0039552) |
| 0.2 | 0.7 | GO:0008321 | Ral guanyl-nucleotide exchange factor activity(GO:0008321) |
| 0.2 | 2.8 | GO:0086056 | voltage-gated calcium channel activity involved in AV node cell action potential(GO:0086056) |
| 0.2 | 7.7 | GO:0004709 | MAP kinase kinase kinase activity(GO:0004709) |
| 0.2 | 0.6 | GO:0000253 | 3-keto sterol reductase activity(GO:0000253) |
| 0.2 | 1.0 | GO:0005134 | interleukin-2 receptor binding(GO:0005134) |
| 0.2 | 0.6 | GO:0009378 | four-way junction helicase activity(GO:0009378) |
| 0.2 | 0.8 | GO:0042328 | heparan sulfate N-acetylglucosaminyltransferase activity(GO:0042328) |
| 0.2 | 5.0 | GO:0048018 | receptor agonist activity(GO:0048018) |
| 0.2 | 0.9 | GO:0004666 | prostaglandin-endoperoxide synthase activity(GO:0004666) |
| 0.2 | 0.6 | GO:0003943 | N-acetylgalactosamine-4-sulfatase activity(GO:0003943) |
| 0.2 | 5.9 | GO:0043425 | bHLH transcription factor binding(GO:0043425) |
| 0.2 | 2.8 | GO:0005149 | interleukin-1 receptor binding(GO:0005149) |
| 0.2 | 6.6 | GO:0016538 | cyclin-dependent protein serine/threonine kinase regulator activity(GO:0016538) |
| 0.2 | 17.5 | GO:0005518 | collagen binding(GO:0005518) |
| 0.2 | 3.4 | GO:0005522 | profilin binding(GO:0005522) |
| 0.2 | 2.3 | GO:0051864 | histone demethylase activity (H3-K36 specific)(GO:0051864) |
| 0.2 | 4.7 | GO:0004129 | cytochrome-c oxidase activity(GO:0004129) heme-copper terminal oxidase activity(GO:0015002) oxidoreductase activity, acting on a heme group of donors, oxygen as acceptor(GO:0016676) |
| 0.2 | 1.6 | GO:0004065 | arylsulfatase activity(GO:0004065) |
| 0.2 | 2.2 | GO:0015501 | glutamate:sodium symporter activity(GO:0015501) |
| 0.2 | 2.6 | GO:0005161 | platelet-derived growth factor receptor binding(GO:0005161) |
| 0.2 | 4.0 | GO:1905030 | voltage-gated sodium channel activity(GO:0005248) voltage-gated ion channel activity involved in regulation of postsynaptic membrane potential(GO:1905030) |
| 0.2 | 0.9 | GO:0005223 | intracellular cGMP activated cation channel activity(GO:0005223) |
| 0.2 | 2.8 | GO:0016018 | cyclosporin A binding(GO:0016018) |
| 0.2 | 0.9 | GO:0003873 | 6-phosphofructo-2-kinase activity(GO:0003873) |
| 0.2 | 0.9 | GO:0008142 | oxysterol binding(GO:0008142) |
| 0.1 | 3.3 | GO:0097493 | structural molecule activity conferring elasticity(GO:0097493) |
| 0.1 | 0.6 | GO:0090554 | phosphatidylcholine-translocating ATPase activity(GO:0090554) |
| 0.1 | 2.1 | GO:0019957 | C-C chemokine binding(GO:0019957) |
| 0.1 | 1.1 | GO:0004126 | cytidine deaminase activity(GO:0004126) |
| 0.1 | 2.3 | GO:0016175 | superoxide-generating NADPH oxidase activity(GO:0016175) |
| 0.1 | 1.5 | GO:0004679 | AMP-activated protein kinase activity(GO:0004679) |
| 0.1 | 1.1 | GO:0070699 | type II activin receptor binding(GO:0070699) |
| 0.1 | 5.0 | GO:0071889 | 14-3-3 protein binding(GO:0071889) |
| 0.1 | 0.5 | GO:0015018 | galactosylgalactosylxylosylprotein 3-beta-glucuronosyltransferase activity(GO:0015018) |
| 0.1 | 0.9 | GO:0001515 | opioid peptide activity(GO:0001515) |
| 0.1 | 1.6 | GO:0051434 | BH3 domain binding(GO:0051434) |
| 0.1 | 0.9 | GO:0050294 | steroid sulfotransferase activity(GO:0050294) |
| 0.1 | 3.7 | GO:0004550 | nucleoside diphosphate kinase activity(GO:0004550) |
| 0.1 | 0.4 | GO:0005173 | stem cell factor receptor binding(GO:0005173) |
| 0.1 | 3.2 | GO:0003841 | 1-acylglycerol-3-phosphate O-acyltransferase activity(GO:0003841) |
| 0.1 | 1.4 | GO:0001135 | transcription factor activity, RNA polymerase II transcription factor recruiting(GO:0001135) |
| 0.1 | 0.4 | GO:0031862 | prostanoid receptor binding(GO:0031862) |
| 0.1 | 0.5 | GO:0030235 | nitric-oxide synthase regulator activity(GO:0030235) |
| 0.1 | 3.5 | GO:0005035 | tumor necrosis factor-activated receptor activity(GO:0005031) death receptor activity(GO:0005035) |
| 0.1 | 2.3 | GO:0008349 | MAP kinase kinase kinase kinase activity(GO:0008349) |
| 0.1 | 0.6 | GO:0016907 | G-protein coupled acetylcholine receptor activity(GO:0016907) |
| 0.1 | 0.8 | GO:0016308 | 1-phosphatidylinositol-4-phosphate 5-kinase activity(GO:0016308) |
| 0.1 | 0.4 | GO:0061609 | fructose-1-phosphate aldolase activity(GO:0061609) |
| 0.1 | 37.7 | GO:0001227 | transcriptional repressor activity, RNA polymerase II transcription regulatory region sequence-specific binding(GO:0001227) |
| 0.1 | 1.4 | GO:0030215 | semaphorin receptor binding(GO:0030215) |
| 0.1 | 4.6 | GO:1990841 | promoter-specific chromatin binding(GO:1990841) |
| 0.1 | 0.8 | GO:0004969 | histamine receptor activity(GO:0004969) |
| 0.1 | 5.3 | GO:0005484 | SNAP receptor activity(GO:0005484) |
| 0.1 | 0.3 | GO:0004937 | alpha1-adrenergic receptor activity(GO:0004937) |
| 0.1 | 2.2 | GO:0008392 | arachidonic acid monooxygenase activity(GO:0008391) arachidonic acid epoxygenase activity(GO:0008392) |
| 0.1 | 10.6 | GO:0004984 | olfactory receptor activity(GO:0004984) |
| 0.1 | 0.5 | GO:0015222 | serotonin transmembrane transporter activity(GO:0015222) |
| 0.1 | 4.2 | GO:0003950 | NAD+ ADP-ribosyltransferase activity(GO:0003950) |
| 0.1 | 0.4 | GO:0004647 | phosphoserine phosphatase activity(GO:0004647) |
| 0.1 | 0.4 | GO:0048403 | brain-derived neurotrophic factor binding(GO:0048403) |
| 0.1 | 0.7 | GO:0035252 | UDP-xylosyltransferase activity(GO:0035252) xylosyltransferase activity(GO:0042285) |
| 0.1 | 12.7 | GO:0005089 | Rho guanyl-nucleotide exchange factor activity(GO:0005089) |
| 0.1 | 0.8 | GO:0008172 | S-methyltransferase activity(GO:0008172) |
| 0.1 | 1.0 | GO:0070569 | uridylyltransferase activity(GO:0070569) |
| 0.1 | 1.1 | GO:0008020 | G-protein coupled photoreceptor activity(GO:0008020) |
| 0.1 | 0.4 | GO:0005314 | high-affinity glutamate transmembrane transporter activity(GO:0005314) |
| 0.1 | 1.0 | GO:0001851 | complement component C3b binding(GO:0001851) |
| 0.1 | 1.0 | GO:0070181 | small ribosomal subunit rRNA binding(GO:0070181) |
| 0.1 | 0.7 | GO:0004983 | neuropeptide Y receptor activity(GO:0004983) |
| 0.1 | 0.7 | GO:0071553 | uridine nucleotide receptor activity(GO:0015065) G-protein coupled pyrimidinergic nucleotide receptor activity(GO:0071553) |
| 0.1 | 35.2 | GO:0030695 | GTPase regulator activity(GO:0030695) |
| 0.1 | 1.1 | GO:0031995 | insulin-like growth factor II binding(GO:0031995) |
| 0.1 | 1.1 | GO:0001608 | G-protein coupled nucleotide receptor activity(GO:0001608) G-protein coupled purinergic nucleotide receptor activity(GO:0045028) |
| 0.1 | 2.8 | GO:0005212 | structural constituent of eye lens(GO:0005212) |
| 0.1 | 0.3 | GO:0016838 | carbon-oxygen lyase activity, acting on phosphates(GO:0016838) |
| 0.1 | 0.4 | GO:0003910 | DNA ligase (ATP) activity(GO:0003910) |
| 0.1 | 0.9 | GO:0004977 | melanocortin receptor activity(GO:0004977) |
| 0.1 | 0.7 | GO:0046625 | sphingolipid binding(GO:0046625) |
| 0.1 | 0.3 | GO:0005477 | pyruvate secondary active transmembrane transporter activity(GO:0005477) |
| 0.1 | 1.0 | GO:0008061 | chitinase activity(GO:0004568) chitin binding(GO:0008061) |
| 0.1 | 0.5 | GO:0001591 | dopamine neurotransmitter receptor activity, coupled via Gi/Go(GO:0001591) |
| 0.1 | 5.9 | GO:0003724 | RNA helicase activity(GO:0003724) ATP-dependent RNA helicase activity(GO:0004004) |
| 0.1 | 2.5 | GO:0005547 | phosphatidylinositol-3,4,5-trisphosphate binding(GO:0005547) |
| 0.1 | 10.4 | GO:0005179 | hormone activity(GO:0005179) |
| 0.1 | 5.7 | GO:0004177 | aminopeptidase activity(GO:0004177) |
| 0.1 | 1.7 | GO:0050786 | RAGE receptor binding(GO:0050786) |
| 0.1 | 0.4 | GO:0004652 | polynucleotide adenylyltransferase activity(GO:0004652) |
| 0.1 | 0.8 | GO:0070324 | thyroid hormone binding(GO:0070324) |
| 0.1 | 0.3 | GO:0004948 | calcitonin receptor activity(GO:0004948) |
| 0.1 | 1.6 | GO:0004859 | phospholipase inhibitor activity(GO:0004859) |
| 0.1 | 0.6 | GO:0008271 | secondary active sulfate transmembrane transporter activity(GO:0008271) |
| 0.1 | 1.3 | GO:0043548 | phosphatidylinositol 3-kinase binding(GO:0043548) |
| 0.1 | 0.8 | GO:0022821 | potassium ion antiporter activity(GO:0022821) |
| 0.1 | 2.8 | GO:0001784 | phosphotyrosine binding(GO:0001784) |
| 0.1 | 0.3 | GO:0015375 | glycine:sodium symporter activity(GO:0015375) |
| 0.1 | 0.4 | GO:0005143 | interleukin-12 receptor binding(GO:0005143) |
| 0.1 | 2.9 | GO:0043027 | cysteine-type endopeptidase inhibitor activity involved in apoptotic process(GO:0043027) |
| 0.1 | 1.0 | GO:0016712 | oxidoreductase activity, acting on paired donors, with incorporation or reduction of molecular oxygen, reduced flavin or flavoprotein as one donor, and incorporation of one atom of oxygen(GO:0016712) aromatase activity(GO:0070330) |
| 0.1 | 0.9 | GO:0032393 | MHC class I receptor activity(GO:0032393) |
| 0.1 | 0.2 | GO:0052816 | medium-chain acyl-CoA hydrolase activity(GO:0052815) long-chain acyl-CoA hydrolase activity(GO:0052816) |
| 0.1 | 1.6 | GO:0033130 | acetylcholine receptor binding(GO:0033130) |
| 0.1 | 7.1 | GO:0101005 | thiol-dependent ubiquitinyl hydrolase activity(GO:0036459) ubiquitinyl hydrolase activity(GO:0101005) |
| 0.1 | 1.6 | GO:0043539 | protein serine/threonine kinase activator activity(GO:0043539) |
| 0.1 | 1.0 | GO:0016813 | hydrolase activity, acting on carbon-nitrogen (but not peptide) bonds, in linear amidines(GO:0016813) |
| 0.1 | 0.7 | GO:0097371 | MDM2/MDM4 family protein binding(GO:0097371) |
| 0.1 | 0.7 | GO:0030169 | low-density lipoprotein particle binding(GO:0030169) |
| 0.1 | 0.4 | GO:0033691 | sialic acid binding(GO:0033691) |
| 0.1 | 0.6 | GO:0097157 | pre-mRNA intronic binding(GO:0097157) |
| 0.1 | 16.0 | GO:0051020 | GTPase binding(GO:0051020) |
| 0.1 | 0.7 | GO:0008430 | selenium binding(GO:0008430) |
| 0.1 | 0.2 | GO:0004711 | ribosomal protein S6 kinase activity(GO:0004711) |
| 0.1 | 0.5 | GO:0030020 | extracellular matrix structural constituent conferring tensile strength(GO:0030020) |
| 0.1 | 1.1 | GO:0035198 | miRNA binding(GO:0035198) |
| 0.1 | 0.4 | GO:0016714 | oxidoreductase activity, acting on paired donors, with incorporation or reduction of molecular oxygen, reduced pteridine as one donor, and incorporation of one atom of oxygen(GO:0016714) |
| 0.1 | 0.5 | GO:0035613 | RNA stem-loop binding(GO:0035613) |
| 0.1 | 0.7 | GO:0015643 | toxic substance binding(GO:0015643) |
| 0.0 | 0.8 | GO:0070300 | phosphatidic acid binding(GO:0070300) |
| 0.0 | 0.1 | GO:0052739 | phosphatidylserine 1-acylhydrolase activity(GO:0052739) |
| 0.0 | 0.7 | GO:0022820 | potassium:chloride symporter activity(GO:0015379) potassium ion symporter activity(GO:0022820) |
| 0.0 | 0.3 | GO:0097199 | cysteine-type endopeptidase activity involved in apoptotic signaling pathway(GO:0097199) |
| 0.0 | 1.3 | GO:0008143 | poly(A) binding(GO:0008143) |
| 0.0 | 1.3 | GO:0038187 | signaling pattern recognition receptor activity(GO:0008329) pattern recognition receptor activity(GO:0038187) |
| 0.0 | 0.6 | GO:0022851 | GABA-gated chloride ion channel activity(GO:0022851) |
| 0.0 | 1.0 | GO:0005247 | voltage-gated chloride channel activity(GO:0005247) |
| 0.0 | 1.9 | GO:0070577 | lysine-acetylated histone binding(GO:0070577) |
| 0.0 | 0.1 | GO:0008502 | melatonin receptor activity(GO:0008502) |
| 0.0 | 0.4 | GO:0046975 | histone methyltransferase activity (H3-K36 specific)(GO:0046975) |
| 0.0 | 0.3 | GO:0048019 | receptor antagonist activity(GO:0048019) |
| 0.0 | 0.2 | GO:0005221 | intracellular cyclic nucleotide activated cation channel activity(GO:0005221) cyclic nucleotide-gated ion channel activity(GO:0043855) |
| 0.0 | 0.6 | GO:0001223 | transcription coactivator binding(GO:0001223) |
| 0.0 | 0.0 | GO:0070697 | activin receptor binding(GO:0070697) |
| 0.0 | 2.6 | GO:0004712 | protein serine/threonine/tyrosine kinase activity(GO:0004712) |
| 0.0 | 0.8 | GO:0005109 | frizzled binding(GO:0005109) |
| 0.0 | 1.9 | GO:0004115 | 3',5'-cyclic-AMP phosphodiesterase activity(GO:0004115) |
| 0.0 | 1.2 | GO:0036002 | pre-mRNA binding(GO:0036002) |
| 0.0 | 1.2 | GO:0051019 | mitogen-activated protein kinase binding(GO:0051019) |
| 0.0 | 0.5 | GO:0008139 | nuclear localization sequence binding(GO:0008139) |
| 0.0 | 0.3 | GO:0032217 | riboflavin transporter activity(GO:0032217) |
| 0.0 | 3.3 | GO:0004197 | cysteine-type endopeptidase activity(GO:0004197) |
| 0.0 | 0.6 | GO:0016857 | racemase and epimerase activity, acting on carbohydrates and derivatives(GO:0016857) |
| 0.0 | 0.8 | GO:0002162 | dystroglycan binding(GO:0002162) |
| 0.0 | 1.6 | GO:0008066 | glutamate receptor activity(GO:0008066) |
| 0.0 | 0.5 | GO:0000150 | recombinase activity(GO:0000150) |
| 0.0 | 0.2 | GO:0004803 | transposase activity(GO:0004803) |
| 0.0 | 0.7 | GO:0008510 | sodium:bicarbonate symporter activity(GO:0008510) |
| 0.0 | 0.3 | GO:0001056 | RNA polymerase III activity(GO:0001056) |
| 0.0 | 6.9 | GO:0004252 | serine-type endopeptidase activity(GO:0004252) |
| 0.0 | 2.7 | GO:0008080 | N-acetyltransferase activity(GO:0008080) |
| 0.0 | 0.5 | GO:0004602 | glutathione peroxidase activity(GO:0004602) |
| 0.0 | 0.1 | GO:0044729 | hemi-methylated DNA-binding(GO:0044729) |
| 0.0 | 1.4 | GO:0005544 | calcium-dependent phospholipid binding(GO:0005544) |
| 0.0 | 1.2 | GO:0070412 | R-SMAD binding(GO:0070412) |
| 0.0 | 0.3 | GO:0070915 | lysophosphatidic acid receptor activity(GO:0070915) |
| 0.0 | 10.8 | GO:0000987 | core promoter proximal region sequence-specific DNA binding(GO:0000987) |
| 0.0 | 0.2 | GO:0030492 | hemoglobin binding(GO:0030492) |
| 0.0 | 0.6 | GO:0001102 | RNA polymerase II activating transcription factor binding(GO:0001102) |
| 0.0 | 0.3 | GO:0031013 | troponin I binding(GO:0031013) |
| 0.0 | 0.1 | GO:0042392 | sphingosine-1-phosphate phosphatase activity(GO:0042392) |
| 0.0 | 0.5 | GO:0042923 | neuropeptide binding(GO:0042923) |
| 0.0 | 0.1 | GO:0001588 | dopamine neurotransmitter receptor activity, coupled via Gs(GO:0001588) |
| 0.0 | 0.3 | GO:0004321 | fatty-acyl-CoA synthase activity(GO:0004321) |
| 0.0 | 1.1 | GO:0004364 | glutathione transferase activity(GO:0004364) |
| 0.0 | 0.7 | GO:0071949 | FAD binding(GO:0071949) |
| 0.0 | 0.9 | GO:0017112 | Rab guanyl-nucleotide exchange factor activity(GO:0017112) |
| 0.0 | 0.4 | GO:0008569 | ATP-dependent microtubule motor activity, minus-end-directed(GO:0008569) |
| 0.0 | 0.1 | GO:0010521 | telomerase inhibitor activity(GO:0010521) |
| 0.0 | 0.6 | GO:0042166 | acetylcholine binding(GO:0042166) |
| 0.0 | 0.1 | GO:0015562 | efflux transmembrane transporter activity(GO:0015562) |
| 0.0 | 0.1 | GO:0032810 | sterol response element binding(GO:0032810) |
| 0.0 | 0.2 | GO:0016493 | C-C chemokine receptor activity(GO:0016493) |
| 0.0 | 2.1 | GO:0004222 | metalloendopeptidase activity(GO:0004222) |
| 0.0 | 0.5 | GO:0000146 | microfilament motor activity(GO:0000146) |
| 0.0 | 0.1 | GO:0052798 | beta-galactoside alpha-2,3-sialyltransferase activity(GO:0052798) |
| 0.0 | 0.1 | GO:0004359 | glutaminase activity(GO:0004359) |
| 0.0 | 0.6 | GO:0043014 | alpha-tubulin binding(GO:0043014) |
| 0.0 | 0.3 | GO:0086080 | protein binding involved in heterotypic cell-cell adhesion(GO:0086080) |
| 0.0 | 1.0 | GO:0030507 | spectrin binding(GO:0030507) |
| 0.0 | 0.0 | GO:0002113 | interleukin-33 binding(GO:0002113) |
| 0.0 | 0.2 | GO:0043495 | protein anchor(GO:0043495) |
| 0.0 | 0.5 | GO:0005546 | phosphatidylinositol-4,5-bisphosphate binding(GO:0005546) |
| 0.0 | 0.3 | GO:0043422 | protein kinase B binding(GO:0043422) |
| 0.0 | 0.2 | GO:0004716 | receptor signaling protein tyrosine kinase activity(GO:0004716) |
| 0.0 | 1.0 | GO:0004693 | cyclin-dependent protein serine/threonine kinase activity(GO:0004693) |
| 0.0 | 0.1 | GO:0032184 | SUMO polymer binding(GO:0032184) |
| 0.0 | 0.3 | GO:0008195 | phosphatidate phosphatase activity(GO:0008195) |
| 0.0 | 0.2 | GO:0004383 | guanylate cyclase activity(GO:0004383) |
| 0.0 | 0.4 | GO:0005044 | scavenger receptor activity(GO:0005044) |
| 0.0 | 1.7 | GO:0008565 | protein transporter activity(GO:0008565) |
| 0.0 | 0.2 | GO:0009931 | calcium-dependent protein serine/threonine kinase activity(GO:0009931) |
| 0.0 | 0.9 | GO:0005254 | chloride channel activity(GO:0005254) |
| 0.0 | 0.3 | GO:0008188 | neuropeptide receptor activity(GO:0008188) |
| 0.0 | 0.2 | GO:0004000 | adenosine deaminase activity(GO:0004000) |
| 0.0 | 0.4 | GO:0043621 | protein self-association(GO:0043621) |
| 0.0 | 0.4 | GO:0015269 | calcium-activated potassium channel activity(GO:0015269) |
| 0.0 | 0.1 | GO:0008301 | DNA binding, bending(GO:0008301) |
| 0.0 | 0.1 | GO:0008422 | beta-glucosidase activity(GO:0008422) |
| 0.0 | 0.4 | GO:0016303 | 1-phosphatidylinositol-3-kinase activity(GO:0016303) |
| 0.0 | 0.4 | GO:0003887 | DNA-directed DNA polymerase activity(GO:0003887) |
| 0.0 | 2.5 | GO:0000287 | magnesium ion binding(GO:0000287) |
| 0.0 | 7.3 | GO:0004888 | transmembrane signaling receptor activity(GO:0004888) |
| 0.0 | 0.2 | GO:0003688 | DNA replication origin binding(GO:0003688) |
| 0.0 | 0.0 | GO:0004339 | glucan 1,4-alpha-glucosidase activity(GO:0004339) |
| 0.0 | 1.0 | GO:0005249 | voltage-gated potassium channel activity(GO:0005249) |
| 0.0 | 0.5 | GO:0005057 | receptor signaling protein activity(GO:0005057) |
| 0.0 | 0.3 | GO:0046934 | phosphatidylinositol-4,5-bisphosphate 3-kinase activity(GO:0046934) phosphatidylinositol bisphosphate kinase activity(GO:0052813) |
Gene overrepresentation in curated gene sets: canonical pathways category:
| Log-likelihood per target | Total log-likelihood | Term | Description |
|---|---|---|---|
| 0.6 | 4.7 | PID CXCR4 PATHWAY | CXCR4-mediated signaling events |
| 0.4 | 41.8 | PID CASPASE PATHWAY | Caspase cascade in apoptosis |
| 0.4 | 25.6 | PID FRA PATHWAY | Validated transcriptional targets of AP1 family members Fra1 and Fra2 |
| 0.3 | 17.2 | PID IL12 STAT4 PATHWAY | IL12 signaling mediated by STAT4 |
| 0.3 | 21.3 | PID NFAT TFPATHWAY | Calcineurin-regulated NFAT-dependent transcription in lymphocytes |
| 0.3 | 15.8 | PID CD8 TCR PATHWAY | TCR signaling in naïve CD8+ T cells |
| 0.3 | 13.9 | PID IL2 STAT5 PATHWAY | IL2 signaling events mediated by STAT5 |
| 0.2 | 4.9 | PID IL3 PATHWAY | IL3-mediated signaling events |
| 0.2 | 1.5 | ST STAT3 PATHWAY | STAT3 Pathway |
| 0.2 | 21.6 | PID CMYB PATHWAY | C-MYB transcription factor network |
| 0.2 | 3.6 | PID ARF 3PATHWAY | Arf1 pathway |
| 0.1 | 4.2 | PID IL23 PATHWAY | IL23-mediated signaling events |
| 0.1 | 1.4 | ST ERK1 ERK2 MAPK PATHWAY | ERK1/ERK2 MAPK Pathway |
| 0.1 | 0.9 | PID CONE PATHWAY | Visual signal transduction: Cones |
| 0.1 | 1.9 | NABA BASEMENT MEMBRANES | Genes encoding structural components of basement membranes |
| 0.1 | 7.0 | PID RAC1 PATHWAY | RAC1 signaling pathway |
| 0.1 | 1.6 | SA B CELL RECEPTOR COMPLEXES | Antigen binding to B cell receptors activates protein tyrosine kinases, such as the Src family, which ultimate activate MAP kinases. |
| 0.1 | 1.3 | ST WNT BETA CATENIN PATHWAY | Wnt/beta-catenin Pathway |
| 0.1 | 10.8 | PID AR PATHWAY | Coregulation of Androgen receptor activity |
| 0.1 | 6.6 | PID TXA2PATHWAY | Thromboxane A2 receptor signaling |
| 0.1 | 23.8 | NABA ECM REGULATORS | Genes encoding enzymes and their regulators involved in the remodeling of the extracellular matrix |
| 0.1 | 2.9 | ST WNT CA2 CYCLIC GMP PATHWAY | Wnt/Ca2+/cyclic GMP signaling. |
| 0.1 | 4.5 | PID BMP PATHWAY | BMP receptor signaling |
| 0.1 | 2.5 | PID RHODOPSIN PATHWAY | Visual signal transduction: Rods |
| 0.1 | 1.8 | PID HEDGEHOG 2PATHWAY | Signaling events mediated by the Hedgehog family |
| 0.1 | 1.4 | PID P38 MKK3 6PATHWAY | p38 MAPK signaling pathway |
| 0.1 | 3.0 | PID FCER1 PATHWAY | Fc-epsilon receptor I signaling in mast cells |
| 0.1 | 1.8 | PID AP1 PATHWAY | AP-1 transcription factor network |
| 0.1 | 1.6 | PID RXR VDR PATHWAY | RXR and RAR heterodimerization with other nuclear receptor |
| 0.1 | 2.3 | PID TNF PATHWAY | TNF receptor signaling pathway |
| 0.1 | 7.6 | PID SMAD2 3NUCLEAR PATHWAY | Regulation of nuclear SMAD2/3 signaling |
| 0.1 | 1.5 | PID IL8 CXCR2 PATHWAY | IL8- and CXCR2-mediated signaling events |
| 0.1 | 5.2 | PID ERA GENOMIC PATHWAY | Validated nuclear estrogen receptor alpha network |
| 0.1 | 1.6 | ST GA12 PATHWAY | G alpha 12 Pathway |
| 0.1 | 14.1 | NABA ECM GLYCOPROTEINS | Genes encoding structural ECM glycoproteins |
| 0.1 | 2.4 | PID CXCR3 PATHWAY | CXCR3-mediated signaling events |
| 0.1 | 1.5 | PID IL12 2PATHWAY | IL12-mediated signaling events |
| 0.1 | 4.2 | PID RHOA REG PATHWAY | Regulation of RhoA activity |
| 0.1 | 0.2 | PID ERBB NETWORK PATHWAY | ErbB receptor signaling network |
| 0.1 | 2.4 | ST DIFFERENTIATION PATHWAY IN PC12 CELLS | Differentiation Pathway in PC12 Cells; this is a specific case of PAC1 Receptor Pathway. |
| 0.1 | 1.1 | PID TCR PATHWAY | TCR signaling in naïve CD4+ T cells |
| 0.1 | 0.8 | PID KIT PATHWAY | Signaling events mediated by Stem cell factor receptor (c-Kit) |
| 0.1 | 0.8 | PID PI3KCI AKT PATHWAY | Class I PI3K signaling events mediated by Akt |
| 0.1 | 1.0 | PID RETINOIC ACID PATHWAY | Retinoic acid receptors-mediated signaling |
| 0.1 | 1.2 | PID SYNDECAN 3 PATHWAY | Syndecan-3-mediated signaling events |
| 0.0 | 3.9 | PID HIF1 TFPATHWAY | HIF-1-alpha transcription factor network |
| 0.0 | 1.0 | PID INTEGRIN2 PATHWAY | Beta2 integrin cell surface interactions |
| 0.0 | 2.6 | PID LKB1 PATHWAY | LKB1 signaling events |
| 0.0 | 1.2 | PID INSULIN PATHWAY | Insulin Pathway |
| 0.0 | 0.8 | PID MYC PATHWAY | C-MYC pathway |
| 0.0 | 12.2 | NABA SECRETED FACTORS | Genes encoding secreted soluble factors |
| 0.0 | 0.7 | PID SHP2 PATHWAY | SHP2 signaling |
| 0.0 | 0.6 | PID HEDGEHOG GLI PATHWAY | Hedgehog signaling events mediated by Gli proteins |
| 0.0 | 6.3 | NABA MATRISOME ASSOCIATED | Ensemble of genes encoding ECM-associated proteins including ECM-affilaited proteins, ECM regulators and secreted factors |
| 0.0 | 0.1 | PID IL2 PI3K PATHWAY | IL2 signaling events mediated by PI3K |
| 0.0 | 0.5 | ST P38 MAPK PATHWAY | p38 MAPK Pathway |
| 0.0 | 0.6 | ST T CELL SIGNAL TRANSDUCTION | T Cell Signal Transduction |
| 0.0 | 0.4 | PID ERBB2 ERBB3 PATHWAY | ErbB2/ErbB3 signaling events |
| 0.0 | 1.2 | PID HNF3B PATHWAY | FOXA2 and FOXA3 transcription factor networks |
| 0.0 | 0.6 | PID P75 NTR PATHWAY | p75(NTR)-mediated signaling |
| 0.0 | 0.3 | PID LPA4 PATHWAY | LPA4-mediated signaling events |
| 0.0 | 0.9 | PID TAP63 PATHWAY | Validated transcriptional targets of TAp63 isoforms |
| 0.0 | 0.3 | PID DNA PK PATHWAY | DNA-PK pathway in nonhomologous end joining |
| 0.0 | 0.6 | PID REG GR PATHWAY | Glucocorticoid receptor regulatory network |
| 0.0 | 0.3 | SIG REGULATION OF THE ACTIN CYTOSKELETON BY RHO GTPASES | Genes related to regulation of the actin cytoskeleton |
Gene overrepresentation in curated gene sets: REACTOME pathways category:
| Log-likelihood per target | Total log-likelihood | Term | Description |
|---|---|---|---|
| 1.3 | 14.8 | REACTOME ENDOSOMAL VACUOLAR PATHWAY | Genes involved in Endosomal/Vacuolar pathway |
| 0.9 | 22.0 | REACTOME PHOSPHORYLATION OF CD3 AND TCR ZETA CHAINS | Genes involved in Phosphorylation of CD3 and TCR zeta chains |
| 0.7 | 10.7 | REACTOME REVERSIBLE HYDRATION OF CARBON DIOXIDE | Genes involved in Reversible Hydration of Carbon Dioxide |
| 0.7 | 16.0 | REACTOME INTRINSIC PATHWAY | Genes involved in Intrinsic Pathway |
| 0.6 | 20.0 | REACTOME DOWNSTREAM TCR SIGNALING | Genes involved in Downstream TCR signaling |
| 0.5 | 92.7 | REACTOME SIGNALING BY RHO GTPASES | Genes involved in Signaling by Rho GTPases |
| 0.5 | 12.4 | REACTOME CS DS DEGRADATION | Genes involved in CS/DS degradation |
| 0.4 | 6.6 | REACTOME ABACAVIR TRANSPORT AND METABOLISM | Genes involved in Abacavir transport and metabolism |
| 0.4 | 9.0 | REACTOME NOREPINEPHRINE NEUROTRANSMITTER RELEASE CYCLE | Genes involved in Norepinephrine Neurotransmitter Release Cycle |
| 0.4 | 8.4 | REACTOME AMINE DERIVED HORMONES | Genes involved in Amine-derived hormones |
| 0.3 | 1.4 | REACTOME RECYCLING OF BILE ACIDS AND SALTS | Genes involved in Recycling of bile acids and salts |
| 0.3 | 3.7 | REACTOME CREATION OF C4 AND C2 ACTIVATORS | Genes involved in Creation of C4 and C2 activators |
| 0.3 | 13.4 | REACTOME EFFECTS OF PIP2 HYDROLYSIS | Genes involved in Effects of PIP2 hydrolysis |
| 0.3 | 2.2 | REACTOME UNFOLDED PROTEIN RESPONSE | Genes involved in Unfolded Protein Response |
| 0.3 | 1.5 | REACTOME BINDING AND ENTRY OF HIV VIRION | Genes involved in Binding and entry of HIV virion |
| 0.3 | 5.1 | REACTOME SIGNALING BY BMP | Genes involved in Signaling by BMP |
| 0.3 | 3.0 | REACTOME DIGESTION OF DIETARY CARBOHYDRATE | Genes involved in Digestion of dietary carbohydrate |
| 0.2 | 2.0 | REACTOME DSCAM INTERACTIONS | Genes involved in DSCAM interactions |
| 0.2 | 6.7 | REACTOME HORMONE SENSITIVE LIPASE HSL MEDIATED TRIACYLGLYCEROL HYDROLYSIS | Genes involved in Hormone-sensitive lipase (HSL)-mediated triacylglycerol hydrolysis |
| 0.2 | 4.5 | REACTOME CD28 DEPENDENT VAV1 PATHWAY | Genes involved in CD28 dependent Vav1 pathway |
| 0.2 | 5.8 | REACTOME ADHERENS JUNCTIONS INTERACTIONS | Genes involved in Adherens junctions interactions |
| 0.2 | 3.8 | REACTOME THE NLRP3 INFLAMMASOME | Genes involved in The NLRP3 inflammasome |
| 0.2 | 14.1 | REACTOME MYOGENESIS | Genes involved in Myogenesis |
| 0.2 | 4.1 | REACTOME SYNTHESIS OF PIPS AT THE GOLGI MEMBRANE | Genes involved in Synthesis of PIPs at the Golgi membrane |
| 0.2 | 5.9 | REACTOME RAS ACTIVATION UOPN CA2 INFUX THROUGH NMDA RECEPTOR | Genes involved in Ras activation uopn Ca2+ infux through NMDA receptor |
| 0.2 | 5.6 | REACTOME RNA POL I TRANSCRIPTION TERMINATION | Genes involved in RNA Polymerase I Transcription Termination |
| 0.2 | 2.5 | REACTOME GLUTAMATE NEUROTRANSMITTER RELEASE CYCLE | Genes involved in Glutamate Neurotransmitter Release Cycle |
| 0.2 | 2.1 | REACTOME ANDROGEN BIOSYNTHESIS | Genes involved in Androgen biosynthesis |
| 0.2 | 13.7 | REACTOME OLFACTORY SIGNALING PATHWAY | Genes involved in Olfactory Signaling Pathway |
| 0.1 | 3.0 | REACTOME OTHER SEMAPHORIN INTERACTIONS | Genes involved in Other semaphorin interactions |
| 0.1 | 2.9 | REACTOME PROTEOLYTIC CLEAVAGE OF SNARE COMPLEX PROTEINS | Genes involved in Proteolytic cleavage of SNARE complex proteins |
| 0.1 | 1.6 | REACTOME INFLAMMASOMES | Genes involved in Inflammasomes |
| 0.1 | 0.9 | REACTOME RNA POL I TRANSCRIPTION INITIATION | Genes involved in RNA Polymerase I Transcription Initiation |
| 0.1 | 7.7 | REACTOME CHEMOKINE RECEPTORS BIND CHEMOKINES | Genes involved in Chemokine receptors bind chemokines |
| 0.1 | 9.9 | REACTOME IMMUNOREGULATORY INTERACTIONS BETWEEN A LYMPHOID AND A NON LYMPHOID CELL | Genes involved in Immunoregulatory interactions between a Lymphoid and a non-Lymphoid cell |
| 0.1 | 1.8 | REACTOME IL 6 SIGNALING | Genes involved in Interleukin-6 signaling |
| 0.1 | 0.7 | REACTOME INITIAL TRIGGERING OF COMPLEMENT | Genes involved in Initial triggering of complement |
| 0.1 | 1.1 | REACTOME OPSINS | Genes involved in Opsins |
| 0.1 | 2.6 | REACTOME NUCLEOTIDE BINDING DOMAIN LEUCINE RICH REPEAT CONTAINING RECEPTOR NLR SIGNALING PATHWAYS | Genes involved in Nucleotide-binding domain, leucine rich repeat containing receptor (NLR) signaling pathways |
| 0.1 | 2.3 | REACTOME REGULATION OF INSULIN LIKE GROWTH FACTOR IGF ACTIVITY BY INSULIN LIKE GROWTH FACTOR BINDING PROTEINS IGFBPS | Genes involved in Regulation of Insulin-like Growth Factor (IGF) Activity by Insulin-like Growth Factor Binding Proteins (IGFBPs) |
| 0.1 | 4.0 | REACTOME INTERACTION BETWEEN L1 AND ANKYRINS | Genes involved in Interaction between L1 and Ankyrins |
| 0.1 | 2.4 | REACTOME CONVERSION FROM APC C CDC20 TO APC C CDH1 IN LATE ANAPHASE | Genes involved in Conversion from APC/C:Cdc20 to APC/C:Cdh1 in late anaphase |
| 0.1 | 2.0 | REACTOME RAP1 SIGNALLING | Genes involved in Rap1 signalling |
| 0.1 | 2.8 | REACTOME SYNTHESIS OF PA | Genes involved in Synthesis of PA |
| 0.1 | 3.5 | REACTOME ABC FAMILY PROTEINS MEDIATED TRANSPORT | Genes involved in ABC-family proteins mediated transport |
| 0.1 | 1.6 | REACTOME EICOSANOID LIGAND BINDING RECEPTORS | Genes involved in Eicosanoid ligand-binding receptors |
| 0.1 | 11.1 | REACTOME TRANSPORT OF INORGANIC CATIONS ANIONS AND AMINO ACIDS OLIGOPEPTIDES | Genes involved in Transport of inorganic cations/anions and amino acids/oligopeptides |
| 0.1 | 2.1 | REACTOME CASPASE MEDIATED CLEAVAGE OF CYTOSKELETAL PROTEINS | Genes involved in Caspase-mediated cleavage of cytoskeletal proteins |
| 0.1 | 2.9 | REACTOME PYRIMIDINE METABOLISM | Genes involved in Pyrimidine metabolism |
| 0.1 | 2.2 | REACTOME KERATAN SULFATE BIOSYNTHESIS | Genes involved in Keratan sulfate biosynthesis |
| 0.1 | 3.4 | REACTOME TRANSPORT TO THE GOLGI AND SUBSEQUENT MODIFICATION | Genes involved in Transport to the Golgi and subsequent modification |
| 0.1 | 2.8 | REACTOME INHIBITION OF INSULIN SECRETION BY ADRENALINE NORADRENALINE | Genes involved in Inhibition of Insulin Secretion by Adrenaline/Noradrenaline |
| 0.1 | 1.1 | REACTOME REGULATION OF SIGNALING BY CBL | Genes involved in Regulation of signaling by CBL |
| 0.1 | 0.2 | REACTOME SYNTHESIS OF BILE ACIDS AND BILE SALTS VIA 7ALPHA HYDROXYCHOLESTEROL | Genes involved in Synthesis of bile acids and bile salts via 7alpha-hydroxycholesterol |
| 0.1 | 1.1 | REACTOME SYNTHESIS OF SUBSTRATES IN N GLYCAN BIOSYTHESIS | Genes involved in Synthesis of substrates in N-glycan biosythesis |
| 0.1 | 1.3 | REACTOME CLASS C 3 METABOTROPIC GLUTAMATE PHEROMONE RECEPTORS | Genes involved in Class C/3 (Metabotropic glutamate/pheromone receptors) |
| 0.1 | 1.3 | REACTOME GABA SYNTHESIS RELEASE REUPTAKE AND DEGRADATION | Genes involved in GABA synthesis, release, reuptake and degradation |
| 0.1 | 16.0 | REACTOME CLASS A1 RHODOPSIN LIKE RECEPTORS | Genes involved in Class A/1 (Rhodopsin-like receptors) |
| 0.1 | 0.8 | REACTOME SYNTHESIS OF BILE ACIDS AND BILE SALTS VIA 24 HYDROXYCHOLESTEROL | Genes involved in Synthesis of bile acids and bile salts via 24-hydroxycholesterol |
| 0.1 | 1.4 | REACTOME COMPLEMENT CASCADE | Genes involved in Complement cascade |
| 0.1 | 6.5 | REACTOME GPCR LIGAND BINDING | Genes involved in GPCR ligand binding |
| 0.1 | 0.8 | REACTOME NA CL DEPENDENT NEUROTRANSMITTER TRANSPORTERS | Genes involved in Na+/Cl- dependent neurotransmitter transporters |
| 0.1 | 1.5 | REACTOME REGULATION OF AMPK ACTIVITY VIA LKB1 | Genes involved in Regulation of AMPK activity via LKB1 |
| 0.1 | 0.7 | REACTOME THE ACTIVATION OF ARYLSULFATASES | Genes involved in The activation of arylsulfatases |
| 0.1 | 1.2 | REACTOME SYNTHESIS OF GLYCOSYLPHOSPHATIDYLINOSITOL GPI | Genes involved in Synthesis of glycosylphosphatidylinositol (GPI) |
| 0.1 | 1.0 | REACTOME TGF BETA RECEPTOR SIGNALING IN EMT EPITHELIAL TO MESENCHYMAL TRANSITION | Genes involved in TGF-beta receptor signaling in EMT (epithelial to mesenchymal transition) |
| 0.1 | 1.6 | REACTOME THE ROLE OF NEF IN HIV1 REPLICATION AND DISEASE PATHOGENESIS | Genes involved in The role of Nef in HIV-1 replication and disease pathogenesis |
| 0.1 | 1.9 | REACTOME LIPOPROTEIN METABOLISM | Genes involved in Lipoprotein metabolism |
| 0.1 | 0.8 | REACTOME ACTIVATION OF BH3 ONLY PROTEINS | Genes involved in Activation of BH3-only proteins |
| 0.1 | 1.6 | REACTOME AMYLOIDS | Genes involved in Amyloids |
| 0.0 | 1.0 | REACTOME G ALPHA I SIGNALLING EVENTS | Genes involved in G alpha (i) signalling events |
| 0.0 | 2.2 | REACTOME MRNA SPLICING MINOR PATHWAY | Genes involved in mRNA Splicing - Minor Pathway |
| 0.0 | 1.0 | REACTOME NEPHRIN INTERACTIONS | Genes involved in Nephrin interactions |
| 0.0 | 1.8 | REACTOME MRNA 3 END PROCESSING | Genes involved in mRNA 3'-end processing |
| 0.0 | 0.9 | REACTOME CYTOSOLIC SULFONATION OF SMALL MOLECULES | Genes involved in Cytosolic sulfonation of small molecules |
| 0.0 | 1.9 | REACTOME G ALPHA S SIGNALLING EVENTS | Genes involved in G alpha (s) signalling events |
| 0.0 | 0.3 | REACTOME RNA POL III CHAIN ELONGATION | Genes involved in RNA Polymerase III Chain Elongation |
| 0.0 | 1.0 | REACTOME CELL SURFACE INTERACTIONS AT THE VASCULAR WALL | Genes involved in Cell surface interactions at the vascular wall |
| 0.0 | 3.4 | REACTOME NUCLEAR RECEPTOR TRANSCRIPTION PATHWAY | Genes involved in Nuclear Receptor transcription pathway |
| 0.0 | 1.3 | REACTOME 3 UTR MEDIATED TRANSLATIONAL REGULATION | Genes involved in 3' -UTR-mediated translational regulation |
| 0.0 | 0.4 | REACTOME REGULATION OF KIT SIGNALING | Genes involved in Regulation of KIT signaling |
| 0.0 | 0.4 | REACTOME JNK C JUN KINASES PHOSPHORYLATION AND ACTIVATION MEDIATED BY ACTIVATED HUMAN TAK1 | Genes involved in JNK (c-Jun kinases) phosphorylation and activation mediated by activated human TAK1 |
| 0.0 | 0.6 | REACTOME TCR SIGNALING | Genes involved in TCR signaling |
| 0.0 | 1.5 | REACTOME GLYCOLYSIS | Genes involved in Glycolysis |
| 0.0 | 0.3 | REACTOME ETHANOL OXIDATION | Genes involved in Ethanol oxidation |
| 0.0 | 1.1 | REACTOME LATENT INFECTION OF HOMO SAPIENS WITH MYCOBACTERIUM TUBERCULOSIS | Genes involved in Latent infection of Homo sapiens with Mycobacterium tuberculosis |
| 0.0 | 0.6 | REACTOME PRESYNAPTIC NICOTINIC ACETYLCHOLINE RECEPTORS | Genes involved in Presynaptic nicotinic acetylcholine receptors |
| 0.0 | 0.5 | REACTOME BILE SALT AND ORGANIC ANION SLC TRANSPORTERS | Genes involved in Bile salt and organic anion SLC transporters |
| 0.0 | 0.6 | REACTOME PLATELET SENSITIZATION BY LDL | Genes involved in Platelet sensitization by LDL |
| 0.0 | 1.9 | REACTOME PHASE1 FUNCTIONALIZATION OF COMPOUNDS | Genes involved in Phase 1 - Functionalization of compounds |
| 0.0 | 0.3 | REACTOME NFKB ACTIVATION THROUGH FADD RIP1 PATHWAY MEDIATED BY CASPASE 8 AND10 | Genes involved in NF-kB activation through FADD/RIP-1 pathway mediated by caspase-8 and -10 |
| 0.0 | 1.0 | REACTOME HEPARAN SULFATE HEPARIN HS GAG METABOLISM | Genes involved in Heparan sulfate/heparin (HS-GAG) metabolism |
| 0.0 | 0.2 | REACTOME SPRY REGULATION OF FGF SIGNALING | Genes involved in Spry regulation of FGF signaling |
| 0.0 | 3.7 | REACTOME PEPTIDE CHAIN ELONGATION | Genes involved in Peptide chain elongation |
| 0.0 | 1.7 | REACTOME MRNA SPLICING | Genes involved in mRNA Splicing |
| 0.0 | 1.2 | REACTOME VOLTAGE GATED POTASSIUM CHANNELS | Genes involved in Voltage gated Potassium channels |
| 0.0 | 0.6 | REACTOME GABA A RECEPTOR ACTIVATION | Genes involved in GABA A receptor activation |
| 0.0 | 0.3 | REACTOME MEIOSIS | Genes involved in Meiosis |
| 0.0 | 0.4 | REACTOME CGMP EFFECTS | Genes involved in cGMP effects |
| 0.0 | 0.6 | REACTOME CHOLESTEROL BIOSYNTHESIS | Genes involved in Cholesterol biosynthesis |
| 0.0 | 0.5 | REACTOME ACTIVATION OF GENES BY ATF4 | Genes involved in Activation of Genes by ATF4 |
| 0.0 | 0.9 | REACTOME PPARA ACTIVATES GENE EXPRESSION | Genes involved in PPARA Activates Gene Expression |
| 0.0 | 0.4 | REACTOME TRAF6 MEDIATED IRF7 ACTIVATION | Genes involved in TRAF6 mediated IRF7 activation |