Project
GNF SymAtlas + NCI-60 cancer cell lines, human (Su, 2004; Ross, 2000)
Navigation
Downloads
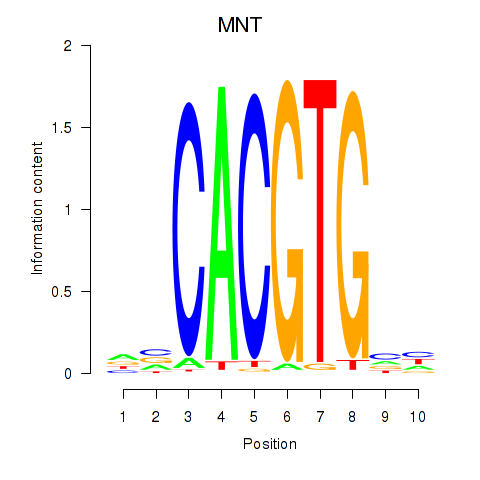
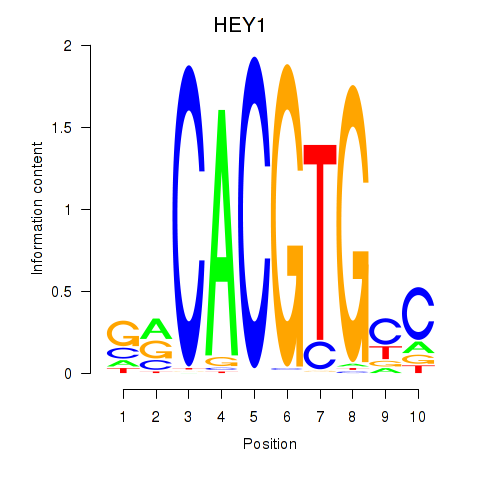
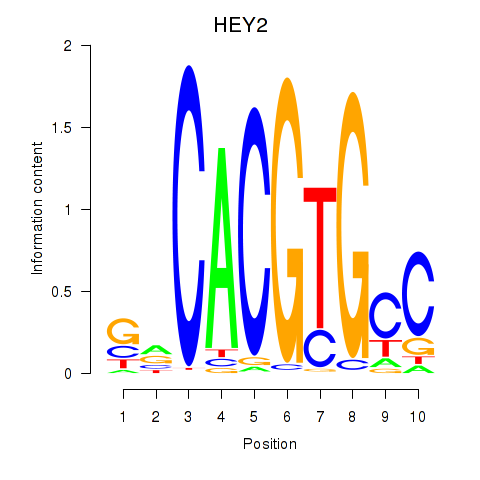
Results for MNT_HEY1_HEY2
Z-value: 1.83
Motif logo
Transcription factors associated with MNT_HEY1_HEY2
| Gene Symbol | Gene ID | Gene Info |
|---|---|---|
|
MNT
|
ENSG00000070444.15 | MNT |
|
HEY1
|
ENSG00000164683.18 | HEY1 |
|
HEY2
|
ENSG00000135547.9 | HEY2 |
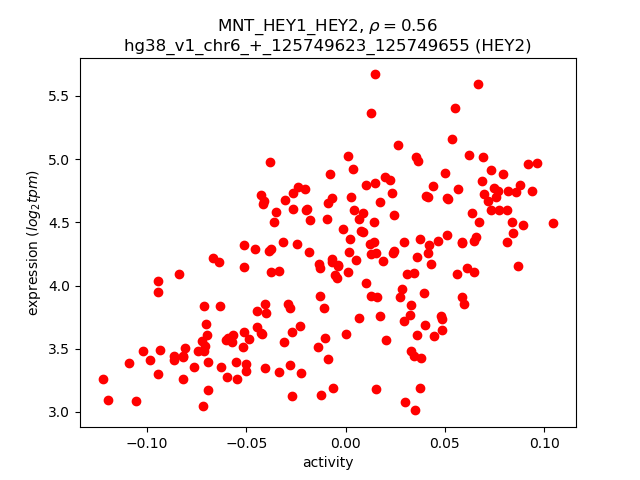
Activity-expression correlation:
| Gene | Promoter | Pearson corr. coef. | P-value | Plot |
|---|---|---|---|---|
| HEY2 | hg38_v1_chr6_+_125749623_125749655 | 0.56 | 3.5e-19 | Click! |
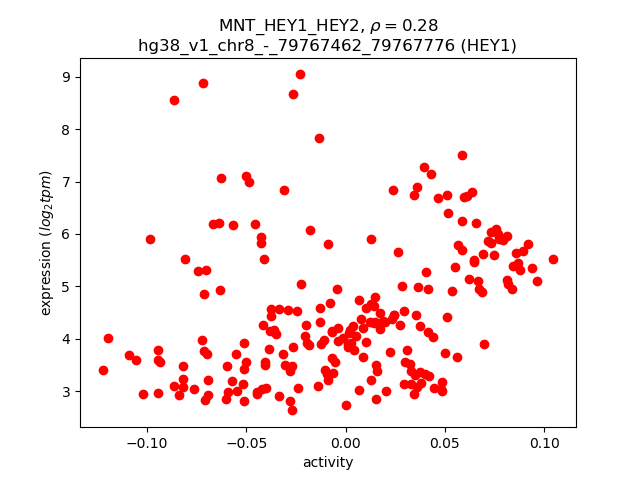
| HEY1 | hg38_v1_chr8_-_79767462_79767776, hg38_v1_chr8_-_79767843_79767867 | 0.28 | 3.5e-05 | Click! |
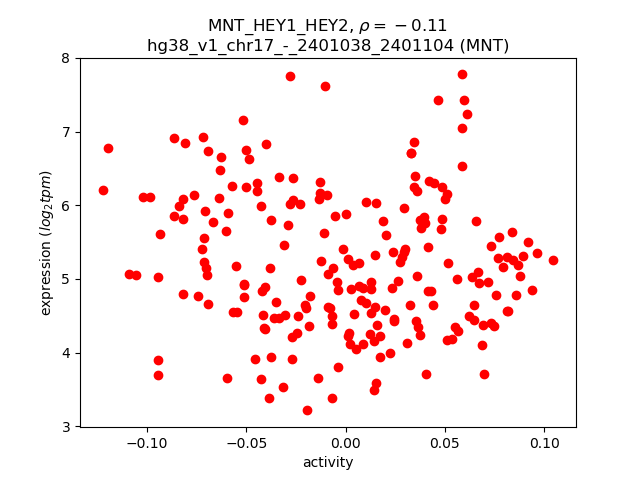
| MNT | hg38_v1_chr17_-_2401038_2401104 | -0.11 | 1.2e-01 | Click! |
Activity profile of MNT_HEY1_HEY2 motif
Sorted Z-values of MNT_HEY1_HEY2 motif
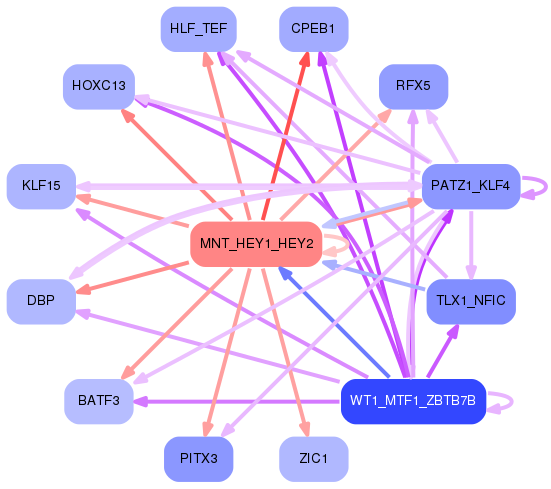
Network of associatons between targets according to the STRING database.

First level regulatory network of MNT_HEY1_HEY2
Gene Ontology Analysis
Gene overrepresentation in biological process category:
| Log-likelihood per target | Total log-likelihood | Term | Description |
|---|---|---|---|
| 30.3 | 181.9 | GO:0070829 | response to vitamin B2(GO:0033274) heterochromatin maintenance(GO:0070829) |
| 27.5 | 137.7 | GO:0002904 | positive regulation of B cell apoptotic process(GO:0002904) |
| 26.0 | 78.0 | GO:0097477 | spinal cord motor neuron migration(GO:0097476) lateral motor column neuron migration(GO:0097477) |
| 12.5 | 150.1 | GO:0051612 | negative regulation of neurotransmitter uptake(GO:0051581) regulation of serotonin uptake(GO:0051611) negative regulation of serotonin uptake(GO:0051612) |
| 12.4 | 37.1 | GO:2000048 | negative regulation of cell-cell adhesion mediated by cadherin(GO:2000048) |
| 11.3 | 79.3 | GO:0034587 | piRNA metabolic process(GO:0034587) |
| 11.2 | 33.6 | GO:1902948 | regulation of choline O-acetyltransferase activity(GO:1902769) positive regulation of choline O-acetyltransferase activity(GO:1902771) negative regulation of tau-protein kinase activity(GO:1902948) positive regulation of early endosome to recycling endosome transport(GO:1902955) negative regulation of aspartic-type endopeptidase activity involved in amyloid precursor protein catabolic process(GO:1902960) negative regulation of neurofibrillary tangle assembly(GO:1902997) negative regulation of aspartic-type peptidase activity(GO:1905246) |
| 11.0 | 66.2 | GO:0032377 | regulation of intracellular lipid transport(GO:0032377) regulation of intracellular sterol transport(GO:0032380) regulation of intracellular cholesterol transport(GO:0032383) |
| 10.9 | 32.6 | GO:0014022 | neural plate elongation(GO:0014022) convergent extension involved in neural plate elongation(GO:0022007) |
| 10.6 | 63.5 | GO:0030644 | cellular chloride ion homeostasis(GO:0030644) |
| 9.8 | 19.5 | GO:1902263 | apoptotic process involved in embryonic digit morphogenesis(GO:1902263) |
| 9.7 | 38.7 | GO:0086097 | phospholipase C-activating angiotensin-activated signaling pathway(GO:0086097) |
| 9.3 | 27.8 | GO:0070077 | peptidyl-lysine hydroxylation to 5-hydroxy-L-lysine(GO:0018395) histone arginine demethylation(GO:0070077) histone H3-R2 demethylation(GO:0070078) histone H4-R3 demethylation(GO:0070079) |
| 8.4 | 84.2 | GO:2000766 | negative regulation of cytoplasmic translation(GO:2000766) |
| 8.3 | 91.7 | GO:0097116 | gephyrin clustering involved in postsynaptic density assembly(GO:0097116) |
| 8.0 | 24.0 | GO:1902595 | regulation of DNA replication origin binding(GO:1902595) |
| 7.9 | 31.5 | GO:1901339 | regulation of store-operated calcium channel activity(GO:1901339) |
| 7.3 | 21.8 | GO:0021722 | superior olivary nucleus development(GO:0021718) superior olivary nucleus maturation(GO:0021722) |
| 7.0 | 21.1 | GO:1903568 | negative regulation of protein localization to cilium(GO:1903565) regulation of protein localization to ciliary membrane(GO:1903567) negative regulation of protein localization to ciliary membrane(GO:1903568) |
| 6.8 | 40.9 | GO:0016926 | protein desumoylation(GO:0016926) |
| 6.8 | 27.3 | GO:1904327 | protein localization to cytosolic proteasome complex(GO:1904327) protein localization to cytosolic proteasome complex involved in ERAD pathway(GO:1904379) |
| 6.7 | 20.2 | GO:0046878 | positive regulation of saliva secretion(GO:0046878) |
| 6.5 | 19.6 | GO:1904933 | regulation of cell proliferation in midbrain(GO:1904933) |
| 6.5 | 19.4 | GO:0090031 | positive regulation of steroid hormone biosynthetic process(GO:0090031) |
| 5.7 | 22.9 | GO:0019074 | viral genome packaging(GO:0019072) viral RNA genome packaging(GO:0019074) |
| 5.7 | 17.0 | GO:1902490 | regulation of sperm capacitation(GO:1902490) |
| 5.6 | 100.6 | GO:0050812 | regulation of acetyl-CoA biosynthetic process from pyruvate(GO:0010510) regulation of acyl-CoA biosynthetic process(GO:0050812) |
| 5.5 | 27.5 | GO:0061762 | CAMKK-AMPK signaling cascade(GO:0061762) |
| 5.3 | 26.5 | GO:0071494 | cellular response to UV-C(GO:0071494) |
| 5.1 | 30.4 | GO:1903936 | cellular response to sodium arsenite(GO:1903936) |
| 4.6 | 92.7 | GO:0051823 | regulation of synapse structural plasticity(GO:0051823) |
| 4.6 | 13.9 | GO:0003358 | noradrenergic neuron development(GO:0003358) |
| 4.6 | 18.4 | GO:0019470 | 4-hydroxyproline catabolic process(GO:0019470) |
| 4.5 | 22.3 | GO:0042796 | snRNA transcription from RNA polymerase III promoter(GO:0042796) |
| 4.3 | 13.0 | GO:0036079 | GDP-fucose transport(GO:0015783) purine nucleotide-sugar transport(GO:0036079) |
| 4.3 | 17.1 | GO:1903070 | negative regulation of ER-associated ubiquitin-dependent protein catabolic process(GO:1903070) |
| 4.2 | 12.6 | GO:0001207 | histone displacement(GO:0001207) positive regulation of transcription involved in meiotic cell cycle(GO:0051039) |
| 4.1 | 12.2 | GO:0090521 | glomerular visceral epithelial cell migration(GO:0090521) |
| 4.0 | 32.1 | GO:0035878 | nail development(GO:0035878) |
| 4.0 | 12.0 | GO:0009183 | ADP biosynthetic process(GO:0006172) purine deoxyribonucleoside diphosphate biosynthetic process(GO:0009183) |
| 3.9 | 23.5 | GO:1990253 | cellular response to leucine starvation(GO:1990253) |
| 3.8 | 3.8 | GO:0035106 | operant conditioning(GO:0035106) |
| 3.7 | 22.4 | GO:0030885 | regulation of myeloid dendritic cell activation(GO:0030885) |
| 3.7 | 11.2 | GO:0061034 | olfactory bulb mitral cell layer development(GO:0061034) |
| 3.7 | 18.5 | GO:0006772 | thiamine metabolic process(GO:0006772) |
| 3.7 | 7.3 | GO:0051885 | positive regulation of anagen(GO:0051885) |
| 3.6 | 10.7 | GO:0006864 | pyrimidine nucleotide transport(GO:0006864) mitochondrial pyrimidine nucleotide import(GO:1990519) |
| 3.5 | 46.0 | GO:1901838 | positive regulation of transcription of nuclear large rRNA transcript from RNA polymerase I promoter(GO:1901838) |
| 3.5 | 31.7 | GO:0046549 | retinal cone cell differentiation(GO:0042670) retinal cone cell development(GO:0046549) |
| 3.3 | 26.3 | GO:2000047 | regulation of cell-cell adhesion mediated by cadherin(GO:2000047) positive regulation of cell-cell adhesion mediated by cadherin(GO:2000049) |
| 3.2 | 38.9 | GO:0014049 | positive regulation of glutamate secretion(GO:0014049) |
| 3.2 | 50.8 | GO:0043117 | positive regulation of vascular permeability(GO:0043117) |
| 3.1 | 15.5 | GO:0043988 | histone H3-S28 phosphorylation(GO:0043988) |
| 3.1 | 21.7 | GO:1902231 | positive regulation of intrinsic apoptotic signaling pathway in response to DNA damage(GO:1902231) |
| 3.1 | 24.4 | GO:1900113 | negative regulation of histone H3-K9 trimethylation(GO:1900113) |
| 3.1 | 9.2 | GO:0010807 | regulation of synaptic vesicle priming(GO:0010807) |
| 3.0 | 3.0 | GO:2001274 | negative regulation of glucose import in response to insulin stimulus(GO:2001274) |
| 3.0 | 14.9 | GO:0046167 | glycerol-3-phosphate biosynthetic process(GO:0046167) |
| 2.9 | 5.9 | GO:0007412 | axon target recognition(GO:0007412) |
| 2.9 | 8.8 | GO:0003430 | growth plate cartilage chondrocyte growth(GO:0003430) growth plate cartilage chondrocyte development(GO:0003431) |
| 2.9 | 8.8 | GO:0019482 | beta-alanine metabolic process(GO:0019482) |
| 2.9 | 11.6 | GO:0007206 | phospholipase C-activating G-protein coupled glutamate receptor signaling pathway(GO:0007206) |
| 2.9 | 11.5 | GO:1904021 | regulation of G-protein coupled receptor internalization(GO:1904020) negative regulation of G-protein coupled receptor internalization(GO:1904021) |
| 2.9 | 11.5 | GO:0086053 | SA node cell to atrial cardiac muscle cell communication by electrical coupling(GO:0086021) AV node cell to bundle of His cell communication by electrical coupling(GO:0086053) |
| 2.9 | 20.1 | GO:1990504 | dense core granule exocytosis(GO:1990504) |
| 2.8 | 19.5 | GO:0000255 | allantoin metabolic process(GO:0000255) |
| 2.7 | 5.4 | GO:1901624 | negative regulation of lymphocyte chemotaxis(GO:1901624) |
| 2.7 | 2.7 | GO:0030961 | peptidyl-arginine hydroxylation(GO:0030961) |
| 2.7 | 10.6 | GO:0032466 | negative regulation of cytokinesis(GO:0032466) |
| 2.6 | 7.9 | GO:0036090 | cleavage furrow ingression(GO:0036090) |
| 2.6 | 5.2 | GO:0098528 | skeletal muscle fiber differentiation(GO:0098528) regulation of skeletal muscle fiber differentiation(GO:1902809) |
| 2.6 | 13.0 | GO:0071442 | positive regulation of histone H3-K14 acetylation(GO:0071442) |
| 2.6 | 10.3 | GO:0035054 | atrial septum secundum morphogenesis(GO:0003290) embryonic heart tube anterior/posterior pattern specification(GO:0035054) |
| 2.6 | 38.3 | GO:0006610 | ribosomal protein import into nucleus(GO:0006610) |
| 2.6 | 28.1 | GO:2000427 | positive regulation of apoptotic cell clearance(GO:2000427) |
| 2.5 | 22.8 | GO:0060136 | embryonic process involved in female pregnancy(GO:0060136) |
| 2.5 | 63.2 | GO:0006884 | cell volume homeostasis(GO:0006884) |
| 2.5 | 22.6 | GO:0007135 | meiosis II(GO:0007135) |
| 2.5 | 12.4 | GO:0051029 | rRNA transport(GO:0051029) |
| 2.5 | 12.3 | GO:0008063 | Toll signaling pathway(GO:0008063) |
| 2.5 | 7.4 | GO:0002949 | tRNA threonylcarbamoyladenosine modification(GO:0002949) |
| 2.4 | 12.2 | GO:0009233 | menaquinone metabolic process(GO:0009233) |
| 2.4 | 14.6 | GO:0010734 | protein glutathionylation(GO:0010731) regulation of protein glutathionylation(GO:0010732) negative regulation of protein glutathionylation(GO:0010734) |
| 2.4 | 31.6 | GO:0033617 | mitochondrial respiratory chain complex IV assembly(GO:0033617) |
| 2.4 | 19.3 | GO:0035524 | proline transmembrane transport(GO:0035524) |
| 2.4 | 7.2 | GO:0044565 | dendritic cell proliferation(GO:0044565) |
| 2.4 | 9.5 | GO:0044533 | induction of programmed cell death(GO:0012502) peptidyl-cysteine S-trans-nitrosylation(GO:0035606) positive regulation of apoptotic process in other organism(GO:0044533) positive regulation by symbiont of host programmed cell death(GO:0052042) positive regulation by organism of programmed cell death in other organism involved in symbiotic interaction(GO:0052330) positive regulation by organism of apoptotic process in other organism involved in symbiotic interaction(GO:0052501) |
| 2.3 | 44.3 | GO:0097186 | amelogenesis(GO:0097186) |
| 2.3 | 25.6 | GO:0006108 | malate metabolic process(GO:0006108) |
| 2.3 | 64.0 | GO:0032012 | regulation of ARF protein signal transduction(GO:0032012) |
| 2.3 | 11.4 | GO:0048318 | axial mesoderm development(GO:0048318) |
| 2.3 | 15.9 | GO:0070127 | tRNA aminoacylation for mitochondrial protein translation(GO:0070127) |
| 2.3 | 18.0 | GO:0000160 | phosphorelay signal transduction system(GO:0000160) |
| 2.2 | 13.4 | GO:0051138 | positive regulation of NK T cell differentiation(GO:0051138) |
| 2.2 | 8.9 | GO:0034628 | nicotinamide nucleotide biosynthetic process from aspartate(GO:0019355) 'de novo' NAD biosynthetic process(GO:0034627) 'de novo' NAD biosynthetic process from aspartate(GO:0034628) |
| 2.2 | 22.0 | GO:0034058 | endosomal vesicle fusion(GO:0034058) |
| 2.2 | 6.6 | GO:0015670 | carbon dioxide transport(GO:0015670) |
| 2.2 | 15.2 | GO:1902731 | ovarian cumulus expansion(GO:0001550) fused antrum stage(GO:0048165) negative regulation of chondrocyte proliferation(GO:1902731) |
| 2.2 | 25.9 | GO:0035751 | regulation of lysosomal lumen pH(GO:0035751) |
| 2.2 | 4.3 | GO:0006072 | glycerol-3-phosphate metabolic process(GO:0006072) |
| 2.1 | 8.6 | GO:0099558 | maintenance of synapse structure(GO:0099558) |
| 2.1 | 8.6 | GO:0060734 | regulation of endoplasmic reticulum stress-induced eIF2 alpha phosphorylation(GO:0060734) |
| 2.1 | 10.7 | GO:0014807 | regulation of somitogenesis(GO:0014807) |
| 2.1 | 6.4 | GO:0045556 | TRAIL biosynthetic process(GO:0045553) regulation of TRAIL biosynthetic process(GO:0045554) positive regulation of TRAIL biosynthetic process(GO:0045556) |
| 2.1 | 19.0 | GO:0060075 | regulation of resting membrane potential(GO:0060075) |
| 2.1 | 19.0 | GO:0098535 | de novo centriole assembly(GO:0098535) |
| 2.1 | 37.6 | GO:0014029 | neural crest formation(GO:0014029) |
| 2.1 | 37.5 | GO:0006054 | N-acetylneuraminate metabolic process(GO:0006054) |
| 2.1 | 14.5 | GO:0007161 | calcium-independent cell-matrix adhesion(GO:0007161) |
| 2.1 | 6.2 | GO:0009447 | putrescine catabolic process(GO:0009447) |
| 2.1 | 6.2 | GO:0009386 | translational attenuation(GO:0009386) |
| 2.0 | 6.1 | GO:0048633 | positive regulation of skeletal muscle tissue growth(GO:0048633) |
| 2.0 | 18.3 | GO:0070315 | G1 to G0 transition involved in cell differentiation(GO:0070315) |
| 2.0 | 48.6 | GO:0007141 | male meiosis I(GO:0007141) |
| 2.0 | 9.9 | GO:0042182 | ketone catabolic process(GO:0042182) |
| 1.9 | 5.7 | GO:1904897 | regulation of hepatic stellate cell proliferation(GO:1904897) positive regulation of hepatic stellate cell proliferation(GO:1904899) hepatic stellate cell proliferation(GO:1990922) |
| 1.9 | 15.2 | GO:0007256 | activation of JNKK activity(GO:0007256) |
| 1.9 | 3.8 | GO:0048631 | regulation of skeletal muscle tissue growth(GO:0048631) |
| 1.9 | 29.9 | GO:0002031 | G-protein coupled receptor internalization(GO:0002031) |
| 1.9 | 16.7 | GO:0015886 | heme transport(GO:0015886) |
| 1.8 | 11.1 | GO:1903748 | negative regulation of establishment of protein localization to mitochondrion(GO:1903748) |
| 1.8 | 11.1 | GO:0050893 | sensory processing(GO:0050893) |
| 1.8 | 14.7 | GO:0030322 | stabilization of membrane potential(GO:0030322) |
| 1.8 | 5.4 | GO:0016340 | calcium-dependent cell-matrix adhesion(GO:0016340) |
| 1.8 | 1.8 | GO:0099612 | protein localization to axon(GO:0099612) |
| 1.8 | 5.3 | GO:0019858 | cytosine metabolic process(GO:0019858) |
| 1.7 | 64.2 | GO:0048665 | neuron fate specification(GO:0048665) |
| 1.7 | 5.2 | GO:1904616 | regulation of actin filament binding(GO:1904529) regulation of actin binding(GO:1904616) |
| 1.7 | 17.2 | GO:0080182 | histone H3-K4 trimethylation(GO:0080182) |
| 1.7 | 13.7 | GO:0071569 | protein ufmylation(GO:0071569) |
| 1.7 | 11.9 | GO:0035879 | plasma membrane lactate transport(GO:0035879) |
| 1.7 | 5.1 | GO:1904751 | positive regulation of protein localization to nucleolus(GO:1904751) |
| 1.7 | 8.4 | GO:0060800 | regulation of cell differentiation involved in embryonic placenta development(GO:0060800) |
| 1.7 | 15.1 | GO:0031584 | activation of phospholipase D activity(GO:0031584) |
| 1.7 | 16.6 | GO:1901525 | negative regulation of macromitophagy(GO:1901525) |
| 1.7 | 5.0 | GO:0045212 | negative regulation of synaptic transmission, cholinergic(GO:0032223) neurotransmitter receptor biosynthetic process(GO:0045212) |
| 1.6 | 21.1 | GO:0047484 | regulation of response to osmotic stress(GO:0047484) |
| 1.6 | 4.8 | GO:0009720 | detection of hormone stimulus(GO:0009720) |
| 1.5 | 4.6 | GO:0090298 | negative regulation of mitochondrial DNA replication(GO:0090298) negative regulation of mitochondrial DNA metabolic process(GO:1901859) |
| 1.5 | 6.2 | GO:1990167 | protein K27-linked deubiquitination(GO:1990167) |
| 1.5 | 4.6 | GO:1905075 | occluding junction disassembly(GO:1905071) regulation of occluding junction disassembly(GO:1905073) positive regulation of occluding junction disassembly(GO:1905075) |
| 1.5 | 23.0 | GO:0021756 | striatum development(GO:0021756) |
| 1.5 | 18.4 | GO:0007130 | synaptonemal complex assembly(GO:0007130) |
| 1.5 | 6.1 | GO:0035881 | amacrine cell differentiation(GO:0035881) |
| 1.5 | 9.1 | GO:0044782 | cilium organization(GO:0044782) |
| 1.5 | 3.0 | GO:0021586 | pons maturation(GO:0021586) |
| 1.5 | 13.4 | GO:2000124 | regulation of endocannabinoid signaling pathway(GO:2000124) |
| 1.5 | 5.9 | GO:0010157 | response to chlorate(GO:0010157) |
| 1.5 | 1.5 | GO:0001923 | B-1 B cell differentiation(GO:0001923) |
| 1.5 | 10.3 | GO:0051533 | positive regulation of NFAT protein import into nucleus(GO:0051533) |
| 1.5 | 10.3 | GO:0045955 | negative regulation of calcium ion-dependent exocytosis(GO:0045955) |
| 1.5 | 11.7 | GO:0006307 | DNA dealkylation involved in DNA repair(GO:0006307) |
| 1.5 | 5.8 | GO:0035359 | negative regulation of peroxisome proliferator activated receptor signaling pathway(GO:0035359) |
| 1.5 | 11.7 | GO:0007506 | gonadal mesoderm development(GO:0007506) |
| 1.4 | 27.4 | GO:1901897 | regulation of relaxation of cardiac muscle(GO:1901897) |
| 1.4 | 4.3 | GO:0035377 | transepithelial water transport(GO:0035377) positive regulation of cyclic nucleotide-gated ion channel activity(GO:1902161) |
| 1.4 | 25.7 | GO:0071786 | endoplasmic reticulum tubular network organization(GO:0071786) |
| 1.4 | 20.0 | GO:1903358 | regulation of Golgi organization(GO:1903358) |
| 1.4 | 9.9 | GO:0099566 | regulation of postsynaptic cytosolic calcium ion concentration(GO:0099566) |
| 1.4 | 54.9 | GO:1903959 | regulation of anion transmembrane transport(GO:1903959) |
| 1.4 | 4.1 | GO:0061394 | regulation of transcription from RNA polymerase II promoter in response to arsenic-containing substance(GO:0061394) |
| 1.4 | 27.5 | GO:1904776 | regulation of protein localization to cell cortex(GO:1904776) positive regulation of protein localization to cell cortex(GO:1904778) |
| 1.4 | 4.1 | GO:0000451 | rRNA 2'-O-methylation(GO:0000451) |
| 1.4 | 2.7 | GO:0051026 | chiasma assembly(GO:0051026) |
| 1.4 | 49.2 | GO:0046676 | negative regulation of insulin secretion(GO:0046676) |
| 1.4 | 39.6 | GO:0035590 | purinergic nucleotide receptor signaling pathway(GO:0035590) |
| 1.4 | 17.7 | GO:0048312 | intracellular distribution of mitochondria(GO:0048312) |
| 1.4 | 8.1 | GO:0002865 | negative regulation of acute inflammatory response to antigenic stimulus(GO:0002865) |
| 1.3 | 8.1 | GO:0045007 | depurination(GO:0045007) |
| 1.3 | 18.7 | GO:0070050 | neuron cellular homeostasis(GO:0070050) |
| 1.3 | 40.0 | GO:1901985 | positive regulation of protein acetylation(GO:1901985) |
| 1.3 | 6.6 | GO:0006498 | N-terminal protein lipidation(GO:0006498) |
| 1.3 | 9.1 | GO:2000812 | regulation of barbed-end actin filament capping(GO:2000812) |
| 1.3 | 14.2 | GO:0070544 | histone H3-K36 demethylation(GO:0070544) |
| 1.3 | 2.6 | GO:0015808 | L-alanine transport(GO:0015808) |
| 1.2 | 7.5 | GO:1904322 | response to forskolin(GO:1904321) cellular response to forskolin(GO:1904322) |
| 1.2 | 22.3 | GO:0090073 | positive regulation of protein homodimerization activity(GO:0090073) |
| 1.2 | 11.1 | GO:0002175 | protein localization to paranode region of axon(GO:0002175) |
| 1.2 | 22.2 | GO:0036148 | phosphatidylglycerol acyl-chain remodeling(GO:0036148) |
| 1.2 | 6.1 | GO:0015959 | diadenosine polyphosphate metabolic process(GO:0015959) |
| 1.2 | 6.1 | GO:0030311 | poly-N-acetyllactosamine metabolic process(GO:0030309) poly-N-acetyllactosamine biosynthetic process(GO:0030311) |
| 1.2 | 26.3 | GO:2000001 | regulation of DNA damage checkpoint(GO:2000001) |
| 1.2 | 13.1 | GO:0006450 | regulation of translational fidelity(GO:0006450) |
| 1.2 | 28.0 | GO:0030488 | tRNA methylation(GO:0030488) |
| 1.1 | 6.8 | GO:0002318 | myeloid progenitor cell differentiation(GO:0002318) |
| 1.1 | 18.0 | GO:0044030 | regulation of DNA methylation(GO:0044030) |
| 1.1 | 4.5 | GO:1901299 | negative regulation of hydrogen peroxide-mediated programmed cell death(GO:1901299) |
| 1.1 | 3.4 | GO:0021658 | rhombomere morphogenesis(GO:0021593) rhombomere 3 morphogenesis(GO:0021658) |
| 1.1 | 12.3 | GO:0008612 | peptidyl-lysine modification to peptidyl-hypusine(GO:0008612) |
| 1.1 | 3.3 | GO:1902630 | regulation of membrane hyperpolarization(GO:1902630) |
| 1.1 | 16.4 | GO:0021702 | cerebellar Purkinje cell layer formation(GO:0021694) cerebellar Purkinje cell differentiation(GO:0021702) |
| 1.1 | 6.6 | GO:0070842 | aggresome assembly(GO:0070842) |
| 1.1 | 5.5 | GO:0051725 | protein de-ADP-ribosylation(GO:0051725) |
| 1.1 | 17.4 | GO:0002726 | positive regulation of T cell cytokine production(GO:0002726) |
| 1.1 | 14.0 | GO:0006975 | DNA damage induced protein phosphorylation(GO:0006975) |
| 1.1 | 6.4 | GO:0051388 | positive regulation of neurotrophin TRK receptor signaling pathway(GO:0051388) |
| 1.0 | 24.1 | GO:0097503 | sialylation(GO:0097503) |
| 1.0 | 3.1 | GO:0070317 | negative regulation of G0 to G1 transition(GO:0070317) |
| 1.0 | 3.1 | GO:0045915 | positive regulation of catecholamine metabolic process(GO:0045915) positive regulation of dopamine metabolic process(GO:0045964) |
| 1.0 | 1.0 | GO:0006543 | glutamine catabolic process(GO:0006543) |
| 1.0 | 17.2 | GO:0010457 | centriole-centriole cohesion(GO:0010457) |
| 1.0 | 5.1 | GO:0006041 | glucosamine metabolic process(GO:0006041) |
| 1.0 | 12.9 | GO:0032927 | positive regulation of activin receptor signaling pathway(GO:0032927) |
| 1.0 | 3.0 | GO:0072092 | ureteric bud invasion(GO:0072092) |
| 1.0 | 3.0 | GO:0002415 | immunoglobulin transcytosis in epithelial cells mediated by polymeric immunoglobulin receptor(GO:0002415) |
| 1.0 | 4.9 | GO:0030242 | pexophagy(GO:0030242) aggrephagy(GO:0035973) |
| 1.0 | 2.9 | GO:0000101 | sulfur amino acid transport(GO:0000101) |
| 1.0 | 10.6 | GO:0007196 | adenylate cyclase-inhibiting G-protein coupled glutamate receptor signaling pathway(GO:0007196) |
| 1.0 | 27.0 | GO:0043011 | myeloid dendritic cell differentiation(GO:0043011) |
| 1.0 | 8.6 | GO:0032264 | IMP salvage(GO:0032264) |
| 1.0 | 7.6 | GO:1902902 | negative regulation of autophagosome assembly(GO:1902902) |
| 0.9 | 5.7 | GO:0097029 | mature conventional dendritic cell differentiation(GO:0097029) |
| 0.9 | 18.0 | GO:0006488 | dolichol-linked oligosaccharide biosynthetic process(GO:0006488) |
| 0.9 | 29.1 | GO:0030517 | negative regulation of axon extension(GO:0030517) |
| 0.9 | 13.1 | GO:0036158 | outer dynein arm assembly(GO:0036158) |
| 0.9 | 4.6 | GO:1903301 | positive regulation of glucokinase activity(GO:0033133) positive regulation of hexokinase activity(GO:1903301) |
| 0.9 | 11.0 | GO:0030388 | fructose 1,6-bisphosphate metabolic process(GO:0030388) |
| 0.9 | 17.2 | GO:0006646 | phosphatidylethanolamine biosynthetic process(GO:0006646) |
| 0.9 | 8.1 | GO:0000395 | mRNA 5'-splice site recognition(GO:0000395) |
| 0.9 | 2.7 | GO:0043323 | regulation of natural killer cell degranulation(GO:0043321) positive regulation of natural killer cell degranulation(GO:0043323) |
| 0.9 | 1.8 | GO:1903464 | negative regulation of mitotic cell cycle DNA replication(GO:1903464) |
| 0.9 | 18.8 | GO:0007628 | adult walking behavior(GO:0007628) |
| 0.9 | 6.3 | GO:0018095 | protein polyglutamylation(GO:0018095) |
| 0.9 | 4.5 | GO:0005985 | sucrose metabolic process(GO:0005985) |
| 0.9 | 25.8 | GO:0060384 | innervation(GO:0060384) |
| 0.9 | 2.6 | GO:0042412 | taurine biosynthetic process(GO:0042412) |
| 0.9 | 8.7 | GO:0046185 | aldehyde catabolic process(GO:0046185) |
| 0.9 | 4.4 | GO:0033058 | directional locomotion(GO:0033058) |
| 0.9 | 4.3 | GO:0051771 | negative regulation of nitric-oxide synthase biosynthetic process(GO:0051771) |
| 0.9 | 5.1 | GO:0038092 | nodal signaling pathway(GO:0038092) |
| 0.8 | 3.4 | GO:0071557 | histone H3-K27 demethylation(GO:0071557) |
| 0.8 | 1.7 | GO:1901895 | negative regulation of calcium-transporting ATPase activity(GO:1901895) |
| 0.8 | 3.4 | GO:2000342 | negative regulation of chemokine (C-X-C motif) ligand 2 production(GO:2000342) |
| 0.8 | 17.5 | GO:2000785 | regulation of autophagosome assembly(GO:2000785) |
| 0.8 | 10.8 | GO:0035970 | peptidyl-threonine dephosphorylation(GO:0035970) |
| 0.8 | 2.5 | GO:0060474 | positive regulation of sperm motility involved in capacitation(GO:0060474) |
| 0.8 | 6.6 | GO:0042426 | choline catabolic process(GO:0042426) |
| 0.8 | 7.3 | GO:0070459 | prolactin secretion(GO:0070459) |
| 0.8 | 4.0 | GO:0034721 | histone H3-K4 demethylation, trimethyl-H3-K4-specific(GO:0034721) |
| 0.8 | 4.8 | GO:0090116 | DNA methylation on cytosine(GO:0032776) C-5 methylation of cytosine(GO:0090116) |
| 0.8 | 11.9 | GO:0050884 | neuromuscular process controlling posture(GO:0050884) |
| 0.8 | 5.5 | GO:0090666 | scaRNA localization to Cajal body(GO:0090666) |
| 0.8 | 1.6 | GO:0070827 | chromatin maintenance(GO:0070827) |
| 0.8 | 19.4 | GO:0032007 | negative regulation of TOR signaling(GO:0032007) |
| 0.8 | 3.0 | GO:0014827 | intestine smooth muscle contraction(GO:0014827) |
| 0.8 | 4.5 | GO:0001661 | conditioned taste aversion(GO:0001661) |
| 0.8 | 3.8 | GO:0051344 | regulation of cyclic-nucleotide phosphodiesterase activity(GO:0051342) negative regulation of cyclic-nucleotide phosphodiesterase activity(GO:0051344) |
| 0.8 | 1.5 | GO:0038178 | complement component C5a signaling pathway(GO:0038178) |
| 0.7 | 4.5 | GO:0051958 | methotrexate transport(GO:0051958) reduced folate transmembrane transport(GO:0098838) |
| 0.7 | 3.7 | GO:0035799 | ureter maturation(GO:0035799) |
| 0.7 | 22.2 | GO:0030207 | chondroitin sulfate catabolic process(GO:0030207) |
| 0.7 | 1.5 | GO:0090160 | Golgi to lysosome transport(GO:0090160) |
| 0.7 | 6.6 | GO:0036066 | protein O-linked fucosylation(GO:0036066) |
| 0.7 | 5.1 | GO:0034770 | histone H4-K20 methylation(GO:0034770) |
| 0.7 | 1.4 | GO:0003275 | apoptotic process involved in outflow tract morphogenesis(GO:0003275) regulation of apoptotic process involved in outflow tract morphogenesis(GO:1902256) |
| 0.7 | 7.6 | GO:0006685 | sphingomyelin catabolic process(GO:0006685) |
| 0.7 | 2.1 | GO:0071502 | cellular response to temperature stimulus(GO:0071502) |
| 0.7 | 6.9 | GO:0006621 | protein retention in ER lumen(GO:0006621) |
| 0.7 | 2.1 | GO:0002414 | immunoglobulin transcytosis in epithelial cells(GO:0002414) IgG immunoglobulin transcytosis in epithelial cells mediated by FcRn immunoglobulin receptor(GO:0002416) |
| 0.7 | 8.1 | GO:0016191 | synaptic vesicle uncoating(GO:0016191) |
| 0.7 | 3.4 | GO:0060830 | ciliary receptor clustering involved in smoothened signaling pathway(GO:0060830) |
| 0.7 | 1.4 | GO:0000430 | regulation of transcription from RNA polymerase II promoter by glucose(GO:0000430) positive regulation of transcription from RNA polymerase II promoter by glucose(GO:0000432) |
| 0.7 | 3.4 | GO:1903588 | negative regulation of blood vessel endothelial cell proliferation involved in sprouting angiogenesis(GO:1903588) |
| 0.7 | 2.7 | GO:0035356 | cellular triglyceride homeostasis(GO:0035356) |
| 0.6 | 2.6 | GO:0050902 | leukocyte adhesive activation(GO:0050902) |
| 0.6 | 3.8 | GO:0043366 | beta selection(GO:0043366) |
| 0.6 | 3.2 | GO:0048280 | vesicle fusion with Golgi apparatus(GO:0048280) |
| 0.6 | 8.3 | GO:0043984 | histone H4-K16 acetylation(GO:0043984) |
| 0.6 | 5.1 | GO:1904885 | beta-catenin destruction complex assembly(GO:1904885) |
| 0.6 | 1.2 | GO:0071321 | cellular response to cGMP(GO:0071321) |
| 0.6 | 11.2 | GO:0071526 | semaphorin-plexin signaling pathway(GO:0071526) |
| 0.6 | 19.8 | GO:0006706 | steroid catabolic process(GO:0006706) |
| 0.6 | 3.1 | GO:0045872 | positive regulation of rhodopsin gene expression(GO:0045872) |
| 0.6 | 1.8 | GO:1903826 | arginine transmembrane transport(GO:1903826) |
| 0.6 | 4.9 | GO:0036376 | sodium ion export from cell(GO:0036376) |
| 0.6 | 21.4 | GO:0006699 | bile acid biosynthetic process(GO:0006699) |
| 0.6 | 1.8 | GO:1904640 | response to methionine(GO:1904640) |
| 0.6 | 1.8 | GO:0086048 | membrane depolarization during bundle of His cell action potential(GO:0086048) |
| 0.6 | 7.8 | GO:0031573 | intra-S DNA damage checkpoint(GO:0031573) |
| 0.6 | 1.2 | GO:0052510 | induction by symbiont of host defense response(GO:0044416) induction of host immune response by virus(GO:0046730) active induction of host immune response by virus(GO:0046732) modulation by symbiont of host defense response(GO:0052031) induction by organism of defense response of other organism involved in symbiotic interaction(GO:0052251) modulation by organism of defense response of other organism involved in symbiotic interaction(GO:0052255) positive regulation by symbiont of host defense response(GO:0052509) positive regulation by organism of defense response of other organism involved in symbiotic interaction(GO:0052510) modulation by organism of immune response of other organism involved in symbiotic interaction(GO:0052552) modulation by symbiont of host immune response(GO:0052553) modulation by virus of host immune response(GO:0075528) |
| 0.6 | 16.7 | GO:0010719 | negative regulation of epithelial to mesenchymal transition(GO:0010719) |
| 0.6 | 1.8 | GO:0006001 | fructose catabolic process(GO:0006001) fructose catabolic process to hydroxyacetone phosphate and glyceraldehyde-3-phosphate(GO:0061624) |
| 0.6 | 1.2 | GO:0046015 | regulation of transcription by glucose(GO:0046015) |
| 0.6 | 0.6 | GO:0071288 | cellular response to mercury ion(GO:0071288) |
| 0.6 | 22.8 | GO:0007274 | neuromuscular synaptic transmission(GO:0007274) |
| 0.6 | 3.5 | GO:0048265 | response to pain(GO:0048265) |
| 0.6 | 1.7 | GO:1901993 | meiotic cell cycle phase transition(GO:0044771) regulation of meiotic cell cycle phase transition(GO:1901993) negative regulation of meiotic cell cycle phase transition(GO:1901994) |
| 0.6 | 3.5 | GO:0048619 | embryonic hindgut morphogenesis(GO:0048619) |
| 0.6 | 19.0 | GO:0071305 | cellular response to vitamin D(GO:0071305) |
| 0.6 | 0.6 | GO:0010587 | miRNA catabolic process(GO:0010587) |
| 0.6 | 2.8 | GO:1900245 | positive regulation of MDA-5 signaling pathway(GO:1900245) |
| 0.6 | 3.9 | GO:0051531 | NFAT protein import into nucleus(GO:0051531) |
| 0.6 | 2.2 | GO:0021615 | glossopharyngeal nerve morphogenesis(GO:0021615) |
| 0.5 | 2.7 | GO:0032815 | negative regulation of natural killer cell activation(GO:0032815) |
| 0.5 | 2.7 | GO:2001013 | epithelial cell proliferation involved in renal tubule morphogenesis(GO:2001013) |
| 0.5 | 2.7 | GO:0035617 | stress granule disassembly(GO:0035617) |
| 0.5 | 13.0 | GO:0051567 | histone H3-K9 methylation(GO:0051567) |
| 0.5 | 28.1 | GO:0061178 | regulation of insulin secretion involved in cellular response to glucose stimulus(GO:0061178) |
| 0.5 | 1.1 | GO:0006258 | UDP-glucose catabolic process(GO:0006258) |
| 0.5 | 8.5 | GO:0090360 | platelet-derived growth factor production(GO:0090360) regulation of platelet-derived growth factor production(GO:0090361) |
| 0.5 | 4.8 | GO:0042908 | xenobiotic transport(GO:0042908) |
| 0.5 | 4.2 | GO:0046959 | habituation(GO:0046959) |
| 0.5 | 3.7 | GO:0070560 | protein secretion by platelet(GO:0070560) |
| 0.5 | 2.6 | GO:0006535 | cysteine biosynthetic process from serine(GO:0006535) |
| 0.5 | 16.2 | GO:0007202 | activation of phospholipase C activity(GO:0007202) |
| 0.5 | 33.9 | GO:0042771 | intrinsic apoptotic signaling pathway in response to DNA damage by p53 class mediator(GO:0042771) |
| 0.5 | 9.9 | GO:0015671 | oxygen transport(GO:0015671) |
| 0.5 | 1.0 | GO:0032661 | interleukin-18 production(GO:0032621) regulation of interleukin-18 production(GO:0032661) |
| 0.5 | 6.2 | GO:0048642 | negative regulation of skeletal muscle tissue development(GO:0048642) |
| 0.5 | 3.6 | GO:0099639 | neurotransmitter receptor transport, endosome to postsynaptic membrane(GO:0098887) endosome to plasma membrane protein transport(GO:0099638) neurotransmitter receptor transport, endosome to plasma membrane(GO:0099639) |
| 0.5 | 2.0 | GO:0045079 | negative regulation of chemokine biosynthetic process(GO:0045079) |
| 0.5 | 4.1 | GO:0048266 | behavioral response to pain(GO:0048266) |
| 0.5 | 4.6 | GO:0002115 | store-operated calcium entry(GO:0002115) |
| 0.5 | 2.0 | GO:0006741 | NADP biosynthetic process(GO:0006741) |
| 0.5 | 2.5 | GO:2000676 | positive regulation of type B pancreatic cell apoptotic process(GO:2000676) |
| 0.5 | 5.0 | GO:1901409 | positive regulation of phosphorylation of RNA polymerase II C-terminal domain(GO:1901409) |
| 0.5 | 5.9 | GO:0035773 | insulin secretion involved in cellular response to glucose stimulus(GO:0035773) |
| 0.5 | 5.0 | GO:0048172 | regulation of short-term neuronal synaptic plasticity(GO:0048172) |
| 0.5 | 3.9 | GO:0060081 | membrane hyperpolarization(GO:0060081) |
| 0.5 | 0.5 | GO:0061146 | Peyer's patch morphogenesis(GO:0061146) |
| 0.5 | 2.9 | GO:2000773 | negative regulation of cellular senescence(GO:2000773) |
| 0.5 | 7.3 | GO:0090129 | positive regulation of synapse maturation(GO:0090129) |
| 0.5 | 4.4 | GO:0097646 | dimeric G-protein coupled receptor signaling pathway(GO:0038042) calcitonin family receptor signaling pathway(GO:0097646) amylin receptor signaling pathway(GO:0097647) |
| 0.5 | 12.1 | GO:0046928 | regulation of neurotransmitter secretion(GO:0046928) |
| 0.5 | 7.7 | GO:0042423 | catechol-containing compound biosynthetic process(GO:0009713) catecholamine biosynthetic process(GO:0042423) |
| 0.5 | 14.8 | GO:0048791 | calcium ion-regulated exocytosis of neurotransmitter(GO:0048791) |
| 0.5 | 7.6 | GO:1902260 | negative regulation of delayed rectifier potassium channel activity(GO:1902260) |
| 0.5 | 3.8 | GO:0051601 | exocyst localization(GO:0051601) |
| 0.5 | 1.4 | GO:0045345 | positive regulation of MHC class I biosynthetic process(GO:0045345) |
| 0.5 | 5.2 | GO:0033299 | secretion of lysosomal enzymes(GO:0033299) |
| 0.5 | 2.8 | GO:0051121 | hepoxilin metabolic process(GO:0051121) hepoxilin biosynthetic process(GO:0051122) |
| 0.5 | 1.9 | GO:2000671 | regulation of motor neuron apoptotic process(GO:2000671) negative regulation of motor neuron apoptotic process(GO:2000672) |
| 0.5 | 17.3 | GO:0040019 | positive regulation of embryonic development(GO:0040019) |
| 0.5 | 5.1 | GO:0033169 | histone H3-K9 demethylation(GO:0033169) |
| 0.5 | 2.3 | GO:2001245 | regulation of phosphatidylcholine biosynthetic process(GO:2001245) |
| 0.5 | 10.6 | GO:0055003 | cardiac myofibril assembly(GO:0055003) |
| 0.5 | 4.1 | GO:0001833 | inner cell mass cell proliferation(GO:0001833) |
| 0.5 | 26.2 | GO:0014047 | glutamate secretion(GO:0014047) |
| 0.4 | 35.1 | GO:0010923 | negative regulation of phosphatase activity(GO:0010923) |
| 0.4 | 2.2 | GO:2000304 | positive regulation of sphingolipid biosynthetic process(GO:0090154) positive regulation of ceramide biosynthetic process(GO:2000304) |
| 0.4 | 2.7 | GO:1903232 | melanosome assembly(GO:1903232) |
| 0.4 | 10.7 | GO:0005979 | regulation of glycogen biosynthetic process(GO:0005979) regulation of glucan biosynthetic process(GO:0010962) |
| 0.4 | 1.3 | GO:0097350 | neutrophil clearance(GO:0097350) |
| 0.4 | 12.8 | GO:0003299 | muscle hypertrophy in response to stress(GO:0003299) cardiac muscle adaptation(GO:0014887) cardiac muscle hypertrophy in response to stress(GO:0014898) |
| 0.4 | 1.3 | GO:0035811 | negative regulation of urine volume(GO:0035811) |
| 0.4 | 12.2 | GO:0006198 | cAMP catabolic process(GO:0006198) |
| 0.4 | 3.0 | GO:0043153 | entrainment of circadian clock by photoperiod(GO:0043153) |
| 0.4 | 4.8 | GO:0032740 | positive regulation of interleukin-17 production(GO:0032740) |
| 0.4 | 20.2 | GO:0051496 | positive regulation of stress fiber assembly(GO:0051496) |
| 0.4 | 4.3 | GO:0061154 | endothelial tube morphogenesis(GO:0061154) |
| 0.4 | 0.9 | GO:1903413 | response to bile acid(GO:1903412) cellular response to bile acid(GO:1903413) |
| 0.4 | 1.7 | GO:0001759 | organ induction(GO:0001759) |
| 0.4 | 7.2 | GO:0070389 | chaperone cofactor-dependent protein refolding(GO:0070389) |
| 0.4 | 17.8 | GO:0048854 | brain morphogenesis(GO:0048854) |
| 0.4 | 4.2 | GO:1990440 | positive regulation of transcription from RNA polymerase II promoter in response to endoplasmic reticulum stress(GO:1990440) |
| 0.4 | 1.7 | GO:0002024 | diet induced thermogenesis(GO:0002024) |
| 0.4 | 3.3 | GO:0034088 | maintenance of sister chromatid cohesion(GO:0034086) maintenance of mitotic sister chromatid cohesion(GO:0034088) |
| 0.4 | 1.7 | GO:0051182 | coenzyme transport(GO:0051182) |
| 0.4 | 2.9 | GO:0010641 | positive regulation of platelet-derived growth factor receptor signaling pathway(GO:0010641) |
| 0.4 | 1.2 | GO:0002277 | myeloid dendritic cell activation involved in immune response(GO:0002277) |
| 0.4 | 4.9 | GO:2000574 | regulation of microtubule motor activity(GO:2000574) |
| 0.4 | 1.2 | GO:0006627 | protein processing involved in protein targeting to mitochondrion(GO:0006627) |
| 0.4 | 11.0 | GO:0033962 | cytoplasmic mRNA processing body assembly(GO:0033962) |
| 0.4 | 3.2 | GO:0033327 | Leydig cell differentiation(GO:0033327) |
| 0.4 | 1.6 | GO:0060010 | Sertoli cell fate commitment(GO:0060010) |
| 0.4 | 5.2 | GO:0070070 | energy coupled proton transport, down electrochemical gradient(GO:0015985) ATP synthesis coupled proton transport(GO:0015986) proton-transporting V-type ATPase complex assembly(GO:0070070) vacuolar proton-transporting V-type ATPase complex assembly(GO:0070072) |
| 0.4 | 1.2 | GO:0008065 | establishment of blood-nerve barrier(GO:0008065) |
| 0.4 | 3.5 | GO:0007097 | nuclear migration(GO:0007097) |
| 0.4 | 43.2 | GO:0007286 | spermatid development(GO:0007286) |
| 0.4 | 3.1 | GO:2000318 | positive regulation of T-helper 17 type immune response(GO:2000318) |
| 0.4 | 3.9 | GO:0045945 | positive regulation of transcription from RNA polymerase III promoter(GO:0045945) |
| 0.4 | 25.4 | GO:0031338 | regulation of vesicle fusion(GO:0031338) |
| 0.4 | 3.1 | GO:0045943 | positive regulation of transcription from RNA polymerase I promoter(GO:0045943) |
| 0.4 | 4.2 | GO:0035330 | regulation of hippo signaling(GO:0035330) |
| 0.4 | 11.1 | GO:0007099 | centriole replication(GO:0007099) centriole assembly(GO:0098534) |
| 0.4 | 3.1 | GO:0070734 | histone H3-K27 methylation(GO:0070734) |
| 0.4 | 271.3 | GO:0043547 | positive regulation of GTPase activity(GO:0043547) |
| 0.4 | 10.3 | GO:0071108 | protein K48-linked deubiquitination(GO:0071108) |
| 0.4 | 4.0 | GO:2000288 | positive regulation of myoblast proliferation(GO:2000288) |
| 0.4 | 6.9 | GO:0006895 | Golgi to endosome transport(GO:0006895) |
| 0.4 | 1.1 | GO:0060290 | transdifferentiation(GO:0060290) |
| 0.4 | 1.8 | GO:0002089 | lens morphogenesis in camera-type eye(GO:0002089) |
| 0.4 | 3.6 | GO:0061158 | 3'-UTR-mediated mRNA destabilization(GO:0061158) |
| 0.4 | 7.1 | GO:0042749 | regulation of circadian sleep/wake cycle(GO:0042749) regulation of circadian sleep/wake cycle, sleep(GO:0045187) |
| 0.4 | 5.3 | GO:0045475 | locomotor rhythm(GO:0045475) |
| 0.4 | 1.4 | GO:0043116 | negative regulation of vascular permeability(GO:0043116) |
| 0.4 | 9.2 | GO:0035196 | production of miRNAs involved in gene silencing by miRNA(GO:0035196) |
| 0.4 | 7.0 | GO:0007212 | dopamine receptor signaling pathway(GO:0007212) |
| 0.4 | 2.1 | GO:0002005 | angiotensin catabolic process in blood(GO:0002005) multicellular organismal protein catabolic process(GO:0044254) protein digestion(GO:0044256) multicellular organismal macromolecule catabolic process(GO:0044266) |
| 0.4 | 18.9 | GO:0048477 | oogenesis(GO:0048477) |
| 0.3 | 4.5 | GO:0002523 | leukocyte migration involved in inflammatory response(GO:0002523) |
| 0.3 | 16.3 | GO:0032728 | positive regulation of interferon-beta production(GO:0032728) |
| 0.3 | 6.6 | GO:0042417 | dopamine metabolic process(GO:0042417) |
| 0.3 | 0.3 | GO:1990086 | lens fiber cell apoptotic process(GO:1990086) |
| 0.3 | 1.7 | GO:0038170 | somatostatin receptor signaling pathway(GO:0038169) somatostatin signaling pathway(GO:0038170) |
| 0.3 | 17.8 | GO:0030901 | midbrain development(GO:0030901) |
| 0.3 | 1.0 | GO:0006655 | phosphatidylglycerol biosynthetic process(GO:0006655) |
| 0.3 | 4.1 | GO:0070816 | phosphorylation of RNA polymerase II C-terminal domain(GO:0070816) |
| 0.3 | 2.7 | GO:0032713 | negative regulation of interleukin-4 production(GO:0032713) |
| 0.3 | 2.3 | GO:2000271 | positive regulation of fibroblast apoptotic process(GO:2000271) |
| 0.3 | 10.1 | GO:0000083 | regulation of transcription involved in G1/S transition of mitotic cell cycle(GO:0000083) |
| 0.3 | 7.1 | GO:1904031 | positive regulation of cyclin-dependent protein kinase activity(GO:1904031) |
| 0.3 | 5.8 | GO:0000028 | ribosomal small subunit assembly(GO:0000028) |
| 0.3 | 1.9 | GO:0032510 | endosome to lysosome transport via multivesicular body sorting pathway(GO:0032510) |
| 0.3 | 8.0 | GO:0034260 | negative regulation of GTPase activity(GO:0034260) |
| 0.3 | 5.4 | GO:0008340 | determination of adult lifespan(GO:0008340) |
| 0.3 | 1.0 | GO:0060748 | tertiary branching involved in mammary gland duct morphogenesis(GO:0060748) |
| 0.3 | 1.6 | GO:0003222 | ventricular trabecula myocardium morphogenesis(GO:0003222) |
| 0.3 | 5.6 | GO:0071420 | response to histamine(GO:0034776) cellular response to histamine(GO:0071420) |
| 0.3 | 1.5 | GO:2001270 | regulation of cysteine-type endopeptidase activity involved in execution phase of apoptosis(GO:2001270) negative regulation of cysteine-type endopeptidase activity involved in execution phase of apoptosis(GO:2001271) |
| 0.3 | 3.0 | GO:0006069 | ethanol oxidation(GO:0006069) |
| 0.3 | 20.8 | GO:0000381 | regulation of alternative mRNA splicing, via spliceosome(GO:0000381) |
| 0.3 | 0.6 | GO:0002326 | B cell lineage commitment(GO:0002326) |
| 0.3 | 1.5 | GO:0008343 | adult feeding behavior(GO:0008343) |
| 0.3 | 3.8 | GO:0033540 | fatty acid beta-oxidation using acyl-CoA oxidase(GO:0033540) |
| 0.3 | 2.1 | GO:0018401 | peptidyl-proline hydroxylation to 4-hydroxy-L-proline(GO:0018401) |
| 0.3 | 2.9 | GO:0015812 | gamma-aminobutyric acid transport(GO:0015812) |
| 0.3 | 4.1 | GO:0060736 | prostate gland growth(GO:0060736) |
| 0.3 | 2.9 | GO:1990118 | sodium ion import across plasma membrane(GO:0098719) sodium ion import into cell(GO:1990118) |
| 0.3 | 6.2 | GO:0048147 | negative regulation of fibroblast proliferation(GO:0048147) |
| 0.3 | 5.9 | GO:0031076 | embryonic camera-type eye development(GO:0031076) |
| 0.3 | 3.0 | GO:0048483 | autonomic nervous system development(GO:0048483) |
| 0.3 | 1.4 | GO:2000346 | negative regulation of hepatocyte proliferation(GO:2000346) |
| 0.3 | 7.5 | GO:0010107 | potassium ion import(GO:0010107) |
| 0.3 | 3.4 | GO:0071380 | cellular response to prostaglandin E stimulus(GO:0071380) |
| 0.3 | 4.2 | GO:1900115 | extracellular regulation of signal transduction(GO:1900115) extracellular negative regulation of signal transduction(GO:1900116) |
| 0.3 | 3.4 | GO:0045046 | peroxisomal membrane transport(GO:0015919) protein import into peroxisome membrane(GO:0045046) |
| 0.3 | 16.0 | GO:0019233 | sensory perception of pain(GO:0019233) |
| 0.3 | 17.1 | GO:0032981 | NADH dehydrogenase complex assembly(GO:0010257) mitochondrial respiratory chain complex I assembly(GO:0032981) mitochondrial respiratory chain complex I biogenesis(GO:0097031) |
| 0.2 | 9.9 | GO:0042073 | intraciliary transport(GO:0042073) |
| 0.2 | 10.8 | GO:0045839 | negative regulation of mitotic nuclear division(GO:0045839) |
| 0.2 | 36.4 | GO:0060348 | bone development(GO:0060348) |
| 0.2 | 1.0 | GO:0051974 | negative regulation of telomerase activity(GO:0051974) |
| 0.2 | 5.3 | GO:0001580 | detection of chemical stimulus involved in sensory perception of bitter taste(GO:0001580) |
| 0.2 | 0.2 | GO:0060574 | columnar/cuboidal epithelial cell maturation(GO:0002069) intestinal epithelial cell maturation(GO:0060574) mesenchymal-epithelial cell signaling(GO:0060638) |
| 0.2 | 14.6 | GO:0030282 | bone mineralization(GO:0030282) |
| 0.2 | 1.9 | GO:1902913 | positive regulation of neuroepithelial cell differentiation(GO:1902913) |
| 0.2 | 3.0 | GO:0034497 | protein localization to pre-autophagosomal structure(GO:0034497) |
| 0.2 | 12.0 | GO:0046854 | phosphatidylinositol phosphorylation(GO:0046854) |
| 0.2 | 0.9 | GO:0006740 | NADPH regeneration(GO:0006740) |
| 0.2 | 1.3 | GO:0097428 | protein maturation by iron-sulfur cluster transfer(GO:0097428) |
| 0.2 | 7.1 | GO:0001706 | endoderm formation(GO:0001706) |
| 0.2 | 0.2 | GO:2000777 | positive regulation of proteasomal ubiquitin-dependent protein catabolic process involved in cellular response to hypoxia(GO:2000777) |
| 0.2 | 0.8 | GO:0001826 | inner cell mass cell differentiation(GO:0001826) negative regulation of cysteine-type endopeptidase activity involved in apoptotic signaling pathway(GO:2001268) |
| 0.2 | 6.7 | GO:0016233 | telomere capping(GO:0016233) |
| 0.2 | 5.1 | GO:0045746 | negative regulation of Notch signaling pathway(GO:0045746) |
| 0.2 | 1.0 | GO:0006449 | regulation of translational termination(GO:0006449) |
| 0.2 | 1.8 | GO:2000311 | regulation of alpha-amino-3-hydroxy-5-methyl-4-isoxazole propionate selective glutamate receptor activity(GO:2000311) |
| 0.2 | 6.2 | GO:0050690 | regulation of defense response to virus by virus(GO:0050690) |
| 0.2 | 1.2 | GO:0050774 | negative regulation of dendrite morphogenesis(GO:0050774) |
| 0.2 | 0.6 | GO:1901160 | primary amino compound metabolic process(GO:1901160) primary amino compound biosynthetic process(GO:1901162) |
| 0.2 | 3.6 | GO:0007398 | ectoderm development(GO:0007398) |
| 0.2 | 2.1 | GO:0035116 | embryonic hindlimb morphogenesis(GO:0035116) |
| 0.2 | 0.6 | GO:0032930 | positive regulation of superoxide anion generation(GO:0032930) |
| 0.2 | 2.4 | GO:0050901 | leukocyte tethering or rolling(GO:0050901) |
| 0.2 | 1.3 | GO:0021522 | spinal cord motor neuron differentiation(GO:0021522) |
| 0.2 | 0.9 | GO:0031119 | tRNA pseudouridine synthesis(GO:0031119) |
| 0.2 | 2.4 | GO:0006751 | glutathione catabolic process(GO:0006751) leukotriene D4 metabolic process(GO:1901748) leukotriene D4 biosynthetic process(GO:1901750) |
| 0.2 | 0.2 | GO:0060439 | trachea morphogenesis(GO:0060439) |
| 0.2 | 0.4 | GO:2000182 | regulation of progesterone biosynthetic process(GO:2000182) |
| 0.2 | 1.4 | GO:0001976 | neurological system process involved in regulation of systemic arterial blood pressure(GO:0001976) |
| 0.2 | 1.8 | GO:0019885 | antigen processing and presentation of endogenous peptide antigen via MHC class I(GO:0019885) |
| 0.2 | 1.0 | GO:0044211 | CTP salvage(GO:0044211) |
| 0.2 | 4.5 | GO:0097576 | vacuole fusion(GO:0097576) |
| 0.2 | 3.9 | GO:0072337 | modified amino acid transport(GO:0072337) |
| 0.2 | 10.5 | GO:0006501 | C-terminal protein lipidation(GO:0006501) |
| 0.2 | 1.4 | GO:0021591 | ventricular system development(GO:0021591) |
| 0.2 | 0.3 | GO:0045656 | negative regulation of monocyte differentiation(GO:0045656) |
| 0.2 | 1.5 | GO:0099515 | vesicle transport along actin filament(GO:0030050) actin filament-based transport(GO:0099515) |
| 0.2 | 1.5 | GO:0006067 | ethanol metabolic process(GO:0006067) |
| 0.2 | 1.3 | GO:0008535 | respiratory chain complex IV assembly(GO:0008535) |
| 0.2 | 24.2 | GO:0060271 | cilium morphogenesis(GO:0060271) |
| 0.2 | 5.5 | GO:0007520 | myoblast fusion(GO:0007520) |
| 0.2 | 1.0 | GO:0008090 | retrograde axonal transport(GO:0008090) |
| 0.2 | 0.5 | GO:0072386 | plus-end-directed vesicle transport along microtubule(GO:0072383) plus-end-directed organelle transport along microtubule(GO:0072386) |
| 0.2 | 1.3 | GO:0048635 | negative regulation of muscle organ development(GO:0048635) |
| 0.2 | 3.0 | GO:0010830 | regulation of myotube differentiation(GO:0010830) |
| 0.2 | 1.1 | GO:0001502 | cartilage condensation(GO:0001502) |
| 0.2 | 4.5 | GO:0043252 | sodium-independent organic anion transport(GO:0043252) |
| 0.2 | 0.8 | GO:0051418 | interphase microtubule nucleation by interphase microtubule organizing center(GO:0051415) microtubule nucleation by microtubule organizing center(GO:0051418) |
| 0.1 | 4.0 | GO:0071391 | cellular response to estrogen stimulus(GO:0071391) |
| 0.1 | 2.6 | GO:0018345 | protein palmitoylation(GO:0018345) |
| 0.1 | 6.2 | GO:0009584 | detection of visible light(GO:0009584) |
| 0.1 | 3.9 | GO:0016339 | calcium-dependent cell-cell adhesion via plasma membrane cell adhesion molecules(GO:0016339) |
| 0.1 | 5.4 | GO:0019731 | antibacterial humoral response(GO:0019731) |
| 0.1 | 2.8 | GO:0008333 | endosome to lysosome transport(GO:0008333) |
| 0.1 | 2.0 | GO:0030150 | protein import into mitochondrial matrix(GO:0030150) |
| 0.1 | 0.9 | GO:0060219 | camera-type eye photoreceptor cell differentiation(GO:0060219) |
| 0.1 | 1.5 | GO:0042737 | drug catabolic process(GO:0042737) |
| 0.1 | 0.6 | GO:2000189 | positive regulation of cholesterol homeostasis(GO:2000189) |
| 0.1 | 0.5 | GO:0033314 | mitotic DNA replication checkpoint(GO:0033314) |
| 0.1 | 0.4 | GO:0060708 | spongiotrophoblast differentiation(GO:0060708) |
| 0.1 | 4.3 | GO:0045600 | positive regulation of fat cell differentiation(GO:0045600) |
| 0.1 | 2.5 | GO:0033173 | calcineurin-NFAT signaling cascade(GO:0033173) |
| 0.1 | 1.2 | GO:0019184 | glutathione biosynthetic process(GO:0006750) nonribosomal peptide biosynthetic process(GO:0019184) |
| 0.1 | 2.8 | GO:0090280 | positive regulation of calcium ion import(GO:0090280) |
| 0.1 | 1.5 | GO:0032196 | transposition(GO:0032196) |
| 0.1 | 0.3 | GO:0001831 | trophectodermal cellular morphogenesis(GO:0001831) |
| 0.1 | 2.1 | GO:0010738 | regulation of protein kinase A signaling(GO:0010738) |
| 0.1 | 1.9 | GO:1901663 | ubiquinone metabolic process(GO:0006743) ubiquinone biosynthetic process(GO:0006744) quinone biosynthetic process(GO:1901663) |
| 0.1 | 2.5 | GO:0009880 | embryonic pattern specification(GO:0009880) |
| 0.1 | 4.5 | GO:0015701 | bicarbonate transport(GO:0015701) |
| 0.1 | 0.4 | GO:0032098 | regulation of appetite(GO:0032098) |
| 0.1 | 2.7 | GO:0031648 | protein destabilization(GO:0031648) |
| 0.1 | 4.9 | GO:0043268 | positive regulation of potassium ion transport(GO:0043268) |
| 0.1 | 2.8 | GO:0030520 | intracellular estrogen receptor signaling pathway(GO:0030520) |
| 0.1 | 0.9 | GO:0048003 | antigen processing and presentation via MHC class Ib(GO:0002475) antigen processing and presentation of lipid antigen via MHC class Ib(GO:0048003) antigen processing and presentation, exogenous lipid antigen via MHC class Ib(GO:0048007) |
| 0.1 | 1.3 | GO:0071625 | vocalization behavior(GO:0071625) |
| 0.1 | 0.4 | GO:0046900 | tetrahydrofolylpolyglutamate metabolic process(GO:0046900) |
| 0.1 | 3.5 | GO:0086010 | membrane depolarization during action potential(GO:0086010) |
| 0.1 | 2.2 | GO:0006400 | tRNA modification(GO:0006400) |
| 0.1 | 4.8 | GO:1902476 | chloride transmembrane transport(GO:1902476) |
| 0.1 | 4.8 | GO:0007218 | neuropeptide signaling pathway(GO:0007218) |
| 0.1 | 0.8 | GO:0051014 | actin filament severing(GO:0051014) |
| 0.1 | 5.4 | GO:0045071 | negative regulation of viral genome replication(GO:0045071) |
| 0.1 | 3.5 | GO:0043966 | histone H3 acetylation(GO:0043966) |
| 0.1 | 1.1 | GO:0007131 | reciprocal meiotic recombination(GO:0007131) reciprocal DNA recombination(GO:0035825) |
| 0.1 | 1.1 | GO:0072661 | protein targeting to plasma membrane(GO:0072661) |
| 0.1 | 0.8 | GO:0035434 | copper ion transmembrane transport(GO:0035434) |
| 0.1 | 3.8 | GO:0055072 | iron ion homeostasis(GO:0055072) |
| 0.1 | 0.7 | GO:0045161 | neuronal ion channel clustering(GO:0045161) |
| 0.1 | 1.7 | GO:0034243 | regulation of transcription elongation from RNA polymerase II promoter(GO:0034243) |
| 0.1 | 0.2 | GO:0007501 | mesodermal cell fate specification(GO:0007501) |
| 0.1 | 1.2 | GO:0007368 | determination of left/right symmetry(GO:0007368) |
| 0.1 | 0.6 | GO:0042359 | vitamin D metabolic process(GO:0042359) |
| 0.1 | 0.3 | GO:0055089 | fatty acid homeostasis(GO:0055089) |
| 0.1 | 1.2 | GO:0042059 | negative regulation of epidermal growth factor receptor signaling pathway(GO:0042059) |
| 0.1 | 1.8 | GO:0036297 | interstrand cross-link repair(GO:0036297) |
| 0.1 | 0.9 | GO:0003322 | pancreatic A cell development(GO:0003322) |
| 0.0 | 0.8 | GO:0038111 | interleukin-7-mediated signaling pathway(GO:0038111) |
| 0.0 | 1.4 | GO:0001578 | microtubule bundle formation(GO:0001578) |
| 0.0 | 0.5 | GO:0010499 | proteasomal ubiquitin-independent protein catabolic process(GO:0010499) |
| 0.0 | 0.7 | GO:0070306 | lens fiber cell differentiation(GO:0070306) |
| 0.0 | 3.9 | GO:0030217 | T cell differentiation(GO:0030217) |
| 0.0 | 0.3 | GO:0016226 | iron-sulfur cluster assembly(GO:0016226) metallo-sulfur cluster assembly(GO:0031163) |
| 0.0 | 0.4 | GO:0051044 | positive regulation of membrane protein ectodomain proteolysis(GO:0051044) |
| 0.0 | 1.3 | GO:0018149 | peptide cross-linking(GO:0018149) |
| 0.0 | 0.2 | GO:0000098 | sulfur amino acid catabolic process(GO:0000098) |
| 0.0 | 0.2 | GO:0070535 | negative regulation of histone ubiquitination(GO:0033183) histone H2A K63-linked ubiquitination(GO:0070535) negative regulation of protein K63-linked ubiquitination(GO:1900045) regulation of histone H2A K63-linked ubiquitination(GO:1901314) negative regulation of histone H2A K63-linked ubiquitination(GO:1901315) negative regulation of protein polyubiquitination(GO:1902915) |
| 0.0 | 0.2 | GO:0070987 | error-free translesion synthesis(GO:0070987) |
| 0.0 | 1.6 | GO:0061008 | liver development(GO:0001889) hepaticobiliary system development(GO:0061008) |
| 0.0 | 0.8 | GO:0016525 | negative regulation of angiogenesis(GO:0016525) |
| 0.0 | 1.1 | GO:0035335 | peptidyl-tyrosine dephosphorylation(GO:0035335) |
Gene overrepresentation in cellular component category:
| Log-likelihood per target | Total log-likelihood | Term | Description |
|---|---|---|---|
| 8.0 | 80.2 | GO:0043190 | ATP-binding cassette (ABC) transporter complex(GO:0043190) |
| 7.8 | 31.3 | GO:0033596 | TSC1-TSC2 complex(GO:0033596) |
| 7.3 | 36.7 | GO:0032299 | ribonuclease H2 complex(GO:0032299) |
| 7.3 | 29.1 | GO:0071546 | pi-body(GO:0071546) |
| 7.2 | 43.5 | GO:0005967 | mitochondrial pyruvate dehydrogenase complex(GO:0005967) |
| 7.0 | 21.1 | GO:0031515 | tRNA (m1A) methyltransferase complex(GO:0031515) |
| 6.8 | 47.6 | GO:0098560 | cytoplasmic side of late endosome membrane(GO:0098560) |
| 6.6 | 26.5 | GO:0032777 | Piccolo NuA4 histone acetyltransferase complex(GO:0032777) |
| 5.6 | 22.3 | GO:0035363 | histone locus body(GO:0035363) |
| 5.5 | 22.0 | GO:0033263 | CORVET complex(GO:0033263) |
| 5.2 | 46.5 | GO:0005672 | transcription factor TFIIA complex(GO:0005672) |
| 4.8 | 33.7 | GO:0033391 | chromatoid body(GO:0033391) |
| 4.6 | 23.2 | GO:0005947 | mitochondrial alpha-ketoglutarate dehydrogenase complex(GO:0005947) |
| 4.6 | 27.4 | GO:0005879 | axonemal microtubule(GO:0005879) |
| 4.4 | 21.8 | GO:0016533 | cyclin-dependent protein kinase 5 holoenzyme complex(GO:0016533) |
| 4.3 | 21.7 | GO:0070847 | core mediator complex(GO:0070847) |
| 3.9 | 23.5 | GO:1990131 | EGO complex(GO:0034448) Gtr1-Gtr2 GTPase complex(GO:1990131) |
| 3.9 | 15.6 | GO:1990879 | CST complex(GO:1990879) |
| 3.9 | 27.1 | GO:0045252 | dihydrolipoyl dehydrogenase complex(GO:0045240) oxoglutarate dehydrogenase complex(GO:0045252) |
| 3.8 | 3.8 | GO:0098592 | cytoplasmic side of apical plasma membrane(GO:0098592) |
| 3.6 | 10.9 | GO:0044611 | nuclear pore inner ring(GO:0044611) |
| 3.4 | 17.2 | GO:0001940 | male pronucleus(GO:0001940) |
| 3.2 | 35.5 | GO:0043203 | axon hillock(GO:0043203) |
| 3.2 | 16.0 | GO:0030896 | checkpoint clamp complex(GO:0030896) |
| 3.2 | 12.6 | GO:0019034 | viral replication complex(GO:0019034) |
| 3.0 | 6.0 | GO:0043527 | tRNA methyltransferase complex(GO:0043527) |
| 3.0 | 65.8 | GO:1990124 | messenger ribonucleoprotein complex(GO:1990124) |
| 3.0 | 210.2 | GO:0005834 | heterotrimeric G-protein complex(GO:0005834) |
| 2.9 | 20.1 | GO:0030121 | AP-1 adaptor complex(GO:0030121) |
| 2.7 | 13.3 | GO:0044308 | axonal spine(GO:0044308) |
| 2.4 | 28.9 | GO:0030897 | HOPS complex(GO:0030897) |
| 2.3 | 30.5 | GO:0097433 | dense body(GO:0097433) |
| 2.3 | 7.0 | GO:0098536 | deuterosome(GO:0098536) |
| 2.3 | 9.2 | GO:0048179 | activin receptor complex(GO:0048179) |
| 2.3 | 9.2 | GO:0070044 | synaptobrevin 2-SNAP-25-syntaxin-1a complex(GO:0070044) |
| 2.2 | 13.0 | GO:0032389 | MutLalpha complex(GO:0032389) |
| 2.1 | 10.3 | GO:0071458 | integral component of cytoplasmic side of endoplasmic reticulum membrane(GO:0071458) |
| 2.0 | 13.9 | GO:0030893 | meiotic cohesin complex(GO:0030893) |
| 1.9 | 5.7 | GO:0090571 | RNA polymerase II transcription repressor complex(GO:0090571) |
| 1.9 | 13.0 | GO:0044326 | dendritic spine neck(GO:0044326) |
| 1.8 | 9.2 | GO:0044305 | calyx of Held(GO:0044305) |
| 1.8 | 5.4 | GO:0071756 | IgM immunoglobulin complex(GO:0071753) IgM immunoglobulin complex, circulating(GO:0071754) pentameric IgM immunoglobulin complex(GO:0071756) |
| 1.8 | 21.1 | GO:0097136 | Bcl-2 family protein complex(GO:0097136) |
| 1.7 | 3.5 | GO:0098559 | cytoplasmic side of early endosome membrane(GO:0098559) |
| 1.7 | 5.1 | GO:0000333 | telomerase catalytic core complex(GO:0000333) |
| 1.6 | 29.2 | GO:0000786 | nucleosome(GO:0000786) |
| 1.6 | 11.2 | GO:0036157 | outer dynein arm(GO:0036157) |
| 1.6 | 12.7 | GO:0000243 | commitment complex(GO:0000243) |
| 1.5 | 7.5 | GO:0001673 | male germ cell nucleus(GO:0001673) |
| 1.5 | 5.9 | GO:0033648 | host intracellular organelle(GO:0033647) host intracellular membrane-bounded organelle(GO:0033648) |
| 1.5 | 31.0 | GO:0031229 | integral component of nuclear inner membrane(GO:0005639) intrinsic component of nuclear inner membrane(GO:0031229) nuclear membrane part(GO:0044453) |
| 1.5 | 13.2 | GO:0001520 | outer dense fiber(GO:0001520) |
| 1.4 | 17.3 | GO:0043240 | Fanconi anaemia nuclear complex(GO:0043240) |
| 1.4 | 4.3 | GO:0005953 | CAAX-protein geranylgeranyltransferase complex(GO:0005953) |
| 1.4 | 35.3 | GO:0014731 | spectrin-associated cytoskeleton(GO:0014731) |
| 1.4 | 37.8 | GO:0031143 | pseudopodium(GO:0031143) |
| 1.4 | 27.6 | GO:0042405 | nuclear inclusion body(GO:0042405) |
| 1.4 | 25.9 | GO:0005721 | pericentric heterochromatin(GO:0005721) |
| 1.4 | 25.8 | GO:0016461 | unconventional myosin complex(GO:0016461) |
| 1.4 | 51.4 | GO:0000795 | synaptonemal complex(GO:0000795) |
| 1.3 | 76.1 | GO:0033017 | sarcoplasmic reticulum membrane(GO:0033017) |
| 1.3 | 10.4 | GO:0005827 | polar microtubule(GO:0005827) |
| 1.3 | 5.1 | GO:0000221 | vacuolar proton-transporting V-type ATPase, V1 domain(GO:0000221) |
| 1.3 | 8.9 | GO:1990635 | proximal dendrite(GO:1990635) |
| 1.2 | 33.6 | GO:0034362 | low-density lipoprotein particle(GO:0034362) |
| 1.1 | 24.0 | GO:0097381 | photoreceptor disc membrane(GO:0097381) |
| 1.1 | 3.3 | GO:0032116 | SMC loading complex(GO:0032116) |
| 1.1 | 16.5 | GO:0043083 | synaptic cleft(GO:0043083) |
| 1.1 | 15.2 | GO:1990712 | HFE-transferrin receptor complex(GO:1990712) |
| 1.1 | 19.5 | GO:0097225 | sperm midpiece(GO:0097225) |
| 1.0 | 16.2 | GO:0005890 | sodium:potassium-exchanging ATPase complex(GO:0005890) |
| 1.0 | 12.0 | GO:0071203 | WASH complex(GO:0071203) |
| 1.0 | 3.9 | GO:1990578 | perinuclear endoplasmic reticulum membrane(GO:1990578) |
| 1.0 | 17.6 | GO:0005922 | connexon complex(GO:0005922) |
| 1.0 | 54.5 | GO:0031463 | Cul3-RING ubiquitin ligase complex(GO:0031463) |
| 1.0 | 5.7 | GO:1990316 | ATG1/ULK1 kinase complex(GO:1990316) |
| 1.0 | 10.5 | GO:0032045 | guanyl-nucleotide exchange factor complex(GO:0032045) |
| 0.9 | 8.3 | GO:0005845 | mRNA cap binding complex(GO:0005845) |
| 0.9 | 19.1 | GO:0071782 | endoplasmic reticulum tubular network(GO:0071782) |
| 0.9 | 4.5 | GO:0034688 | integrin alphaM-beta2 complex(GO:0034688) |
| 0.9 | 5.4 | GO:0034673 | inhibin-betaglycan-ActRII complex(GO:0034673) |
| 0.9 | 19.0 | GO:0031307 | integral component of mitochondrial outer membrane(GO:0031307) |
| 0.9 | 4.3 | GO:0031205 | endoplasmic reticulum Sec complex(GO:0031205) |
| 0.8 | 41.2 | GO:0016235 | aggresome(GO:0016235) |
| 0.8 | 4.2 | GO:0097208 | alveolar lamellar body(GO:0097208) |
| 0.8 | 14.1 | GO:0002080 | acrosomal membrane(GO:0002080) |
| 0.8 | 4.1 | GO:1990589 | ATF4-CREB1 transcription factor complex(GO:1990589) |
| 0.8 | 17.9 | GO:0005868 | cytoplasmic dynein complex(GO:0005868) |
| 0.8 | 3.9 | GO:0000408 | EKC/KEOPS complex(GO:0000408) |
| 0.8 | 16.9 | GO:0048786 | presynaptic active zone(GO:0048786) |
| 0.8 | 3.1 | GO:1990393 | 3M complex(GO:1990393) |
| 0.8 | 6.1 | GO:0072487 | MSL complex(GO:0072487) |
| 0.8 | 3.0 | GO:0097123 | cyclin A1-CDK2 complex(GO:0097123) |
| 0.7 | 1.5 | GO:0099634 | postsynaptic specialization membrane(GO:0099634) |
| 0.7 | 4.3 | GO:0009331 | glycerol-3-phosphate dehydrogenase complex(GO:0009331) |
| 0.7 | 9.0 | GO:0008074 | guanylate cyclase complex, soluble(GO:0008074) |
| 0.7 | 4.7 | GO:0031313 | extrinsic component of endosome membrane(GO:0031313) |
| 0.7 | 9.3 | GO:0070938 | contractile ring(GO:0070938) |
| 0.7 | 4.6 | GO:0008282 | ATP-sensitive potassium channel complex(GO:0008282) |
| 0.6 | 78.4 | GO:0042734 | presynaptic membrane(GO:0042734) |
| 0.6 | 36.4 | GO:0043198 | dendritic shaft(GO:0043198) |
| 0.6 | 1.9 | GO:0097058 | CRLF-CLCF1 complex(GO:0097058) |
| 0.6 | 20.0 | GO:0030173 | integral component of Golgi membrane(GO:0030173) |
| 0.6 | 10.6 | GO:0043194 | axon initial segment(GO:0043194) |
| 0.6 | 22.8 | GO:0046658 | anchored component of plasma membrane(GO:0046658) |
| 0.6 | 10.4 | GO:0035631 | CD40 receptor complex(GO:0035631) |
| 0.6 | 4.5 | GO:0035976 | AP1 complex(GO:0035976) |
| 0.6 | 1.7 | GO:1902937 | inward rectifier potassium channel complex(GO:1902937) |
| 0.5 | 4.4 | GO:1903439 | calcitonin family receptor complex(GO:1903439) amylin receptor complex(GO:1903440) |
| 0.5 | 1.5 | GO:0070701 | mucus layer(GO:0070701) |
| 0.5 | 11.3 | GO:0035327 | transcriptionally active chromatin(GO:0035327) |
| 0.5 | 3.0 | GO:0005945 | 6-phosphofructokinase complex(GO:0005945) |
| 0.5 | 12.5 | GO:0005682 | U5 snRNP(GO:0005682) |
| 0.5 | 7.5 | GO:0033270 | paranode region of axon(GO:0033270) |
| 0.5 | 6.3 | GO:0032591 | dendritic spine membrane(GO:0032591) |
| 0.5 | 62.1 | GO:0031234 | extrinsic component of cytoplasmic side of plasma membrane(GO:0031234) |
| 0.5 | 3.2 | GO:0030991 | intraciliary transport particle A(GO:0030991) |
| 0.5 | 3.2 | GO:0035253 | ciliary rootlet(GO:0035253) |
| 0.5 | 13.4 | GO:0035371 | microtubule plus-end(GO:0035371) |
| 0.5 | 3.2 | GO:0042788 | polysomal ribosome(GO:0042788) |
| 0.4 | 2.7 | GO:0002177 | manchette(GO:0002177) |
| 0.4 | 3.4 | GO:0044294 | dendritic growth cone(GO:0044294) |
| 0.4 | 4.1 | GO:0005614 | interstitial matrix(GO:0005614) |
| 0.4 | 2.0 | GO:0036128 | CatSper complex(GO:0036128) |
| 0.4 | 5.2 | GO:0002199 | zona pellucida receptor complex(GO:0002199) |
| 0.4 | 5.2 | GO:0031616 | spindle pole centrosome(GO:0031616) |
| 0.4 | 3.6 | GO:0098845 | postsynaptic endosome(GO:0098845) |
| 0.4 | 40.7 | GO:0034705 | voltage-gated potassium channel complex(GO:0008076) potassium channel complex(GO:0034705) |
| 0.4 | 4.3 | GO:0031045 | dense core granule(GO:0031045) |
| 0.4 | 11.1 | GO:0005892 | acetylcholine-gated channel complex(GO:0005892) |
| 0.4 | 57.5 | GO:0032587 | ruffle membrane(GO:0032587) |
| 0.4 | 4.1 | GO:0005638 | lamin filament(GO:0005638) |
| 0.4 | 10.7 | GO:0001917 | photoreceptor inner segment(GO:0001917) |
| 0.4 | 32.8 | GO:0005814 | centriole(GO:0005814) |
| 0.3 | 11.1 | GO:0001772 | immunological synapse(GO:0001772) |
| 0.3 | 1.0 | GO:0035354 | Toll-like receptor 1-Toll-like receptor 2 protein complex(GO:0035354) |
| 0.3 | 1.7 | GO:0098554 | cytoplasmic side of endoplasmic reticulum membrane(GO:0098554) |
| 0.3 | 8.1 | GO:0032391 | photoreceptor connecting cilium(GO:0032391) |
| 0.3 | 13.1 | GO:0005865 | striated muscle thin filament(GO:0005865) |
| 0.3 | 1.0 | GO:0032593 | insulin-responsive compartment(GO:0032593) |
| 0.3 | 2.0 | GO:0033553 | rDNA heterochromatin(GO:0033553) |
| 0.3 | 2.9 | GO:0002193 | MAML1-RBP-Jkappa- ICN1 complex(GO:0002193) |
| 0.3 | 15.6 | GO:0019005 | SCF ubiquitin ligase complex(GO:0019005) |
| 0.3 | 1.3 | GO:0097513 | myosin II filament(GO:0097513) |
| 0.3 | 5.4 | GO:0000164 | protein phosphatase type 1 complex(GO:0000164) |
| 0.3 | 5.2 | GO:0001931 | uropod(GO:0001931) cell trailing edge(GO:0031254) |
| 0.3 | 2.7 | GO:0044754 | phagolysosome(GO:0032010) autolysosome(GO:0044754) |
| 0.3 | 7.2 | GO:0070971 | endoplasmic reticulum exit site(GO:0070971) |
| 0.3 | 13.1 | GO:0005929 | cilium(GO:0005929) |
| 0.3 | 2.7 | GO:0031314 | extrinsic component of mitochondrial inner membrane(GO:0031314) |
| 0.3 | 26.3 | GO:0032580 | Golgi cisterna membrane(GO:0032580) |
| 0.3 | 23.9 | GO:0030175 | filopodium(GO:0030175) |
| 0.3 | 0.8 | GO:0030312 | external encapsulating structure(GO:0030312) |
| 0.3 | 42.0 | GO:0055037 | recycling endosome(GO:0055037) |
| 0.3 | 1.3 | GO:0044447 | axoneme part(GO:0044447) |
| 0.2 | 2.2 | GO:0031233 | intrinsic component of external side of plasma membrane(GO:0031233) |
| 0.2 | 8.4 | GO:0042629 | mast cell granule(GO:0042629) |
| 0.2 | 2.7 | GO:0008024 | cyclin/CDK positive transcription elongation factor complex(GO:0008024) |
| 0.2 | 1.0 | GO:0005968 | Rab-protein geranylgeranyltransferase complex(GO:0005968) |
| 0.2 | 7.5 | GO:0034707 | chloride channel complex(GO:0034707) |
| 0.2 | 2.1 | GO:0097427 | microtubule bundle(GO:0097427) |
| 0.2 | 3.1 | GO:0033256 | I-kappaB/NF-kappaB complex(GO:0033256) |
| 0.2 | 0.7 | GO:0035517 | PR-DUB complex(GO:0035517) |
| 0.2 | 79.1 | GO:0036477 | somatodendritic compartment(GO:0036477) |
| 0.2 | 10.7 | GO:0005844 | polysome(GO:0005844) |
| 0.2 | 3.2 | GO:0032809 | neuronal cell body membrane(GO:0032809) cell body membrane(GO:0044298) |
| 0.2 | 17.6 | GO:0031514 | motile cilium(GO:0031514) |
| 0.2 | 3.6 | GO:0005662 | DNA replication factor A complex(GO:0005662) |
| 0.2 | 2.5 | GO:0031235 | intrinsic component of the cytoplasmic side of the plasma membrane(GO:0031235) |
| 0.2 | 6.0 | GO:0101003 | ficolin-1-rich granule membrane(GO:0101003) |
| 0.2 | 5.0 | GO:0009925 | basal plasma membrane(GO:0009925) |
| 0.2 | 15.7 | GO:0070821 | tertiary granule membrane(GO:0070821) |
| 0.2 | 4.5 | GO:0005779 | integral component of peroxisomal membrane(GO:0005779) intrinsic component of peroxisomal membrane(GO:0031231) |
| 0.2 | 4.0 | GO:0035145 | exon-exon junction complex(GO:0035145) |
| 0.2 | 3.9 | GO:0097014 | axoneme(GO:0005930) ciliary plasm(GO:0097014) |
| 0.2 | 1.9 | GO:0002116 | semaphorin receptor complex(GO:0002116) |
| 0.2 | 10.3 | GO:0030315 | T-tubule(GO:0030315) |
| 0.2 | 15.4 | GO:0019898 | extrinsic component of membrane(GO:0019898) |
| 0.2 | 135.3 | GO:0045202 | synapse(GO:0045202) |
| 0.2 | 0.9 | GO:0045179 | apical cortex(GO:0045179) |
| 0.2 | 18.0 | GO:0031225 | anchored component of membrane(GO:0031225) |
| 0.2 | 4.2 | GO:0097546 | ciliary base(GO:0097546) |
| 0.2 | 6.3 | GO:0005776 | autophagosome(GO:0005776) |
| 0.2 | 1.8 | GO:0016602 | CCAAT-binding factor complex(GO:0016602) |
| 0.2 | 0.8 | GO:0032059 | bleb(GO:0032059) |
| 0.1 | 2.7 | GO:0005871 | kinesin complex(GO:0005871) |
| 0.1 | 21.8 | GO:0005741 | mitochondrial outer membrane(GO:0005741) |
| 0.1 | 9.4 | GO:1904724 | tertiary granule lumen(GO:1904724) |
| 0.1 | 3.8 | GO:0008305 | integrin complex(GO:0008305) |
| 0.1 | 1.5 | GO:0005583 | fibrillar collagen trimer(GO:0005583) banded collagen fibril(GO:0098643) |
| 0.1 | 3.8 | GO:0060170 | ciliary membrane(GO:0060170) |
| 0.1 | 4.2 | GO:0016460 | myosin II complex(GO:0016460) |
| 0.1 | 0.6 | GO:0000172 | ribonuclease MRP complex(GO:0000172) |
| 0.1 | 7.3 | GO:0031901 | early endosome membrane(GO:0031901) |
| 0.1 | 15.3 | GO:0034399 | nuclear periphery(GO:0034399) |
| 0.1 | 1.3 | GO:0001750 | photoreceptor outer segment(GO:0001750) |
| 0.1 | 1.8 | GO:0030057 | desmosome(GO:0030057) |
| 0.1 | 8.9 | GO:0005796 | Golgi lumen(GO:0005796) |
| 0.1 | 1.3 | GO:0030014 | CCR4-NOT complex(GO:0030014) |
| 0.1 | 1.6 | GO:0035861 | site of double-strand break(GO:0035861) |
| 0.1 | 1.9 | GO:0034451 | centriolar satellite(GO:0034451) |
| 0.1 | 33.0 | GO:0005815 | microtubule organizing center(GO:0005815) |
| 0.1 | 0.2 | GO:0097135 | cyclin E2-CDK2 complex(GO:0097135) |
| 0.1 | 5.9 | GO:0000932 | cytoplasmic mRNA processing body(GO:0000932) |
| 0.1 | 2.9 | GO:0035579 | specific granule membrane(GO:0035579) |
| 0.1 | 12.8 | GO:0009897 | external side of plasma membrane(GO:0009897) |
| 0.1 | 1.3 | GO:0001533 | cornified envelope(GO:0001533) |
| 0.0 | 0.3 | GO:0031428 | box C/D snoRNP complex(GO:0031428) |
| 0.0 | 1.9 | GO:0008023 | transcription elongation factor complex(GO:0008023) |
| 0.0 | 0.4 | GO:0044613 | nuclear pore central transport channel(GO:0044613) |
| 0.0 | 0.9 | GO:0045095 | keratin filament(GO:0045095) |
| 0.0 | 0.4 | GO:0031201 | SNARE complex(GO:0031201) |
| 0.0 | 1.0 | GO:0005801 | cis-Golgi network(GO:0005801) |
| 0.0 | 0.4 | GO:0005875 | microtubule associated complex(GO:0005875) |
Gene overrepresentation in molecular function category:
| Log-likelihood per target | Total log-likelihood | Term | Description |
|---|---|---|---|
| 32.9 | 131.7 | GO:0042030 | ATPase inhibitor activity(GO:0042030) |
| 30.3 | 181.9 | GO:0004489 | methylenetetrahydrofolate reductase (NAD(P)H) activity(GO:0004489) |
| 19.5 | 78.0 | GO:0070326 | very-low-density lipoprotein particle receptor binding(GO:0070326) |
| 15.2 | 60.7 | GO:0004741 | [pyruvate dehydrogenase (lipoamide)] phosphatase activity(GO:0004741) |
| 11.8 | 153.4 | GO:0031681 | G-protein beta-subunit binding(GO:0031681) |
| 9.3 | 27.8 | GO:0033746 | histone demethylase activity (H3-R2 specific)(GO:0033746) histone demethylase activity (H4-R3 specific)(GO:0033749) |
| 9.1 | 27.4 | GO:0031849 | olfactory receptor binding(GO:0031849) |
| 8.0 | 24.0 | GO:0050254 | rhodopsin kinase activity(GO:0050254) |
| 8.0 | 24.0 | GO:0098519 | nucleotide phosphatase activity, acting on free nucleotides(GO:0098519) |
| 7.7 | 38.7 | GO:0030375 | thyroid hormone receptor activator activity(GO:0010861) thyroid hormone receptor coactivator activity(GO:0030375) |
| 7.7 | 23.2 | GO:0003863 | alpha-ketoacid dehydrogenase activity(GO:0003826) 3-methyl-2-oxobutanoate dehydrogenase (2-methylpropanoyl-transferring) activity(GO:0003863) |
| 7.6 | 22.8 | GO:0004616 | phosphogluconate dehydrogenase (decarboxylating) activity(GO:0004616) |
| 7.5 | 30.1 | GO:0016426 | tRNA (adenine) methyltransferase activity(GO:0016426) |
| 7.3 | 43.9 | GO:0008273 | calcium, potassium:sodium antiporter activity(GO:0008273) |
| 7.3 | 21.8 | GO:0016534 | cyclin-dependent protein kinase 5 activator activity(GO:0016534) |
| 7.2 | 43.5 | GO:0004740 | pyruvate dehydrogenase (acetyl-transferring) kinase activity(GO:0004740) |
| 6.8 | 40.9 | GO:0016929 | SUMO-specific protease activity(GO:0016929) |
| 6.7 | 27.0 | GO:0061752 | telomeric repeat-containing RNA binding(GO:0061752) |
| 6.3 | 132.2 | GO:0005247 | voltage-gated chloride channel activity(GO:0005247) |
| 6.0 | 48.1 | GO:0044547 | DNA topoisomerase binding(GO:0044547) |
| 5.8 | 23.2 | GO:0035033 | histone deacetylase regulator activity(GO:0035033) |
| 5.5 | 16.5 | GO:0005280 | hydrogen:amino acid symporter activity(GO:0005280) |
| 5.4 | 27.1 | GO:0004591 | oxoglutarate dehydrogenase (succinyl-transferring) activity(GO:0004591) |
| 5.0 | 20.1 | GO:0047192 | 1-alkylglycerophosphocholine O-acetyltransferase activity(GO:0047192) |
| 4.9 | 43.7 | GO:0004727 | prenylated protein tyrosine phosphatase activity(GO:0004727) |
| 4.8 | 67.7 | GO:0022820 | potassium:chloride symporter activity(GO:0015379) potassium ion symporter activity(GO:0022820) |
| 4.6 | 18.5 | GO:0004802 | transketolase activity(GO:0004802) |
| 4.4 | 17.6 | GO:0004773 | steryl-sulfatase activity(GO:0004773) |
| 4.3 | 13.0 | GO:0005457 | GDP-fucose transmembrane transporter activity(GO:0005457) purine nucleotide-sugar transmembrane transporter activity(GO:0036080) |
| 4.0 | 76.1 | GO:0035925 | mRNA 3'-UTR AU-rich region binding(GO:0035925) |
| 4.0 | 11.9 | GO:0016833 | oxo-acid-lyase activity(GO:0016833) |
| 4.0 | 19.8 | GO:0070097 | delta-catenin binding(GO:0070097) |
| 3.9 | 94.2 | GO:0033130 | acetylcholine receptor binding(GO:0033130) |
| 3.8 | 11.5 | GO:0031687 | A2A adenosine receptor binding(GO:0031687) |
| 3.8 | 11.4 | GO:0030158 | protein xylosyltransferase activity(GO:0030158) |
| 3.8 | 11.3 | GO:0008330 | protein tyrosine/threonine phosphatase activity(GO:0008330) |
| 3.6 | 14.5 | GO:0033897 | ribonuclease T2 activity(GO:0033897) |
| 3.6 | 10.7 | GO:0015218 | pyrimidine nucleotide transmembrane transporter activity(GO:0015218) |
| 3.5 | 14.1 | GO:0047288 | monosialoganglioside sialyltransferase activity(GO:0047288) |
| 3.5 | 10.4 | GO:0001075 | transcription factor activity, RNA polymerase II core promoter sequence-specific binding involved in preinitiation complex assembly(GO:0001075) |
| 3.4 | 17.1 | GO:1904288 | BAT3 complex binding(GO:1904288) |
| 3.4 | 16.9 | GO:0003835 | beta-galactoside alpha-2,6-sialyltransferase activity(GO:0003835) |
| 3.4 | 16.8 | GO:0008948 | malate dehydrogenase (decarboxylating) (NAD+) activity(GO:0004471) malate dehydrogenase (decarboxylating) (NADP+) activity(GO:0004473) oxaloacetate decarboxylase activity(GO:0008948) |
| 3.2 | 9.5 | GO:0035605 | peptidyl-cysteine S-nitrosylase activity(GO:0035605) |
| 3.1 | 36.7 | GO:0008020 | G-protein coupled photoreceptor activity(GO:0008020) |
| 3.0 | 14.9 | GO:0004370 | glycerol kinase activity(GO:0004370) |
| 2.9 | 5.9 | GO:0031762 | alpha-1A adrenergic receptor binding(GO:0031691) follicle-stimulating hormone receptor binding(GO:0031762) |
| 2.9 | 40.6 | GO:0055056 | D-glucose transmembrane transporter activity(GO:0055056) |
| 2.9 | 11.5 | GO:0086020 | gap junction channel activity involved in SA node cell-atrial cardiac muscle cell electrical coupling(GO:0086020) gap junction channel activity involved in AV node cell-bundle of His cell electrical coupling(GO:0086077) |
| 2.8 | 17.1 | GO:0002161 | aminoacyl-tRNA editing activity(GO:0002161) |
| 2.8 | 31.0 | GO:0035381 | extracellular ATP-gated cation channel activity(GO:0004931) ATP-gated ion channel activity(GO:0035381) |
| 2.8 | 14.0 | GO:0015562 | efflux transmembrane transporter activity(GO:0015562) |
| 2.8 | 8.4 | GO:0070290 | N-acylphosphatidylethanolamine-specific phospholipase D activity(GO:0070290) |
| 2.7 | 16.3 | GO:0008853 | exodeoxyribonuclease III activity(GO:0008853) |
| 2.7 | 37.8 | GO:0051864 | histone demethylase activity (H3-K36 specific)(GO:0051864) |
| 2.7 | 8.1 | GO:0001601 | peptide YY receptor activity(GO:0001601) |
| 2.7 | 134.7 | GO:0004683 | calmodulin-dependent protein kinase activity(GO:0004683) |
| 2.7 | 18.8 | GO:0000155 | phosphorelay sensor kinase activity(GO:0000155) |
| 2.5 | 22.1 | GO:0036312 | phosphatidylinositol 3-kinase regulatory subunit binding(GO:0036312) |
| 2.4 | 21.5 | GO:0099583 | neurotransmitter receptor activity involved in regulation of postsynaptic cytosolic calcium ion concentration(GO:0099583) |
| 2.4 | 81.0 | GO:0005086 | ARF guanyl-nucleotide exchange factor activity(GO:0005086) |
| 2.4 | 7.1 | GO:0016497 | substance K receptor activity(GO:0016497) |
| 2.3 | 28.1 | GO:0001206 | transcriptional repressor activity, RNA polymerase II distal enhancer sequence-specific binding(GO:0001206) |
| 2.3 | 32.7 | GO:0061578 | Lys63-specific deubiquitinase activity(GO:0061578) |
| 2.3 | 36.9 | GO:0030306 | ADP-ribosylation factor binding(GO:0030306) |
| 2.3 | 6.9 | GO:0008294 | calcium- and calmodulin-responsive adenylate cyclase activity(GO:0008294) |
| 2.2 | 8.9 | GO:0000309 | nicotinamide-nucleotide adenylyltransferase activity(GO:0000309) |
| 2.2 | 28.6 | GO:0043008 | ATP-dependent protein binding(GO:0043008) |
| 2.2 | 21.6 | GO:0001042 | RNA polymerase I core binding(GO:0001042) |
| 2.1 | 12.6 | GO:0004430 | 1-phosphatidylinositol 4-kinase activity(GO:0004430) |
| 2.1 | 29.5 | GO:0017034 | Rap guanyl-nucleotide exchange factor activity(GO:0017034) |
| 2.1 | 4.2 | GO:0035497 | cAMP response element binding(GO:0035497) |
| 2.1 | 10.5 | GO:0005298 | proline:sodium symporter activity(GO:0005298) |
| 2.1 | 4.2 | GO:0038052 | RNA polymerase II transcription factor activity, estrogen-activated sequence-specific DNA binding(GO:0038052) |
| 2.1 | 16.5 | GO:0009008 | DNA-methyltransferase activity(GO:0009008) |
| 2.0 | 8.1 | GO:0032408 | MutLbeta complex binding(GO:0032406) MutSbeta complex binding(GO:0032408) |
| 2.0 | 15.7 | GO:0060002 | plus-end directed microfilament motor activity(GO:0060002) |
| 1.9 | 7.7 | GO:0004505 | phenylalanine 4-monooxygenase activity(GO:0004505) |
| 1.9 | 9.5 | GO:0019912 | cyclin-dependent protein kinase activating kinase activity(GO:0019912) |
| 1.9 | 22.6 | GO:0004075 | biotin carboxylase activity(GO:0004075) |
| 1.9 | 11.1 | GO:0004703 | G-protein coupled receptor kinase activity(GO:0004703) |
| 1.9 | 13.0 | GO:0032407 | MutSalpha complex binding(GO:0032407) |
| 1.9 | 11.1 | GO:0004563 | beta-N-acetylhexosaminidase activity(GO:0004563) |
| 1.8 | 32.7 | GO:0019992 | diacylglycerol binding(GO:0019992) |
| 1.8 | 9.1 | GO:0031893 | vasopressin receptor binding(GO:0031893) |
| 1.8 | 7.1 | GO:0033829 | O-fucosylpeptide 3-beta-N-acetylglucosaminyltransferase activity(GO:0033829) |
| 1.8 | 8.8 | GO:0030060 | L-malate dehydrogenase activity(GO:0030060) |
| 1.7 | 34.5 | GO:0005522 | profilin binding(GO:0005522) |
| 1.7 | 5.1 | GO:0035473 | lipase binding(GO:0035473) |
| 1.7 | 8.6 | GO:0004694 | eukaryotic translation initiation factor 2alpha kinase activity(GO:0004694) |
| 1.7 | 22.2 | GO:0070700 | BMP receptor binding(GO:0070700) |
| 1.7 | 10.1 | GO:0061665 | SUMO ligase activity(GO:0061665) |
| 1.7 | 5.0 | GO:0008321 | Ral guanyl-nucleotide exchange factor activity(GO:0008321) |
| 1.7 | 8.3 | GO:0008174 | mRNA methyltransferase activity(GO:0008174) |
| 1.6 | 6.6 | GO:0015220 | choline transmembrane transporter activity(GO:0015220) |
| 1.6 | 18.0 | GO:0003836 | beta-galactoside (CMP) alpha-2,3-sialyltransferase activity(GO:0003836) |
| 1.6 | 14.6 | GO:0034711 | inhibin binding(GO:0034711) |
| 1.6 | 6.3 | GO:0003875 | ADP-ribosylarginine hydrolase activity(GO:0003875) |
| 1.6 | 6.2 | GO:0046592 | polyamine oxidase activity(GO:0046592) spermine:oxygen oxidoreductase (spermidine-forming) activity(GO:0052901) |
| 1.5 | 16.8 | GO:0070915 | lysophosphatidic acid receptor activity(GO:0070915) |
| 1.5 | 13.3 | GO:0004565 | beta-galactosidase activity(GO:0004565) |
| 1.5 | 14.7 | GO:0022841 | potassium ion leak channel activity(GO:0022841) |
| 1.5 | 10.3 | GO:0042500 | aspartic endopeptidase activity, intramembrane cleaving(GO:0042500) |
| 1.4 | 13.0 | GO:0046974 | histone methyltransferase activity (H3-K9 specific)(GO:0046974) |
| 1.4 | 4.3 | GO:0004662 | CAAX-protein geranylgeranyltransferase activity(GO:0004662) |
| 1.4 | 4.3 | GO:0005260 | channel-conductance-controlling ATPase activity(GO:0005260) |
| 1.4 | 7.0 | GO:0030618 | transforming growth factor beta receptor, pathway-specific cytoplasmic mediator activity(GO:0030618) |
| 1.4 | 4.1 | GO:0070039 | rRNA (guanosine-2'-O-)-methyltransferase activity(GO:0070039) |
| 1.4 | 16.3 | GO:0004065 | arylsulfatase activity(GO:0004065) |
| 1.4 | 9.5 | GO:0035368 | selenocysteine insertion sequence binding(GO:0035368) |
| 1.3 | 5.4 | GO:0004668 | protein-arginine deiminase activity(GO:0004668) |
| 1.3 | 15.2 | GO:0005025 | transforming growth factor beta receptor activity, type I(GO:0005025) |
| 1.2 | 7.5 | GO:1990226 | histone methyltransferase binding(GO:1990226) |
| 1.2 | 3.7 | GO:0016309 | 1-phosphatidylinositol-5-phosphate 4-kinase activity(GO:0016309) |
| 1.2 | 5.0 | GO:0003990 | acetylcholinesterase activity(GO:0003990) |
| 1.2 | 6.1 | GO:0052847 | endopolyphosphatase activity(GO:0000298) diphosphoinositol-polyphosphate diphosphatase activity(GO:0008486) bis(5'-adenosyl)-hexaphosphatase activity(GO:0034431) bis(5'-adenosyl)-pentaphosphatase activity(GO:0034432) inositol diphosphate tetrakisphosphate diphosphatase activity(GO:0052840) inositol bisdiphosphate tetrakisphosphate diphosphatase activity(GO:0052841) inositol diphosphate pentakisphosphate diphosphatase activity(GO:0052842) inositol-1-diphosphate-2,3,4,5,6-pentakisphosphate diphosphatase activity(GO:0052843) inositol-3-diphosphate-1,2,4,5,6-pentakisphosphate diphosphatase activity(GO:0052844) inositol-5-diphosphate-1,2,3,4,6-pentakisphosphate diphosphatase activity(GO:0052845) inositol-1,5-bisdiphosphate-2,3,4,6-tetrakisphosphate 1-diphosphatase activity(GO:0052846) inositol-1,5-bisdiphosphate-2,3,4,6-tetrakisphosphate 5-diphosphatase activity(GO:0052847) inositol-3,5-bisdiphosphate-2,3,4,6-tetrakisphosphate 5-diphosphatase activity(GO:0052848) |
| 1.2 | 6.1 | GO:0008532 | N-acetyllactosaminide beta-1,3-N-acetylglucosaminyltransferase activity(GO:0008532) |
| 1.2 | 4.8 | GO:0034041 | sterol-transporting ATPase activity(GO:0034041) |
| 1.2 | 7.1 | GO:0004305 | ethanolamine kinase activity(GO:0004305) |
| 1.2 | 5.9 | GO:0031694 | alpha-2A adrenergic receptor binding(GO:0031694) |
| 1.2 | 35.3 | GO:0017075 | syntaxin-1 binding(GO:0017075) |
| 1.2 | 3.5 | GO:0060001 | minus-end directed microfilament motor activity(GO:0060001) |
| 1.2 | 4.6 | GO:0008281 | sulfonylurea receptor activity(GO:0008281) |
| 1.1 | 4.6 | GO:0030628 | pre-mRNA 3'-splice site binding(GO:0030628) |
| 1.1 | 18.3 | GO:0031432 | titin binding(GO:0031432) |
| 1.1 | 14.6 | GO:0005391 | sodium:potassium-exchanging ATPase activity(GO:0005391) |
| 1.1 | 59.4 | GO:0017112 | Rab guanyl-nucleotide exchange factor activity(GO:0017112) |
| 1.1 | 4.4 | GO:0031716 | calcitonin receptor activity(GO:0004948) calcitonin receptor binding(GO:0031716) |
| 1.1 | 7.6 | GO:0019788 | NEDD8 transferase activity(GO:0019788) |
| 1.1 | 9.6 | GO:0004767 | sphingomyelin phosphodiesterase activity(GO:0004767) |
| 1.0 | 3.1 | GO:0036505 | prosaposin receptor activity(GO:0036505) |
| 1.0 | 38.1 | GO:0005109 | frizzled binding(GO:0005109) |
| 1.0 | 9.1 | GO:0001162 | RNA polymerase II intronic transcription regulatory region sequence-specific DNA binding(GO:0001162) |
| 1.0 | 12.0 | GO:0004017 | adenylate kinase activity(GO:0004017) |
| 1.0 | 11.0 | GO:0004332 | fructose-bisphosphate aldolase activity(GO:0004332) |
| 1.0 | 3.0 | GO:0001641 | group II metabotropic glutamate receptor activity(GO:0001641) |
| 1.0 | 11.9 | GO:0015129 | lactate transmembrane transporter activity(GO:0015129) |
| 1.0 | 8.6 | GO:0047623 | AMP deaminase activity(GO:0003876) adenosine-phosphate deaminase activity(GO:0047623) |
| 0.9 | 19.0 | GO:0043548 | phosphatidylinositol 3-kinase binding(GO:0043548) |
| 0.9 | 3.8 | GO:0001588 | dopamine neurotransmitter receptor activity, coupled via Gs(GO:0001588) |
| 0.9 | 10.3 | GO:0051525 | NFAT protein binding(GO:0051525) |
| 0.9 | 3.7 | GO:0022858 | L-alanine transmembrane transporter activity(GO:0015180) alanine transmembrane transporter activity(GO:0022858) |
| 0.9 | 25.2 | GO:0005528 | macrolide binding(GO:0005527) FK506 binding(GO:0005528) |
| 0.9 | 13.8 | GO:0015929 | hexosaminidase activity(GO:0015929) |
| 0.9 | 7.4 | GO:0004972 | NMDA glutamate receptor activity(GO:0004972) |
| 0.9 | 6.3 | GO:0030368 | interleukin-17 receptor activity(GO:0030368) |
| 0.9 | 6.3 | GO:0050291 | sphingosine N-acyltransferase activity(GO:0050291) |
| 0.9 | 3.6 | GO:0032422 | purine-rich negative regulatory element binding(GO:0032422) |
| 0.9 | 10.6 | GO:0010314 | phosphatidylinositol-5-phosphate binding(GO:0010314) |
| 0.9 | 2.6 | GO:0052810 | 1-phosphatidylinositol-5-kinase activity(GO:0052810) |
| 0.9 | 2.6 | GO:0004782 | sulfinoalanine decarboxylase activity(GO:0004782) |
| 0.9 | 3.4 | GO:0097108 | hedgehog family protein binding(GO:0097108) |
| 0.9 | 3.4 | GO:0016524 | latrotoxin receptor activity(GO:0016524) |
| 0.8 | 3.4 | GO:0071558 | histone demethylase activity (H3-K27 specific)(GO:0071558) |
| 0.8 | 31.3 | GO:0005184 | neuropeptide hormone activity(GO:0005184) |
| 0.8 | 15.9 | GO:0016876 | aminoacyl-tRNA ligase activity(GO:0004812) ligase activity, forming carbon-oxygen bonds(GO:0016875) ligase activity, forming aminoacyl-tRNA and related compounds(GO:0016876) |
| 0.8 | 7.5 | GO:0010385 | double-stranded methylated DNA binding(GO:0010385) |
| 0.8 | 12.4 | GO:0047372 | acylglycerol lipase activity(GO:0047372) |
| 0.8 | 13.2 | GO:0031702 | angiotensin receptor binding(GO:0031701) type 1 angiotensin receptor binding(GO:0031702) |
| 0.8 | 24.3 | GO:0005326 | neurotransmitter transporter activity(GO:0005326) |
| 0.8 | 3.2 | GO:0042132 | fructose 1,6-bisphosphate 1-phosphatase activity(GO:0042132) |
| 0.8 | 4.0 | GO:0034648 | histone demethylase activity (H3-trimethyl-K4 specific)(GO:0034647) histone demethylase activity (H3-dimethyl-K4 specific)(GO:0034648) |
| 0.8 | 11.2 | GO:0045504 | dynein heavy chain binding(GO:0045504) |
| 0.8 | 25.0 | GO:0030676 | Rac guanyl-nucleotide exchange factor activity(GO:0030676) |
| 0.8 | 12.5 | GO:0004028 | 3-chloroallyl aldehyde dehydrogenase activity(GO:0004028) |
| 0.8 | 6.2 | GO:0043426 | MRF binding(GO:0043426) |
| 0.8 | 2.3 | GO:0070538 | oleic acid binding(GO:0070538) |
| 0.8 | 11.3 | GO:0048406 | nerve growth factor binding(GO:0048406) |
| 0.8 | 3.0 | GO:0070095 | fructose-6-phosphate binding(GO:0070095) |
| 0.7 | 15.7 | GO:0004659 | prenyltransferase activity(GO:0004659) |
| 0.7 | 4.5 | GO:0015350 | reduced folate carrier activity(GO:0008518) methotrexate transporter activity(GO:0015350) |
| 0.7 | 2.9 | GO:0098770 | FBXO family protein binding(GO:0098770) |
| 0.7 | 29.3 | GO:0017025 | TBP-class protein binding(GO:0017025) |
| 0.7 | 12.3 | GO:0031996 | thioesterase binding(GO:0031996) |
| 0.7 | 5.1 | GO:0042799 | histone methyltransferase activity (H4-K20 specific)(GO:0042799) |
| 0.7 | 10.7 | GO:0015643 | toxic substance binding(GO:0015643) |
| 0.7 | 13.5 | GO:0015467 | G-protein activated inward rectifier potassium channel activity(GO:0015467) |
| 0.7 | 2.8 | GO:0008467 | [heparan sulfate]-glucosamine 3-sulfotransferase 1 activity(GO:0008467) |
| 0.7 | 9.0 | GO:0031545 | peptidyl-proline 4-dioxygenase activity(GO:0031545) |
| 0.7 | 12.4 | GO:0004089 | carbonate dehydratase activity(GO:0004089) |
| 0.7 | 19.7 | GO:0015248 | sterol transporter activity(GO:0015248) |
| 0.7 | 4.1 | GO:0008479 | queuine tRNA-ribosyltransferase activity(GO:0008479) |
| 0.7 | 10.1 | GO:0008195 | phosphatidate phosphatase activity(GO:0008195) |
| 0.7 | 2.0 | GO:0004711 | ribosomal protein S6 kinase activity(GO:0004711) |
| 0.7 | 6.6 | GO:0004957 | prostaglandin E receptor activity(GO:0004957) |
| 0.7 | 7.9 | GO:0035612 | AP-2 adaptor complex binding(GO:0035612) |
| 0.7 | 9.9 | GO:0005344 | oxygen transporter activity(GO:0005344) |
| 0.7 | 119.1 | GO:0001078 | transcriptional repressor activity, RNA polymerase II core promoter proximal region sequence-specific binding(GO:0001078) |
| 0.6 | 4.5 | GO:0030369 | ICAM-3 receptor activity(GO:0030369) |
| 0.6 | 3.2 | GO:0016635 | oxidoreductase activity, acting on the CH-CH group of donors, quinone or related compound as acceptor(GO:0016635) |
| 0.6 | 10.3 | GO:0030215 | semaphorin receptor binding(GO:0030215) |
| 0.6 | 5.1 | GO:0031821 | G-protein coupled serotonin receptor binding(GO:0031821) |
| 0.6 | 3.1 | GO:0004920 | interleukin-10 receptor activity(GO:0004920) |
| 0.6 | 5.0 | GO:0019763 | immunoglobulin receptor activity(GO:0019763) |
| 0.6 | 15.6 | GO:0000030 | mannosyltransferase activity(GO:0000030) |
| 0.6 | 1.8 | GO:0015181 | arginine transmembrane transporter activity(GO:0015181) |
| 0.6 | 4.8 | GO:0042910 | xenobiotic-transporting ATPase activity(GO:0008559) xenobiotic transporter activity(GO:0042910) |
| 0.6 | 1.8 | GO:1990050 | phosphatidic acid transporter activity(GO:1990050) |
| 0.6 | 32.8 | GO:0030507 | spectrin binding(GO:0030507) |
| 0.6 | 12.2 | GO:0005095 | GTPase inhibitor activity(GO:0005095) |
| 0.6 | 4.6 | GO:0003910 | DNA ligase (ATP) activity(GO:0003910) |
| 0.6 | 12.6 | GO:0008494 | translation activator activity(GO:0008494) |
| 0.6 | 4.0 | GO:0003828 | alpha-N-acetylneuraminate alpha-2,8-sialyltransferase activity(GO:0003828) |
| 0.6 | 6.8 | GO:0005021 | vascular endothelial growth factor-activated receptor activity(GO:0005021) |
| 0.6 | 2.8 | GO:0051120 | hepoxilin A3 synthase activity(GO:0051120) |
| 0.6 | 7.8 | GO:0008253 | 5'-nucleotidase activity(GO:0008253) |
| 0.6 | 6.1 | GO:0005243 | gap junction channel activity(GO:0005243) |
| 0.6 | 21.0 | GO:0071855 | neuropeptide receptor binding(GO:0071855) |
| 0.6 | 47.0 | GO:0005089 | Rho guanyl-nucleotide exchange factor activity(GO:0005089) |
| 0.6 | 1.7 | GO:0032093 | SAM domain binding(GO:0032093) |
| 0.5 | 36.8 | GO:0070412 | R-SMAD binding(GO:0070412) |
| 0.5 | 9.2 | GO:0005314 | high-affinity glutamate transmembrane transporter activity(GO:0005314) |
| 0.5 | 2.6 | GO:0015232 | heme transporter activity(GO:0015232) |
| 0.5 | 12.1 | GO:0032451 | demethylase activity(GO:0032451) |
| 0.5 | 2.6 | GO:0004122 | cystathionine beta-synthase activity(GO:0004122) |
| 0.5 | 5.7 | GO:0001135 | transcription factor activity, RNA polymerase II transcription factor recruiting(GO:0001135) |
| 0.5 | 6.2 | GO:0051184 | cofactor transporter activity(GO:0051184) |
| 0.5 | 12.8 | GO:0004707 | MAP kinase activity(GO:0004707) |
| 0.5 | 4.6 | GO:0015279 | store-operated calcium channel activity(GO:0015279) |
| 0.5 | 9.2 | GO:0004535 | poly(A)-specific ribonuclease activity(GO:0004535) |
| 0.5 | 1.5 | GO:0004878 | complement component C5a receptor activity(GO:0004878) |
| 0.5 | 15.6 | GO:0042162 | telomeric DNA binding(GO:0042162) |
| 0.5 | 5.3 | GO:0019864 | IgG binding(GO:0019864) |
| 0.5 | 196.5 | GO:0001077 | transcriptional activator activity, RNA polymerase II core promoter proximal region sequence-specific binding(GO:0001077) |
| 0.5 | 4.6 | GO:0000982 | transcription factor activity, RNA polymerase II core promoter proximal region sequence-specific binding(GO:0000982) |
| 0.5 | 5.1 | GO:0003720 | telomerase activity(GO:0003720) RNA-directed DNA polymerase activity(GO:0003964) |
| 0.5 | 6.0 | GO:1903136 | cuprous ion binding(GO:1903136) |
| 0.5 | 9.1 | GO:0003708 | retinoic acid receptor activity(GO:0003708) |
| 0.5 | 5.9 | GO:0015250 | water channel activity(GO:0015250) |
| 0.5 | 8.6 | GO:0001614 | G-protein coupled nucleotide receptor activity(GO:0001608) purinergic nucleotide receptor activity(GO:0001614) nucleotide receptor activity(GO:0016502) G-protein coupled purinergic nucleotide receptor activity(GO:0045028) |
| 0.5 | 2.3 | GO:0070051 | fibrinogen binding(GO:0070051) |
| 0.4 | 1.8 | GO:0005151 | interleukin-1, Type II receptor binding(GO:0005151) |
| 0.4 | 41.0 | GO:0042626 | ATPase activity, coupled to transmembrane movement of substances(GO:0042626) |
| 0.4 | 6.4 | GO:0042834 | peptidoglycan binding(GO:0042834) |
| 0.4 | 0.8 | GO:0043208 | glycosphingolipid binding(GO:0043208) |
| 0.4 | 1.7 | GO:0003873 | 6-phosphofructo-2-kinase activity(GO:0003873) |
| 0.4 | 1.7 | GO:0017077 | oxidative phosphorylation uncoupler activity(GO:0017077) |
| 0.4 | 1.2 | GO:0008384 | IkappaB kinase activity(GO:0008384) |
| 0.4 | 126.3 | GO:0005096 | GTPase activator activity(GO:0005096) |
| 0.4 | 2.0 | GO:0005134 | interleukin-2 receptor binding(GO:0005134) |
| 0.4 | 2.3 | GO:0070087 | chromo shadow domain binding(GO:0070087) |
| 0.4 | 26.0 | GO:0035064 | methylated histone binding(GO:0035064) |
| 0.4 | 3.8 | GO:0003997 | acyl-CoA oxidase activity(GO:0003997) |
| 0.4 | 4.5 | GO:0051434 | BH3 domain binding(GO:0051434) |
| 0.4 | 1.9 | GO:0005127 | ciliary neurotrophic factor receptor binding(GO:0005127) |
| 0.4 | 3.0 | GO:0004024 | alcohol dehydrogenase activity, zinc-dependent(GO:0004024) |
| 0.4 | 8.7 | GO:0050321 | tau-protein kinase activity(GO:0050321) |
| 0.4 | 1.8 | GO:0086062 | voltage-gated sodium channel activity involved in Purkinje myocyte action potential(GO:0086062) |
| 0.4 | 3.9 | GO:0097109 | neuroligin family protein binding(GO:0097109) |
| 0.3 | 24.7 | GO:0003730 | mRNA 3'-UTR binding(GO:0003730) |
| 0.3 | 7.6 | GO:0008066 | glutamate receptor activity(GO:0008066) |
| 0.3 | 1.7 | GO:0004994 | somatostatin receptor activity(GO:0004994) |
| 0.3 | 1.0 | GO:0004142 | diacylglycerol cholinephosphotransferase activity(GO:0004142) |
| 0.3 | 3.8 | GO:0017162 | aryl hydrocarbon receptor binding(GO:0017162) |
| 0.3 | 6.4 | GO:0031005 | filamin binding(GO:0031005) |
| 0.3 | 49.7 | GO:0004896 | cytokine receptor activity(GO:0004896) |
| 0.3 | 6.0 | GO:0043274 | phospholipase binding(GO:0043274) |
| 0.3 | 31.7 | GO:0005249 | voltage-gated potassium channel activity(GO:0005249) |
| 0.3 | 7.0 | GO:0008409 | 5'-3' exonuclease activity(GO:0008409) |
| 0.3 | 1.0 | GO:0008534 | oxidized purine nucleobase lesion DNA N-glycosylase activity(GO:0008534) |
| 0.3 | 3.0 | GO:0017154 | semaphorin receptor activity(GO:0017154) |
| 0.3 | 19.4 | GO:0004712 | protein serine/threonine/tyrosine kinase activity(GO:0004712) |
| 0.3 | 2.9 | GO:0022821 | sodium:proton antiporter activity(GO:0015385) potassium:proton antiporter activity(GO:0015386) potassium ion antiporter activity(GO:0022821) |
| 0.3 | 1.0 | GO:0004345 | glucose-6-phosphate dehydrogenase activity(GO:0004345) |
| 0.3 | 14.7 | GO:0008139 | nuclear localization sequence binding(GO:0008139) |
| 0.3 | 11.0 | GO:0030296 | protein tyrosine kinase activator activity(GO:0030296) |
| 0.3 | 2.2 | GO:0046972 | histone acetyltransferase activity (H4-K5 specific)(GO:0043995) histone acetyltransferase activity (H4-K8 specific)(GO:0043996) histone acetyltransferase activity (H4-K16 specific)(GO:0046972) |
| 0.3 | 22.8 | GO:0030165 | PDZ domain binding(GO:0030165) |
| 0.3 | 2.1 | GO:0035259 | glucocorticoid receptor binding(GO:0035259) |
| 0.3 | 4.0 | GO:0042809 | vitamin D receptor binding(GO:0042809) |
| 0.3 | 1.2 | GO:0032450 | maltose alpha-glucosidase activity(GO:0032450) |
| 0.3 | 3.3 | GO:0004523 | RNA-DNA hybrid ribonuclease activity(GO:0004523) |
| 0.3 | 3.0 | GO:0016286 | small conductance calcium-activated potassium channel activity(GO:0016286) |
| 0.3 | 8.1 | GO:0003887 | DNA-directed DNA polymerase activity(GO:0003887) |
| 0.3 | 1.8 | GO:0044213 | intronic transcription regulatory region sequence-specific DNA binding(GO:0001161) intronic transcription regulatory region DNA binding(GO:0044213) |
| 0.3 | 1.5 | GO:0042289 | MHC class II protein binding(GO:0042289) |
| 0.3 | 1.2 | GO:0005471 | ATP:ADP antiporter activity(GO:0005471) adenine transmembrane transporter activity(GO:0015207) |
| 0.3 | 0.6 | GO:1990763 | arrestin family protein binding(GO:1990763) |
| 0.3 | 13.2 | GO:0004115 | 3',5'-cyclic-AMP phosphodiesterase activity(GO:0004115) |
| 0.3 | 3.4 | GO:0017017 | MAP kinase tyrosine/serine/threonine phosphatase activity(GO:0017017) |
| 0.3 | 0.6 | GO:0005124 | scavenger receptor binding(GO:0005124) |
| 0.3 | 2.2 | GO:0034235 | GPI anchor binding(GO:0034235) |
| 0.3 | 5.0 | GO:0032266 | phosphatidylinositol-3-phosphate binding(GO:0032266) |
| 0.3 | 6.1 | GO:0052629 | phosphatidylinositol-3,5-bisphosphate 3-phosphatase activity(GO:0052629) |
| 0.3 | 1.1 | GO:0030976 | thiamine pyrophosphate binding(GO:0030976) |
| 0.3 | 8.4 | GO:0004198 | calcium-dependent cysteine-type endopeptidase activity(GO:0004198) |
| 0.3 | 1.3 | GO:0016901 | glycerol-3-phosphate dehydrogenase activity(GO:0004368) oxidoreductase activity, acting on the CH-OH group of donors, quinone or similar compound as acceptor(GO:0016901) |
| 0.3 | 8.9 | GO:0008157 | protein phosphatase 1 binding(GO:0008157) |
| 0.3 | 3.3 | GO:0043325 | phosphatidylinositol-3,4-bisphosphate binding(GO:0043325) |
| 0.3 | 3.3 | GO:0008140 | cAMP response element binding protein binding(GO:0008140) |
| 0.3 | 1.5 | GO:0047894 | flavonol 3-sulfotransferase activity(GO:0047894) |
| 0.2 | 4.7 | GO:0050811 | GABA receptor binding(GO:0050811) |
| 0.2 | 15.6 | GO:0001540 | beta-amyloid binding(GO:0001540) |
| 0.2 | 1.4 | GO:0030172 | troponin C binding(GO:0030172) |
| 0.2 | 0.9 | GO:0022865 | transmembrane electron transfer carrier(GO:0022865) |
| 0.2 | 2.6 | GO:0042923 | neuropeptide binding(GO:0042923) |
| 0.2 | 1.6 | GO:0000182 | rDNA binding(GO:0000182) |
| 0.2 | 25.5 | GO:0005262 | calcium channel activity(GO:0005262) |
| 0.2 | 1.5 | GO:0004499 | N,N-dimethylaniline monooxygenase activity(GO:0004499) |
| 0.2 | 2.1 | GO:0047498 | calcium-dependent phospholipase A2 activity(GO:0047498) |
| 0.2 | 2.8 | GO:0015125 | bile acid transmembrane transporter activity(GO:0015125) |
| 0.2 | 3.9 | GO:0008175 | tRNA methyltransferase activity(GO:0008175) |
| 0.2 | 1.5 | GO:0003696 | satellite DNA binding(GO:0003696) centromeric DNA binding(GO:0019237) |
| 0.2 | 2.1 | GO:0004383 | guanylate cyclase activity(GO:0004383) |
| 0.2 | 5.7 | GO:0043539 | protein serine/threonine kinase activator activity(GO:0043539) |
| 0.2 | 2.4 | GO:0036374 | glutathione hydrolase activity(GO:0036374) |
| 0.2 | 6.0 | GO:0003950 | NAD+ ADP-ribosyltransferase activity(GO:0003950) |
| 0.2 | 0.9 | GO:0070740 | protein-glutamic acid ligase activity(GO:0070739) tubulin-glutamic acid ligase activity(GO:0070740) |
| 0.2 | 2.1 | GO:0003996 | acyl-CoA ligase activity(GO:0003996) |
| 0.2 | 1.2 | GO:1990381 | ubiquitin-specific protease binding(GO:1990381) |
| 0.2 | 9.7 | GO:0004402 | histone acetyltransferase activity(GO:0004402) |
| 0.2 | 2.1 | GO:0071837 | HMG box domain binding(GO:0071837) |
| 0.2 | 3.1 | GO:0045295 | gamma-catenin binding(GO:0045295) |
| 0.2 | 4.1 | GO:0005521 | lamin binding(GO:0005521) |
| 0.2 | 3.8 | GO:0008188 | neuropeptide receptor activity(GO:0008188) |
| 0.2 | 3.6 | GO:0070577 | lysine-acetylated histone binding(GO:0070577) |
| 0.2 | 1.8 | GO:0004029 | aldehyde dehydrogenase (NAD) activity(GO:0004029) |
| 0.2 | 1.8 | GO:0034452 | dynactin binding(GO:0034452) |
| 0.2 | 12.5 | GO:0005254 | chloride channel activity(GO:0005254) |
| 0.2 | 23.5 | GO:0008234 | cysteine-type peptidase activity(GO:0008234) |
| 0.1 | 3.4 | GO:0030742 | GTP-dependent protein binding(GO:0030742) |
| 0.1 | 1.3 | GO:0008597 | calcium-dependent protein serine/threonine phosphatase regulator activity(GO:0008597) |
| 0.1 | 1.0 | GO:0004849 | uridine kinase activity(GO:0004849) |
| 0.1 | 34.7 | GO:0061659 | ubiquitin-like protein ligase activity(GO:0061659) |
| 0.1 | 1.0 | GO:0008079 | translation release factor activity(GO:0003747) translation termination factor activity(GO:0008079) |
| 0.1 | 1.2 | GO:0005005 | transmembrane-ephrin receptor activity(GO:0005005) |
| 0.1 | 0.6 | GO:0002151 | G-quadruplex RNA binding(GO:0002151) |
| 0.1 | 0.6 | GO:0042954 | lipoprotein transporter activity(GO:0042954) |
| 0.1 | 9.0 | GO:0019905 | syntaxin binding(GO:0019905) |
| 0.1 | 2.6 | GO:0019707 | protein-cysteine S-palmitoyltransferase activity(GO:0019706) protein-cysteine S-acyltransferase activity(GO:0019707) |
| 0.1 | 24.0 | GO:0005085 | guanyl-nucleotide exchange factor activity(GO:0005085) |
| 0.1 | 1.6 | GO:0000014 | single-stranded DNA endodeoxyribonuclease activity(GO:0000014) |
| 0.1 | 1.4 | GO:0043425 | bHLH transcription factor binding(GO:0043425) |
| 0.1 | 5.8 | GO:0042169 | SH2 domain binding(GO:0042169) |
| 0.1 | 1.1 | GO:0070569 | uridylyltransferase activity(GO:0070569) |
| 0.1 | 4.1 | GO:0008138 | protein tyrosine/serine/threonine phosphatase activity(GO:0008138) |
| 0.1 | 1.3 | GO:0035035 | histone acetyltransferase binding(GO:0035035) |
| 0.1 | 2.9 | GO:0001784 | phosphotyrosine binding(GO:0001784) |
| 0.1 | 3.0 | GO:0017080 | sodium channel regulator activity(GO:0017080) |
| 0.1 | 17.7 | GO:0005516 | calmodulin binding(GO:0005516) |
| 0.1 | 0.7 | GO:0010997 | anaphase-promoting complex binding(GO:0010997) |
| 0.1 | 4.1 | GO:0015020 | glucuronosyltransferase activity(GO:0015020) |
| 0.1 | 1.7 | GO:0031683 | G-protein beta/gamma-subunit complex binding(GO:0031683) |
| 0.1 | 0.7 | GO:0043422 | protein kinase B binding(GO:0043422) |
| 0.1 | 19.7 | GO:0004842 | ubiquitin-protein transferase activity(GO:0004842) |
| 0.1 | 0.7 | GO:0042975 | peroxisome proliferator activated receptor binding(GO:0042975) |
| 0.1 | 0.9 | GO:0030883 | lipid antigen binding(GO:0030882) endogenous lipid antigen binding(GO:0030883) exogenous lipid antigen binding(GO:0030884) |
| 0.1 | 2.0 | GO:0003951 | NAD+ kinase activity(GO:0003951) |
| 0.1 | 6.1 | GO:0043130 | ubiquitin binding(GO:0043130) |
| 0.1 | 22.5 | GO:0008017 | microtubule binding(GO:0008017) |
| 0.1 | 3.9 | GO:0001190 | transcriptional activator activity, RNA polymerase II transcription factor binding(GO:0001190) transcriptional repressor activity, RNA polymerase II activating transcription factor binding(GO:0098811) |
| 0.1 | 0.8 | GO:0005375 | copper ion transmembrane transporter activity(GO:0005375) |
| 0.1 | 0.3 | GO:0098918 | structural constituent of synapse(GO:0098918) structural constituent of postsynaptic actin cytoskeleton(GO:0098973) |
| 0.1 | 0.4 | GO:0001594 | trace-amine receptor activity(GO:0001594) |
| 0.1 | 1.3 | GO:0008198 | ferrous iron binding(GO:0008198) |
| 0.1 | 2.0 | GO:0030331 | estrogen receptor binding(GO:0030331) |
| 0.1 | 7.0 | GO:0004222 | metalloendopeptidase activity(GO:0004222) |
| 0.1 | 5.3 | GO:0004497 | monooxygenase activity(GO:0004497) |
| 0.1 | 1.2 | GO:0008080 | N-acetyltransferase activity(GO:0008080) |
| 0.1 | 0.6 | GO:0016813 | hydrolase activity, acting on carbon-nitrogen (but not peptide) bonds, in linear amidines(GO:0016813) |
| 0.1 | 0.4 | GO:0038132 | neuregulin binding(GO:0038132) |
| 0.1 | 0.9 | GO:0031957 | very long-chain fatty acid-CoA ligase activity(GO:0031957) |
| 0.1 | 1.1 | GO:0015347 | sodium-independent organic anion transmembrane transporter activity(GO:0015347) |
| 0.0 | 0.1 | GO:0004977 | melanocortin receptor activity(GO:0004977) |
| 0.0 | 0.8 | GO:0000062 | fatty-acyl-CoA binding(GO:0000062) |
| 0.0 | 0.3 | GO:0004594 | pantothenate kinase activity(GO:0004594) |
| 0.0 | 4.3 | GO:0005057 | receptor signaling protein activity(GO:0005057) |
| 0.0 | 0.5 | GO:0015280 | ligand-gated sodium channel activity(GO:0015280) |
| 0.0 | 1.8 | GO:0050660 | flavin adenine dinucleotide binding(GO:0050660) |
| 0.0 | 0.1 | GO:0005547 | phosphatidylinositol-3,4,5-trisphosphate binding(GO:0005547) |
| 0.0 | 0.7 | GO:0051539 | 4 iron, 4 sulfur cluster binding(GO:0051539) |
| 0.0 | 0.1 | GO:0005000 | vasopressin receptor activity(GO:0005000) |
| 0.0 | 0.1 | GO:0004035 | alkaline phosphatase activity(GO:0004035) |
| 0.0 | 0.6 | GO:0034987 | immunoglobulin receptor binding(GO:0034987) |
Gene overrepresentation in curated gene sets: canonical pathways category:
| Log-likelihood per target | Total log-likelihood | Term | Description |
|---|---|---|---|
| 3.2 | 15.9 | PID WNT CANONICAL PATHWAY | Canonical Wnt signaling pathway |
| 2.6 | 110.8 | ST WNT CA2 CYCLIC GMP PATHWAY | Wnt/Ca2+/cyclic GMP signaling. |
| 2.3 | 132.1 | PID REELIN PATHWAY | Reelin signaling pathway |
| 1.3 | 29.5 | PID CONE PATHWAY | Visual signal transduction: Cones |
| 1.3 | 72.2 | PID AURORA A PATHWAY | Aurora A signaling |
| 1.3 | 52.9 | PID PRL SIGNALING EVENTS PATHWAY | Signaling events mediated by PRL |
| 1.3 | 12.6 | PID THROMBIN PAR4 PATHWAY | PAR4-mediated thrombin signaling events |
| 1.2 | 51.1 | PID UPA UPAR PATHWAY | Urokinase-type plasminogen activator (uPA) and uPAR-mediated signaling |
| 1.2 | 37.6 | PID BETA CATENIN DEG PATHWAY | Degradation of beta catenin |
| 1.1 | 64.8 | PID ARF6 PATHWAY | Arf6 signaling events |
| 1.1 | 11.9 | ST G ALPHA S PATHWAY | G alpha s Pathway |
| 1.0 | 21.6 | PID LPA4 PATHWAY | LPA4-mediated signaling events |
| 1.0 | 43.0 | PID MET PATHWAY | Signaling events mediated by Hepatocyte Growth Factor Receptor (c-Met) |
| 1.0 | 21.1 | SA PROGRAMMED CELL DEATH | Programmed cell death, or apoptosis, eliminates damaged or unneeded cells. |
| 0.9 | 17.1 | PID IL5 PATHWAY | IL5-mediated signaling events |
| 0.8 | 4.9 | SA TRKA RECEPTOR | The TrkA receptor binds nerve growth factor to activate MAP kinase pathways and promote cell growth. |
| 0.8 | 28.7 | ST MYOCYTE AD PATHWAY | Myocyte Adrenergic Pathway is a specific case of the generalized Adrenergic Pathway. |
| 0.8 | 55.4 | SIG PIP3 SIGNALING IN CARDIAC MYOCTES | Genes related to PIP3 signaling in cardiac myocytes |
| 0.8 | 12.1 | ST GAQ PATHWAY | G alpha q Pathway |
| 0.8 | 18.1 | SA B CELL RECEPTOR COMPLEXES | Antigen binding to B cell receptors activates protein tyrosine kinases, such as the Src family, which ultimate activate MAP kinases. |
| 0.8 | 38.7 | SIG CD40PATHWAYMAP | Genes related to CD40 signaling |
| 0.7 | 36.5 | ST T CELL SIGNAL TRANSDUCTION | T Cell Signal Transduction |
| 0.7 | 87.3 | PID AR PATHWAY | Coregulation of Androgen receptor activity |
| 0.7 | 43.4 | PID BMP PATHWAY | BMP receptor signaling |
| 0.6 | 6.4 | PID PI3K PLC TRK PATHWAY | Trk receptor signaling mediated by PI3K and PLC-gamma |
| 0.5 | 10.5 | PID AP1 PATHWAY | AP-1 transcription factor network |
| 0.5 | 16.3 | PID SYNDECAN 2 PATHWAY | Syndecan-2-mediated signaling events |
| 0.5 | 5.0 | PID ATF2 PATHWAY | ATF-2 transcription factor network |
| 0.4 | 20.9 | PID FANCONI PATHWAY | Fanconi anemia pathway |
| 0.4 | 11.1 | PID ERB GENOMIC PATHWAY | Validated nuclear estrogen receptor beta network |
| 0.4 | 5.4 | PID ALK1 PATHWAY | ALK1 signaling events |
| 0.4 | 5.5 | PID S1P S1P2 PATHWAY | S1P2 pathway |
| 0.4 | 11.5 | PID IL27 PATHWAY | IL27-mediated signaling events |
| 0.3 | 18.9 | PID AR TF PATHWAY | Regulation of Androgen receptor activity |
| 0.3 | 4.1 | PID PI3KCI PATHWAY | Class I PI3K signaling events |
| 0.3 | 19.5 | PID HES HEY PATHWAY | Notch-mediated HES/HEY network |
| 0.3 | 1.7 | ST TYPE I INTERFERON PATHWAY | Type I Interferon (alpha/beta IFN) Pathway |
| 0.3 | 6.2 | PID NETRIN PATHWAY | Netrin-mediated signaling events |
| 0.3 | 15.5 | PID CXCR4 PATHWAY | CXCR4-mediated signaling events |
| 0.3 | 3.6 | PID RANBP2 PATHWAY | Sumoylation by RanBP2 regulates transcriptional repression |
| 0.3 | 1.5 | PID PI3KCI AKT PATHWAY | Class I PI3K signaling events mediated by Akt |
| 0.3 | 14.5 | PID PLK1 PATHWAY | PLK1 signaling events |
| 0.2 | 9.9 | PID FCER1 PATHWAY | Fc-epsilon receptor I signaling in mast cells |
| 0.2 | 17.1 | PID RHOA REG PATHWAY | Regulation of RhoA activity |
| 0.2 | 3.0 | PID CIRCADIAN PATHWAY | Circadian rhythm pathway |
| 0.2 | 4.0 | PID HEDGEHOG 2PATHWAY | Signaling events mediated by the Hedgehog family |
| 0.2 | 5.9 | PID ALPHA SYNUCLEIN PATHWAY | Alpha-synuclein signaling |
| 0.2 | 11.1 | PID TRKR PATHWAY | Neurotrophic factor-mediated Trk receptor signaling |
| 0.2 | 5.9 | SA MMP CYTOKINE CONNECTION | Cytokines can induce activation of matrix metalloproteinases, which degrade extracellular matrix. |
| 0.2 | 2.4 | PID P38 ALPHA BETA PATHWAY | Regulation of p38-alpha and p38-beta |
| 0.2 | 3.1 | PID SYNDECAN 3 PATHWAY | Syndecan-3-mediated signaling events |
| 0.2 | 1.8 | PID EPHA FWDPATHWAY | EPHA forward signaling |
| 0.2 | 5.9 | PID RXR VDR PATHWAY | RXR and RAR heterodimerization with other nuclear receptor |
| 0.1 | 1.6 | ST GA12 PATHWAY | G alpha 12 Pathway |
| 0.1 | 6.1 | PID RAC1 REG PATHWAY | Regulation of RAC1 activity |
| 0.1 | 1.5 | PID TNF PATHWAY | TNF receptor signaling pathway |
| 0.1 | 2.1 | PID HIF1A PATHWAY | Hypoxic and oxygen homeostasis regulation of HIF-1-alpha |
| 0.1 | 6.1 | PID FGF PATHWAY | FGF signaling pathway |
| 0.1 | 7.1 | PID HNF3B PATHWAY | FOXA2 and FOXA3 transcription factor networks |
| 0.1 | 0.3 | PID S1P S1P3 PATHWAY | S1P3 pathway |
| 0.1 | 4.0 | PID CERAMIDE PATHWAY | Ceramide signaling pathway |
| 0.1 | 2.5 | PID EPHB FWD PATHWAY | EPHB forward signaling |
| 0.1 | 2.9 | PID TCR PATHWAY | TCR signaling in naïve CD4+ T cells |
| 0.1 | 3.4 | PID REG GR PATHWAY | Glucocorticoid receptor regulatory network |
| 0.1 | 3.3 | PID FRA PATHWAY | Validated transcriptional targets of AP1 family members Fra1 and Fra2 |
| 0.1 | 3.4 | PID TCR CALCIUM PATHWAY | Calcium signaling in the CD4+ TCR pathway |
| 0.1 | 1.9 | PID IL2 1PATHWAY | IL2-mediated signaling events |
| 0.1 | 1.0 | PID ANTHRAX PATHWAY | Cellular roles of Anthrax toxin |
| 0.1 | 0.9 | ST DIFFERENTIATION PATHWAY IN PC12 CELLS | Differentiation Pathway in PC12 Cells; this is a specific case of PAC1 Receptor Pathway. |
| 0.1 | 6.9 | PID MYC REPRESS PATHWAY | Validated targets of C-MYC transcriptional repression |
| 0.1 | 1.4 | PID ANGIOPOIETIN RECEPTOR PATHWAY | Angiopoietin receptor Tie2-mediated signaling |
| 0.1 | 3.5 | PID ERA GENOMIC PATHWAY | Validated nuclear estrogen receptor alpha network |
| 0.0 | 0.3 | PID ARF6 DOWNSTREAM PATHWAY | Arf6 downstream pathway |
| 0.0 | 0.6 | PID BCR 5PATHWAY | BCR signaling pathway |
| 0.0 | 1.0 | PID INTEGRIN A9B1 PATHWAY | Alpha9 beta1 integrin signaling events |
| 0.0 | 1.5 | NABA COLLAGENS | Genes encoding collagen proteins |
| 0.0 | 0.3 | PID INSULIN PATHWAY | Insulin Pathway |
Gene overrepresentation in curated gene sets: REACTOME pathways category:
| Log-likelihood per target | Total log-likelihood | Term | Description |
|---|---|---|---|
| 5.9 | 100.6 | REACTOME REGULATION OF PYRUVATE DEHYDROGENASE PDH COMPLEX | Genes involved in Regulation of pyruvate dehydrogenase (PDH) complex |
| 4.4 | 141.7 | REACTOME UNBLOCKING OF NMDA RECEPTOR GLUTAMATE BINDING AND ACTIVATION | Genes involved in Unblocking of NMDA receptor, glutamate binding and activation |
| 3.0 | 68.4 | REACTOME ABCA TRANSPORTERS IN LIPID HOMEOSTASIS | Genes involved in ABCA transporters in lipid homeostasis |
| 2.6 | 34.0 | REACTOME THE ACTIVATION OF ARYLSULFATASES | Genes involved in The activation of arylsulfatases |
| 2.3 | 53.3 | REACTOME ACYL CHAIN REMODELLING OF PE | Genes involved in Acyl chain remodelling of PE |
| 1.9 | 40.6 | REACTOME FACILITATIVE NA INDEPENDENT GLUCOSE TRANSPORTERS | Genes involved in Facilitative Na+-independent glucose transporters |
| 1.9 | 38.9 | REACTOME DSCAM INTERACTIONS | Genes involved in DSCAM interactions |
| 1.8 | 133.7 | REACTOME METABOLISM OF VITAMINS AND COFACTORS | Genes involved in Metabolism of vitamins and cofactors |
| 1.7 | 13.2 | REACTOME THROMBOXANE SIGNALLING THROUGH TP RECEPTOR | Genes involved in Thromboxane signalling through TP receptor |
| 1.5 | 28.1 | REACTOME INITIAL TRIGGERING OF COMPLEMENT | Genes involved in Initial triggering of complement |
| 1.4 | 27.1 | REACTOME REGULATION OF RHEB GTPASE ACTIVITY BY AMPK | Genes involved in Regulation of Rheb GTPase activity by AMPK |
| 1.3 | 30.4 | REACTOME TERMINATION OF O GLYCAN BIOSYNTHESIS | Genes involved in Termination of O-glycan biosynthesis |
| 1.3 | 17.0 | REACTOME E2F ENABLED INHIBITION OF PRE REPLICATION COMPLEX FORMATION | Genes involved in E2F-enabled inhibition of pre-replication complex formation |
| 1.3 | 6.3 | REACTOME SIGNALING BY FGFR IN DISEASE | Genes involved in Signaling by FGFR in disease |
| 1.2 | 34.4 | REACTOME CRMPS IN SEMA3A SIGNALING | Genes involved in CRMPs in Sema3A signaling |
| 1.1 | 58.4 | REACTOME MEIOTIC SYNAPSIS | Genes involved in Meiotic Synapsis |
| 1.1 | 22.8 | REACTOME IL 7 SIGNALING | Genes involved in Interleukin-7 signaling |
| 1.1 | 17.2 | REACTOME SYNTHESIS OF PE | Genes involved in Synthesis of PE |
| 1.0 | 16.5 | REACTOME SYNTHESIS OF SUBSTRATES IN N GLYCAN BIOSYTHESIS | Genes involved in Synthesis of substrates in N-glycan biosythesis |
| 1.0 | 20.2 | REACTOME ABC FAMILY PROTEINS MEDIATED TRANSPORT | Genes involved in ABC-family proteins mediated transport |
| 1.0 | 15.9 | REACTOME MITOCHONDRIAL TRNA AMINOACYLATION | Genes involved in Mitochondrial tRNA aminoacylation |
| 1.0 | 17.6 | REACTOME GAP JUNCTION ASSEMBLY | Genes involved in Gap junction assembly |
| 1.0 | 41.1 | REACTOME GENERATION OF SECOND MESSENGER MOLECULES | Genes involved in Generation of second messenger molecules |
| 0.9 | 15.1 | REACTOME THROMBIN SIGNALLING THROUGH PROTEINASE ACTIVATED RECEPTORS PARS | Genes involved in Thrombin signalling through proteinase activated receptors (PARs) |
| 0.9 | 228.2 | REACTOME G ALPHA I SIGNALLING EVENTS | Genes involved in G alpha (i) signalling events |
| 0.9 | 34.1 | REACTOME RAP1 SIGNALLING | Genes involved in Rap1 signalling |
| 0.9 | 4.3 | REACTOME REGULATION OF WATER BALANCE BY RENAL AQUAPORINS | Genes involved in Regulation of Water Balance by Renal Aquaporins |
| 0.8 | 48.7 | REACTOME VOLTAGE GATED POTASSIUM CHANNELS | Genes involved in Voltage gated Potassium channels |
| 0.8 | 73.5 | REACTOME PEPTIDE LIGAND BINDING RECEPTORS | Genes involved in Peptide ligand-binding receptors |
| 0.8 | 21.3 | REACTOME SIGNALING BY HIPPO | Genes involved in Signaling by Hippo |
| 0.8 | 18.0 | REACTOME ACTIVATION OF IRF3 IRF7 MEDIATED BY TBK1 IKK EPSILON | Genes involved in Activation of IRF3/IRF7 mediated by TBK1/IKK epsilon |
| 0.8 | 13.6 | REACTOME FANCONI ANEMIA PATHWAY | Genes involved in Fanconi Anemia pathway |
| 0.8 | 12.4 | REACTOME REVERSIBLE HYDRATION OF CARBON DIOXIDE | Genes involved in Reversible Hydration of Carbon Dioxide |
| 0.8 | 10.7 | REACTOME CLASS C 3 METABOTROPIC GLUTAMATE PHEROMONE RECEPTORS | Genes involved in Class C/3 (Metabotropic glutamate/pheromone receptors) |
| 0.7 | 11.9 | REACTOME BILE SALT AND ORGANIC ANION SLC TRANSPORTERS | Genes involved in Bile salt and organic anion SLC transporters |
| 0.7 | 13.5 | REACTOME INHIBITION OF VOLTAGE GATED CA2 CHANNELS VIA GBETA GAMMA SUBUNITS | Genes involved in Inhibition of voltage gated Ca2+ channels via Gbeta/gamma subunits |
| 0.6 | 14.6 | REACTOME OTHER SEMAPHORIN INTERACTIONS | Genes involved in Other semaphorin interactions |
| 0.6 | 8.6 | REACTOME P2Y RECEPTORS | Genes involved in P2Y receptors |
| 0.6 | 8.3 | REACTOME BIOSYNTHESIS OF THE N GLYCAN PRECURSOR DOLICHOL LIPID LINKED OLIGOSACCHARIDE LLO AND TRANSFER TO A NASCENT PROTEIN | Genes involved in Biosynthesis of the N-glycan precursor (dolichol lipid-linked oligosaccharide, LLO) and transfer to a nascent protein |
| 0.6 | 10.5 | REACTOME ACTIVATION OF BH3 ONLY PROTEINS | Genes involved in Activation of BH3-only proteins |
| 0.6 | 8.7 | REACTOME PYRIMIDINE CATABOLISM | Genes involved in Pyrimidine catabolism |
| 0.6 | 84.1 | REACTOME TRANSPORT OF INORGANIC CATIONS ANIONS AND AMINO ACIDS OLIGOPEPTIDES | Genes involved in Transport of inorganic cations/anions and amino acids/oligopeptides |
| 0.6 | 11.3 | REACTOME AKT PHOSPHORYLATES TARGETS IN THE CYTOSOL | Genes involved in AKT phosphorylates targets in the cytosol |
| 0.5 | 3.6 | REACTOME PROSTANOID LIGAND RECEPTORS | Genes involved in Prostanoid ligand receptors |
| 0.5 | 11.1 | REACTOME HYALURONAN UPTAKE AND DEGRADATION | Genes involved in Hyaluronan uptake and degradation |
| 0.5 | 8.3 | REACTOME SYNTHESIS OF PIPS AT THE GOLGI MEMBRANE | Genes involved in Synthesis of PIPs at the Golgi membrane |
| 0.5 | 11.1 | REACTOME HIGHLY CALCIUM PERMEABLE POSTSYNAPTIC NICOTINIC ACETYLCHOLINE RECEPTORS | Genes involved in Highly calcium permeable postsynaptic nicotinic acetylcholine receptors |
| 0.5 | 2.8 | REACTOME RIG I MDA5 MEDIATED INDUCTION OF IFN ALPHA BETA PATHWAYS | Genes involved in RIG-I/MDA5 mediated induction of IFN-alpha/beta pathways |
| 0.5 | 5.9 | REACTOME PASSIVE TRANSPORT BY AQUAPORINS | Genes involved in Passive Transport by Aquaporins |
| 0.4 | 21.0 | REACTOME REGULATION OF BETA CELL DEVELOPMENT | Genes involved in Regulation of beta-cell development |
| 0.4 | 12.3 | REACTOME PTM GAMMA CARBOXYLATION HYPUSINE FORMATION AND ARYLSULFATASE ACTIVATION | Genes involved in PTM: gamma carboxylation, hypusine formation and arylsulfatase activation |
| 0.4 | 5.7 | REACTOME TGF BETA RECEPTOR SIGNALING IN EMT EPITHELIAL TO MESENCHYMAL TRANSITION | Genes involved in TGF-beta receptor signaling in EMT (epithelial to mesenchymal transition) |
| 0.4 | 6.0 | REACTOME ACTIVATION OF CHAPERONE GENES BY ATF6 ALPHA | Genes involved in Activation of Chaperone Genes by ATF6-alpha |
| 0.4 | 20.8 | REACTOME BMAL1 CLOCK NPAS2 ACTIVATES CIRCADIAN EXPRESSION | Genes involved in BMAL1:CLOCK/NPAS2 Activates Circadian Expression |
| 0.4 | 18.4 | REACTOME PRE NOTCH EXPRESSION AND PROCESSING | Genes involved in Pre-NOTCH Expression and Processing |
| 0.4 | 32.4 | REACTOME G ALPHA1213 SIGNALLING EVENTS | Genes involved in G alpha (12/13) signalling events |
| 0.4 | 6.1 | REACTOME SYNTHESIS OF PIPS AT THE LATE ENDOSOME MEMBRANE | Genes involved in Synthesis of PIPs at the late endosome membrane |
| 0.4 | 1.8 | REACTOME SYNTHESIS SECRETION AND DEACYLATION OF GHRELIN | Genes involved in Synthesis, Secretion, and Deacylation of Ghrelin |
| 0.4 | 12.8 | REACTOME EFFECTS OF PIP2 HYDROLYSIS | Genes involved in Effects of PIP2 hydrolysis |
| 0.4 | 9.5 | REACTOME AMINE COMPOUND SLC TRANSPORTERS | Genes involved in Amine compound SLC transporters |
| 0.3 | 13.3 | REACTOME ERK MAPK TARGETS | Genes involved in ERK/MAPK targets |
| 0.3 | 1.7 | REACTOME ADENYLATE CYCLASE INHIBITORY PATHWAY | Genes involved in Adenylate cyclase inhibitory pathway |
| 0.3 | 1.6 | REACTOME NGF SIGNALLING VIA TRKA FROM THE PLASMA MEMBRANE | Genes involved in NGF signalling via TRKA from the plasma membrane |
| 0.3 | 62.7 | REACTOME TRANSCRIPTION | Genes involved in Transcription |
| 0.3 | 26.4 | REACTOME NUCLEAR RECEPTOR TRANSCRIPTION PATHWAY | Genes involved in Nuclear Receptor transcription pathway |
| 0.3 | 14.0 | REACTOME ION TRANSPORT BY P TYPE ATPASES | Genes involved in Ion transport by P-type ATPases |
| 0.3 | 4.3 | REACTOME MEIOSIS | Genes involved in Meiosis |
| 0.3 | 4.5 | REACTOME ACTIVATION OF THE AP1 FAMILY OF TRANSCRIPTION FACTORS | Genes involved in Activation of the AP-1 family of transcription factors |
| 0.3 | 3.0 | REACTOME ETHANOL OXIDATION | Genes involved in Ethanol oxidation |
| 0.3 | 10.0 | REACTOME THE ROLE OF NEF IN HIV1 REPLICATION AND DISEASE PATHOGENESIS | Genes involved in The role of Nef in HIV-1 replication and disease pathogenesis |
| 0.2 | 9.0 | REACTOME CLASS B 2 SECRETIN FAMILY RECEPTORS | Genes involved in Class B/2 (Secretin family receptors) |
| 0.2 | 3.4 | REACTOME NRIF SIGNALS CELL DEATH FROM THE NUCLEUS | Genes involved in NRIF signals cell death from the nucleus |
| 0.2 | 1.2 | REACTOME IKK COMPLEX RECRUITMENT MEDIATED BY RIP1 | Genes involved in IKK complex recruitment mediated by RIP1 |
| 0.2 | 2.6 | REACTOME TRAFFICKING AND PROCESSING OF ENDOSOMAL TLR | Genes involved in Trafficking and processing of endosomal TLR |
| 0.2 | 6.0 | REACTOME CITRIC ACID CYCLE TCA CYCLE | Genes involved in Citric acid cycle (TCA cycle) |
| 0.2 | 5.8 | REACTOME SEMA4D IN SEMAPHORIN SIGNALING | Genes involved in Sema4D in semaphorin signaling |
| 0.2 | 4.2 | REACTOME CYCLIN A B1 ASSOCIATED EVENTS DURING G2 M TRANSITION | Genes involved in Cyclin A/B1 associated events during G2/M transition |
| 0.2 | 6.4 | REACTOME TRAFFICKING OF AMPA RECEPTORS | Genes involved in Trafficking of AMPA receptors |
| 0.2 | 6.4 | REACTOME SYNTHESIS OF PIPS AT THE PLASMA MEMBRANE | Genes involved in Synthesis of PIPs at the plasma membrane |
| 0.2 | 4.7 | REACTOME PI3K AKT ACTIVATION | Genes involved in PI3K/AKT activation |
| 0.2 | 4.9 | REACTOME KINESINS | Genes involved in Kinesins |
| 0.2 | 0.3 | REACTOME CDC6 ASSOCIATION WITH THE ORC ORIGIN COMPLEX | Genes involved in CDC6 association with the ORC:origin complex |
| 0.2 | 1.2 | REACTOME TANDEM PORE DOMAIN POTASSIUM CHANNELS | Genes involved in Tandem pore domain potassium channels |
| 0.2 | 2.0 | REACTOME SIGNAL TRANSDUCTION BY L1 | Genes involved in Signal transduction by L1 |
| 0.2 | 6.2 | REACTOME ASSOCIATION OF TRIC CCT WITH TARGET PROTEINS DURING BIOSYNTHESIS | Genes involved in Association of TriC/CCT with target proteins during biosynthesis |
| 0.2 | 3.7 | REACTOME INSULIN SYNTHESIS AND PROCESSING | Genes involved in Insulin Synthesis and Processing |
| 0.1 | 17.7 | REACTOME G ALPHA S SIGNALLING EVENTS | Genes involved in G alpha (s) signalling events |
| 0.1 | 1.0 | REACTOME BETA DEFENSINS | Genes involved in Beta defensins |
| 0.1 | 4.3 | REACTOME POTASSIUM CHANNELS | Genes involved in Potassium Channels |
| 0.1 | 5.5 | REACTOME INTERACTION BETWEEN L1 AND ANKYRINS | Genes involved in Interaction between L1 and Ankyrins |
| 0.1 | 2.9 | REACTOME CTNNB1 PHOSPHORYLATION CASCADE | Genes involved in Beta-catenin phosphorylation cascade |
| 0.1 | 14.1 | REACTOME PPARA ACTIVATES GENE EXPRESSION | Genes involved in PPARA Activates Gene Expression |
| 0.1 | 2.6 | REACTOME NITRIC OXIDE STIMULATES GUANYLATE CYCLASE | Genes involved in Nitric oxide stimulates guanylate cyclase |
| 0.1 | 2.1 | REACTOME OXYGEN DEPENDENT PROLINE HYDROXYLATION OF HYPOXIA INDUCIBLE FACTOR ALPHA | Genes involved in Oxygen-dependent Proline Hydroxylation of Hypoxia-inducible Factor Alpha |
| 0.1 | 4.5 | REACTOME SMAD2 SMAD3 SMAD4 HETEROTRIMER REGULATES TRANSCRIPTION | Genes involved in SMAD2/SMAD3:SMAD4 heterotrimer regulates transcription |
| 0.1 | 2.3 | REACTOME P130CAS LINKAGE TO MAPK SIGNALING FOR INTEGRINS | Genes involved in p130Cas linkage to MAPK signaling for integrins |
| 0.1 | 1.4 | REACTOME TIE2 SIGNALING | Genes involved in Tie2 Signaling |
| 0.1 | 11.2 | REACTOME SIGNALING BY RHO GTPASES | Genes involved in Signaling by Rho GTPases |
| 0.1 | 3.2 | REACTOME GABA A RECEPTOR ACTIVATION | Genes involved in GABA A receptor activation |
| 0.1 | 5.8 | REACTOME PHASE1 FUNCTIONALIZATION OF COMPOUNDS | Genes involved in Phase 1 - Functionalization of compounds |
| 0.1 | 0.4 | REACTOME TRAF6 MEDIATED INDUCTION OF TAK1 COMPLEX | Genes involved in TRAF6 mediated induction of TAK1 complex |
| 0.1 | 1.3 | REACTOME FGFR4 LIGAND BINDING AND ACTIVATION | Genes involved in FGFR4 ligand binding and activation |
| 0.1 | 1.5 | REACTOME CYTOSOLIC SULFONATION OF SMALL MOLECULES | Genes involved in Cytosolic sulfonation of small molecules |
| 0.1 | 3.1 | REACTOME MYOGENESIS | Genes involved in Myogenesis |
| 0.1 | 5.4 | REACTOME IMMUNOREGULATORY INTERACTIONS BETWEEN A LYMPHOID AND A NON LYMPHOID CELL | Genes involved in Immunoregulatory interactions between a Lymphoid and a non-Lymphoid cell |
| 0.1 | 1.5 | REACTOME INTRINSIC PATHWAY FOR APOPTOSIS | Genes involved in Intrinsic Pathway for Apoptosis |
| 0.1 | 1.7 | REACTOME REGULATION OF IFNA SIGNALING | Genes involved in Regulation of IFNA signaling |
| 0.1 | 0.2 | REACTOME P53 DEPENDENT G1 DNA DAMAGE RESPONSE | Genes involved in p53-Dependent G1 DNA Damage Response |
| 0.1 | 1.2 | REACTOME REGULATION OF INSULIN SECRETION | Genes involved in Regulation of Insulin Secretion |
| 0.0 | 3.1 | REACTOME COLLAGEN FORMATION | Genes involved in Collagen formation |
| 0.0 | 1.2 | REACTOME GLUTATHIONE CONJUGATION | Genes involved in Glutathione conjugation |
| 0.0 | 0.6 | REACTOME STEROID HORMONES | Genes involved in Steroid hormones |
| 0.0 | 0.3 | REACTOME ACTIVATION OF RAC | Genes involved in Activation of Rac |
| 0.0 | 0.8 | REACTOME STRIATED MUSCLE CONTRACTION | Genes involved in Striated Muscle Contraction |
| 0.0 | 0.2 | REACTOME G1 S SPECIFIC TRANSCRIPTION | Genes involved in G1/S-Specific Transcription |