Project
GNF SymAtlas + NCI-60 cancer cell lines, human (Su, 2004; Ross, 2000)
Navigation
Downloads
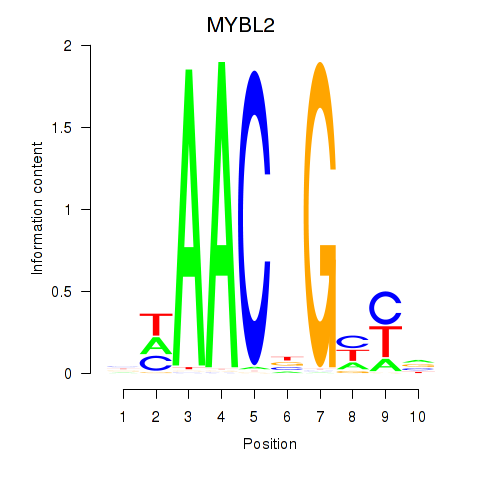
Results for MYBL2
Z-value: 2.13
Motif logo
Transcription factors associated with MYBL2
| Gene Symbol | Gene ID | Gene Info |
|---|---|---|
|
MYBL2
|
ENSG00000101057.16 | MYBL2 |
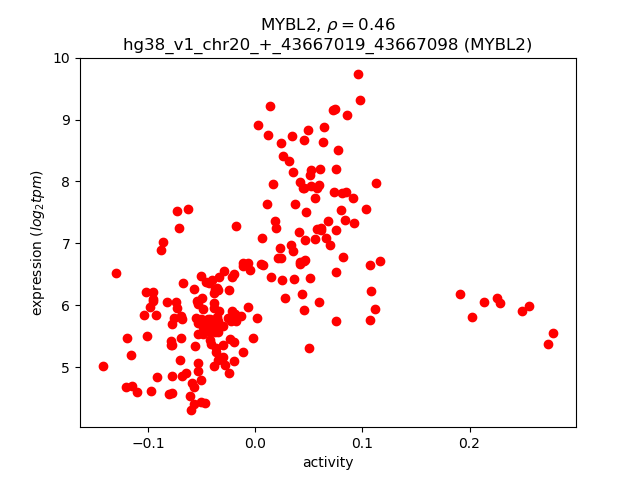
Activity-expression correlation:
| Gene | Promoter | Pearson corr. coef. | P-value | Plot |
|---|---|---|---|---|
| MYBL2 | hg38_v1_chr20_+_43667019_43667098, hg38_v1_chr20_+_43667105_43667125 | 0.46 | 1.2e-12 | Click! |
Activity profile of MYBL2 motif
Sorted Z-values of MYBL2 motif
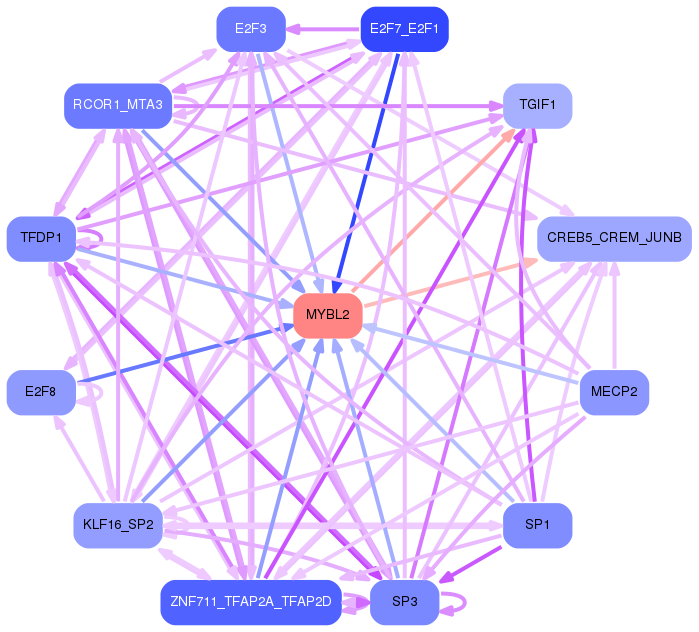
Network of associatons between targets according to the STRING database.

First level regulatory network of MYBL2
Gene Ontology Analysis
Gene overrepresentation in biological process category:
| Log-likelihood per target | Total log-likelihood | Term | Description |
|---|---|---|---|
| 12.7 | 38.1 | GO:0009786 | regulation of asymmetric cell division(GO:0009786) |
| 12.5 | 37.5 | GO:0007057 | spindle assembly involved in female meiosis I(GO:0007057) positive regulation of oocyte maturation(GO:1900195) |
| 11.0 | 44.1 | GO:0035519 | protein K29-linked ubiquitination(GO:0035519) |
| 9.6 | 38.3 | GO:0019249 | lactate biosynthetic process(GO:0019249) |
| 8.5 | 25.6 | GO:1990022 | RNA polymerase II complex import to nucleus(GO:0044376) RNA polymerase III complex localization to nucleus(GO:1990022) |
| 7.6 | 22.9 | GO:0006311 | meiotic gene conversion(GO:0006311) regulation of reciprocal meiotic recombination(GO:0010520) |
| 6.1 | 18.3 | GO:0070476 | RNA (guanine-N7)-methylation(GO:0036265) rRNA (guanine-N7)-methylation(GO:0070476) |
| 5.7 | 23.0 | GO:0071733 | transcriptional activation by promoter-enhancer looping(GO:0071733) gene looping(GO:0090202) dsDNA loop formation(GO:0090579) |
| 5.6 | 16.9 | GO:1901674 | histone H3-K27 acetylation(GO:0043974) regulation of histone H3-K27 acetylation(GO:1901674) |
| 4.9 | 19.7 | GO:0006169 | adenosine salvage(GO:0006169) dATP biosynthetic process(GO:0006175) purine deoxyribonucleoside triphosphate biosynthetic process(GO:0009216) |
| 4.8 | 43.0 | GO:0060699 | regulation of endoribonuclease activity(GO:0060699) |
| 4.7 | 18.9 | GO:0046900 | tetrahydrofolylpolyglutamate metabolic process(GO:0046900) |
| 4.6 | 13.9 | GO:0001207 | histone displacement(GO:0001207) positive regulation of transcription involved in meiotic cell cycle(GO:0051039) |
| 4.4 | 13.2 | GO:1904387 | response to human chorionic gonadotropin(GO:0044752) cellular response to thyroxine stimulus(GO:0097069) cellular response to L-phenylalanine derivative(GO:1904387) |
| 4.3 | 46.9 | GO:0000712 | resolution of meiotic recombination intermediates(GO:0000712) |
| 4.2 | 25.0 | GO:2000825 | positive regulation of androgen receptor activity(GO:2000825) |
| 3.8 | 33.8 | GO:0030951 | establishment or maintenance of microtubule cytoskeleton polarity(GO:0030951) |
| 3.6 | 25.3 | GO:0000727 | double-strand break repair via break-induced replication(GO:0000727) |
| 3.6 | 10.7 | GO:0000454 | snoRNA guided rRNA pseudouridine synthesis(GO:0000454) |
| 3.5 | 3.5 | GO:1904884 | telomerase catalytic core complex assembly(GO:1904868) regulation of telomerase catalytic core complex assembly(GO:1904882) positive regulation of telomerase catalytic core complex assembly(GO:1904884) |
| 3.5 | 14.1 | GO:0030472 | mitotic spindle organization in nucleus(GO:0030472) |
| 3.4 | 44.5 | GO:0000972 | transcription-dependent tethering of RNA polymerase II gene DNA at nuclear periphery(GO:0000972) |
| 3.3 | 16.7 | GO:0016240 | autophagosome docking(GO:0016240) |
| 3.2 | 42.0 | GO:0007084 | mitotic nuclear envelope reassembly(GO:0007084) |
| 3.2 | 19.3 | GO:0051177 | meiotic sister chromatid cohesion(GO:0051177) |
| 3.1 | 22.0 | GO:0032466 | negative regulation of cytokinesis(GO:0032466) |
| 3.0 | 5.9 | GO:0000350 | generation of catalytic spliceosome for second transesterification step(GO:0000350) |
| 2.9 | 8.6 | GO:0034729 | histone H3-K79 methylation(GO:0034729) |
| 2.8 | 50.7 | GO:0000022 | mitotic spindle elongation(GO:0000022) spindle elongation(GO:0051231) |
| 2.8 | 8.4 | GO:0060151 | peroxisome localization(GO:0060151) microtubule-based peroxisome localization(GO:0060152) |
| 2.8 | 30.5 | GO:0035092 | sperm chromatin condensation(GO:0035092) |
| 2.7 | 46.4 | GO:0070389 | chaperone cofactor-dependent protein refolding(GO:0070389) |
| 2.7 | 8.1 | GO:0097698 | telomere maintenance via base-excision repair(GO:0097698) |
| 2.7 | 306.2 | GO:0000079 | regulation of cyclin-dependent protein serine/threonine kinase activity(GO:0000079) |
| 2.6 | 7.7 | GO:0014016 | neuroblast differentiation(GO:0014016) |
| 2.6 | 12.8 | GO:0046167 | glycerol-3-phosphate biosynthetic process(GO:0046167) |
| 2.5 | 14.9 | GO:0030581 | intracellular transport of viral protein in host cell(GO:0019060) symbiont intracellular protein transport in host(GO:0030581) intracellular protein transport in other organism involved in symbiotic interaction(GO:0051708) |
| 2.4 | 17.1 | GO:0070562 | regulation of vitamin D receptor signaling pathway(GO:0070562) |
| 2.3 | 79.9 | GO:0006607 | NLS-bearing protein import into nucleus(GO:0006607) |
| 2.2 | 6.6 | GO:0070901 | mitochondrial tRNA methylation(GO:0070901) |
| 2.2 | 10.9 | GO:0034721 | histone H3-K4 demethylation, trimethyl-H3-K4-specific(GO:0034721) |
| 2.1 | 19.1 | GO:0046940 | nucleoside monophosphate phosphorylation(GO:0046940) |
| 2.1 | 6.4 | GO:1903568 | negative regulation of protein localization to cilium(GO:1903565) regulation of protein localization to ciliary membrane(GO:1903567) negative regulation of protein localization to ciliary membrane(GO:1903568) |
| 2.1 | 6.3 | GO:1904751 | positive regulation of protein localization to nucleolus(GO:1904751) |
| 2.1 | 6.2 | GO:2000681 | negative regulation of rubidium ion transport(GO:2000681) negative regulation of rubidium ion transmembrane transporter activity(GO:2000687) |
| 2.1 | 10.3 | GO:0006015 | 5-phosphoribose 1-diphosphate biosynthetic process(GO:0006015) 5-phosphoribose 1-diphosphate metabolic process(GO:0046391) |
| 2.0 | 10.2 | GO:0052572 | response to immune response of other organism involved in symbiotic interaction(GO:0052564) response to host immune response(GO:0052572) |
| 2.0 | 12.1 | GO:1903564 | regulation of protein localization to cilium(GO:1903564) positive regulation of protein localization to cilium(GO:1903566) |
| 2.0 | 18.0 | GO:1902572 | negative regulation of serine-type endopeptidase activity(GO:1900004) negative regulation of serine-type peptidase activity(GO:1902572) |
| 1.9 | 5.7 | GO:0046521 | sphingoid catabolic process(GO:0046521) |
| 1.9 | 29.8 | GO:1990001 | inhibition of cysteine-type endopeptidase activity involved in apoptotic process(GO:1990001) |
| 1.8 | 16.6 | GO:0010265 | SCF complex assembly(GO:0010265) |
| 1.7 | 12.1 | GO:0046726 | positive regulation by virus of viral protein levels in host cell(GO:0046726) |
| 1.7 | 6.9 | GO:0006404 | RNA import into nucleus(GO:0006404) |
| 1.6 | 54.1 | GO:2000816 | negative regulation of mitotic sister chromatid separation(GO:2000816) |
| 1.6 | 24.4 | GO:0000338 | protein deneddylation(GO:0000338) |
| 1.6 | 4.9 | GO:2000653 | regulation of genetic imprinting(GO:2000653) |
| 1.6 | 4.8 | GO:0035048 | splicing factor protein import into nucleus(GO:0035048) |
| 1.6 | 11.2 | GO:0038026 | reelin-mediated signaling pathway(GO:0038026) |
| 1.6 | 3.1 | GO:0034165 | positive regulation of toll-like receptor 9 signaling pathway(GO:0034165) |
| 1.6 | 11.0 | GO:0015866 | ADP transport(GO:0015866) |
| 1.5 | 1.5 | GO:0021691 | cerebellar Purkinje cell layer maturation(GO:0021691) |
| 1.5 | 4.5 | GO:0033206 | meiotic cytokinesis(GO:0033206) |
| 1.5 | 7.3 | GO:1903630 | regulation of aminoacyl-tRNA ligase activity(GO:1903630) |
| 1.4 | 4.3 | GO:0032954 | regulation of cytokinetic process(GO:0032954) regulation of mitotic cytokinetic process(GO:1903436) positive regulation of mitotic cytokinetic process(GO:1903438) positive regulation of mitotic cytokinesis(GO:1903490) |
| 1.4 | 4.3 | GO:0071921 | establishment of sister chromatid cohesion(GO:0034085) cohesin loading(GO:0071921) regulation of cohesin loading(GO:0071922) |
| 1.4 | 8.6 | GO:0000389 | mRNA 3'-splice site recognition(GO:0000389) |
| 1.4 | 8.5 | GO:0010032 | meiotic chromosome condensation(GO:0010032) |
| 1.4 | 16.9 | GO:0008635 | activation of cysteine-type endopeptidase activity involved in apoptotic process by cytochrome c(GO:0008635) |
| 1.4 | 19.5 | GO:0035970 | peptidyl-threonine dephosphorylation(GO:0035970) |
| 1.4 | 4.2 | GO:1903015 | regulation of exo-alpha-sialidase activity(GO:1903015) |
| 1.4 | 9.7 | GO:0008215 | spermine metabolic process(GO:0008215) |
| 1.4 | 83.8 | GO:0010501 | RNA secondary structure unwinding(GO:0010501) |
| 1.3 | 6.7 | GO:1902626 | assembly of large subunit precursor of preribosome(GO:1902626) |
| 1.3 | 4.0 | GO:0042727 | flavin-containing compound biosynthetic process(GO:0042727) |
| 1.3 | 25.2 | GO:0009263 | deoxyribonucleotide biosynthetic process(GO:0009263) |
| 1.3 | 27.4 | GO:0070935 | 3'-UTR-mediated mRNA stabilization(GO:0070935) |
| 1.3 | 26.0 | GO:0007064 | mitotic sister chromatid cohesion(GO:0007064) |
| 1.3 | 11.6 | GO:0000395 | mRNA 5'-splice site recognition(GO:0000395) |
| 1.2 | 8.7 | GO:2000819 | regulation of nucleotide-excision repair(GO:2000819) |
| 1.2 | 14.7 | GO:0090084 | negative regulation of inclusion body assembly(GO:0090084) |
| 1.2 | 14.6 | GO:0000244 | spliceosomal tri-snRNP complex assembly(GO:0000244) |
| 1.2 | 9.3 | GO:0034723 | DNA replication-dependent nucleosome assembly(GO:0006335) DNA replication-dependent nucleosome organization(GO:0034723) |
| 1.1 | 5.7 | GO:0019747 | regulation of isoprenoid metabolic process(GO:0019747) |
| 1.1 | 11.4 | GO:0060136 | embryonic process involved in female pregnancy(GO:0060136) |
| 1.1 | 5.6 | GO:0019276 | UDP-N-acetylgalactosamine metabolic process(GO:0019276) |
| 1.1 | 29.2 | GO:0072663 | protein targeting to peroxisome(GO:0006625) protein localization to peroxisome(GO:0072662) establishment of protein localization to peroxisome(GO:0072663) |
| 1.1 | 25.7 | GO:0046931 | pore complex assembly(GO:0046931) |
| 1.1 | 5.3 | GO:0010724 | regulation of definitive erythrocyte differentiation(GO:0010724) |
| 1.1 | 12.6 | GO:0045292 | mRNA cis splicing, via spliceosome(GO:0045292) |
| 1.0 | 3.1 | GO:0097114 | NMDA glutamate receptor clustering(GO:0097114) |
| 1.0 | 12.1 | GO:0035360 | positive regulation of peroxisome proliferator activated receptor signaling pathway(GO:0035360) |
| 1.0 | 42.3 | GO:0061003 | positive regulation of dendritic spine morphogenesis(GO:0061003) |
| 1.0 | 5.0 | GO:0003065 | positive regulation of heart rate by epinephrine(GO:0003065) |
| 1.0 | 2.9 | GO:0051684 | maintenance of Golgi location(GO:0051684) |
| 1.0 | 18.5 | GO:0006107 | oxaloacetate metabolic process(GO:0006107) |
| 1.0 | 16.2 | GO:0031163 | iron-sulfur cluster assembly(GO:0016226) metallo-sulfur cluster assembly(GO:0031163) |
| 0.9 | 5.6 | GO:0033314 | mitotic DNA replication checkpoint(GO:0033314) |
| 0.9 | 1.8 | GO:0019860 | uracil metabolic process(GO:0019860) |
| 0.9 | 17.0 | GO:0034975 | protein folding in endoplasmic reticulum(GO:0034975) |
| 0.9 | 26.5 | GO:0007026 | negative regulation of microtubule depolymerization(GO:0007026) |
| 0.9 | 11.4 | GO:0000098 | sulfur amino acid catabolic process(GO:0000098) |
| 0.8 | 5.1 | GO:0035617 | stress granule disassembly(GO:0035617) |
| 0.8 | 4.9 | GO:0007096 | regulation of exit from mitosis(GO:0007096) |
| 0.8 | 24.3 | GO:0051131 | chaperone-mediated protein complex assembly(GO:0051131) |
| 0.8 | 9.5 | GO:2001288 | positive regulation of caveolin-mediated endocytosis(GO:2001288) |
| 0.8 | 78.1 | GO:0006521 | regulation of cellular amino acid metabolic process(GO:0006521) |
| 0.8 | 58.4 | GO:0070125 | mitochondrial translational elongation(GO:0070125) |
| 0.8 | 10.7 | GO:0036158 | outer dynein arm assembly(GO:0036158) |
| 0.7 | 13.5 | GO:0075522 | IRES-dependent viral translational initiation(GO:0075522) |
| 0.7 | 2.9 | GO:0070885 | negative regulation of calcineurin-NFAT signaling cascade(GO:0070885) |
| 0.7 | 8.1 | GO:0007019 | microtubule depolymerization(GO:0007019) |
| 0.7 | 12.8 | GO:0070914 | UV-damage excision repair(GO:0070914) |
| 0.7 | 1.4 | GO:0031393 | negative regulation of prostaglandin biosynthetic process(GO:0031393) |
| 0.7 | 2.1 | GO:0060437 | lung growth(GO:0060437) |
| 0.7 | 6.2 | GO:0031573 | intra-S DNA damage checkpoint(GO:0031573) |
| 0.7 | 8.9 | GO:0006089 | lactate metabolic process(GO:0006089) |
| 0.7 | 2.0 | GO:0006627 | protein processing involved in protein targeting to mitochondrion(GO:0006627) |
| 0.7 | 4.0 | GO:0001880 | Mullerian duct regression(GO:0001880) |
| 0.7 | 2.0 | GO:0006421 | asparaginyl-tRNA aminoacylation(GO:0006421) |
| 0.7 | 2.6 | GO:0042264 | peptidyl-aspartic acid hydroxylation(GO:0042264) |
| 0.6 | 2.5 | GO:0072299 | adrenal cortex development(GO:0035801) adrenal cortex formation(GO:0035802) posterior mesonephric tubule development(GO:0072166) negative regulation of metanephric glomerulus development(GO:0072299) negative regulation of metanephric glomerular mesangial cell proliferation(GO:0072302) |
| 0.6 | 3.8 | GO:0033489 | cholesterol biosynthetic process via desmosterol(GO:0033489) cholesterol biosynthetic process via lathosterol(GO:0033490) |
| 0.6 | 3.7 | GO:0051694 | pointed-end actin filament capping(GO:0051694) |
| 0.6 | 17.2 | GO:0016578 | histone deubiquitination(GO:0016578) |
| 0.6 | 26.2 | GO:0031572 | G2 DNA damage checkpoint(GO:0031572) |
| 0.6 | 24.5 | GO:0070979 | protein K11-linked ubiquitination(GO:0070979) |
| 0.6 | 5.1 | GO:0001672 | regulation of chromatin assembly or disassembly(GO:0001672) |
| 0.6 | 5.6 | GO:0051005 | negative regulation of lipoprotein lipase activity(GO:0051005) |
| 0.6 | 2.8 | GO:0055059 | asymmetric neuroblast division(GO:0055059) |
| 0.6 | 4.4 | GO:0007070 | negative regulation of transcription during mitosis(GO:0007068) negative regulation of transcription from RNA polymerase II promoter during mitosis(GO:0007070) |
| 0.5 | 16.4 | GO:0034080 | chromatin remodeling at centromere(GO:0031055) CENP-A containing nucleosome assembly(GO:0034080) CENP-A containing chromatin organization(GO:0061641) |
| 0.5 | 11.6 | GO:0032802 | low-density lipoprotein particle receptor catabolic process(GO:0032802) |
| 0.5 | 6.7 | GO:0042407 | cristae formation(GO:0042407) |
| 0.5 | 8.7 | GO:1904778 | regulation of protein localization to cell cortex(GO:1904776) positive regulation of protein localization to cell cortex(GO:1904778) |
| 0.5 | 9.2 | GO:0007141 | male meiosis I(GO:0007141) |
| 0.5 | 1.0 | GO:0032831 | regulation of CD4-positive, CD25-positive, alpha-beta regulatory T cell differentiation(GO:0032829) positive regulation of CD4-positive, CD25-positive, alpha-beta regulatory T cell differentiation(GO:0032831) |
| 0.5 | 6.6 | GO:0003351 | epithelial cilium movement(GO:0003351) |
| 0.5 | 5.5 | GO:0008356 | asymmetric cell division(GO:0008356) |
| 0.5 | 1.5 | GO:2000354 | response to prolactin(GO:1990637) regulation of ovarian follicle development(GO:2000354) |
| 0.5 | 5.4 | GO:0042985 | negative regulation of amyloid precursor protein biosynthetic process(GO:0042985) |
| 0.5 | 2.9 | GO:0075136 | evasion or tolerance of host defenses by virus(GO:0019049) avoidance of host defenses(GO:0044413) evasion or tolerance of host defenses(GO:0044415) avoidance of defenses of other organism involved in symbiotic interaction(GO:0051832) evasion or tolerance of defenses of other organism involved in symbiotic interaction(GO:0051834) response to defenses of other organism involved in symbiotic interaction(GO:0052173) response to host defenses(GO:0052200) response to host(GO:0075136) |
| 0.5 | 17.7 | GO:0048255 | mRNA stabilization(GO:0048255) |
| 0.4 | 1.3 | GO:0019287 | isopentenyl diphosphate biosynthetic process, mevalonate pathway(GO:0019287) |
| 0.4 | 5.7 | GO:0038203 | TORC2 signaling(GO:0038203) |
| 0.4 | 3.5 | GO:0060576 | intestinal epithelial cell development(GO:0060576) |
| 0.4 | 5.0 | GO:0030656 | regulation of vitamin metabolic process(GO:0030656) |
| 0.4 | 0.8 | GO:0006348 | chromatin silencing at telomere(GO:0006348) |
| 0.4 | 7.0 | GO:0040015 | negative regulation of multicellular organism growth(GO:0040015) |
| 0.4 | 2.5 | GO:0015793 | glycerol transport(GO:0015793) |
| 0.4 | 8.2 | GO:2000052 | positive regulation of non-canonical Wnt signaling pathway(GO:2000052) |
| 0.4 | 5.3 | GO:0035020 | regulation of Rac protein signal transduction(GO:0035020) |
| 0.4 | 2.4 | GO:0044211 | CTP salvage(GO:0044211) |
| 0.4 | 4.0 | GO:0035331 | negative regulation of hippo signaling(GO:0035331) |
| 0.4 | 11.5 | GO:0006363 | termination of RNA polymerase I transcription(GO:0006363) |
| 0.4 | 4.8 | GO:0042074 | cell migration involved in gastrulation(GO:0042074) |
| 0.4 | 5.1 | GO:0021796 | cerebral cortex regionalization(GO:0021796) |
| 0.4 | 14.5 | GO:0070911 | global genome nucleotide-excision repair(GO:0070911) |
| 0.4 | 7.8 | GO:0050872 | white fat cell differentiation(GO:0050872) |
| 0.4 | 18.2 | GO:0045600 | positive regulation of fat cell differentiation(GO:0045600) |
| 0.4 | 4.2 | GO:0035721 | intraciliary retrograde transport(GO:0035721) |
| 0.4 | 22.8 | GO:0032781 | positive regulation of ATPase activity(GO:0032781) |
| 0.4 | 24.9 | GO:0006120 | mitochondrial electron transport, NADH to ubiquinone(GO:0006120) |
| 0.4 | 5.3 | GO:0045793 | positive regulation of cell size(GO:0045793) |
| 0.4 | 1.5 | GO:0030242 | pexophagy(GO:0030242) |
| 0.3 | 11.2 | GO:0051016 | barbed-end actin filament capping(GO:0051016) |
| 0.3 | 2.6 | GO:0072656 | maintenance of protein location in mitochondrion(GO:0072656) |
| 0.3 | 7.8 | GO:0060716 | labyrinthine layer blood vessel development(GO:0060716) |
| 0.3 | 2.8 | GO:0046007 | negative regulation of activated T cell proliferation(GO:0046007) |
| 0.3 | 7.3 | GO:0008053 | mitochondrial fusion(GO:0008053) positive regulation of mitochondrial fission(GO:0090141) |
| 0.3 | 11.7 | GO:0018149 | peptide cross-linking(GO:0018149) |
| 0.3 | 8.5 | GO:0015949 | nucleobase-containing small molecule interconversion(GO:0015949) |
| 0.3 | 2.7 | GO:0001514 | selenocysteine incorporation(GO:0001514) translational readthrough(GO:0006451) |
| 0.3 | 20.3 | GO:0051225 | spindle assembly(GO:0051225) |
| 0.2 | 1.0 | GO:0006581 | acetylcholine catabolic process in synaptic cleft(GO:0001507) acetylcholine catabolic process(GO:0006581) |
| 0.2 | 4.9 | GO:0016254 | preassembly of GPI anchor in ER membrane(GO:0016254) |
| 0.2 | 2.9 | GO:0097084 | vascular smooth muscle cell development(GO:0097084) |
| 0.2 | 1.1 | GO:0007341 | penetration of zona pellucida(GO:0007341) |
| 0.2 | 0.4 | GO:1990418 | response to insulin-like growth factor stimulus(GO:1990418) |
| 0.2 | 1.3 | GO:1903435 | positive regulation of constitutive secretory pathway(GO:1903435) |
| 0.2 | 0.6 | GO:2000525 | regulation of T cell costimulation(GO:2000523) positive regulation of T cell costimulation(GO:2000525) |
| 0.2 | 0.9 | GO:0051919 | positive regulation of fibrinolysis(GO:0051919) |
| 0.2 | 7.3 | GO:0000027 | ribosomal large subunit assembly(GO:0000027) |
| 0.2 | 2.9 | GO:0016024 | CDP-diacylglycerol biosynthetic process(GO:0016024) |
| 0.2 | 11.9 | GO:0048384 | retinoic acid receptor signaling pathway(GO:0048384) |
| 0.2 | 0.6 | GO:0061054 | Spemann organizer formation(GO:0060061) dermatome development(GO:0061054) regulation of dermatome development(GO:0061183) positive regulation of dermatome development(GO:0061184) |
| 0.2 | 5.5 | GO:0048247 | lymphocyte chemotaxis(GO:0048247) |
| 0.2 | 1.0 | GO:1901098 | positive regulation of autophagosome maturation(GO:1901098) |
| 0.2 | 2.5 | GO:1900623 | regulation of monocyte aggregation(GO:1900623) positive regulation of monocyte aggregation(GO:1900625) |
| 0.2 | 21.1 | GO:0016925 | protein sumoylation(GO:0016925) |
| 0.2 | 8.7 | GO:0015804 | neutral amino acid transport(GO:0015804) |
| 0.2 | 1.1 | GO:0006398 | mRNA 3'-end processing by stem-loop binding and cleavage(GO:0006398) |
| 0.2 | 3.9 | GO:0032008 | positive regulation of TOR signaling(GO:0032008) |
| 0.2 | 5.3 | GO:0035812 | renal sodium excretion(GO:0035812) regulation of renal sodium excretion(GO:0035813) |
| 0.2 | 1.8 | GO:0070120 | ciliary neurotrophic factor-mediated signaling pathway(GO:0070120) |
| 0.2 | 12.7 | GO:1901222 | regulation of NIK/NF-kappaB signaling(GO:1901222) |
| 0.2 | 1.7 | GO:0007080 | mitotic metaphase plate congression(GO:0007080) |
| 0.2 | 0.5 | GO:0000710 | meiotic mismatch repair(GO:0000710) |
| 0.2 | 6.8 | GO:0032467 | positive regulation of cytokinesis(GO:0032467) |
| 0.2 | 1.9 | GO:0044341 | sodium-dependent phosphate transport(GO:0044341) |
| 0.2 | 9.6 | GO:0048477 | oogenesis(GO:0048477) |
| 0.2 | 1.6 | GO:0010626 | regulation of Schwann cell proliferation(GO:0010624) negative regulation of Schwann cell proliferation(GO:0010626) |
| 0.2 | 6.2 | GO:0006298 | mismatch repair(GO:0006298) |
| 0.2 | 1.5 | GO:2000480 | negative regulation of cAMP-dependent protein kinase activity(GO:2000480) |
| 0.1 | 2.6 | GO:0019511 | peptidyl-proline hydroxylation(GO:0019511) |
| 0.1 | 1.7 | GO:1901748 | leukotriene D4 metabolic process(GO:1901748) leukotriene D4 biosynthetic process(GO:1901750) |
| 0.1 | 0.1 | GO:0042137 | sequestering of neurotransmitter(GO:0042137) |
| 0.1 | 2.2 | GO:0019370 | leukotriene biosynthetic process(GO:0019370) |
| 0.1 | 1.4 | GO:2001214 | positive regulation of vasculogenesis(GO:2001214) |
| 0.1 | 0.6 | GO:0070966 | nuclear-transcribed mRNA catabolic process, no-go decay(GO:0070966) |
| 0.1 | 1.4 | GO:0021840 | directional guidance of interneurons involved in migration from the subpallium to the cortex(GO:0021840) chemorepulsion involved in interneuron migration from the subpallium to the cortex(GO:0021842) |
| 0.1 | 7.9 | GO:0045540 | regulation of cholesterol biosynthetic process(GO:0045540) |
| 0.1 | 14.7 | GO:0033209 | tumor necrosis factor-mediated signaling pathway(GO:0033209) |
| 0.1 | 1.7 | GO:0032780 | negative regulation of ATPase activity(GO:0032780) |
| 0.1 | 1.5 | GO:1903204 | negative regulation of oxidative stress-induced neuron death(GO:1903204) |
| 0.1 | 2.3 | GO:0002089 | lens morphogenesis in camera-type eye(GO:0002089) |
| 0.1 | 8.0 | GO:0071349 | interleukin-12-mediated signaling pathway(GO:0035722) cellular response to interleukin-12(GO:0071349) |
| 0.1 | 1.0 | GO:0045116 | protein neddylation(GO:0045116) |
| 0.1 | 7.7 | GO:0048207 | vesicle targeting, rough ER to cis-Golgi(GO:0048207) COPII vesicle coating(GO:0048208) |
| 0.1 | 0.9 | GO:1903546 | protein localization to photoreceptor outer segment(GO:1903546) |
| 0.1 | 3.5 | GO:0006636 | unsaturated fatty acid biosynthetic process(GO:0006636) |
| 0.1 | 0.9 | GO:0031053 | primary miRNA processing(GO:0031053) |
| 0.1 | 14.2 | GO:0070585 | protein localization to mitochondrion(GO:0070585) |
| 0.1 | 1.5 | GO:0045109 | intermediate filament organization(GO:0045109) |
| 0.1 | 0.5 | GO:0006065 | UDP-glucuronate biosynthetic process(GO:0006065) UDP-glucuronate metabolic process(GO:0046398) |
| 0.1 | 2.4 | GO:0021522 | spinal cord motor neuron differentiation(GO:0021522) |
| 0.1 | 0.5 | GO:0042866 | pyruvate biosynthetic process(GO:0042866) |
| 0.1 | 1.7 | GO:0016180 | snRNA processing(GO:0016180) |
| 0.1 | 2.1 | GO:0042149 | cellular response to glucose starvation(GO:0042149) |
| 0.1 | 2.9 | GO:0043631 | mRNA polyadenylation(GO:0006378) RNA polyadenylation(GO:0043631) |
| 0.1 | 3.1 | GO:1904837 | beta-catenin-TCF complex assembly(GO:1904837) |
| 0.1 | 0.4 | GO:0051205 | protein insertion into membrane(GO:0051205) |
| 0.1 | 2.9 | GO:0000245 | spliceosomal complex assembly(GO:0000245) |
| 0.1 | 1.3 | GO:0009404 | toxin metabolic process(GO:0009404) |
| 0.1 | 7.4 | GO:0006613 | cotranslational protein targeting to membrane(GO:0006613) |
| 0.1 | 1.0 | GO:0017145 | stem cell division(GO:0017145) |
| 0.0 | 6.1 | GO:0006364 | rRNA processing(GO:0006364) |
| 0.0 | 0.8 | GO:0001502 | cartilage condensation(GO:0001502) |
| 0.0 | 0.8 | GO:0007099 | centriole replication(GO:0007099) |
| 0.0 | 0.5 | GO:0030502 | negative regulation of bone mineralization(GO:0030502) |
| 0.0 | 0.2 | GO:2000301 | negative regulation of synaptic vesicle exocytosis(GO:2000301) |
| 0.0 | 0.4 | GO:0070208 | protein heterotrimerization(GO:0070208) |
| 0.0 | 1.1 | GO:0032570 | response to progesterone(GO:0032570) |
| 0.0 | 2.7 | GO:0070527 | platelet aggregation(GO:0070527) |
| 0.0 | 0.3 | GO:0098877 | neurotransmitter receptor transport to plasma membrane(GO:0098877) neurotransmitter receptor transport to postsynaptic membrane(GO:0098969) establishment of protein localization to postsynaptic membrane(GO:1903540) |
| 0.0 | 0.9 | GO:0002437 | inflammatory response to antigenic stimulus(GO:0002437) |
| 0.0 | 8.7 | GO:0030335 | positive regulation of cell migration(GO:0030335) |
| 0.0 | 0.6 | GO:0005980 | glycogen catabolic process(GO:0005980) |
| 0.0 | 1.9 | GO:0050911 | detection of chemical stimulus involved in sensory perception of smell(GO:0050911) |
| 0.0 | 0.5 | GO:0045599 | negative regulation of fat cell differentiation(GO:0045599) |
| 0.0 | 0.6 | GO:0035987 | endodermal cell differentiation(GO:0035987) |
| 0.0 | 0.1 | GO:0015693 | magnesium ion transport(GO:0015693) |
| 0.0 | 2.1 | GO:0009952 | anterior/posterior pattern specification(GO:0009952) |
| 0.0 | 0.6 | GO:0030316 | osteoclast differentiation(GO:0030316) |
Gene overrepresentation in cellular component category:
| Log-likelihood per target | Total log-likelihood | Term | Description |
|---|---|---|---|
| 8.9 | 80.1 | GO:0072687 | meiotic spindle(GO:0072687) |
| 7.4 | 80.9 | GO:0033588 | Elongator holoenzyme complex(GO:0033588) |
| 6.3 | 25.2 | GO:0005971 | ribonucleoside-diphosphate reductase complex(GO:0005971) |
| 5.7 | 22.9 | GO:0031510 | SUMO activating enzyme complex(GO:0031510) |
| 4.7 | 23.4 | GO:0032301 | MutSalpha complex(GO:0032301) |
| 4.4 | 13.2 | GO:0017109 | glutamate-cysteine ligase complex(GO:0017109) |
| 4.0 | 36.3 | GO:0000125 | PCAF complex(GO:0000125) |
| 3.9 | 55.1 | GO:0070938 | contractile ring(GO:0070938) |
| 3.7 | 14.9 | GO:0036502 | Derlin-1-VIMP complex(GO:0036502) |
| 3.7 | 29.8 | GO:0032133 | chromosome passenger complex(GO:0032133) |
| 3.3 | 16.7 | GO:0005726 | perichromatin fibrils(GO:0005726) |
| 3.3 | 10.0 | GO:0097414 | glial cytoplasmic inclusion(GO:0097409) classical Lewy body(GO:0097414) Lewy neurite(GO:0097462) Lewy body corona(GO:1990038) |
| 3.1 | 9.2 | GO:0071001 | U4/U6 snRNP(GO:0071001) |
| 2.9 | 8.6 | GO:0055087 | Ski complex(GO:0055087) |
| 2.8 | 8.5 | GO:0000799 | nuclear condensin complex(GO:0000799) |
| 2.8 | 16.7 | GO:0020018 | ciliary pocket(GO:0020016) ciliary pocket membrane(GO:0020018) |
| 2.7 | 77.6 | GO:0005680 | anaphase-promoting complex(GO:0005680) |
| 2.7 | 42.7 | GO:0097431 | mitotic spindle pole(GO:0097431) |
| 2.6 | 7.7 | GO:0071821 | FANCM-MHF complex(GO:0071821) |
| 2.5 | 27.5 | GO:0031465 | Cul4B-RING E3 ubiquitin ligase complex(GO:0031465) |
| 2.3 | 23.0 | GO:0097255 | R2TP complex(GO:0097255) |
| 2.3 | 9.2 | GO:0097123 | cyclin A1-CDK2 complex(GO:0097123) |
| 2.1 | 49.9 | GO:0070822 | Sin3-type complex(GO:0070822) |
| 2.0 | 23.5 | GO:0019773 | proteasome core complex, alpha-subunit complex(GO:0019773) |
| 1.9 | 11.6 | GO:0033063 | DNA recombinase mediator complex(GO:0033061) Rad51B-Rad51C-Rad51D-XRCC2 complex(GO:0033063) |
| 1.8 | 7.3 | GO:0071986 | Ragulator complex(GO:0071986) |
| 1.8 | 55.4 | GO:0005838 | proteasome regulatory particle(GO:0005838) |
| 1.8 | 33.3 | GO:0005832 | chaperonin-containing T-complex(GO:0005832) |
| 1.7 | 12.2 | GO:1990452 | Parkin-FBXW7-Cul1 ubiquitin ligase complex(GO:1990452) |
| 1.7 | 61.5 | GO:0005697 | telomerase holoenzyme complex(GO:0005697) |
| 1.6 | 19.8 | GO:0031616 | spindle pole centrosome(GO:0031616) |
| 1.6 | 11.4 | GO:0000243 | commitment complex(GO:0000243) |
| 1.6 | 4.9 | GO:1903349 | omegasome membrane(GO:1903349) |
| 1.5 | 7.7 | GO:0000942 | condensed nuclear chromosome outer kinetochore(GO:0000942) |
| 1.5 | 28.1 | GO:0005641 | nuclear envelope lumen(GO:0005641) |
| 1.3 | 21.3 | GO:0030285 | integral component of synaptic vesicle membrane(GO:0030285) intrinsic component of synaptic vesicle membrane(GO:0098563) |
| 1.3 | 15.7 | GO:0071203 | WASH complex(GO:0071203) |
| 1.3 | 5.1 | GO:0071942 | XPC complex(GO:0071942) |
| 1.2 | 4.9 | GO:1990423 | RZZ complex(GO:1990423) |
| 1.2 | 7.3 | GO:0017101 | aminoacyl-tRNA synthetase multienzyme complex(GO:0017101) |
| 1.2 | 8.1 | GO:1990023 | mitotic spindle midzone(GO:1990023) |
| 1.1 | 46.0 | GO:0000315 | organellar large ribosomal subunit(GO:0000315) mitochondrial large ribosomal subunit(GO:0005762) |
| 1.1 | 6.7 | GO:0061617 | MICOS complex(GO:0061617) |
| 1.1 | 11.1 | GO:0070852 | cell body fiber(GO:0070852) |
| 1.0 | 44.1 | GO:0019005 | SCF ubiquitin ligase complex(GO:0019005) |
| 1.0 | 9.1 | GO:0042382 | paraspeckles(GO:0042382) |
| 1.0 | 9.0 | GO:0070552 | BRISC complex(GO:0070552) |
| 1.0 | 20.1 | GO:0005682 | U5 snRNP(GO:0005682) |
| 0.9 | 20.8 | GO:0071141 | SMAD protein complex(GO:0071141) |
| 0.9 | 25.9 | GO:0005852 | eukaryotic translation initiation factor 3 complex(GO:0005852) |
| 0.9 | 23.1 | GO:0035371 | microtubule plus-end(GO:0035371) |
| 0.9 | 6.2 | GO:0031464 | Cul4A-RING E3 ubiquitin ligase complex(GO:0031464) |
| 0.8 | 8.3 | GO:0032389 | MutLalpha complex(GO:0032389) |
| 0.8 | 4.7 | GO:0033269 | internode region of axon(GO:0033269) |
| 0.8 | 11.4 | GO:0044233 | ER-mitochondrion membrane contact site(GO:0044233) |
| 0.7 | 11.0 | GO:0097433 | dense body(GO:0097433) |
| 0.7 | 8.0 | GO:0005686 | U2 snRNP(GO:0005686) |
| 0.7 | 37.5 | GO:0005876 | spindle microtubule(GO:0005876) |
| 0.7 | 11.5 | GO:0005736 | DNA-directed RNA polymerase I complex(GO:0005736) |
| 0.7 | 3.6 | GO:0035985 | senescence-associated heterochromatin focus(GO:0035985) |
| 0.7 | 47.3 | GO:0045171 | intercellular bridge(GO:0045171) |
| 0.7 | 80.8 | GO:0005643 | nuclear pore(GO:0005643) |
| 0.7 | 5.4 | GO:0072546 | ER membrane protein complex(GO:0072546) |
| 0.6 | 7.7 | GO:0030008 | TRAPP complex(GO:0030008) |
| 0.6 | 119.1 | GO:0005681 | spliceosomal complex(GO:0005681) |
| 0.6 | 40.7 | GO:0010494 | cytoplasmic stress granule(GO:0010494) |
| 0.6 | 4.1 | GO:0016272 | prefoldin complex(GO:0016272) |
| 0.6 | 8.7 | GO:0008091 | spectrin(GO:0008091) |
| 0.6 | 11.6 | GO:0036020 | endolysosome membrane(GO:0036020) |
| 0.5 | 2.6 | GO:0032541 | cortical endoplasmic reticulum(GO:0032541) |
| 0.5 | 3.0 | GO:0031501 | mannosyltransferase complex(GO:0031501) |
| 0.5 | 17.4 | GO:0034451 | centriolar satellite(GO:0034451) |
| 0.5 | 25.3 | GO:0005881 | cytoplasmic microtubule(GO:0005881) |
| 0.5 | 8.5 | GO:0035631 | CD40 receptor complex(GO:0035631) |
| 0.5 | 5.1 | GO:0010369 | chromocenter(GO:0010369) |
| 0.4 | 6.7 | GO:0034663 | endoplasmic reticulum chaperone complex(GO:0034663) |
| 0.4 | 1.8 | GO:0097059 | CNTFR-CLCF1 complex(GO:0097059) |
| 0.4 | 39.3 | GO:0000776 | kinetochore(GO:0000776) |
| 0.4 | 45.3 | GO:0035578 | azurophil granule lumen(GO:0035578) |
| 0.4 | 1.1 | GO:0043159 | acrosomal matrix(GO:0043159) |
| 0.4 | 2.5 | GO:0000110 | nucleotide-excision repair factor 1 complex(GO:0000110) |
| 0.4 | 5.0 | GO:0005862 | muscle thin filament tropomyosin(GO:0005862) |
| 0.4 | 14.1 | GO:0000159 | protein phosphatase type 2A complex(GO:0000159) |
| 0.3 | 11.2 | GO:0034361 | very-low-density lipoprotein particle(GO:0034361) triglyceride-rich lipoprotein particle(GO:0034385) |
| 0.3 | 15.9 | GO:0000502 | proteasome complex(GO:0000502) |
| 0.3 | 19.4 | GO:0005747 | mitochondrial respiratory chain complex I(GO:0005747) NADH dehydrogenase complex(GO:0030964) respiratory chain complex I(GO:0045271) |
| 0.3 | 0.6 | GO:0070937 | CRD-mediated mRNA stability complex(GO:0070937) |
| 0.3 | 39.4 | GO:0031514 | motile cilium(GO:0031514) |
| 0.3 | 14.5 | GO:0031463 | Cul3-RING ubiquitin ligase complex(GO:0031463) |
| 0.3 | 3.1 | GO:0032433 | filopodium tip(GO:0032433) |
| 0.3 | 3.1 | GO:0044666 | MLL3/4 complex(GO:0044666) |
| 0.3 | 32.7 | GO:0000793 | condensed chromosome(GO:0000793) |
| 0.3 | 5.7 | GO:0031932 | TORC2 complex(GO:0031932) TOR complex(GO:0038201) |
| 0.3 | 7.1 | GO:0031231 | integral component of peroxisomal membrane(GO:0005779) intrinsic component of peroxisomal membrane(GO:0031231) |
| 0.3 | 6.8 | GO:0000314 | organellar small ribosomal subunit(GO:0000314) mitochondrial small ribosomal subunit(GO:0005763) |
| 0.2 | 11.7 | GO:0001533 | cornified envelope(GO:0001533) |
| 0.2 | 216.0 | GO:0048471 | perinuclear region of cytoplasm(GO:0048471) |
| 0.2 | 1.4 | GO:0031466 | Cul5-RING ubiquitin ligase complex(GO:0031466) |
| 0.2 | 1.9 | GO:0016011 | dystroglycan complex(GO:0016011) sarcoglycan complex(GO:0016012) |
| 0.2 | 4.7 | GO:0043205 | microfibril(GO:0001527) fibril(GO:0043205) |
| 0.2 | 2.5 | GO:0035692 | macrophage migration inhibitory factor receptor complex(GO:0035692) |
| 0.2 | 1.5 | GO:0044754 | autolysosome(GO:0044754) |
| 0.2 | 7.9 | GO:0008180 | COP9 signalosome(GO:0008180) |
| 0.2 | 2.3 | GO:0005638 | lamin filament(GO:0005638) |
| 0.2 | 2.6 | GO:0097470 | ribbon synapse(GO:0097470) |
| 0.2 | 12.9 | GO:0031672 | A band(GO:0031672) |
| 0.2 | 2.0 | GO:0005751 | mitochondrial respiratory chain complex IV(GO:0005751) |
| 0.2 | 2.8 | GO:0005720 | nuclear heterochromatin(GO:0005720) |
| 0.2 | 1.3 | GO:0033093 | Weibel-Palade body(GO:0033093) |
| 0.2 | 1.7 | GO:0032039 | integrator complex(GO:0032039) |
| 0.2 | 16.0 | GO:0016363 | nuclear matrix(GO:0016363) |
| 0.1 | 1.8 | GO:0071782 | endoplasmic reticulum tubular network(GO:0071782) |
| 0.1 | 3.7 | GO:0005865 | striated muscle thin filament(GO:0005865) |
| 0.1 | 8.4 | GO:0005811 | lipid particle(GO:0005811) |
| 0.1 | 1.5 | GO:0030126 | COPI vesicle coat(GO:0030126) |
| 0.1 | 4.4 | GO:0000307 | cyclin-dependent protein kinase holoenzyme complex(GO:0000307) |
| 0.1 | 8.7 | GO:0031970 | organelle envelope lumen(GO:0031970) |
| 0.1 | 6.6 | GO:0001669 | acrosomal vesicle(GO:0001669) |
| 0.1 | 9.1 | GO:0000781 | chromosome, telomeric region(GO:0000781) |
| 0.1 | 1.0 | GO:0043083 | synaptic cleft(GO:0043083) |
| 0.1 | 43.8 | GO:0031966 | mitochondrial membrane(GO:0031966) |
| 0.1 | 1.5 | GO:0030867 | rough endoplasmic reticulum membrane(GO:0030867) |
| 0.1 | 6.6 | GO:0031093 | platelet alpha granule lumen(GO:0031093) |
| 0.1 | 3.9 | GO:0000118 | histone deacetylase complex(GO:0000118) |
| 0.1 | 1.4 | GO:0032391 | photoreceptor connecting cilium(GO:0032391) |
| 0.1 | 6.2 | GO:0022625 | cytosolic large ribosomal subunit(GO:0022625) |
| 0.1 | 0.6 | GO:0005964 | phosphorylase kinase complex(GO:0005964) |
| 0.1 | 0.6 | GO:0098645 | network-forming collagen trimer(GO:0098642) collagen network(GO:0098645) |
| 0.1 | 0.9 | GO:0032982 | myosin filament(GO:0032982) |
| 0.0 | 4.7 | GO:0005840 | ribosome(GO:0005840) |
| 0.0 | 13.8 | GO:1990904 | ribonucleoprotein complex(GO:1990904) |
| 0.0 | 0.1 | GO:0070081 | clathrin-sculpted monoamine transport vesicle(GO:0070081) clathrin-sculpted monoamine transport vesicle membrane(GO:0070083) |
| 0.0 | 2.2 | GO:0005801 | cis-Golgi network(GO:0005801) |
| 0.0 | 1.3 | GO:0071564 | npBAF complex(GO:0071564) |
| 0.0 | 0.4 | GO:0033256 | I-kappaB/NF-kappaB complex(GO:0033256) |
| 0.0 | 2.4 | GO:0031985 | Golgi cisterna(GO:0031985) |
| 0.0 | 4.1 | GO:0005635 | nuclear envelope(GO:0005635) |
| 0.0 | 0.5 | GO:0005771 | multivesicular body(GO:0005771) |
Gene overrepresentation in molecular function category:
| Log-likelihood per target | Total log-likelihood | Term | Description |
|---|---|---|---|
| 13.1 | 39.2 | GO:0061505 | DNA topoisomerase type II (ATP-hydrolyzing) activity(GO:0003918) DNA topoisomerase II activity(GO:0061505) |
| 7.8 | 39.0 | GO:0050220 | prostaglandin-E synthase activity(GO:0050220) |
| 7.1 | 42.7 | GO:0061575 | cyclin-dependent protein serine/threonine kinase activator activity(GO:0061575) |
| 7.0 | 49.1 | GO:0004457 | lactate dehydrogenase activity(GO:0004457) L-lactate dehydrogenase activity(GO:0004459) |
| 6.8 | 54.4 | GO:0019237 | centromeric DNA binding(GO:0019237) |
| 6.3 | 25.2 | GO:0004748 | ribonucleoside-diphosphate reductase activity, thioredoxin disulfide as acceptor(GO:0004748) oxidoreductase activity, acting on CH or CH2 groups, disulfide as acceptor(GO:0016728) ribonucleoside-diphosphate reductase activity(GO:0061731) |
| 4.9 | 19.7 | GO:0004001 | adenosine kinase activity(GO:0004001) |
| 4.6 | 23.0 | GO:0043141 | ATP-dependent 5'-3' DNA helicase activity(GO:0043141) |
| 4.4 | 13.2 | GO:0004357 | glutamate-cysteine ligase activity(GO:0004357) |
| 4.2 | 37.5 | GO:0035174 | histone serine kinase activity(GO:0035174) |
| 3.9 | 23.1 | GO:0043023 | ribosomal large subunit binding(GO:0043023) |
| 3.8 | 22.9 | GO:0004839 | ubiquitin activating enzyme activity(GO:0004839) |
| 3.7 | 26.2 | GO:0060698 | endoribonuclease inhibitor activity(GO:0060698) |
| 3.7 | 11.2 | GO:0034189 | very-low-density lipoprotein particle binding(GO:0034189) |
| 3.6 | 25.2 | GO:0010997 | anaphase-promoting complex binding(GO:0010997) |
| 3.6 | 208.1 | GO:0008138 | protein tyrosine/serine/threonine phosphatase activity(GO:0008138) |
| 3.0 | 18.3 | GO:0016435 | rRNA (guanine) methyltransferase activity(GO:0016435) |
| 3.0 | 21.1 | GO:0046912 | transferase activity, transferring acyl groups, acyl groups converted into alkyl on transfer(GO:0046912) |
| 2.9 | 11.4 | GO:0047676 | arachidonate-CoA ligase activity(GO:0047676) |
| 2.9 | 8.6 | GO:0045131 | pre-mRNA branch point binding(GO:0045131) |
| 2.8 | 14.1 | GO:0008160 | protein tyrosine phosphatase activator activity(GO:0008160) |
| 2.6 | 7.8 | GO:0047012 | C-3 sterol dehydrogenase (C-4 sterol decarboxylase) activity(GO:0000252) sterol-4-alpha-carboxylate 3-dehydrogenase (decarboxylating) activity(GO:0047012) |
| 2.6 | 12.8 | GO:0004370 | glycerol kinase activity(GO:0004370) |
| 2.4 | 14.4 | GO:1990446 | U1 snRNP binding(GO:1990446) |
| 2.3 | 14.0 | GO:0035500 | MH2 domain binding(GO:0035500) |
| 2.2 | 10.9 | GO:0034647 | histone demethylase activity (H3-trimethyl-K4 specific)(GO:0034647) |
| 2.1 | 12.9 | GO:0032038 | myosin II heavy chain binding(GO:0032038) |
| 2.1 | 19.1 | GO:0050145 | nucleoside phosphate kinase activity(GO:0050145) |
| 2.0 | 10.2 | GO:0004694 | eukaryotic translation initiation factor 2alpha kinase activity(GO:0004694) |
| 2.0 | 8.1 | GO:0008311 | double-stranded DNA 3'-5' exodeoxyribonuclease activity(GO:0008311) |
| 2.0 | 14.1 | GO:0030620 | U2 snRNA binding(GO:0030620) |
| 1.9 | 7.7 | GO:0033265 | acetylcholinesterase activity(GO:0003990) choline binding(GO:0033265) |
| 1.9 | 5.6 | GO:0035248 | alpha-1,4-N-acetylgalactosaminyltransferase activity(GO:0035248) |
| 1.9 | 16.7 | GO:0034056 | estrogen response element binding(GO:0034056) |
| 1.8 | 24.7 | GO:0031386 | protein tag(GO:0031386) |
| 1.7 | 12.1 | GO:0102344 | 3-hydroxy-behenoyl-CoA dehydratase activity(GO:0102344) 3-hydroxy-lignoceroyl-CoA dehydratase activity(GO:0102345) |
| 1.7 | 10.3 | GO:0004749 | ribose phosphate diphosphokinase activity(GO:0004749) |
| 1.7 | 13.5 | GO:1990829 | C-rich single-stranded DNA binding(GO:1990829) |
| 1.7 | 11.6 | GO:0008821 | crossover junction endodeoxyribonuclease activity(GO:0008821) |
| 1.6 | 11.0 | GO:0005346 | adenine nucleotide transmembrane transporter activity(GO:0000295) purine ribonucleotide transmembrane transporter activity(GO:0005346) ATP transmembrane transporter activity(GO:0005347) purine nucleotide transmembrane transporter activity(GO:0015216) ADP transmembrane transporter activity(GO:0015217) |
| 1.5 | 16.9 | GO:0001135 | transcription factor activity, RNA polymerase II transcription factor recruiting(GO:0001135) |
| 1.5 | 10.7 | GO:0034513 | box H/ACA snoRNA binding(GO:0034513) |
| 1.5 | 69.9 | GO:0008139 | nuclear localization sequence binding(GO:0008139) |
| 1.5 | 8.8 | GO:0003998 | acylphosphatase activity(GO:0003998) |
| 1.3 | 4.0 | GO:0030618 | transforming growth factor beta receptor, pathway-specific cytoplasmic mediator activity(GO:0030618) |
| 1.3 | 60.3 | GO:0061631 | ubiquitin conjugating enzyme activity(GO:0061631) |
| 1.1 | 35.2 | GO:0042288 | MHC class I protein binding(GO:0042288) |
| 1.1 | 4.4 | GO:0019784 | NEDD8-specific protease activity(GO:0019784) |
| 1.1 | 41.0 | GO:0044183 | protein binding involved in protein folding(GO:0044183) |
| 1.0 | 9.2 | GO:0030621 | U4 snRNA binding(GO:0030621) |
| 1.0 | 5.1 | GO:0032795 | heterotrimeric G-protein binding(GO:0032795) |
| 1.0 | 3.0 | GO:0004584 | dolichyl-phosphate-mannose-glycolipid alpha-mannosyltransferase activity(GO:0004584) |
| 1.0 | 11.7 | GO:1990247 | N6-methyladenosine-containing RNA binding(GO:1990247) |
| 1.0 | 11.7 | GO:0030280 | structural constituent of epidermis(GO:0030280) |
| 0.9 | 8.5 | GO:0004017 | adenylate kinase activity(GO:0004017) |
| 0.9 | 5.6 | GO:0010465 | nerve growth factor receptor activity(GO:0010465) |
| 0.9 | 1.8 | GO:0004376 | glycolipid mannosyltransferase activity(GO:0004376) |
| 0.9 | 62.3 | GO:0004004 | ATP-dependent RNA helicase activity(GO:0004004) |
| 0.9 | 7.0 | GO:0008269 | JAK pathway signal transduction adaptor activity(GO:0008269) |
| 0.9 | 2.6 | GO:0004597 | peptide-aspartate beta-dioxygenase activity(GO:0004597) |
| 0.9 | 11.2 | GO:0017056 | structural constituent of nuclear pore(GO:0017056) |
| 0.8 | 23.5 | GO:0070003 | threonine-type endopeptidase activity(GO:0004298) threonine-type peptidase activity(GO:0070003) |
| 0.8 | 10.8 | GO:0046790 | virion binding(GO:0046790) |
| 0.8 | 10.7 | GO:0042975 | peroxisome proliferator activated receptor binding(GO:0042975) |
| 0.8 | 5.7 | GO:0017050 | sphinganine kinase activity(GO:0008481) D-erythro-sphingosine kinase activity(GO:0017050) |
| 0.8 | 17.7 | GO:0008494 | translation activator activity(GO:0008494) |
| 0.8 | 11.9 | GO:0008140 | cAMP response element binding protein binding(GO:0008140) |
| 0.8 | 5.6 | GO:0003689 | DNA clamp loader activity(GO:0003689) protein-DNA loading ATPase activity(GO:0033170) |
| 0.8 | 16.2 | GO:0051537 | 2 iron, 2 sulfur cluster binding(GO:0051537) |
| 0.8 | 50.7 | GO:0019894 | kinesin binding(GO:0019894) |
| 0.8 | 22.6 | GO:0070410 | co-SMAD binding(GO:0070410) |
| 0.7 | 16.2 | GO:0008242 | omega peptidase activity(GO:0008242) |
| 0.7 | 4.3 | GO:0003960 | NADPH:quinone reductase activity(GO:0003960) |
| 0.7 | 11.5 | GO:0001054 | RNA polymerase I activity(GO:0001054) |
| 0.7 | 9.3 | GO:1990825 | sequence-specific mRNA binding(GO:1990825) |
| 0.7 | 5.7 | GO:0050733 | RS domain binding(GO:0050733) |
| 0.7 | 58.5 | GO:0004869 | cysteine-type endopeptidase inhibitor activity(GO:0004869) |
| 0.7 | 32.9 | GO:0050699 | WW domain binding(GO:0050699) |
| 0.6 | 9.5 | GO:0019871 | sodium channel inhibitor activity(GO:0019871) |
| 0.6 | 6.8 | GO:0070181 | small ribosomal subunit rRNA binding(GO:0070181) |
| 0.6 | 2.5 | GO:0015254 | glycerol channel activity(GO:0015254) |
| 0.6 | 10.8 | GO:0097602 | cullin family protein binding(GO:0097602) |
| 0.6 | 73.4 | GO:0043130 | ubiquitin binding(GO:0043130) |
| 0.6 | 11.6 | GO:0098748 | clathrin adaptor activity(GO:0035615) endocytic adaptor activity(GO:0098748) |
| 0.6 | 4.6 | GO:0015235 | cobalamin transporter activity(GO:0015235) |
| 0.5 | 6.6 | GO:0016423 | tRNA (guanine) methyltransferase activity(GO:0016423) |
| 0.5 | 2.6 | GO:0031544 | peptidyl-proline 3-dioxygenase activity(GO:0031544) |
| 0.5 | 2.5 | GO:0044729 | hemi-methylated DNA-binding(GO:0044729) |
| 0.5 | 9.5 | GO:0035925 | mRNA 3'-UTR AU-rich region binding(GO:0035925) |
| 0.5 | 18.4 | GO:0070577 | lysine-acetylated histone binding(GO:0070577) |
| 0.5 | 19.3 | GO:0019956 | chemokine binding(GO:0019956) |
| 0.5 | 23.6 | GO:0008137 | NADH dehydrogenase (ubiquinone) activity(GO:0008137) NADH dehydrogenase (quinone) activity(GO:0050136) |
| 0.5 | 17.3 | GO:0001671 | ATPase activator activity(GO:0001671) |
| 0.5 | 4.7 | GO:0042731 | PH domain binding(GO:0042731) |
| 0.5 | 1.4 | GO:0005136 | interleukin-4 receptor binding(GO:0005136) |
| 0.5 | 8.8 | GO:0004550 | nucleoside diphosphate kinase activity(GO:0004550) |
| 0.4 | 2.4 | GO:0004849 | uridine kinase activity(GO:0004849) |
| 0.4 | 4.9 | GO:0070087 | chromo shadow domain binding(GO:0070087) |
| 0.4 | 16.0 | GO:0030544 | Hsp70 protein binding(GO:0030544) |
| 0.4 | 2.6 | GO:0030267 | hydroxypyruvate reductase activity(GO:0016618) glyoxylate reductase (NADP) activity(GO:0030267) |
| 0.4 | 2.2 | GO:0004301 | epoxide hydrolase activity(GO:0004301) |
| 0.4 | 11.4 | GO:0016702 | oxidoreductase activity, acting on single donors with incorporation of molecular oxygen, incorporation of two atoms of oxygen(GO:0016702) |
| 0.4 | 1.1 | GO:0004040 | amidase activity(GO:0004040) fucose binding(GO:0042806) |
| 0.4 | 16.7 | GO:0005484 | SNAP receptor activity(GO:0005484) |
| 0.4 | 8.2 | GO:0050321 | tau-protein kinase activity(GO:0050321) |
| 0.3 | 5.8 | GO:0030983 | mismatched DNA binding(GO:0030983) |
| 0.3 | 4.4 | GO:0032407 | MutSalpha complex binding(GO:0032407) |
| 0.3 | 6.9 | GO:0000339 | RNA cap binding(GO:0000339) |
| 0.3 | 22.5 | GO:0030374 | ligand-dependent nuclear receptor transcription coactivator activity(GO:0030374) |
| 0.3 | 2.5 | GO:1990599 | 3' overhang single-stranded DNA endodeoxyribonuclease activity(GO:1990599) |
| 0.3 | 8.1 | GO:0008574 | ATP-dependent microtubule motor activity, plus-end-directed(GO:0008574) |
| 0.3 | 2.6 | GO:0019158 | glucokinase activity(GO:0004340) hexokinase activity(GO:0004396) fructokinase activity(GO:0008865) mannokinase activity(GO:0019158) |
| 0.3 | 0.8 | GO:0036033 | mediator complex binding(GO:0036033) |
| 0.3 | 0.5 | GO:0004743 | pyruvate kinase activity(GO:0004743) |
| 0.3 | 8.0 | GO:0016538 | cyclin-dependent protein serine/threonine kinase regulator activity(GO:0016538) |
| 0.2 | 50.3 | GO:0003735 | structural constituent of ribosome(GO:0003735) |
| 0.2 | 2.7 | GO:0004791 | thioredoxin-disulfide reductase activity(GO:0004791) |
| 0.2 | 5.7 | GO:0043325 | phosphatidylinositol-3,4-bisphosphate binding(GO:0043325) |
| 0.2 | 22.0 | GO:0004867 | serine-type endopeptidase inhibitor activity(GO:0004867) |
| 0.2 | 4.8 | GO:0043422 | protein kinase B binding(GO:0043422) |
| 0.2 | 3.3 | GO:0031435 | mitogen-activated protein kinase kinase kinase binding(GO:0031435) |
| 0.2 | 1.9 | GO:0015321 | sodium-dependent phosphate transmembrane transporter activity(GO:0015321) |
| 0.2 | 8.7 | GO:0015175 | neutral amino acid transmembrane transporter activity(GO:0015175) |
| 0.2 | 3.7 | GO:0001965 | G-protein alpha-subunit binding(GO:0001965) |
| 0.2 | 1.8 | GO:0004897 | ciliary neurotrophic factor receptor activity(GO:0004897) |
| 0.2 | 8.6 | GO:0043531 | ADP binding(GO:0043531) |
| 0.2 | 5.6 | GO:0016628 | oxidoreductase activity, acting on the CH-CH group of donors, NAD or NADP as acceptor(GO:0016628) |
| 0.2 | 0.9 | GO:0017018 | myosin phosphatase activity(GO:0017018) |
| 0.2 | 3.8 | GO:0004190 | aspartic-type endopeptidase activity(GO:0004190) aspartic-type peptidase activity(GO:0070001) |
| 0.1 | 4.7 | GO:0005547 | phosphatidylinositol-3,4,5-trisphosphate binding(GO:0005547) |
| 0.1 | 23.9 | GO:0047485 | protein N-terminus binding(GO:0047485) |
| 0.1 | 7.7 | GO:0017112 | Rab guanyl-nucleotide exchange factor activity(GO:0017112) |
| 0.1 | 28.4 | GO:0061630 | ubiquitin protein ligase activity(GO:0061630) |
| 0.1 | 16.1 | GO:0032947 | protein complex scaffold(GO:0032947) |
| 0.1 | 0.4 | GO:0031849 | olfactory receptor binding(GO:0031849) |
| 0.1 | 4.6 | GO:0031369 | translation initiation factor binding(GO:0031369) |
| 0.1 | 3.7 | GO:0005523 | tropomyosin binding(GO:0005523) |
| 0.1 | 7.7 | GO:0015485 | cholesterol binding(GO:0015485) |
| 0.1 | 0.4 | GO:0070984 | SET domain binding(GO:0070984) |
| 0.1 | 4.4 | GO:0017025 | TBP-class protein binding(GO:0017025) |
| 0.1 | 24.2 | GO:0004842 | ubiquitin-protein transferase activity(GO:0004842) |
| 0.1 | 9.6 | GO:0005496 | steroid binding(GO:0005496) |
| 0.1 | 1.0 | GO:0051525 | NFAT protein binding(GO:0051525) |
| 0.1 | 9.1 | GO:0004527 | exonuclease activity(GO:0004527) |
| 0.1 | 0.6 | GO:0004689 | phosphorylase kinase activity(GO:0004689) |
| 0.1 | 3.1 | GO:0051539 | 4 iron, 4 sulfur cluster binding(GO:0051539) |
| 0.1 | 1.5 | GO:0004862 | cAMP-dependent protein kinase inhibitor activity(GO:0004862) |
| 0.1 | 8.7 | GO:0016765 | transferase activity, transferring alkyl or aryl (other than methyl) groups(GO:0016765) |
| 0.1 | 31.3 | GO:0016887 | ATPase activity(GO:0016887) |
| 0.1 | 2.4 | GO:0070064 | proline-rich region binding(GO:0070064) |
| 0.1 | 1.4 | GO:0005176 | ErbB-2 class receptor binding(GO:0005176) |
| 0.1 | 2.0 | GO:0016875 | aminoacyl-tRNA ligase activity(GO:0004812) ligase activity, forming carbon-oxygen bonds(GO:0016875) ligase activity, forming aminoacyl-tRNA and related compounds(GO:0016876) |
| 0.1 | 5.7 | GO:0051082 | unfolded protein binding(GO:0051082) |
| 0.1 | 2.1 | GO:0005104 | fibroblast growth factor receptor binding(GO:0005104) |
| 0.1 | 7.9 | GO:0030165 | PDZ domain binding(GO:0030165) |
| 0.1 | 0.5 | GO:0005134 | interleukin-2 receptor binding(GO:0005134) |
| 0.1 | 0.6 | GO:0016015 | morphogen activity(GO:0016015) |
| 0.1 | 2.7 | GO:0016709 | oxidoreductase activity, acting on paired donors, with incorporation or reduction of molecular oxygen, NAD(P)H as one donor, and incorporation of one atom of oxygen(GO:0016709) |
| 0.1 | 1.6 | GO:0031489 | myosin V binding(GO:0031489) |
| 0.1 | 14.6 | GO:0005516 | calmodulin binding(GO:0005516) |
| 0.1 | 0.8 | GO:0050750 | low-density lipoprotein particle receptor binding(GO:0050750) |
| 0.1 | 2.4 | GO:0005080 | protein kinase C binding(GO:0005080) |
| 0.1 | 8.6 | GO:0005200 | structural constituent of cytoskeleton(GO:0005200) |
| 0.0 | 1.3 | GO:0016776 | phosphotransferase activity, phosphate group as acceptor(GO:0016776) |
| 0.0 | 2.3 | GO:0004722 | protein serine/threonine phosphatase activity(GO:0004722) |
| 0.0 | 0.2 | GO:0051998 | carboxyl-O-methyltransferase activity(GO:0010340) protein carboxyl O-methyltransferase activity(GO:0051998) |
| 0.0 | 0.5 | GO:0023026 | MHC class II protein complex binding(GO:0023026) |
| 0.0 | 0.6 | GO:0016864 | protein disulfide isomerase activity(GO:0003756) intramolecular oxidoreductase activity, transposing S-S bonds(GO:0016864) |
| 0.0 | 3.5 | GO:0004702 | receptor signaling protein serine/threonine kinase activity(GO:0004702) |
| 0.0 | 0.9 | GO:0070008 | serine-type exopeptidase activity(GO:0070008) |
| 0.0 | 0.1 | GO:0015222 | serotonin transmembrane transporter activity(GO:0015222) |
| 0.0 | 1.8 | GO:0048306 | calcium-dependent protein binding(GO:0048306) |
| 0.0 | 1.1 | GO:0051117 | ATPase binding(GO:0051117) |
| 0.0 | 1.9 | GO:0004984 | olfactory receptor activity(GO:0004984) |
| 0.0 | 2.5 | GO:0008017 | microtubule binding(GO:0008017) |
Gene overrepresentation in curated gene sets: canonical pathways category:
| Log-likelihood per target | Total log-likelihood | Term | Description |
|---|---|---|---|
| 2.2 | 131.6 | PID AURORA B PATHWAY | Aurora B signaling |
| 1.7 | 67.1 | PID SMAD2 3PATHWAY | Regulation of cytoplasmic and nuclear SMAD2/3 signaling |
| 1.4 | 90.2 | PID PLK1 PATHWAY | PLK1 signaling events |
| 1.2 | 58.3 | PID MYC PATHWAY | C-MYC pathway |
| 0.7 | 16.5 | PID HIF1A PATHWAY | Hypoxic and oxygen homeostasis regulation of HIF-1-alpha |
| 0.6 | 9.2 | SA REG CASCADE OF CYCLIN EXPR | Expression of cyclins regulates progression through the cell cycle by activating cyclin-dependent kinases. |
| 0.6 | 16.9 | PID BETA CATENIN DEG PATHWAY | Degradation of beta catenin |
| 0.5 | 47.7 | PID TELOMERASE PATHWAY | Regulation of Telomerase |
| 0.4 | 28.9 | PID DELTA NP63 PATHWAY | Validated transcriptional targets of deltaNp63 isoforms |
| 0.3 | 36.9 | PID AR PATHWAY | Coregulation of Androgen receptor activity |
| 0.3 | 27.0 | PID E2F PATHWAY | E2F transcription factor network |
| 0.3 | 16.9 | PID FRA PATHWAY | Validated transcriptional targets of AP1 family members Fra1 and Fra2 |
| 0.3 | 11.9 | PID TCR CALCIUM PATHWAY | Calcium signaling in the CD4+ TCR pathway |
| 0.3 | 12.1 | PID UPA UPAR PATHWAY | Urokinase-type plasminogen activator (uPA) and uPAR-mediated signaling |
| 0.3 | 13.9 | PID AR TF PATHWAY | Regulation of Androgen receptor activity |
| 0.2 | 27.1 | PID P75 NTR PATHWAY | p75(NTR)-mediated signaling |
| 0.2 | 13.7 | PID TCPTP PATHWAY | Signaling events mediated by TCPTP |
| 0.2 | 5.7 | PID S1P S1P1 PATHWAY | S1P1 pathway |
| 0.2 | 4.0 | PID ALK2 PATHWAY | ALK2 signaling events |
| 0.2 | 5.6 | PID AURORA A PATHWAY | Aurora A signaling |
| 0.2 | 34.2 | PID P53 DOWNSTREAM PATHWAY | Direct p53 effectors |
| 0.2 | 12.9 | PID TRKR PATHWAY | Neurotrophic factor-mediated Trk receptor signaling |
| 0.2 | 6.7 | PID IL6 7 PATHWAY | IL6-mediated signaling events |
| 0.2 | 5.7 | PID CXCR3 PATHWAY | CXCR3-mediated signaling events |
| 0.2 | 11.5 | PID HIF1 TFPATHWAY | HIF-1-alpha transcription factor network |
| 0.1 | 2.5 | PID AVB3 OPN PATHWAY | Osteopontin-mediated events |
| 0.1 | 4.0 | PID HIF2PATHWAY | HIF-2-alpha transcription factor network |
| 0.1 | 1.7 | PID IL2 1PATHWAY | IL2-mediated signaling events |
| 0.1 | 4.3 | ST ADRENERGIC | Adrenergic Pathway |
| 0.1 | 1.5 | PID AR NONGENOMIC PATHWAY | Nongenotropic Androgen signaling |
| 0.1 | 2.3 | PID ATM PATHWAY | ATM pathway |
| 0.1 | 1.0 | PID ERB GENOMIC PATHWAY | Validated nuclear estrogen receptor beta network |
| 0.1 | 4.7 | SIG INSULIN RECEPTOR PATHWAY IN CARDIAC MYOCYTES | Genes related to the insulin receptor pathway |
| 0.1 | 3.9 | SIG REGULATION OF THE ACTIN CYTOSKELETON BY RHO GTPASES | Genes related to regulation of the actin cytoskeleton |
| 0.1 | 1.0 | PID IL2 STAT5 PATHWAY | IL2 signaling events mediated by STAT5 |
| 0.1 | 5.2 | PID BETA CATENIN NUC PATHWAY | Regulation of nuclear beta catenin signaling and target gene transcription |
| 0.1 | 4.2 | PID HDAC CLASSI PATHWAY | Signaling events mediated by HDAC Class I |
| 0.1 | 0.8 | PID FOXM1 PATHWAY | FOXM1 transcription factor network |
| 0.0 | 3.2 | WNT SIGNALING | Genes related to Wnt-mediated signal transduction |
| 0.0 | 1.5 | PID CASPASE PATHWAY | Caspase cascade in apoptosis |
| 0.0 | 1.0 | PID RHOA PATHWAY | RhoA signaling pathway |
| 0.0 | 5.5 | NABA ECM GLYCOPROTEINS | Genes encoding structural ECM glycoproteins |
Gene overrepresentation in curated gene sets: REACTOME pathways category:
| Log-likelihood per target | Total log-likelihood | Term | Description |
|---|---|---|---|
| 3.1 | 34.3 | REACTOME APOBEC3G MEDIATED RESISTANCE TO HIV1 INFECTION | Genes involved in APOBEC3G mediated resistance to HIV-1 infection |
| 1.8 | 178.2 | REACTOME APC C CDH1 MEDIATED DEGRADATION OF CDC20 AND OTHER APC C CDH1 TARGETED PROTEINS IN LATE MITOSIS EARLY G1 | Genes involved in APC/C:Cdh1 mediated degradation of Cdc20 and other APC/C:Cdh1 targeted proteins in late mitosis/early G1 |
| 1.7 | 62.3 | REACTOME TRANSPORT OF RIBONUCLEOPROTEINS INTO THE HOST NUCLEUS | Genes involved in Transport of Ribonucleoproteins into the Host Nucleus |
| 1.5 | 41.3 | REACTOME KINESINS | Genes involved in Kinesins |
| 1.4 | 12.2 | REACTOME SCF BETA TRCP MEDIATED DEGRADATION OF EMI1 | Genes involved in SCF-beta-TrCP mediated degradation of Emi1 |
| 1.1 | 19.4 | REACTOME G2 M DNA DAMAGE CHECKPOINT | Genes involved in G2/M DNA damage checkpoint |
| 1.1 | 72.0 | REACTOME ANTIVIRAL MECHANISM BY IFN STIMULATED GENES | Genes involved in Antiviral mechanism by IFN-stimulated genes |
| 1.0 | 33.7 | REACTOME SYNTHESIS AND INTERCONVERSION OF NUCLEOTIDE DI AND TRIPHOSPHATES | Genes involved in Synthesis and interconversion of nucleotide di- and triphosphates |
| 0.9 | 9.2 | REACTOME ORC1 REMOVAL FROM CHROMATIN | Genes involved in Orc1 removal from chromatin |
| 0.9 | 27.2 | REACTOME FORMATION OF TUBULIN FOLDING INTERMEDIATES BY CCT TRIC | Genes involved in Formation of tubulin folding intermediates by CCT/TriC |
| 0.8 | 7.3 | REACTOME CYTOSOLIC TRNA AMINOACYLATION | Genes involved in Cytosolic tRNA aminoacylation |
| 0.8 | 16.8 | REACTOME DEPOSITION OF NEW CENPA CONTAINING NUCLEOSOMES AT THE CENTROMERE | Genes involved in Deposition of New CENPA-containing Nucleosomes at the Centromere |
| 0.8 | 23.0 | REACTOME EXTENSION OF TELOMERES | Genes involved in Extension of Telomeres |
| 0.8 | 30.8 | REACTOME ACTIVATION OF ATR IN RESPONSE TO REPLICATION STRESS | Genes involved in Activation of ATR in response to replication stress |
| 0.7 | 29.7 | REACTOME FATTY ACYL COA BIOSYNTHESIS | Genes involved in Fatty Acyl-CoA Biosynthesis |
| 0.7 | 17.7 | REACTOME DEADENYLATION OF MRNA | Genes involved in Deadenylation of mRNA |
| 0.7 | 59.2 | REACTOME MITOTIC PROMETAPHASE | Genes involved in Mitotic Prometaphase |
| 0.7 | 15.9 | REACTOME PURINE SALVAGE | Genes involved in Purine salvage |
| 0.6 | 9.4 | REACTOME MEIOTIC RECOMBINATION | Genes involved in Meiotic Recombination |
| 0.5 | 13.2 | REACTOME SULFUR AMINO ACID METABOLISM | Genes involved in Sulfur amino acid metabolism |
| 0.5 | 11.5 | REACTOME RNA POL III CHAIN ELONGATION | Genes involved in RNA Polymerase III Chain Elongation |
| 0.5 | 16.7 | REACTOME SIGNALING BY FGFR1 FUSION MUTANTS | Genes involved in Signaling by FGFR1 fusion mutants |
| 0.5 | 20.8 | REACTOME CHOLESTEROL BIOSYNTHESIS | Genes involved in Cholesterol biosynthesis |
| 0.5 | 87.6 | REACTOME ANTIGEN PROCESSING UBIQUITINATION PROTEASOME DEGRADATION | Genes involved in Antigen processing: Ubiquitination & Proteasome degradation |
| 0.5 | 16.9 | REACTOME DOWNREGULATION OF SMAD2 3 SMAD4 TRANSCRIPTIONAL ACTIVITY | Genes involved in Downregulation of SMAD2/3:SMAD4 transcriptional activity |
| 0.5 | 9.7 | REACTOME METABOLISM OF POLYAMINES | Genes involved in Metabolism of polyamines |
| 0.5 | 6.7 | REACTOME ACTIVATION OF CHAPERONE GENES BY ATF6 ALPHA | Genes involved in Activation of Chaperone Genes by ATF6-alpha |
| 0.5 | 11.2 | REACTOME ADVANCED GLYCOSYLATION ENDPRODUCT RECEPTOR SIGNALING | Genes involved in Advanced glycosylation endproduct receptor signaling |
| 0.5 | 13.5 | REACTOME NEGATIVE REGULATORS OF RIG I MDA5 SIGNALING | Genes involved in Negative regulators of RIG-I/MDA5 signaling |
| 0.4 | 11.6 | REACTOME RETROGRADE NEUROTROPHIN SIGNALLING | Genes involved in Retrograde neurotrophin signalling |
| 0.4 | 30.6 | REACTOME LOSS OF NLP FROM MITOTIC CENTROSOMES | Genes involved in Loss of Nlp from mitotic centrosomes |
| 0.4 | 4.1 | REACTOME PREFOLDIN MEDIATED TRANSFER OF SUBSTRATE TO CCT TRIC | Genes involved in Prefoldin mediated transfer of substrate to CCT/TriC |
| 0.4 | 8.1 | REACTOME RESOLUTION OF AP SITES VIA THE MULTIPLE NUCLEOTIDE PATCH REPLACEMENT PATHWAY | Genes involved in Resolution of AP sites via the multiple-nucleotide patch replacement pathway |
| 0.4 | 7.7 | REACTOME SYNTHESIS SECRETION AND DEACYLATION OF GHRELIN | Genes involved in Synthesis, Secretion, and Deacylation of Ghrelin |
| 0.3 | 6.2 | REACTOME HOMOLOGOUS RECOMBINATION REPAIR OF REPLICATION INDEPENDENT DOUBLE STRAND BREAKS | Genes involved in Homologous recombination repair of replication-independent double-strand breaks |
| 0.3 | 5.6 | REACTOME MRNA SPLICING MINOR PATHWAY | Genes involved in mRNA Splicing - Minor Pathway |
| 0.3 | 14.4 | REACTOME RNA POL II TRANSCRIPTION PRE INITIATION AND PROMOTER OPENING | Genes involved in RNA Polymerase II Transcription Pre-Initiation And Promoter Opening |
| 0.3 | 25.1 | REACTOME RESPIRATORY ELECTRON TRANSPORT | Genes involved in Respiratory electron transport |
| 0.3 | 5.7 | REACTOME ASSOCIATION OF TRIC CCT WITH TARGET PROTEINS DURING BIOSYNTHESIS | Genes involved in Association of TriC/CCT with target proteins during biosynthesis |
| 0.3 | 14.6 | REACTOME INTRINSIC PATHWAY FOR APOPTOSIS | Genes involved in Intrinsic Pathway for Apoptosis |
| 0.3 | 15.7 | REACTOME REGULATION OF MRNA STABILITY BY PROTEINS THAT BIND AU RICH ELEMENTS | Genes involved in Regulation of mRNA Stability by Proteins that Bind AU-rich Elements |
| 0.3 | 6.9 | REACTOME METABOLISM OF NON CODING RNA | Genes involved in Metabolism of non-coding RNA |
| 0.2 | 1.1 | REACTOME SLBP DEPENDENT PROCESSING OF REPLICATION DEPENDENT HISTONE PRE MRNAS | Genes involved in SLBP Dependent Processing of Replication-Dependent Histone Pre-mRNAs |
| 0.2 | 4.9 | REACTOME SYNTHESIS OF GLYCOSYLPHOSPHATIDYLINOSITOL GPI | Genes involved in Synthesis of glycosylphosphatidylinositol (GPI) |
| 0.2 | 13.9 | REACTOME NOTCH1 INTRACELLULAR DOMAIN REGULATES TRANSCRIPTION | Genes involved in NOTCH1 Intracellular Domain Regulates Transcription |
| 0.2 | 13.1 | REACTOME STRIATED MUSCLE CONTRACTION | Genes involved in Striated Muscle Contraction |
| 0.2 | 20.5 | REACTOME MRNA SPLICING | Genes involved in mRNA Splicing |
| 0.2 | 2.5 | REACTOME PASSIVE TRANSPORT BY AQUAPORINS | Genes involved in Passive Transport by Aquaporins |
| 0.2 | 8.7 | REACTOME AMINO ACID TRANSPORT ACROSS THE PLASMA MEMBRANE | Genes involved in Amino acid transport across the plasma membrane |
| 0.2 | 4.0 | REACTOME SIGNALING BY BMP | Genes involved in Signaling by BMP |
| 0.2 | 2.6 | REACTOME GLUCOSE TRANSPORT | Genes involved in Glucose transport |
| 0.1 | 1.5 | REACTOME COPI MEDIATED TRANSPORT | Genes involved in COPI Mediated Transport |
| 0.1 | 1.8 | REACTOME PYRIMIDINE CATABOLISM | Genes involved in Pyrimidine catabolism |
| 0.1 | 2.9 | REACTOME TRIGLYCERIDE BIOSYNTHESIS | Genes involved in Triglyceride Biosynthesis |
| 0.1 | 1.5 | REACTOME HORMONE LIGAND BINDING RECEPTORS | Genes involved in Hormone ligand-binding receptors |
| 0.1 | 3.6 | REACTOME G1 PHASE | Genes involved in G1 Phase |
| 0.1 | 2.5 | REACTOME HYALURONAN UPTAKE AND DEGRADATION | Genes involved in Hyaluronan uptake and degradation |
| 0.1 | 3.9 | REACTOME PIP3 ACTIVATES AKT SIGNALING | Genes involved in PIP3 activates AKT signaling |
| 0.1 | 1.8 | REACTOME TETRAHYDROBIOPTERIN BH4 SYNTHESIS RECYCLING SALVAGE AND REGULATION | Genes involved in Tetrahydrobiopterin (BH4) synthesis, recycling, salvage and regulation |
| 0.1 | 1.5 | REACTOME SYNTHESIS OF PIPS AT THE LATE ENDOSOME MEMBRANE | Genes involved in Synthesis of PIPs at the late endosome membrane |
| 0.1 | 2.1 | REACTOME ACTIVATED POINT MUTANTS OF FGFR2 | Genes involved in Activated point mutants of FGFR2 |
| 0.1 | 1.4 | REACTOME DOWNREGULATION OF ERBB2 ERBB3 SIGNALING | Genes involved in Downregulation of ERBB2:ERBB3 signaling |
| 0.1 | 1.3 | REACTOME INSULIN SYNTHESIS AND PROCESSING | Genes involved in Insulin Synthesis and Processing |
| 0.0 | 7.4 | REACTOME SRP DEPENDENT COTRANSLATIONAL PROTEIN TARGETING TO MEMBRANE | Genes involved in SRP-dependent cotranslational protein targeting to membrane |
| 0.0 | 0.9 | REACTOME REGULATION OF INSULIN LIKE GROWTH FACTOR IGF ACTIVITY BY INSULIN LIKE GROWTH FACTOR BINDING PROTEINS IGFBPS | Genes involved in Regulation of Insulin-like Growth Factor (IGF) Activity by Insulin-like Growth Factor Binding Proteins (IGFBPs) |
| 0.0 | 0.6 | REACTOME GLYCOGEN BREAKDOWN GLYCOGENOLYSIS | Genes involved in Glycogen breakdown (glycogenolysis) |
| 0.0 | 2.1 | REACTOME METABOLISM OF VITAMINS AND COFACTORS | Genes involved in Metabolism of vitamins and cofactors |
| 0.0 | 0.2 | REACTOME SPRY REGULATION OF FGF SIGNALING | Genes involved in Spry regulation of FGF signaling |
| 0.0 | 0.5 | REACTOME REGULATION OF GENE EXPRESSION IN BETA CELLS | Genes involved in Regulation of gene expression in beta cells |