Project
GNF SymAtlas + NCI-60 cancer cell lines, human (Su, 2004; Ross, 2000)
Navigation
Downloads
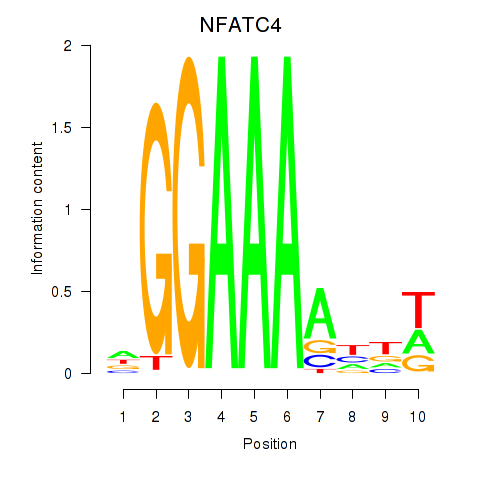
Results for NFATC4
Z-value: 1.07
Motif logo
Transcription factors associated with NFATC4
| Gene Symbol | Gene ID | Gene Info |
|---|---|---|
|
NFATC4
|
ENSG00000100968.14 | NFATC4 |
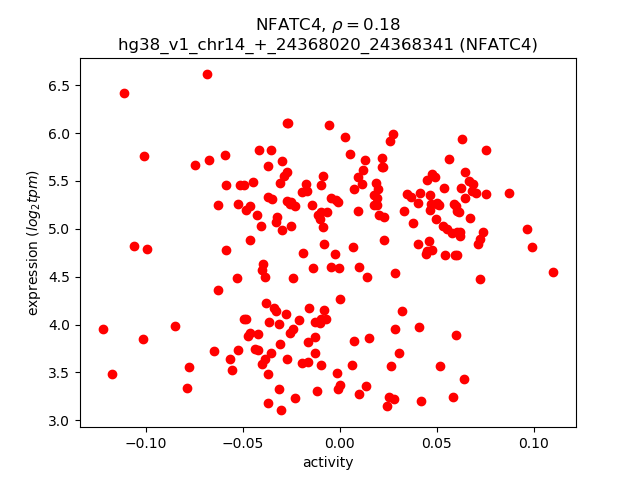
Activity-expression correlation:
| Gene | Promoter | Pearson corr. coef. | P-value | Plot |
|---|---|---|---|---|
| NFATC4 | hg38_v1_chr14_+_24368020_24368341 | 0.18 | 9.0e-03 | Click! |
Activity profile of NFATC4 motif
Sorted Z-values of NFATC4 motif
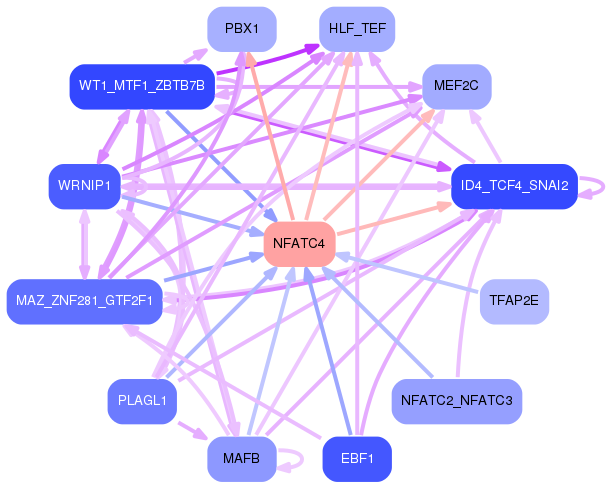
Network of associatons between targets according to the STRING database.

First level regulatory network of NFATC4
Gene Ontology Analysis
Gene overrepresentation in biological process category:
| Log-likelihood per target | Total log-likelihood | Term | Description |
|---|---|---|---|
| 5.8 | 23.1 | GO:0001519 | peptide amidation(GO:0001519) protein amidation(GO:0018032) peptide modification(GO:0031179) |
| 4.9 | 14.8 | GO:0051946 | regulation of amino acid uptake involved in synaptic transmission(GO:0051941) regulation of glutamate uptake involved in transmission of nerve impulse(GO:0051946) regulation of L-glutamate import(GO:1900920) |
| 4.5 | 13.6 | GO:1900226 | positive regulation of oocyte maturation(GO:1900195) negative regulation of NLRP3 inflammasome complex assembly(GO:1900226) positive regulation of proteasomal ubiquitin-dependent protein catabolic process involved in cellular response to hypoxia(GO:2000777) |
| 3.8 | 11.3 | GO:0001869 | regulation of complement activation, lectin pathway(GO:0001868) negative regulation of complement activation, lectin pathway(GO:0001869) |
| 3.1 | 31.1 | GO:0071787 | endoplasmic reticulum tubular network assembly(GO:0071787) |
| 2.5 | 7.5 | GO:0050653 | chondroitin sulfate proteoglycan biosynthetic process, polysaccharide chain biosynthetic process(GO:0050653) |
| 2.3 | 7.0 | GO:0006210 | pyrimidine nucleobase catabolic process(GO:0006208) thymine catabolic process(GO:0006210) thymine metabolic process(GO:0019859) |
| 2.3 | 6.9 | GO:0061357 | positive regulation of Wnt protein secretion(GO:0061357) |
| 2.3 | 9.0 | GO:0035790 | platelet-derived growth factor receptor-alpha signaling pathway(GO:0035790) |
| 2.1 | 6.3 | GO:0001757 | somite specification(GO:0001757) |
| 2.0 | 6.0 | GO:1902905 | positive regulation of fibril organization(GO:1902905) |
| 1.9 | 15.2 | GO:0001887 | selenium compound metabolic process(GO:0001887) |
| 1.7 | 5.2 | GO:1903892 | negative regulation of ATF6-mediated unfolded protein response(GO:1903892) |
| 1.6 | 3.3 | GO:0002036 | regulation of L-glutamate transport(GO:0002036) |
| 1.6 | 6.4 | GO:0033693 | neurofilament bundle assembly(GO:0033693) |
| 1.5 | 12.1 | GO:0003172 | primary heart field specification(GO:0003138) sinoatrial valve development(GO:0003172) sinoatrial valve morphogenesis(GO:0003185) |
| 1.5 | 4.5 | GO:1904933 | regulation of cell proliferation in midbrain(GO:1904933) |
| 1.5 | 5.8 | GO:2000393 | negative regulation of lamellipodium morphogenesis(GO:2000393) |
| 1.4 | 9.8 | GO:0070294 | renal sodium ion absorption(GO:0070294) |
| 1.4 | 8.1 | GO:0097338 | response to clozapine(GO:0097338) |
| 1.3 | 14.4 | GO:0090091 | positive regulation of extracellular matrix disassembly(GO:0090091) |
| 1.3 | 3.9 | GO:1902498 | regulation of protein autoubiquitination(GO:1902498) |
| 1.3 | 11.6 | GO:0042118 | endothelial cell activation(GO:0042118) |
| 1.3 | 6.4 | GO:1903906 | plasma membrane raft distribution(GO:0044855) plasma membrane raft localization(GO:0044856) plasma membrane raft polarization(GO:0044858) regulation of plasma membrane raft polarization(GO:1903906) |
| 1.3 | 15.2 | GO:0051612 | negative regulation of neurotransmitter uptake(GO:0051581) regulation of serotonin uptake(GO:0051611) negative regulation of serotonin uptake(GO:0051612) |
| 1.2 | 6.2 | GO:0018352 | protein-pyridoxal-5-phosphate linkage(GO:0018352) |
| 1.2 | 5.8 | GO:0001971 | negative regulation of activation of membrane attack complex(GO:0001971) |
| 1.1 | 6.8 | GO:1990034 | calcium ion export from cell(GO:1990034) |
| 1.1 | 10.1 | GO:0002175 | protein localization to paranode region of axon(GO:0002175) |
| 1.1 | 11.1 | GO:0036309 | protein localization to M-band(GO:0036309) protein localization to T-tubule(GO:0036371) |
| 1.1 | 5.5 | GO:1904566 | response to 1-oleoyl-sn-glycerol 3-phosphate(GO:1904565) cellular response to 1-oleoyl-sn-glycerol 3-phosphate(GO:1904566) |
| 1.1 | 3.2 | GO:1903033 | regulation of microtubule plus-end binding(GO:1903031) positive regulation of microtubule plus-end binding(GO:1903033) |
| 1.0 | 11.5 | GO:0008354 | germ cell migration(GO:0008354) |
| 0.9 | 8.5 | GO:0060125 | negative regulation of growth hormone secretion(GO:0060125) |
| 0.9 | 34.6 | GO:0008045 | motor neuron axon guidance(GO:0008045) |
| 0.8 | 3.2 | GO:2000639 | regulation of SREBP signaling pathway(GO:2000638) negative regulation of SREBP signaling pathway(GO:2000639) |
| 0.8 | 8.9 | GO:0008090 | retrograde axonal transport(GO:0008090) |
| 0.8 | 3.2 | GO:0002881 | negative regulation of chronic inflammatory response to non-antigenic stimulus(GO:0002881) |
| 0.8 | 4.5 | GO:0060414 | aorta smooth muscle tissue morphogenesis(GO:0060414) |
| 0.7 | 5.2 | GO:0010724 | regulation of definitive erythrocyte differentiation(GO:0010724) |
| 0.7 | 6.5 | GO:0061343 | cell adhesion involved in heart morphogenesis(GO:0061343) |
| 0.7 | 14.0 | GO:0034389 | lipid particle organization(GO:0034389) |
| 0.7 | 2.8 | GO:0002357 | defense response to tumor cell(GO:0002357) |
| 0.7 | 2.0 | GO:1901842 | negative regulation of high voltage-gated calcium channel activity(GO:1901842) |
| 0.6 | 3.1 | GO:0001957 | intramembranous ossification(GO:0001957) direct ossification(GO:0036072) |
| 0.6 | 2.5 | GO:0031117 | positive regulation of microtubule depolymerization(GO:0031117) |
| 0.6 | 4.9 | GO:0006987 | activation of signaling protein activity involved in unfolded protein response(GO:0006987) |
| 0.6 | 1.7 | GO:0002503 | peptide antigen assembly with MHC class II protein complex(GO:0002503) |
| 0.6 | 1.7 | GO:0034183 | negative regulation of maintenance of sister chromatid cohesion(GO:0034092) negative regulation of maintenance of mitotic sister chromatid cohesion(GO:0034183) maintenance of mitotic sister chromatid cohesion, telomeric(GO:0099403) mitotic sister chromatid cohesion, telomeric(GO:0099404) regulation of maintenance of mitotic sister chromatid cohesion, telomeric(GO:1904907) negative regulation of maintenance of mitotic sister chromatid cohesion, telomeric(GO:1904908) |
| 0.6 | 2.2 | GO:0022614 | membrane to membrane docking(GO:0022614) |
| 0.5 | 12.6 | GO:0070262 | peptidyl-serine dephosphorylation(GO:0070262) |
| 0.5 | 1.5 | GO:1904440 | regulation of antigen processing and presentation of peptide antigen via MHC class I(GO:0002589) negative regulation of antigen processing and presentation of peptide antigen via MHC class I(GO:0002590) regulation of T cell antigen processing and presentation(GO:0002625) positive regulation of iron ion transport(GO:0034758) positive regulation of iron ion transmembrane transport(GO:0034761) regulation of iron ion import(GO:1900390) regulation of ferrous iron import into cell(GO:1903989) positive regulation of ferrous iron import into cell(GO:1903991) regulation of ferrous iron binding(GO:1904432) positive regulation of ferrous iron binding(GO:1904434) regulation of transferrin receptor binding(GO:1904435) positive regulation of transferrin receptor binding(GO:1904437) regulation of ferrous iron import across plasma membrane(GO:1904438) positive regulation of ferrous iron import across plasma membrane(GO:1904440) response to iron ion starvation(GO:1990641) |
| 0.5 | 2.4 | GO:0097498 | endothelial tube lumen extension(GO:0097498) |
| 0.5 | 13.3 | GO:0032012 | regulation of ARF protein signal transduction(GO:0032012) |
| 0.4 | 5.6 | GO:1904321 | response to forskolin(GO:1904321) cellular response to forskolin(GO:1904322) |
| 0.4 | 2.5 | GO:0042780 | tRNA 3'-end processing(GO:0042780) |
| 0.4 | 1.2 | GO:0033861 | negative regulation of NAD(P)H oxidase activity(GO:0033861) |
| 0.4 | 6.6 | GO:0038003 | opioid receptor signaling pathway(GO:0038003) regulation of short-term neuronal synaptic plasticity(GO:0048172) |
| 0.4 | 6.2 | GO:0007016 | cytoskeletal anchoring at plasma membrane(GO:0007016) |
| 0.4 | 4.5 | GO:0034501 | protein localization to kinetochore(GO:0034501) |
| 0.4 | 12.0 | GO:0010971 | positive regulation of G2/M transition of mitotic cell cycle(GO:0010971) embryonic hemopoiesis(GO:0035162) |
| 0.4 | 5.6 | GO:0048387 | negative regulation of retinoic acid receptor signaling pathway(GO:0048387) |
| 0.4 | 6.3 | GO:1904776 | regulation of protein localization to cell cortex(GO:1904776) positive regulation of protein localization to cell cortex(GO:1904778) |
| 0.4 | 2.3 | GO:0071105 | response to interleukin-11(GO:0071105) |
| 0.4 | 1.1 | GO:0070317 | negative regulation of G0 to G1 transition(GO:0070317) |
| 0.4 | 2.5 | GO:0097101 | blood vessel endothelial cell fate commitment(GO:0060846) endothelial cell fate specification(GO:0060847) blood vessel endothelial cell fate specification(GO:0097101) |
| 0.3 | 4.5 | GO:0045008 | depyrimidination(GO:0045008) |
| 0.3 | 3.4 | GO:1900028 | negative regulation of ruffle assembly(GO:1900028) |
| 0.3 | 3.0 | GO:0043402 | glucocorticoid mediated signaling pathway(GO:0043402) |
| 0.3 | 8.7 | GO:0097150 | neuronal stem cell population maintenance(GO:0097150) |
| 0.3 | 2.6 | GO:0045602 | negative regulation of endothelial cell differentiation(GO:0045602) |
| 0.3 | 6.0 | GO:0015671 | oxygen transport(GO:0015671) |
| 0.3 | 0.9 | GO:0061394 | regulation of transcription from RNA polymerase II promoter in response to arsenic-containing substance(GO:0061394) |
| 0.3 | 1.6 | GO:0031999 | negative regulation of fatty acid beta-oxidation(GO:0031999) malonyl-CoA biosynthetic process(GO:2001295) |
| 0.3 | 5.3 | GO:0035563 | positive regulation of chromatin binding(GO:0035563) |
| 0.3 | 11.4 | GO:0048665 | neuron fate specification(GO:0048665) |
| 0.3 | 5.5 | GO:0010826 | negative regulation of centrosome duplication(GO:0010826) |
| 0.3 | 0.6 | GO:0070093 | negative regulation of glucagon secretion(GO:0070093) |
| 0.3 | 4.6 | GO:0006516 | glycoprotein catabolic process(GO:0006516) |
| 0.3 | 3.3 | GO:0032224 | positive regulation of synaptic transmission, cholinergic(GO:0032224) |
| 0.3 | 21.0 | GO:0043268 | positive regulation of potassium ion transport(GO:0043268) |
| 0.3 | 7.8 | GO:0043968 | histone H2A acetylation(GO:0043968) |
| 0.3 | 23.5 | GO:0007218 | neuropeptide signaling pathway(GO:0007218) |
| 0.3 | 3.8 | GO:0015074 | DNA integration(GO:0015074) |
| 0.3 | 10.7 | GO:0000188 | inactivation of MAPK activity(GO:0000188) |
| 0.3 | 0.5 | GO:1901420 | negative regulation of response to alcohol(GO:1901420) |
| 0.2 | 2.0 | GO:0060158 | phospholipase C-activating dopamine receptor signaling pathway(GO:0060158) |
| 0.2 | 2.2 | GO:0045217 | macrophage colony-stimulating factor signaling pathway(GO:0038145) cell-cell junction maintenance(GO:0045217) |
| 0.2 | 1.7 | GO:0035672 | oligopeptide transmembrane transport(GO:0035672) |
| 0.2 | 11.0 | GO:0071377 | cellular response to glucagon stimulus(GO:0071377) |
| 0.2 | 2.6 | GO:0034983 | peptidyl-lysine deacetylation(GO:0034983) histone H4 deacetylation(GO:0070933) |
| 0.2 | 3.1 | GO:0050884 | neuromuscular process controlling posture(GO:0050884) |
| 0.2 | 2.1 | GO:1903817 | negative regulation of delayed rectifier potassium channel activity(GO:1902260) negative regulation of voltage-gated potassium channel activity(GO:1903817) |
| 0.2 | 1.6 | GO:0006701 | progesterone biosynthetic process(GO:0006701) |
| 0.2 | 2.0 | GO:0008272 | sulfate transport(GO:0008272) |
| 0.2 | 2.4 | GO:0035791 | platelet-derived growth factor receptor-beta signaling pathway(GO:0035791) |
| 0.2 | 1.7 | GO:1902474 | positive regulation of protein localization to synapse(GO:1902474) |
| 0.2 | 1.2 | GO:0050882 | voluntary musculoskeletal movement(GO:0050882) |
| 0.2 | 7.7 | GO:0051491 | positive regulation of filopodium assembly(GO:0051491) |
| 0.2 | 1.7 | GO:0097688 | AMPA glutamate receptor clustering(GO:0097113) glutamate receptor clustering(GO:0097688) |
| 0.2 | 1.7 | GO:0035970 | peptidyl-threonine dephosphorylation(GO:0035970) |
| 0.2 | 2.0 | GO:0051382 | kinetochore assembly(GO:0051382) |
| 0.2 | 3.5 | GO:0006957 | complement activation, alternative pathway(GO:0006957) |
| 0.2 | 13.2 | GO:0061178 | regulation of insulin secretion involved in cellular response to glucose stimulus(GO:0061178) |
| 0.2 | 0.3 | GO:0060032 | notochord regression(GO:0060032) |
| 0.2 | 2.6 | GO:0034356 | NAD biosynthesis via nicotinamide riboside salvage pathway(GO:0034356) |
| 0.2 | 4.1 | GO:0010842 | retina layer formation(GO:0010842) |
| 0.1 | 15.5 | GO:0007368 | determination of left/right symmetry(GO:0007368) |
| 0.1 | 22.9 | GO:0007156 | homophilic cell adhesion via plasma membrane adhesion molecules(GO:0007156) |
| 0.1 | 0.8 | GO:0032431 | diacylglycerol biosynthetic process(GO:0006651) activation of phospholipase A2 activity(GO:0032431) |
| 0.1 | 4.2 | GO:0032211 | negative regulation of telomere maintenance via telomerase(GO:0032211) |
| 0.1 | 2.8 | GO:0030277 | maintenance of gastrointestinal epithelium(GO:0030277) |
| 0.1 | 0.9 | GO:0034316 | negative regulation of Arp2/3 complex-mediated actin nucleation(GO:0034316) |
| 0.1 | 6.8 | GO:0007528 | neuromuscular junction development(GO:0007528) |
| 0.1 | 5.6 | GO:0046825 | regulation of protein export from nucleus(GO:0046825) |
| 0.1 | 1.0 | GO:0046856 | phosphatidylinositol dephosphorylation(GO:0046856) |
| 0.1 | 6.8 | GO:0031102 | neuron projection regeneration(GO:0031102) |
| 0.1 | 4.9 | GO:0032007 | negative regulation of TOR signaling(GO:0032007) |
| 0.1 | 3.5 | GO:0019433 | triglyceride catabolic process(GO:0019433) |
| 0.1 | 3.9 | GO:0071108 | protein K48-linked deubiquitination(GO:0071108) |
| 0.1 | 1.0 | GO:0098700 | neurotransmitter loading into synaptic vesicle(GO:0098700) |
| 0.1 | 0.5 | GO:0009822 | alkaloid catabolic process(GO:0009822) |
| 0.1 | 1.3 | GO:0032060 | bleb assembly(GO:0032060) |
| 0.1 | 1.3 | GO:0001514 | selenocysteine incorporation(GO:0001514) translational readthrough(GO:0006451) |
| 0.1 | 0.9 | GO:0042148 | strand invasion(GO:0042148) |
| 0.1 | 1.1 | GO:0019919 | peptidyl-arginine methylation, to asymmetrical-dimethyl arginine(GO:0019919) |
| 0.1 | 3.4 | GO:1903206 | negative regulation of hydrogen peroxide-induced cell death(GO:1903206) |
| 0.1 | 1.5 | GO:0061365 | positive regulation of triglyceride lipase activity(GO:0061365) |
| 0.1 | 0.6 | GO:0071477 | hypotonic salinity response(GO:0042539) cellular hypotonic salinity response(GO:0071477) |
| 0.1 | 7.8 | GO:0030574 | collagen catabolic process(GO:0030574) |
| 0.1 | 0.7 | GO:0015811 | L-cystine transport(GO:0015811) |
| 0.1 | 3.0 | GO:0042149 | cellular response to glucose starvation(GO:0042149) |
| 0.1 | 1.3 | GO:0000963 | mitochondrial RNA processing(GO:0000963) |
| 0.1 | 3.2 | GO:0061003 | positive regulation of dendritic spine morphogenesis(GO:0061003) |
| 0.1 | 4.2 | GO:0061512 | protein localization to cilium(GO:0061512) |
| 0.1 | 0.5 | GO:1904995 | negative regulation of leukocyte tethering or rolling(GO:1903237) negative regulation of leukocyte adhesion to vascular endothelial cell(GO:1904995) |
| 0.1 | 0.5 | GO:0002760 | positive regulation of antimicrobial peptide production(GO:0002225) positive regulation of antimicrobial humoral response(GO:0002760) positive regulation of antibacterial peptide production(GO:0002803) |
| 0.1 | 1.8 | GO:0099514 | anterograde synaptic vesicle transport(GO:0048490) synaptic vesicle cytoskeletal transport(GO:0099514) synaptic vesicle transport along microtubule(GO:0099517) |
| 0.1 | 6.0 | GO:0035914 | skeletal muscle cell differentiation(GO:0035914) |
| 0.1 | 1.6 | GO:0090005 | negative regulation of establishment of protein localization to plasma membrane(GO:0090005) |
| 0.1 | 1.0 | GO:0048251 | elastic fiber assembly(GO:0048251) |
| 0.1 | 4.1 | GO:0050771 | negative regulation of axonogenesis(GO:0050771) |
| 0.1 | 8.0 | GO:0043647 | inositol phosphate metabolic process(GO:0043647) |
| 0.1 | 2.0 | GO:0034508 | centromere complex assembly(GO:0034508) |
| 0.1 | 0.4 | GO:0070862 | negative regulation of protein exit from endoplasmic reticulum(GO:0070862) negative regulation of retrograde protein transport, ER to cytosol(GO:1904153) |
| 0.1 | 2.9 | GO:0010765 | positive regulation of sodium ion transport(GO:0010765) |
| 0.1 | 2.1 | GO:0070207 | protein homotrimerization(GO:0070207) |
| 0.1 | 0.6 | GO:0046940 | nucleoside monophosphate phosphorylation(GO:0046940) |
| 0.1 | 0.1 | GO:0051835 | positive regulation of synapse structural plasticity(GO:0051835) |
| 0.1 | 2.1 | GO:0031529 | ruffle organization(GO:0031529) |
| 0.1 | 2.5 | GO:0007214 | gamma-aminobutyric acid signaling pathway(GO:0007214) |
| 0.1 | 0.2 | GO:0036111 | very long-chain fatty-acyl-CoA metabolic process(GO:0036111) |
| 0.0 | 0.4 | GO:0018401 | peptidyl-proline hydroxylation to 4-hydroxy-L-proline(GO:0018401) |
| 0.0 | 2.0 | GO:1903959 | regulation of anion transmembrane transport(GO:1903959) |
| 0.0 | 0.6 | GO:0006703 | estrogen biosynthetic process(GO:0006703) |
| 0.0 | 0.7 | GO:0036150 | phosphatidylserine acyl-chain remodeling(GO:0036150) |
| 0.0 | 1.3 | GO:0071353 | cellular response to interleukin-4(GO:0071353) |
| 0.0 | 2.1 | GO:0032781 | positive regulation of ATPase activity(GO:0032781) |
| 0.0 | 0.1 | GO:0097491 | sympathetic neuron projection extension(GO:0097490) sympathetic neuron projection guidance(GO:0097491) semaphorin-plexin signaling pathway involved in neuron projection guidance(GO:1902285) |
| 0.0 | 3.3 | GO:0030449 | regulation of complement activation(GO:0030449) |
| 0.0 | 0.9 | GO:0051496 | positive regulation of stress fiber assembly(GO:0051496) |
| 0.0 | 0.4 | GO:0036109 | fatty acid beta-oxidation using acyl-CoA dehydrogenase(GO:0033539) alpha-linolenic acid metabolic process(GO:0036109) |
| 0.0 | 2.0 | GO:0006672 | ceramide metabolic process(GO:0006672) |
| 0.0 | 0.1 | GO:2000503 | positive regulation of natural killer cell chemotaxis(GO:2000503) |
| 0.0 | 2.0 | GO:1903955 | positive regulation of protein targeting to mitochondrion(GO:1903955) |
| 0.0 | 1.1 | GO:0045600 | positive regulation of fat cell differentiation(GO:0045600) |
| 0.0 | 0.4 | GO:0002323 | natural killer cell activation involved in immune response(GO:0002323) |
| 0.0 | 1.0 | GO:0007585 | respiratory gaseous exchange(GO:0007585) |
| 0.0 | 0.8 | GO:0031016 | pancreas development(GO:0031016) |
| 0.0 | 0.6 | GO:0000413 | protein peptidyl-prolyl isomerization(GO:0000413) |
Gene overrepresentation in cellular component category:
| Log-likelihood per target | Total log-likelihood | Term | Description |
|---|---|---|---|
| 2.5 | 7.6 | GO:0090571 | RNA polymerase II transcription repressor complex(GO:0090571) |
| 1.8 | 8.9 | GO:0031673 | H zone(GO:0031673) |
| 1.6 | 4.9 | GO:1990597 | AIP1-IRE1 complex(GO:1990597) |
| 1.5 | 13.6 | GO:0072687 | meiotic spindle(GO:0072687) |
| 1.2 | 31.1 | GO:0071782 | endoplasmic reticulum tubular network(GO:0071782) |
| 1.2 | 17.3 | GO:0097433 | dense body(GO:0097433) |
| 1.1 | 4.5 | GO:0000818 | nuclear MIS12/MIND complex(GO:0000818) |
| 1.1 | 4.2 | GO:1990879 | CST complex(GO:1990879) |
| 0.9 | 17.3 | GO:0031089 | platelet dense granule lumen(GO:0031089) |
| 0.9 | 11.2 | GO:0098647 | collagen type VI trimer(GO:0005589) collagen beaded filament(GO:0098647) |
| 0.8 | 13.4 | GO:0030285 | integral component of synaptic vesicle membrane(GO:0030285) intrinsic component of synaptic vesicle membrane(GO:0098563) |
| 0.8 | 14.8 | GO:0005890 | sodium:potassium-exchanging ATPase complex(GO:0005890) |
| 0.7 | 2.2 | GO:0071065 | alpha9-beta1 integrin-vascular cell adhesion molecule-1 complex(GO:0071065) |
| 0.7 | 6.3 | GO:0044294 | dendritic growth cone(GO:0044294) |
| 0.6 | 1.7 | GO:0031933 | telomeric heterochromatin(GO:0031933) |
| 0.6 | 10.1 | GO:0033270 | paranode region of axon(GO:0033270) |
| 0.5 | 3.2 | GO:1990452 | Parkin-FBXW7-Cul1 ubiquitin ligase complex(GO:1990452) |
| 0.5 | 5.0 | GO:0045180 | basal cortex(GO:0045180) |
| 0.5 | 6.0 | GO:0043240 | Fanconi anaemia nuclear complex(GO:0043240) |
| 0.5 | 6.2 | GO:0061200 | inhibitory synapse(GO:0060077) clathrin-sculpted gamma-aminobutyric acid transport vesicle(GO:0061200) clathrin-sculpted gamma-aminobutyric acid transport vesicle membrane(GO:0061202) |
| 0.5 | 6.0 | GO:0097413 | Lewy body(GO:0097413) |
| 0.4 | 6.4 | GO:0030478 | actin cap(GO:0030478) |
| 0.4 | 6.3 | GO:0008091 | spectrin(GO:0008091) |
| 0.4 | 11.6 | GO:0043218 | compact myelin(GO:0043218) |
| 0.4 | 8.1 | GO:0005952 | cAMP-dependent protein kinase complex(GO:0005952) |
| 0.4 | 5.6 | GO:0008074 | guanylate cyclase complex, soluble(GO:0008074) |
| 0.4 | 2.2 | GO:1990682 | CSF1-CSF1R complex(GO:1990682) |
| 0.4 | 6.4 | GO:0044295 | axonal growth cone(GO:0044295) |
| 0.3 | 4.5 | GO:0005583 | fibrillar collagen trimer(GO:0005583) banded collagen fibril(GO:0098643) |
| 0.3 | 5.5 | GO:0035102 | PRC1 complex(GO:0035102) |
| 0.3 | 2.7 | GO:0005579 | membrane attack complex(GO:0005579) |
| 0.3 | 6.8 | GO:0032591 | dendritic spine membrane(GO:0032591) |
| 0.3 | 12.6 | GO:0000159 | protein phosphatase type 2A complex(GO:0000159) |
| 0.3 | 0.9 | GO:1990622 | CHOP-ATF3 complex(GO:1990622) |
| 0.3 | 8.1 | GO:0035371 | microtubule plus-end(GO:0035371) |
| 0.3 | 5.9 | GO:0036038 | MKS complex(GO:0036038) |
| 0.3 | 2.1 | GO:0036021 | endolysosome lumen(GO:0036021) |
| 0.3 | 4.8 | GO:0005883 | neurofilament(GO:0005883) |
| 0.3 | 6.9 | GO:0032590 | dendrite membrane(GO:0032590) |
| 0.3 | 2.5 | GO:0002193 | MAML1-RBP-Jkappa- ICN1 complex(GO:0002193) |
| 0.3 | 7.8 | GO:0043189 | NuA4 histone acetyltransferase complex(GO:0035267) H4/H2A histone acetyltransferase complex(GO:0043189) H4 histone acetyltransferase complex(GO:1902562) |
| 0.2 | 1.5 | GO:1990357 | terminal web(GO:1990357) |
| 0.2 | 2.0 | GO:0071953 | elastic fiber(GO:0071953) |
| 0.2 | 7.5 | GO:0030173 | integral component of Golgi membrane(GO:0030173) |
| 0.2 | 11.1 | GO:0043034 | costamere(GO:0043034) |
| 0.2 | 3.1 | GO:0043194 | axon initial segment(GO:0043194) |
| 0.2 | 0.7 | GO:0005577 | fibrinogen complex(GO:0005577) |
| 0.2 | 1.7 | GO:0098839 | postsynaptic density membrane(GO:0098839) |
| 0.2 | 5.6 | GO:0005697 | telomerase holoenzyme complex(GO:0005697) |
| 0.1 | 20.9 | GO:0043204 | perikaryon(GO:0043204) |
| 0.1 | 0.8 | GO:0032311 | angiogenin-PRI complex(GO:0032311) |
| 0.1 | 3.2 | GO:0032809 | neuronal cell body membrane(GO:0032809) cell body membrane(GO:0044298) |
| 0.1 | 9.4 | GO:0005834 | heterotrimeric G-protein complex(GO:0005834) |
| 0.1 | 1.8 | GO:0030123 | AP-3 adaptor complex(GO:0030123) |
| 0.1 | 8.1 | GO:0005637 | nuclear inner membrane(GO:0005637) |
| 0.1 | 18.7 | GO:0030176 | integral component of endoplasmic reticulum membrane(GO:0030176) |
| 0.1 | 11.3 | GO:0031093 | platelet alpha granule lumen(GO:0031093) |
| 0.1 | 23.2 | GO:0014069 | postsynaptic density(GO:0014069) postsynaptic specialization(GO:0099572) |
| 0.1 | 2.6 | GO:0008305 | integrin complex(GO:0008305) |
| 0.1 | 12.5 | GO:0043197 | dendritic spine(GO:0043197) |
| 0.1 | 3.4 | GO:0031594 | neuromuscular junction(GO:0031594) |
| 0.1 | 2.0 | GO:0051233 | spindle midzone(GO:0051233) |
| 0.1 | 2.1 | GO:0071339 | MLL1/2 complex(GO:0044665) MLL1 complex(GO:0071339) |
| 0.1 | 0.7 | GO:0002080 | acrosomal membrane(GO:0002080) |
| 0.1 | 43.8 | GO:0005912 | adherens junction(GO:0005912) |
| 0.1 | 3.4 | GO:0030672 | synaptic vesicle membrane(GO:0030672) exocytic vesicle membrane(GO:0099501) |
| 0.0 | 6.3 | GO:0030496 | midbody(GO:0030496) |
| 0.0 | 2.5 | GO:0005581 | collagen trimer(GO:0005581) |
| 0.0 | 4.0 | GO:0005604 | basement membrane(GO:0005604) |
| 0.0 | 6.6 | GO:0031225 | anchored component of membrane(GO:0031225) |
| 0.0 | 3.6 | GO:0031902 | late endosome membrane(GO:0031902) |
| 0.0 | 2.4 | GO:0005811 | lipid particle(GO:0005811) |
| 0.0 | 3.6 | GO:0043209 | myelin sheath(GO:0043209) |
| 0.0 | 1.5 | GO:1904724 | tertiary granule lumen(GO:1904724) |
| 0.0 | 1.1 | GO:0030134 | ER to Golgi transport vesicle(GO:0030134) |
| 0.0 | 1.2 | GO:0005891 | voltage-gated calcium channel complex(GO:0005891) |
| 0.0 | 1.7 | GO:0070820 | tertiary granule(GO:0070820) |
| 0.0 | 0.3 | GO:0097546 | ciliary base(GO:0097546) |
| 0.0 | 2.2 | GO:0032993 | protein-DNA complex(GO:0032993) |
| 0.0 | 0.9 | GO:0000794 | condensed nuclear chromosome(GO:0000794) |
Gene overrepresentation in molecular function category:
| Log-likelihood per target | Total log-likelihood | Term | Description |
|---|---|---|---|
| 5.8 | 23.1 | GO:0004598 | peptidylglycine monooxygenase activity(GO:0004504) peptidylamidoglycolate lyase activity(GO:0004598) |
| 4.5 | 13.6 | GO:0034739 | histone deacetylase activity (H4-K16 specific)(GO:0034739) |
| 4.1 | 4.1 | GO:0042813 | Wnt-activated receptor activity(GO:0042813) |
| 3.8 | 11.3 | GO:0019959 | interleukin-8 binding(GO:0019959) |
| 3.0 | 8.9 | GO:0005017 | platelet-derived growth factor-activated receptor activity(GO:0005017) |
| 1.9 | 11.5 | GO:0042392 | sphingosine-1-phosphate phosphatase activity(GO:0042392) |
| 1.9 | 5.6 | GO:0008294 | calcium- and calmodulin-responsive adenylate cyclase activity(GO:0008294) |
| 1.6 | 9.4 | GO:0038062 | protein tyrosine kinase collagen receptor activity(GO:0038062) |
| 1.5 | 7.5 | GO:0047238 | glucuronosyl-N-acetylgalactosaminyl-proteoglycan 4-beta-N-acetylgalactosaminyltransferase activity(GO:0047238) |
| 1.4 | 17.9 | GO:1990239 | steroid hormone binding(GO:1990239) |
| 1.3 | 15.2 | GO:0008430 | selenium binding(GO:0008430) |
| 1.1 | 4.5 | GO:0000702 | oxidized base lesion DNA N-glycosylase activity(GO:0000702) |
| 1.0 | 3.1 | GO:0001601 | peptide YY receptor activity(GO:0001601) |
| 1.0 | 9.1 | GO:0016312 | inositol bisphosphate phosphatase activity(GO:0016312) |
| 0.8 | 3.2 | GO:0016495 | C-X3-C chemokine receptor activity(GO:0016495) |
| 0.8 | 6.2 | GO:0004351 | glutamate decarboxylase activity(GO:0004351) |
| 0.7 | 3.7 | GO:0070097 | delta-catenin binding(GO:0070097) |
| 0.7 | 35.1 | GO:0046875 | ephrin receptor binding(GO:0046875) |
| 0.7 | 2.2 | GO:0005011 | macrophage colony-stimulating factor receptor activity(GO:0005011) |
| 0.7 | 12.1 | GO:0003680 | AT DNA binding(GO:0003680) |
| 0.7 | 6.3 | GO:0042731 | PH domain binding(GO:0042731) |
| 0.7 | 5.6 | GO:0044323 | retinoic acid-responsive element binding(GO:0044323) |
| 0.7 | 2.1 | GO:0098640 | integrin binding involved in cell-matrix adhesion(GO:0098640) |
| 0.6 | 5.5 | GO:0035727 | lysophosphatidic acid binding(GO:0035727) |
| 0.6 | 2.4 | GO:0016524 | latrotoxin receptor activity(GO:0016524) |
| 0.6 | 11.0 | GO:0031702 | type 1 angiotensin receptor binding(GO:0031702) |
| 0.6 | 1.7 | GO:0015616 | DNA translocase activity(GO:0015616) |
| 0.6 | 13.8 | GO:0051010 | microtubule plus-end binding(GO:0051010) |
| 0.5 | 6.7 | GO:0022851 | GABA-gated chloride ion channel activity(GO:0022851) |
| 0.5 | 2.6 | GO:0047280 | nicotinamide phosphoribosyltransferase activity(GO:0047280) |
| 0.5 | 10.8 | GO:0001011 | transcription factor activity, sequence-specific DNA binding, RNA polymerase recruiting(GO:0001011) transcription factor activity, TFIIB-class binding(GO:0001087) |
| 0.5 | 8.1 | GO:0004691 | cAMP-dependent protein kinase activity(GO:0004691) |
| 0.5 | 5.6 | GO:0003720 | telomerase activity(GO:0003720) RNA-directed DNA polymerase activity(GO:0003964) |
| 0.5 | 17.3 | GO:0017075 | syntaxin-1 binding(GO:0017075) |
| 0.5 | 6.4 | GO:0045159 | myosin II binding(GO:0045159) |
| 0.4 | 11.5 | GO:0017081 | chloride channel regulator activity(GO:0017081) |
| 0.4 | 7.0 | GO:0000062 | fatty-acyl-CoA binding(GO:0000062) |
| 0.4 | 10.7 | GO:0001965 | G-protein alpha-subunit binding(GO:0001965) |
| 0.4 | 1.3 | GO:0070996 | type 1 melanocortin receptor binding(GO:0070996) |
| 0.4 | 1.7 | GO:0004741 | [pyruvate dehydrogenase (lipoamide)] phosphatase activity(GO:0004741) |
| 0.4 | 4.5 | GO:0048407 | platelet-derived growth factor binding(GO:0048407) |
| 0.4 | 3.2 | GO:0050816 | phosphothreonine binding(GO:0050816) |
| 0.4 | 6.0 | GO:0005344 | oxygen transporter activity(GO:0005344) |
| 0.4 | 13.3 | GO:0005086 | ARF guanyl-nucleotide exchange factor activity(GO:0005086) |
| 0.4 | 7.3 | GO:0031435 | mitogen-activated protein kinase kinase kinase binding(GO:0031435) |
| 0.4 | 2.5 | GO:0008568 | microtubule-severing ATPase activity(GO:0008568) |
| 0.4 | 21.8 | GO:0015485 | cholesterol binding(GO:0015485) |
| 0.4 | 1.1 | GO:0035241 | protein-arginine omega-N monomethyltransferase activity(GO:0035241) |
| 0.3 | 1.7 | GO:0035673 | oligopeptide transmembrane transporter activity(GO:0035673) |
| 0.3 | 2.0 | GO:0017040 | ceramidase activity(GO:0017040) |
| 0.3 | 1.9 | GO:0070004 | cysteine-type carboxypeptidase activity(GO:0016807) cysteine-type exopeptidase activity(GO:0070004) |
| 0.3 | 1.6 | GO:0003989 | acetyl-CoA carboxylase activity(GO:0003989) |
| 0.3 | 5.5 | GO:0031005 | filamin binding(GO:0031005) |
| 0.3 | 8.5 | GO:0030676 | Rac guanyl-nucleotide exchange factor activity(GO:0030676) |
| 0.3 | 4.0 | GO:0005161 | platelet-derived growth factor receptor binding(GO:0005161) |
| 0.3 | 7.5 | GO:0005388 | calcium-transporting ATPase activity(GO:0005388) |
| 0.3 | 2.0 | GO:0008271 | secondary active sulfate transmembrane transporter activity(GO:0008271) |
| 0.2 | 2.7 | GO:0045294 | alpha-catenin binding(GO:0045294) |
| 0.2 | 0.7 | GO:0052739 | phosphatidylserine 1-acylhydrolase activity(GO:0052739) |
| 0.2 | 6.9 | GO:0005521 | lamin binding(GO:0005521) |
| 0.2 | 8.4 | GO:0003785 | actin monomer binding(GO:0003785) |
| 0.2 | 1.7 | GO:0031812 | G-protein coupled nucleotide receptor binding(GO:0031811) P2Y1 nucleotide receptor binding(GO:0031812) |
| 0.2 | 3.3 | GO:0000150 | recombinase activity(GO:0000150) |
| 0.2 | 0.6 | GO:0000253 | 3-keto sterol reductase activity(GO:0000253) |
| 0.2 | 6.9 | GO:0017147 | Wnt-protein binding(GO:0017147) |
| 0.2 | 11.1 | GO:0030507 | spectrin binding(GO:0030507) |
| 0.2 | 2.6 | GO:0032041 | histone deacetylase activity (H3-K14 specific)(GO:0031078) NAD-dependent histone deacetylase activity (H3-K14 specific)(GO:0032041) |
| 0.2 | 7.2 | GO:0070182 | DNA polymerase binding(GO:0070182) |
| 0.2 | 6.0 | GO:0004602 | glutathione peroxidase activity(GO:0004602) |
| 0.2 | 6.1 | GO:0008331 | high voltage-gated calcium channel activity(GO:0008331) |
| 0.2 | 1.9 | GO:0008131 | primary amine oxidase activity(GO:0008131) |
| 0.2 | 1.3 | GO:0035368 | selenocysteine insertion sequence binding(GO:0035368) |
| 0.2 | 1.9 | GO:0016286 | small conductance calcium-activated potassium channel activity(GO:0016286) |
| 0.2 | 2.0 | GO:0033691 | sialic acid binding(GO:0033691) |
| 0.2 | 3.4 | GO:0005522 | profilin binding(GO:0005522) |
| 0.2 | 6.0 | GO:0070840 | dynein complex binding(GO:0070840) |
| 0.2 | 1.5 | GO:0004117 | calmodulin-dependent cyclic-nucleotide phosphodiesterase activity(GO:0004117) |
| 0.2 | 0.8 | GO:0004522 | ribonuclease A activity(GO:0004522) |
| 0.2 | 3.1 | GO:0008093 | cytoskeletal adaptor activity(GO:0008093) |
| 0.2 | 3.0 | GO:0045499 | chemorepellent activity(GO:0045499) |
| 0.1 | 1.2 | GO:0005220 | inositol 1,4,5-trisphosphate-sensitive calcium-release channel activity(GO:0005220) |
| 0.1 | 3.8 | GO:0001968 | fibronectin binding(GO:0001968) |
| 0.1 | 3.0 | GO:0005537 | mannose binding(GO:0005537) |
| 0.1 | 0.7 | GO:0001595 | angiotensin receptor activity(GO:0001595) angiotensin type II receptor activity(GO:0004945) |
| 0.1 | 0.9 | GO:0071933 | Arp2/3 complex binding(GO:0071933) |
| 0.1 | 1.7 | GO:0032395 | MHC class II receptor activity(GO:0032395) |
| 0.1 | 3.9 | GO:0001848 | complement binding(GO:0001848) |
| 0.1 | 13.9 | GO:0017048 | Rho GTPase binding(GO:0017048) |
| 0.1 | 17.2 | GO:0005200 | structural constituent of cytoskeleton(GO:0005200) |
| 0.1 | 1.2 | GO:0039706 | co-receptor binding(GO:0039706) |
| 0.1 | 0.6 | GO:0046899 | nucleoside triphosphate adenylate kinase activity(GO:0046899) |
| 0.1 | 12.6 | GO:0019888 | protein phosphatase regulator activity(GO:0019888) |
| 0.1 | 4.2 | GO:0042162 | telomeric DNA binding(GO:0042162) |
| 0.1 | 2.6 | GO:0004806 | triglyceride lipase activity(GO:0004806) |
| 0.1 | 0.8 | GO:0030021 | extracellular matrix structural constituent conferring compression resistance(GO:0030021) structural constituent of tooth enamel(GO:0030345) |
| 0.1 | 0.7 | GO:0015184 | L-cystine transmembrane transporter activity(GO:0015184) |
| 0.1 | 3.1 | GO:1905030 | voltage-gated sodium channel activity(GO:0005248) voltage-gated ion channel activity involved in regulation of postsynaptic membrane potential(GO:1905030) |
| 0.1 | 1.3 | GO:0034450 | ubiquitin-ubiquitin ligase activity(GO:0034450) |
| 0.1 | 2.1 | GO:0070402 | NADPH binding(GO:0070402) |
| 0.1 | 1.4 | GO:0031432 | titin binding(GO:0031432) |
| 0.1 | 2.5 | GO:0016891 | endoribonuclease activity, producing 5'-phosphomonoesters(GO:0016891) |
| 0.1 | 10.4 | GO:0051082 | unfolded protein binding(GO:0051082) |
| 0.1 | 0.2 | GO:0004556 | alpha-amylase activity(GO:0004556) |
| 0.1 | 1.1 | GO:0038036 | sphingosine-1-phosphate receptor activity(GO:0038036) |
| 0.1 | 1.8 | GO:0004115 | 3',5'-cyclic-AMP phosphodiesterase activity(GO:0004115) |
| 0.1 | 5.0 | GO:0048306 | calcium-dependent protein binding(GO:0048306) |
| 0.1 | 6.5 | GO:0004867 | serine-type endopeptidase inhibitor activity(GO:0004867) |
| 0.1 | 2.4 | GO:0017091 | AU-rich element binding(GO:0017091) |
| 0.1 | 1.5 | GO:0043015 | gamma-tubulin binding(GO:0043015) |
| 0.1 | 10.7 | GO:0044325 | ion channel binding(GO:0044325) |
| 0.1 | 4.3 | GO:0008013 | beta-catenin binding(GO:0008013) |
| 0.1 | 0.2 | GO:0044594 | 3alpha,7alpha,12alpha-trihydroxy-5beta-cholest-24-enoyl-CoA hydratase activity(GO:0033989) 17-beta-hydroxysteroid dehydrogenase (NAD+) activity(GO:0044594) |
| 0.0 | 4.2 | GO:0005262 | calcium channel activity(GO:0005262) |
| 0.0 | 1.0 | GO:0004190 | aspartic-type endopeptidase activity(GO:0004190) aspartic-type peptidase activity(GO:0070001) |
| 0.0 | 0.4 | GO:0003997 | acyl-CoA oxidase activity(GO:0003997) |
| 0.0 | 0.6 | GO:0015379 | potassium:chloride symporter activity(GO:0015379) potassium ion symporter activity(GO:0022820) |
| 0.0 | 8.9 | GO:0035091 | phosphatidylinositol binding(GO:0035091) |
| 0.0 | 1.0 | GO:0005313 | L-glutamate transmembrane transporter activity(GO:0005313) acidic amino acid transmembrane transporter activity(GO:0015172) |
| 0.0 | 1.0 | GO:0004435 | phosphatidylinositol phospholipase C activity(GO:0004435) |
| 0.0 | 2.7 | GO:0004712 | protein serine/threonine/tyrosine kinase activity(GO:0004712) |
| 0.0 | 6.1 | GO:0008017 | microtubule binding(GO:0008017) |
| 0.0 | 2.0 | GO:0004843 | thiol-dependent ubiquitin-specific protease activity(GO:0004843) |
| 0.0 | 1.1 | GO:1990841 | promoter-specific chromatin binding(GO:1990841) |
| 0.0 | 2.5 | GO:0003777 | microtubule motor activity(GO:0003777) |
| 0.0 | 0.4 | GO:0031545 | peptidyl-proline 4-dioxygenase activity(GO:0031545) |
| 0.0 | 10.7 | GO:0031625 | ubiquitin protein ligase binding(GO:0031625) |
| 0.0 | 5.4 | GO:0001078 | transcriptional repressor activity, RNA polymerase II core promoter proximal region sequence-specific binding(GO:0001078) |
| 0.0 | 2.0 | GO:0019003 | GDP binding(GO:0019003) |
| 0.0 | 0.4 | GO:0005132 | type I interferon receptor binding(GO:0005132) |
| 0.0 | 0.1 | GO:0031726 | CCR1 chemokine receptor binding(GO:0031726) |
| 0.0 | 2.0 | GO:0015297 | antiporter activity(GO:0015297) |
| 0.0 | 2.5 | GO:0001227 | transcriptional repressor activity, RNA polymerase II transcription regulatory region sequence-specific binding(GO:0001227) |
| 0.0 | 0.7 | GO:0008188 | neuropeptide receptor activity(GO:0008188) |
| 0.0 | 0.5 | GO:0070330 | aromatase activity(GO:0070330) |
| 0.0 | 1.3 | GO:0001540 | beta-amyloid binding(GO:0001540) |
| 0.0 | 12.2 | GO:0005509 | calcium ion binding(GO:0005509) |
| 0.0 | 1.0 | GO:0005201 | extracellular matrix structural constituent(GO:0005201) |
| 0.0 | 5.5 | GO:0001077 | transcriptional activator activity, RNA polymerase II core promoter proximal region sequence-specific binding(GO:0001077) |
| 0.0 | 0.5 | GO:0008009 | chemokine activity(GO:0008009) |
| 0.0 | 0.8 | GO:0005089 | Rho guanyl-nucleotide exchange factor activity(GO:0005089) |
Gene overrepresentation in curated gene sets: canonical pathways category:
| Log-likelihood per target | Total log-likelihood | Term | Description |
|---|---|---|---|
| 0.6 | 44.8 | PID RAC1 REG PATHWAY | Regulation of RAC1 activity |
| 0.4 | 14.8 | PID HDAC CLASSIII PATHWAY | Signaling events mediated by HDAC Class III |
| 0.4 | 41.0 | PID P75 NTR PATHWAY | p75(NTR)-mediated signaling |
| 0.3 | 15.7 | NABA COLLAGENS | Genes encoding collagen proteins |
| 0.2 | 5.6 | PID LPA4 PATHWAY | LPA4-mediated signaling events |
| 0.2 | 6.0 | SA PTEN PATHWAY | PTEN is a tumor suppressor that dephosphorylates the lipid messenger phosphatidylinositol triphosphate. |
| 0.2 | 6.0 | PID FANCONI PATHWAY | Fanconi anemia pathway |
| 0.2 | 4.6 | PID PDGFRA PATHWAY | PDGFR-alpha signaling pathway |
| 0.2 | 9.8 | PID INSULIN PATHWAY | Insulin Pathway |
| 0.2 | 12.6 | PID ATR PATHWAY | ATR signaling pathway |
| 0.2 | 12.5 | PID HDAC CLASSII PATHWAY | Signaling events mediated by HDAC Class II |
| 0.2 | 3.3 | PID INTEGRIN4 PATHWAY | Alpha6 beta4 integrin-ligand interactions |
| 0.2 | 2.0 | ST PAC1 RECEPTOR PATHWAY | PAC1 Receptor Pathway |
| 0.2 | 6.3 | PID AURORA A PATHWAY | Aurora A signaling |
| 0.2 | 1.2 | ST IL 13 PATHWAY | Interleukin 13 (IL-13) Pathway |
| 0.2 | 2.0 | PID THROMBIN PAR4 PATHWAY | PAR4-mediated thrombin signaling events |
| 0.1 | 2.1 | PID ER NONGENOMIC PATHWAY | Plasma membrane estrogen receptor signaling |
| 0.1 | 6.4 | PID ERBB1 RECEPTOR PROXIMAL PATHWAY | EGF receptor (ErbB1) signaling pathway |
| 0.1 | 6.4 | PID IL6 7 PATHWAY | IL6-mediated signaling events |
| 0.1 | 8.8 | SIG PIP3 SIGNALING IN CARDIAC MYOCTES | Genes related to PIP3 signaling in cardiac myocytes |
| 0.1 | 2.0 | PID LYSOPHOSPHOLIPID PATHWAY | LPA receptor mediated events |
| 0.1 | 8.9 | PID TAP63 PATHWAY | Validated transcriptional targets of TAp63 isoforms |
| 0.1 | 2.6 | PID S1P S1P3 PATHWAY | S1P3 pathway |
| 0.1 | 2.4 | PID ANTHRAX PATHWAY | Cellular roles of Anthrax toxin |
| 0.1 | 6.9 | ST FAS SIGNALING PATHWAY | Fas Signaling Pathway |
| 0.1 | 1.2 | ST GAQ PATHWAY | G alpha q Pathway |
| 0.1 | 5.5 | PID PTP1B PATHWAY | Signaling events mediated by PTP1B |
| 0.1 | 1.1 | PID SYNDECAN 3 PATHWAY | Syndecan-3-mediated signaling events |
| 0.1 | 2.2 | PID PS1 PATHWAY | Presenilin action in Notch and Wnt signaling |
| 0.1 | 1.7 | ST GA12 PATHWAY | G alpha 12 Pathway |
| 0.1 | 7.6 | PID BETA CATENIN NUC PATHWAY | Regulation of nuclear beta catenin signaling and target gene transcription |
| 0.1 | 2.1 | PID ECADHERIN STABILIZATION PATHWAY | Stabilization and expansion of the E-cadherin adherens junction |
| 0.1 | 3.3 | ST INTEGRIN SIGNALING PATHWAY | Integrin Signaling Pathway |
| 0.1 | 6.0 | PID CMYB PATHWAY | C-MYB transcription factor network |
| 0.1 | 2.5 | PID AR TF PATHWAY | Regulation of Androgen receptor activity |
| 0.0 | 5.8 | PID P53 DOWNSTREAM PATHWAY | Direct p53 effectors |
| 0.0 | 1.8 | PID RAC1 PATHWAY | RAC1 signaling pathway |
| 0.0 | 7.3 | NABA ECM GLYCOPROTEINS | Genes encoding structural ECM glycoproteins |
| 0.0 | 0.5 | PID INTEGRIN CS PATHWAY | Integrin family cell surface interactions |
| 0.0 | 0.3 | ST DIFFERENTIATION PATHWAY IN PC12 CELLS | Differentiation Pathway in PC12 Cells; this is a specific case of PAC1 Receptor Pathway. |
| 0.0 | 0.4 | PID HIF1A PATHWAY | Hypoxic and oxygen homeostasis regulation of HIF-1-alpha |
Gene overrepresentation in curated gene sets: REACTOME pathways category:
| Log-likelihood per target | Total log-likelihood | Term | Description |
|---|---|---|---|
| 0.5 | 12.9 | REACTOME THROMBOXANE SIGNALLING THROUGH TP RECEPTOR | Genes involved in Thromboxane signalling through TP receptor |
| 0.5 | 11.3 | REACTOME INTRINSIC PATHWAY | Genes involved in Intrinsic Pathway |
| 0.5 | 2.3 | REACTOME DOPAMINE NEUROTRANSMITTER RELEASE CYCLE | Genes involved in Dopamine Neurotransmitter Release Cycle |
| 0.4 | 5.6 | REACTOME ADENYLATE CYCLASE ACTIVATING PATHWAY | Genes involved in Adenylate cyclase activating pathway |
| 0.4 | 6.0 | REACTOME PURINE CATABOLISM | Genes involved in Purine catabolism |
| 0.3 | 8.1 | REACTOME PKA MEDIATED PHOSPHORYLATION OF CREB | Genes involved in PKA-mediated phosphorylation of CREB |
| 0.3 | 41.1 | REACTOME P75 NTR RECEPTOR MEDIATED SIGNALLING | Genes involved in p75 NTR receptor-mediated signalling |
| 0.3 | 23.7 | REACTOME MYOGENESIS | Genes involved in Myogenesis |
| 0.3 | 36.5 | REACTOME SIGNALING BY RHO GTPASES | Genes involved in Signaling by Rho GTPases |
| 0.3 | 21.9 | REACTOME NCAM1 INTERACTIONS | Genes involved in NCAM1 interactions |
| 0.3 | 15.5 | REACTOME ION TRANSPORT BY P TYPE ATPASES | Genes involved in Ion transport by P-type ATPases |
| 0.3 | 6.0 | REACTOME FANCONI ANEMIA PATHWAY | Genes involved in Fanconi Anemia pathway |
| 0.2 | 6.8 | REACTOME CHONDROITIN SULFATE BIOSYNTHESIS | Genes involved in Chondroitin sulfate biosynthesis |
| 0.2 | 4.5 | REACTOME BASE FREE SUGAR PHOSPHATE REMOVAL VIA THE SINGLE NUCLEOTIDE REPLACEMENT PATHWAY | Genes involved in Base-free sugar-phosphate removal via the single-nucleotide replacement pathway |
| 0.2 | 3.0 | REACTOME ACTIVATED NOTCH1 TRANSMITS SIGNAL TO THE NUCLEUS | Genes involved in Activated NOTCH1 Transmits Signal to the Nucleus |
| 0.2 | 7.1 | REACTOME G0 AND EARLY G1 | Genes involved in G0 and Early G1 |
| 0.2 | 6.8 | REACTOME GABA A RECEPTOR ACTIVATION | Genes involved in GABA A receptor activation |
| 0.2 | 6.4 | REACTOME CASPASE MEDIATED CLEAVAGE OF CYTOSKELETAL PROTEINS | Genes involved in Caspase-mediated cleavage of cytoskeletal proteins |
| 0.2 | 8.2 | REACTOME G ALPHA Z SIGNALLING EVENTS | Genes involved in G alpha (z) signalling events |
| 0.2 | 6.2 | REACTOME GABA SYNTHESIS RELEASE REUPTAKE AND DEGRADATION | Genes involved in GABA synthesis, release, reuptake and degradation |
| 0.2 | 2.1 | REACTOME TRAFFICKING AND PROCESSING OF ENDOSOMAL TLR | Genes involved in Trafficking and processing of endosomal TLR |
| 0.1 | 4.1 | REACTOME BRANCHED CHAIN AMINO ACID CATABOLISM | Genes involved in Branched-chain amino acid catabolism |
| 0.1 | 2.5 | REACTOME NOTCH HLH TRANSCRIPTION PATHWAY | Genes involved in Notch-HLH transcription pathway |
| 0.1 | 1.7 | REACTOME REGULATION OF PYRUVATE DEHYDROGENASE PDH COMPLEX | Genes involved in Regulation of pyruvate dehydrogenase (PDH) complex |
| 0.1 | 11.0 | REACTOME UNFOLDED PROTEIN RESPONSE | Genes involved in Unfolded Protein Response |
| 0.1 | 10.5 | REACTOME MITOTIC PROMETAPHASE | Genes involved in Mitotic Prometaphase |
| 0.1 | 1.3 | REACTOME ANDROGEN BIOSYNTHESIS | Genes involved in Androgen biosynthesis |
| 0.1 | 5.8 | REACTOME SIGNALING BY NOTCH1 | Genes involved in Signaling by NOTCH1 |
| 0.1 | 1.8 | REACTOME ERK MAPK TARGETS | Genes involved in ERK/MAPK targets |
| 0.1 | 3.4 | REACTOME SIGNALING BY ROBO RECEPTOR | Genes involved in Signaling by Robo receptor |
| 0.1 | 3.0 | REACTOME BMAL1 CLOCK NPAS2 ACTIVATES CIRCADIAN EXPRESSION | Genes involved in BMAL1:CLOCK/NPAS2 Activates Circadian Expression |
| 0.1 | 3.8 | REACTOME CHEMOKINE RECEPTORS BIND CHEMOKINES | Genes involved in Chemokine receptors bind chemokines |
| 0.0 | 2.1 | REACTOME VOLTAGE GATED POTASSIUM CHANNELS | Genes involved in Voltage gated Potassium channels |
| 0.0 | 3.8 | REACTOME INTEGRIN CELL SURFACE INTERACTIONS | Genes involved in Integrin cell surface interactions |
| 0.0 | 1.5 | REACTOME APOPTOTIC CLEAVAGE OF CELLULAR PROTEINS | Genes involved in Apoptotic cleavage of cellular proteins |
| 0.0 | 0.9 | REACTOME MEIOTIC RECOMBINATION | Genes involved in Meiotic Recombination |
| 0.0 | 1.7 | REACTOME GLYCOSPHINGOLIPID METABOLISM | Genes involved in Glycosphingolipid metabolism |
| 0.0 | 0.6 | REACTOME SYNTHESIS SECRETION AND DEACYLATION OF GHRELIN | Genes involved in Synthesis, Secretion, and Deacylation of Ghrelin |
| 0.0 | 1.1 | REACTOME PIP3 ACTIVATES AKT SIGNALING | Genes involved in PIP3 activates AKT signaling |
| 0.0 | 0.5 | REACTOME ALPHA LINOLENIC ACID ALA METABOLISM | Genes involved in alpha-linolenic acid (ALA) metabolism |
| 0.0 | 1.6 | REACTOME SMOOTH MUSCLE CONTRACTION | Genes involved in Smooth Muscle Contraction |
| 0.0 | 1.5 | REACTOME DOWNSTREAM SIGNAL TRANSDUCTION | Genes involved in Downstream signal transduction |
| 0.0 | 3.0 | REACTOME INTERFERON ALPHA BETA SIGNALING | Genes involved in Interferon alpha/beta signaling |
| 0.0 | 0.7 | REACTOME ADHERENS JUNCTIONS INTERACTIONS | Genes involved in Adherens junctions interactions |
| 0.0 | 0.5 | REACTOME XENOBIOTICS | Genes involved in Xenobiotics |
| 0.0 | 3.1 | REACTOME PEPTIDE LIGAND BINDING RECEPTORS | Genes involved in Peptide ligand-binding receptors |
| 0.0 | 0.9 | REACTOME COMPLEMENT CASCADE | Genes involved in Complement cascade |
| 0.0 | 3.1 | REACTOME MRNA SPLICING | Genes involved in mRNA Splicing |
| 0.0 | 0.2 | REACTOME DIGESTION OF DIETARY CARBOHYDRATE | Genes involved in Digestion of dietary carbohydrate |
| 0.0 | 0.7 | REACTOME BASIGIN INTERACTIONS | Genes involved in Basigin interactions |
| 0.0 | 0.4 | REACTOME OXYGEN DEPENDENT PROLINE HYDROXYLATION OF HYPOXIA INDUCIBLE FACTOR ALPHA | Genes involved in Oxygen-dependent Proline Hydroxylation of Hypoxia-inducible Factor Alpha |
| 0.0 | 0.3 | REACTOME HYALURONAN UPTAKE AND DEGRADATION | Genes involved in Hyaluronan uptake and degradation |
| 0.0 | 0.3 | REACTOME POST CHAPERONIN TUBULIN FOLDING PATHWAY | Genes involved in Post-chaperonin tubulin folding pathway |