Project
GNF SymAtlas + NCI-60 cancer cell lines, human (Su, 2004; Ross, 2000)
Navigation
Downloads
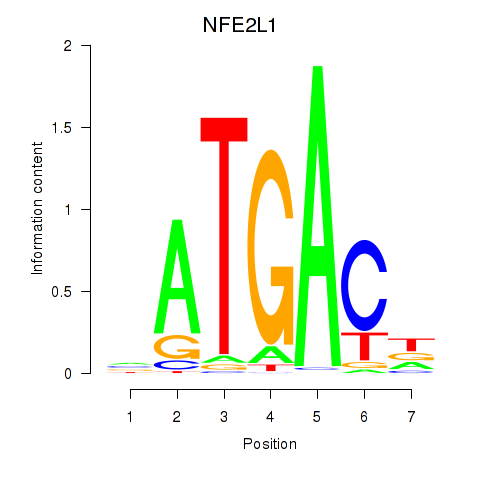
Results for NFE2L1
Z-value: 0.87
Motif logo
Transcription factors associated with NFE2L1
| Gene Symbol | Gene ID | Gene Info |
|---|---|---|
|
NFE2L1
|
ENSG00000082641.16 | NFE2L1 |
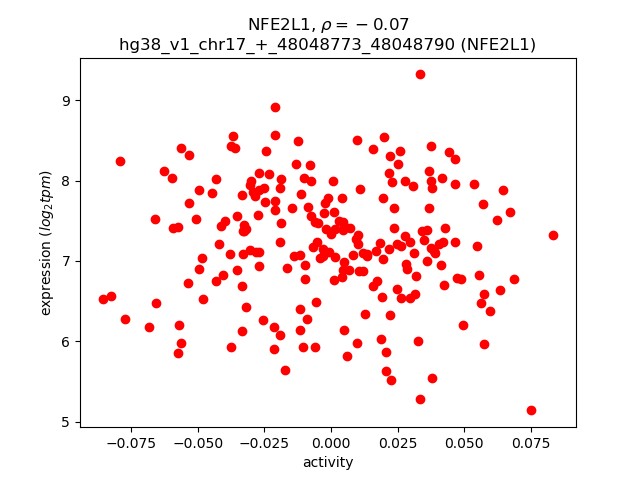
Activity-expression correlation:
| Gene | Promoter | Pearson corr. coef. | P-value | Plot |
|---|---|---|---|---|
| NFE2L1 | hg38_v1_chr17_+_48048773_48048790 | -0.07 | 3.3e-01 | Click! |
Activity profile of NFE2L1 motif
Sorted Z-values of NFE2L1 motif
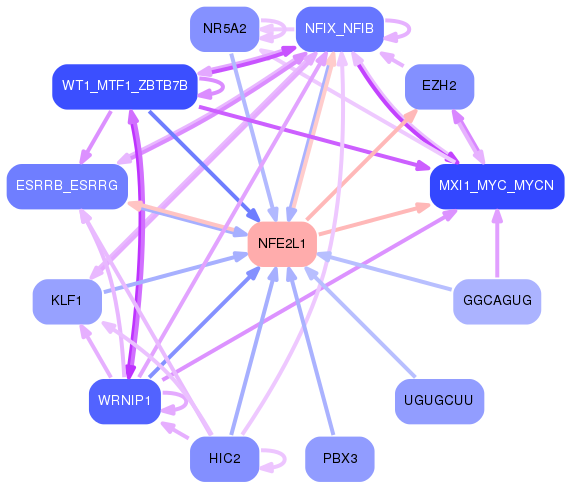
Network of associatons between targets according to the STRING database.

First level regulatory network of NFE2L1
Gene Ontology Analysis
Gene overrepresentation in biological process category:
| Log-likelihood per target | Total log-likelihood | Term | Description |
|---|---|---|---|
| 3.8 | 15.2 | GO:0019860 | uracil metabolic process(GO:0019860) |
| 3.2 | 22.7 | GO:0051552 | flavone metabolic process(GO:0051552) |
| 2.5 | 32.9 | GO:1900625 | regulation of monocyte aggregation(GO:1900623) positive regulation of monocyte aggregation(GO:1900625) |
| 1.7 | 5.2 | GO:0051710 | regulation of cytolysis in other organism(GO:0051710) |
| 1.6 | 4.9 | GO:0071283 | regulation of chromosome condensation(GO:0060623) cellular response to iron(III) ion(GO:0071283) |
| 1.1 | 6.6 | GO:0052697 | flavonoid glucuronidation(GO:0052696) xenobiotic glucuronidation(GO:0052697) |
| 1.1 | 3.3 | GO:1904772 | hepatocyte homeostasis(GO:0036333) response to tetrachloromethane(GO:1904772) |
| 0.9 | 4.4 | GO:0030950 | establishment or maintenance of actin cytoskeleton polarity(GO:0030950) |
| 0.8 | 3.4 | GO:0046368 | GDP-L-fucose metabolic process(GO:0046368) |
| 0.8 | 3.3 | GO:0090096 | metanephric cap development(GO:0072185) metanephric cap morphogenesis(GO:0072186) metanephric cap mesenchymal cell proliferation involved in metanephros development(GO:0090094) regulation of metanephric cap mesenchymal cell proliferation(GO:0090095) positive regulation of metanephric cap mesenchymal cell proliferation(GO:0090096) |
| 0.8 | 2.5 | GO:0060559 | positive regulation of vitamin metabolic process(GO:0046136) positive regulation of vitamin D biosynthetic process(GO:0060557) positive regulation of calcidiol 1-monooxygenase activity(GO:0060559) |
| 0.8 | 2.4 | GO:0002086 | diaphragm contraction(GO:0002086) |
| 0.8 | 2.4 | GO:0015670 | carbon dioxide transport(GO:0015670) |
| 0.8 | 2.3 | GO:1905167 | positive regulation of lysosomal protein catabolic process(GO:1905167) |
| 0.8 | 2.3 | GO:0038195 | urokinase plasminogen activator signaling pathway(GO:0038195) |
| 0.8 | 4.5 | GO:0006931 | substrate-dependent cell migration, cell attachment to substrate(GO:0006931) |
| 0.7 | 0.7 | GO:2001183 | negative regulation of interleukin-12 secretion(GO:2001183) |
| 0.7 | 2.1 | GO:2000296 | negative regulation of hydrogen peroxide catabolic process(GO:2000296) |
| 0.7 | 4.3 | GO:0016554 | cytidine to uridine editing(GO:0016554) |
| 0.7 | 3.5 | GO:1904073 | regulation of trophectodermal cell proliferation(GO:1904073) positive regulation of trophectodermal cell proliferation(GO:1904075) |
| 0.7 | 6.0 | GO:0038044 | transforming growth factor-beta secretion(GO:0038044) |
| 0.6 | 3.9 | GO:0070829 | response to vitamin B2(GO:0033274) heterochromatin maintenance(GO:0070829) |
| 0.6 | 5.4 | GO:0042904 | 9-cis-retinoic acid biosynthetic process(GO:0042904) 9-cis-retinoic acid metabolic process(GO:0042905) |
| 0.6 | 1.7 | GO:0048250 | mitochondrial iron ion transport(GO:0048250) |
| 0.6 | 1.7 | GO:0021763 | subthalamic nucleus development(GO:0021763) prolactin secreting cell differentiation(GO:0060127) left lung morphogenesis(GO:0060460) pulmonary vein morphogenesis(GO:0060577) superior vena cava morphogenesis(GO:0060578) |
| 0.6 | 4.0 | GO:0035879 | plasma membrane lactate transport(GO:0035879) |
| 0.5 | 2.1 | GO:0034445 | regulation of plasma lipoprotein particle oxidation(GO:0034444) negative regulation of plasma lipoprotein particle oxidation(GO:0034445) |
| 0.5 | 2.1 | GO:0032747 | positive regulation of interleukin-23 production(GO:0032747) |
| 0.5 | 3.6 | GO:0034392 | negative regulation of smooth muscle cell apoptotic process(GO:0034392) |
| 0.5 | 1.5 | GO:1901492 | positive regulation of lymphangiogenesis(GO:1901492) |
| 0.5 | 1.5 | GO:0031446 | regulation of fast-twitch skeletal muscle fiber contraction(GO:0031446) positive regulation of fast-twitch skeletal muscle fiber contraction(GO:0031448) |
| 0.5 | 1.5 | GO:0060003 | copper ion export(GO:0060003) |
| 0.5 | 2.9 | GO:0070973 | protein localization to endoplasmic reticulum exit site(GO:0070973) |
| 0.5 | 7.7 | GO:1990001 | inhibition of cysteine-type endopeptidase activity involved in apoptotic process(GO:1990001) |
| 0.5 | 4.3 | GO:0032790 | ribosome disassembly(GO:0032790) |
| 0.5 | 5.0 | GO:2000645 | negative regulation of receptor catabolic process(GO:2000645) |
| 0.4 | 0.9 | GO:2001027 | negative regulation of endothelial cell chemotaxis(GO:2001027) |
| 0.4 | 5.5 | GO:1900747 | negative regulation of vascular endothelial growth factor signaling pathway(GO:1900747) |
| 0.4 | 2.1 | GO:0046167 | glycerol-3-phosphate biosynthetic process(GO:0046167) |
| 0.4 | 2.0 | GO:0006177 | GMP biosynthetic process(GO:0006177) |
| 0.4 | 1.2 | GO:0006106 | fumarate metabolic process(GO:0006106) |
| 0.4 | 2.7 | GO:0098881 | exocytic insertion of neurotransmitter receptor to plasma membrane(GO:0098881) exocytic insertion of neurotransmitter receptor to postsynaptic membrane(GO:0098967) |
| 0.4 | 1.1 | GO:0001978 | regulation of systemic arterial blood pressure by carotid sinus baroreceptor feedback(GO:0001978) baroreceptor response to increased systemic arterial blood pressure(GO:0001983) |
| 0.4 | 3.8 | GO:1903377 | negative regulation of oxidative stress-induced neuron intrinsic apoptotic signaling pathway(GO:1903377) |
| 0.4 | 3.7 | GO:0045078 | positive regulation of interferon-gamma biosynthetic process(GO:0045078) |
| 0.4 | 2.9 | GO:0006659 | phosphatidylserine biosynthetic process(GO:0006659) |
| 0.4 | 1.1 | GO:0060739 | mesenchymal-epithelial cell signaling involved in prostate gland development(GO:0060739) |
| 0.4 | 1.4 | GO:0030047 | actin modification(GO:0030047) |
| 0.4 | 1.1 | GO:0060278 | regulation of ovulation(GO:0060278) positive regulation of ovulation(GO:0060279) |
| 0.3 | 1.0 | GO:2000283 | regulation of cellular amine catabolic process(GO:0033241) negative regulation of cellular amine catabolic process(GO:0033242) negative regulation of the force of heart contraction(GO:0098736) regulation of arginine catabolic process(GO:1900081) negative regulation of arginine catabolic process(GO:1900082) regulation of citrulline biosynthetic process(GO:1903248) negative regulation of citrulline biosynthetic process(GO:1903249) regulation of cellular amino acid biosynthetic process(GO:2000282) negative regulation of cellular amino acid biosynthetic process(GO:2000283) |
| 0.3 | 4.4 | GO:0019388 | galactose catabolic process(GO:0019388) |
| 0.3 | 1.3 | GO:0060743 | epithelial cell maturation involved in prostate gland development(GO:0060743) |
| 0.3 | 1.3 | GO:0097398 | response to interleukin-17(GO:0097396) cellular response to interleukin-17(GO:0097398) |
| 0.3 | 2.6 | GO:0043353 | enucleate erythrocyte differentiation(GO:0043353) |
| 0.3 | 1.9 | GO:0070171 | negative regulation of tooth mineralization(GO:0070171) |
| 0.3 | 1.6 | GO:0015677 | copper ion import(GO:0015677) |
| 0.3 | 1.0 | GO:0007343 | egg activation(GO:0007343) |
| 0.3 | 1.3 | GO:0070358 | actin polymerization-dependent cell motility(GO:0070358) |
| 0.3 | 7.5 | GO:0030214 | hyaluronan catabolic process(GO:0030214) |
| 0.3 | 2.2 | GO:0045919 | positive regulation of cytolysis(GO:0045919) |
| 0.3 | 1.2 | GO:0048496 | maintenance of organ identity(GO:0048496) |
| 0.3 | 1.2 | GO:0035606 | peptidyl-cysteine S-trans-nitrosylation(GO:0035606) |
| 0.3 | 0.9 | GO:1902445 | B cell selection(GO:0002339) apoptotic process involved in embryonic digit morphogenesis(GO:1902263) regulation of mitochondrial membrane permeability involved in programmed necrotic cell death(GO:1902445) positive regulation of apoptotic DNA fragmentation(GO:1902512) |
| 0.3 | 1.2 | GO:0050916 | sensory perception of sweet taste(GO:0050916) sensory perception of umami taste(GO:0050917) |
| 0.3 | 0.6 | GO:0007113 | endomitotic cell cycle(GO:0007113) |
| 0.3 | 3.4 | GO:0090435 | protein localization to nuclear envelope(GO:0090435) |
| 0.3 | 0.8 | GO:0071676 | negative regulation of mononuclear cell migration(GO:0071676) |
| 0.3 | 0.6 | GO:0070827 | chromatin maintenance(GO:0070827) |
| 0.3 | 5.2 | GO:0006782 | protoporphyrinogen IX biosynthetic process(GO:0006782) |
| 0.3 | 0.8 | GO:0018874 | benzoate metabolic process(GO:0018874) butyrate metabolic process(GO:0019605) |
| 0.3 | 2.1 | GO:0060155 | platelet dense granule organization(GO:0060155) |
| 0.3 | 2.1 | GO:2000535 | regulation of entry of bacterium into host cell(GO:2000535) |
| 0.3 | 1.0 | GO:0006542 | glutamine biosynthetic process(GO:0006542) |
| 0.3 | 2.3 | GO:1902459 | positive regulation of stem cell population maintenance(GO:1902459) |
| 0.2 | 0.7 | GO:0072233 | thick ascending limb development(GO:0072023) metanephric thick ascending limb development(GO:0072233) |
| 0.2 | 2.2 | GO:0006335 | DNA replication-dependent nucleosome assembly(GO:0006335) DNA replication-dependent nucleosome organization(GO:0034723) |
| 0.2 | 1.9 | GO:0006572 | tyrosine catabolic process(GO:0006572) |
| 0.2 | 2.6 | GO:1903943 | regulation of hepatocyte apoptotic process(GO:1903943) negative regulation of hepatocyte apoptotic process(GO:1903944) |
| 0.2 | 3.1 | GO:0070327 | thyroid hormone transport(GO:0070327) |
| 0.2 | 0.9 | GO:0009256 | 10-formyltetrahydrofolate metabolic process(GO:0009256) |
| 0.2 | 1.1 | GO:0034721 | histone H3-K4 demethylation, trimethyl-H3-K4-specific(GO:0034721) |
| 0.2 | 1.1 | GO:0090131 | mesenchyme migration(GO:0090131) |
| 0.2 | 1.4 | GO:0061737 | leukotriene signaling pathway(GO:0061737) |
| 0.2 | 3.3 | GO:0016576 | histone dephosphorylation(GO:0016576) |
| 0.2 | 0.7 | GO:0002314 | germinal center B cell differentiation(GO:0002314) |
| 0.2 | 1.3 | GO:0019060 | intracellular transport of viral protein in host cell(GO:0019060) symbiont intracellular protein transport in host(GO:0030581) intracellular protein transport in other organism involved in symbiotic interaction(GO:0051708) |
| 0.2 | 0.7 | GO:1904457 | beta-glucoside metabolic process(GO:1901804) beta-glucoside catabolic process(GO:1901805) positive regulation of neuronal action potential(GO:1904457) |
| 0.2 | 3.4 | GO:0090073 | positive regulation of protein homodimerization activity(GO:0090073) |
| 0.2 | 2.5 | GO:0090050 | positive regulation of cell migration involved in sprouting angiogenesis(GO:0090050) |
| 0.2 | 3.3 | GO:0030150 | protein import into mitochondrial matrix(GO:0030150) |
| 0.2 | 0.8 | GO:1990414 | replication-born double-strand break repair via sister chromatid exchange(GO:1990414) |
| 0.2 | 2.3 | GO:0051451 | myoblast migration(GO:0051451) |
| 0.2 | 1.1 | GO:1900748 | positive regulation of vascular endothelial growth factor signaling pathway(GO:1900748) |
| 0.2 | 0.5 | GO:0090149 | synaptic vesicle recycling via endosome(GO:0036466) mitochondrial membrane fission(GO:0090149) |
| 0.2 | 1.4 | GO:0070170 | regulation of tooth mineralization(GO:0070170) |
| 0.2 | 1.0 | GO:0048840 | otolith development(GO:0048840) |
| 0.2 | 2.9 | GO:1903830 | magnesium ion transmembrane transport(GO:1903830) |
| 0.2 | 2.4 | GO:0035372 | protein localization to microtubule(GO:0035372) |
| 0.2 | 0.7 | GO:0010836 | negative regulation of protein ADP-ribosylation(GO:0010836) |
| 0.2 | 4.1 | GO:0050849 | negative regulation of calcium-mediated signaling(GO:0050849) |
| 0.2 | 1.0 | GO:2000158 | positive regulation of ubiquitin-specific protease activity(GO:2000158) |
| 0.2 | 1.8 | GO:0043152 | induction of bacterial agglutination(GO:0043152) |
| 0.2 | 3.0 | GO:0048262 | determination of dorsal/ventral asymmetry(GO:0048262) |
| 0.2 | 0.9 | GO:0051012 | microtubule sliding(GO:0051012) |
| 0.2 | 2.3 | GO:2001204 | regulation of osteoclast development(GO:2001204) |
| 0.2 | 0.6 | GO:0060708 | spongiotrophoblast differentiation(GO:0060708) |
| 0.2 | 1.1 | GO:0060455 | positive regulation of fever generation(GO:0031622) negative regulation of gastric acid secretion(GO:0060455) |
| 0.2 | 3.2 | GO:0006750 | glutathione biosynthetic process(GO:0006750) |
| 0.2 | 0.6 | GO:0090294 | nitrogen catabolite regulation of transcription from RNA polymerase II promoter(GO:0001079) nitrogen catabolite activation of transcription from RNA polymerase II promoter(GO:0001080) ammonia assimilation cycle(GO:0019676) regulation of urea metabolic process(GO:0034255) intracellular bile acid receptor signaling pathway(GO:0038185) interleukin-17 secretion(GO:0072615) nitrogen catabolite regulation of transcription(GO:0090293) nitrogen catabolite activation of transcription(GO:0090294) regulation of nitrogen cycle metabolic process(GO:1903314) positive regulation of glutamate metabolic process(GO:2000213) regulation of ammonia assimilation cycle(GO:2001248) positive regulation of ammonia assimilation cycle(GO:2001250) |
| 0.1 | 0.9 | GO:0090166 | Golgi disassembly(GO:0090166) |
| 0.1 | 0.6 | GO:0019805 | quinolinate biosynthetic process(GO:0019805) |
| 0.1 | 0.6 | GO:0099590 | neurotransmitter receptor internalization(GO:0099590) |
| 0.1 | 1.1 | GO:2000210 | positive regulation of anoikis(GO:2000210) |
| 0.1 | 1.6 | GO:1901223 | negative regulation of NIK/NF-kappaB signaling(GO:1901223) |
| 0.1 | 2.0 | GO:0042738 | exogenous drug catabolic process(GO:0042738) |
| 0.1 | 1.2 | GO:0018401 | peptidyl-proline hydroxylation to 4-hydroxy-L-proline(GO:0018401) |
| 0.1 | 7.1 | GO:0015701 | bicarbonate transport(GO:0015701) |
| 0.1 | 0.6 | GO:0016078 | tRNA catabolic process(GO:0016078) |
| 0.1 | 0.7 | GO:0060054 | positive regulation of epithelial cell proliferation involved in wound healing(GO:0060054) |
| 0.1 | 1.6 | GO:0030949 | positive regulation of vascular endothelial growth factor receptor signaling pathway(GO:0030949) |
| 0.1 | 0.3 | GO:0060474 | positive regulation of sperm motility involved in capacitation(GO:0060474) |
| 0.1 | 1.8 | GO:0007220 | Notch receptor processing(GO:0007220) |
| 0.1 | 0.6 | GO:0021914 | negative regulation of smoothened signaling pathway involved in ventral spinal cord patterning(GO:0021914) floor plate development(GO:0033504) |
| 0.1 | 0.3 | GO:0046533 | negative regulation of photoreceptor cell differentiation(GO:0046533) |
| 0.1 | 1.4 | GO:0021942 | radial glia guided migration of Purkinje cell(GO:0021942) |
| 0.1 | 1.4 | GO:0003334 | keratinocyte development(GO:0003334) |
| 0.1 | 0.5 | GO:0097498 | endothelial tube lumen extension(GO:0097498) |
| 0.1 | 0.5 | GO:1901091 | regulation of protein tetramerization(GO:1901090) negative regulation of protein tetramerization(GO:1901091) regulation of protein homotetramerization(GO:1901093) negative regulation of protein homotetramerization(GO:1901094) |
| 0.1 | 0.4 | GO:0090299 | fibroblast growth factor receptor signaling pathway involved in neural plate anterior/posterior pattern formation(GO:0060825) regulation of neural crest formation(GO:0090299) negative regulation of neural crest formation(GO:0090301) regulation of fibroblast growth factor receptor signaling pathway involved in neural plate anterior/posterior pattern formation(GO:2000313) negative regulation of fibroblast growth factor receptor signaling pathway involved in neural plate anterior/posterior pattern formation(GO:2000314) |
| 0.1 | 1.8 | GO:1901663 | ubiquinone biosynthetic process(GO:0006744) quinone biosynthetic process(GO:1901663) |
| 0.1 | 0.5 | GO:2000870 | oocyte growth(GO:0001555) regulation of progesterone secretion(GO:2000870) |
| 0.1 | 0.4 | GO:0048852 | hypophysis morphogenesis(GO:0048850) diencephalon morphogenesis(GO:0048852) |
| 0.1 | 0.7 | GO:0060244 | negative regulation of cell proliferation involved in contact inhibition(GO:0060244) |
| 0.1 | 2.1 | GO:0001580 | detection of chemical stimulus involved in sensory perception of bitter taste(GO:0001580) |
| 0.1 | 1.2 | GO:1900119 | positive regulation of execution phase of apoptosis(GO:1900119) |
| 0.1 | 1.0 | GO:0008343 | adult feeding behavior(GO:0008343) |
| 0.1 | 0.3 | GO:0006121 | mitochondrial electron transport, succinate to ubiquinone(GO:0006121) |
| 0.1 | 1.1 | GO:2001288 | positive regulation of caveolin-mediated endocytosis(GO:2001288) |
| 0.1 | 11.9 | GO:0031424 | keratinization(GO:0031424) |
| 0.1 | 4.3 | GO:0007271 | synaptic transmission, cholinergic(GO:0007271) |
| 0.1 | 0.3 | GO:0002949 | tRNA threonylcarbamoyladenosine modification(GO:0002949) |
| 0.1 | 2.6 | GO:0015721 | bile acid and bile salt transport(GO:0015721) |
| 0.1 | 0.3 | GO:0046603 | negative regulation of mitotic centrosome separation(GO:0046603) |
| 0.1 | 5.0 | GO:0048384 | retinoic acid receptor signaling pathway(GO:0048384) |
| 0.1 | 1.1 | GO:0048298 | positive regulation of isotype switching to IgA isotypes(GO:0048298) |
| 0.1 | 0.8 | GO:0006390 | transcription from mitochondrial promoter(GO:0006390) |
| 0.1 | 0.5 | GO:0006689 | ganglioside catabolic process(GO:0006689) |
| 0.1 | 0.1 | GO:0010807 | regulation of synaptic vesicle priming(GO:0010807) |
| 0.1 | 1.5 | GO:0035589 | G-protein coupled purinergic nucleotide receptor signaling pathway(GO:0035589) |
| 0.1 | 1.5 | GO:1904778 | regulation of protein localization to cell cortex(GO:1904776) positive regulation of protein localization to cell cortex(GO:1904778) |
| 0.1 | 2.1 | GO:0046597 | negative regulation of viral entry into host cell(GO:0046597) |
| 0.1 | 2.0 | GO:0002089 | lens morphogenesis in camera-type eye(GO:0002089) |
| 0.1 | 0.8 | GO:0060088 | auditory receptor cell stereocilium organization(GO:0060088) |
| 0.1 | 0.5 | GO:0044245 | polysaccharide digestion(GO:0044245) |
| 0.1 | 0.3 | GO:0033031 | positive regulation of neutrophil apoptotic process(GO:0033031) |
| 0.1 | 1.0 | GO:0086069 | bundle of His cell to Purkinje myocyte communication(GO:0086069) |
| 0.1 | 1.8 | GO:0002438 | acute inflammatory response to antigenic stimulus(GO:0002438) |
| 0.1 | 0.4 | GO:0001777 | T cell homeostatic proliferation(GO:0001777) |
| 0.1 | 1.1 | GO:0042249 | establishment of planar polarity of embryonic epithelium(GO:0042249) |
| 0.1 | 0.6 | GO:0008090 | retrograde axonal transport(GO:0008090) |
| 0.1 | 1.4 | GO:0045899 | positive regulation of RNA polymerase II transcriptional preinitiation complex assembly(GO:0045899) |
| 0.1 | 2.1 | GO:0055026 | negative regulation of cardiac muscle tissue development(GO:0055026) |
| 0.1 | 0.2 | GO:0070105 | positive regulation of interleukin-6-mediated signaling pathway(GO:0070105) |
| 0.1 | 0.3 | GO:0050779 | RNA destabilization(GO:0050779) |
| 0.1 | 1.8 | GO:0035024 | negative regulation of Rho protein signal transduction(GO:0035024) |
| 0.1 | 0.6 | GO:0048842 | positive regulation of axon extension involved in axon guidance(GO:0048842) |
| 0.1 | 0.3 | GO:0019086 | late viral transcription(GO:0019086) |
| 0.1 | 1.6 | GO:0071218 | cellular response to misfolded protein(GO:0071218) |
| 0.1 | 2.8 | GO:0051031 | tRNA export from nucleus(GO:0006409) tRNA transport(GO:0051031) tRNA-containing ribonucleoprotein complex export from nucleus(GO:0071431) |
| 0.1 | 1.5 | GO:0071577 | zinc II ion transmembrane transport(GO:0071577) |
| 0.1 | 1.1 | GO:2001241 | positive regulation of extrinsic apoptotic signaling pathway in absence of ligand(GO:2001241) |
| 0.1 | 3.1 | GO:0030317 | sperm motility(GO:0030317) |
| 0.1 | 0.4 | GO:0090481 | pyrimidine nucleotide-sugar transmembrane transport(GO:0090481) |
| 0.1 | 1.6 | GO:2000144 | positive regulation of DNA-templated transcription, initiation(GO:2000144) |
| 0.1 | 2.3 | GO:0007099 | centriole replication(GO:0007099) |
| 0.1 | 0.8 | GO:0097264 | self proteolysis(GO:0097264) |
| 0.1 | 0.6 | GO:0048251 | elastic fiber assembly(GO:0048251) |
| 0.1 | 0.7 | GO:0015985 | energy coupled proton transport, down electrochemical gradient(GO:0015985) ATP synthesis coupled proton transport(GO:0015986) |
| 0.1 | 1.7 | GO:0070584 | mitochondrion morphogenesis(GO:0070584) |
| 0.1 | 1.2 | GO:0060009 | Sertoli cell development(GO:0060009) |
| 0.1 | 1.5 | GO:0016338 | calcium-independent cell-cell adhesion via plasma membrane cell-adhesion molecules(GO:0016338) |
| 0.1 | 1.5 | GO:0035428 | hexose transmembrane transport(GO:0035428) glucose transmembrane transport(GO:1904659) |
| 0.1 | 3.9 | GO:0070125 | mitochondrial translational elongation(GO:0070125) |
| 0.0 | 0.6 | GO:0043374 | CD8-positive, alpha-beta T cell differentiation(GO:0043374) |
| 0.0 | 0.5 | GO:0010623 | programmed cell death involved in cell development(GO:0010623) |
| 0.0 | 0.5 | GO:0034501 | protein localization to kinetochore(GO:0034501) |
| 0.0 | 2.5 | GO:0006400 | tRNA modification(GO:0006400) |
| 0.0 | 0.8 | GO:0002517 | T cell tolerance induction(GO:0002517) |
| 0.0 | 0.5 | GO:0001867 | complement activation, lectin pathway(GO:0001867) |
| 0.0 | 1.2 | GO:0017004 | cytochrome complex assembly(GO:0017004) |
| 0.0 | 1.0 | GO:0006779 | porphyrin-containing compound biosynthetic process(GO:0006779) |
| 0.0 | 1.5 | GO:0001958 | endochondral ossification(GO:0001958) replacement ossification(GO:0036075) |
| 0.0 | 1.1 | GO:0006768 | biotin metabolic process(GO:0006768) |
| 0.0 | 1.2 | GO:0006418 | tRNA aminoacylation for protein translation(GO:0006418) |
| 0.0 | 0.7 | GO:0015884 | folic acid transport(GO:0015884) |
| 0.0 | 0.8 | GO:0043586 | tongue development(GO:0043586) |
| 0.0 | 2.3 | GO:0030490 | maturation of SSU-rRNA(GO:0030490) |
| 0.0 | 0.6 | GO:0002523 | leukocyte migration involved in inflammatory response(GO:0002523) |
| 0.0 | 1.3 | GO:0030252 | growth hormone secretion(GO:0030252) |
| 0.0 | 1.3 | GO:0030517 | negative regulation of axon extension(GO:0030517) |
| 0.0 | 0.7 | GO:0060046 | regulation of acrosome reaction(GO:0060046) |
| 0.0 | 0.2 | GO:1904879 | positive regulation of calcium ion transmembrane transport via high voltage-gated calcium channel(GO:1904879) |
| 0.0 | 1.0 | GO:0034453 | microtubule anchoring(GO:0034453) |
| 0.0 | 2.7 | GO:0030049 | muscle filament sliding(GO:0030049) actin-myosin filament sliding(GO:0033275) |
| 0.0 | 2.5 | GO:0006611 | protein export from nucleus(GO:0006611) |
| 0.0 | 0.3 | GO:1900113 | negative regulation of histone H3-K9 trimethylation(GO:1900113) |
| 0.0 | 1.3 | GO:0046627 | negative regulation of insulin receptor signaling pathway(GO:0046627) |
| 0.0 | 0.4 | GO:1903975 | regulation of glial cell migration(GO:1903975) |
| 0.0 | 0.8 | GO:0010801 | negative regulation of peptidyl-threonine phosphorylation(GO:0010801) |
| 0.0 | 0.5 | GO:0030220 | platelet formation(GO:0030220) |
| 0.0 | 2.2 | GO:0006501 | C-terminal protein lipidation(GO:0006501) |
| 0.0 | 3.2 | GO:0070527 | platelet aggregation(GO:0070527) |
| 0.0 | 0.1 | GO:0033861 | negative regulation of NAD(P)H oxidase activity(GO:0033861) |
| 0.0 | 1.9 | GO:0010501 | RNA secondary structure unwinding(GO:0010501) |
| 0.0 | 0.5 | GO:0036010 | protein localization to endosome(GO:0036010) |
| 0.0 | 0.4 | GO:0051964 | negative regulation of synapse assembly(GO:0051964) |
| 0.0 | 0.8 | GO:0030212 | hyaluronan metabolic process(GO:0030212) |
| 0.0 | 0.2 | GO:1904779 | regulation of protein localization to centrosome(GO:1904779) positive regulation of protein localization to centrosome(GO:1904781) |
| 0.0 | 0.1 | GO:0072423 | response to cell cycle checkpoint signaling(GO:0072396) response to DNA integrity checkpoint signaling(GO:0072402) response to DNA damage checkpoint signaling(GO:0072423) |
| 0.0 | 0.3 | GO:0035728 | response to hepatocyte growth factor(GO:0035728) |
| 0.0 | 0.7 | GO:0006309 | apoptotic DNA fragmentation(GO:0006309) |
| 0.0 | 0.7 | GO:0035635 | entry of bacterium into host cell(GO:0035635) |
| 0.0 | 5.8 | GO:0017148 | negative regulation of translation(GO:0017148) |
| 0.0 | 0.5 | GO:0051894 | positive regulation of focal adhesion assembly(GO:0051894) |
| 0.0 | 0.6 | GO:0048873 | homeostasis of number of cells within a tissue(GO:0048873) |
| 0.0 | 0.4 | GO:0045725 | positive regulation of glycogen biosynthetic process(GO:0045725) |
| 0.0 | 0.6 | GO:0050869 | negative regulation of B cell activation(GO:0050869) |
| 0.0 | 1.3 | GO:0010803 | regulation of tumor necrosis factor-mediated signaling pathway(GO:0010803) |
| 0.0 | 0.9 | GO:0000027 | ribosomal large subunit assembly(GO:0000027) |
| 0.0 | 0.5 | GO:0071420 | cellular response to histamine(GO:0071420) |
| 0.0 | 0.6 | GO:0045668 | negative regulation of osteoblast differentiation(GO:0045668) |
| 0.0 | 1.3 | GO:0009301 | snRNA transcription(GO:0009301) snRNA transcription from RNA polymerase II promoter(GO:0042795) |
| 0.0 | 0.2 | GO:0051005 | negative regulation of lipoprotein lipase activity(GO:0051005) |
| 0.0 | 0.7 | GO:0018146 | keratan sulfate biosynthetic process(GO:0018146) |
| 0.0 | 0.2 | GO:0034472 | snRNA 3'-end processing(GO:0034472) |
| 0.0 | 0.4 | GO:0006957 | complement activation, alternative pathway(GO:0006957) |
| 0.0 | 0.7 | GO:2000816 | negative regulation of mitotic sister chromatid separation(GO:2000816) |
| 0.0 | 1.0 | GO:1903146 | regulation of mitophagy(GO:1903146) |
| 0.0 | 0.3 | GO:0019371 | cyclooxygenase pathway(GO:0019371) |
| 0.0 | 0.4 | GO:1901687 | glutathione derivative metabolic process(GO:1901685) glutathione derivative biosynthetic process(GO:1901687) |
| 0.0 | 0.5 | GO:0010039 | response to iron ion(GO:0010039) |
| 0.0 | 0.8 | GO:0042273 | ribosomal large subunit biogenesis(GO:0042273) |
| 0.0 | 1.9 | GO:0006614 | SRP-dependent cotranslational protein targeting to membrane(GO:0006614) |
| 0.0 | 0.2 | GO:0045603 | positive regulation of endothelial cell differentiation(GO:0045603) |
| 0.0 | 0.8 | GO:0006904 | vesicle docking involved in exocytosis(GO:0006904) |
| 0.0 | 0.4 | GO:0030261 | chromosome condensation(GO:0030261) |
| 0.0 | 0.4 | GO:0006488 | dolichol-linked oligosaccharide biosynthetic process(GO:0006488) |
| 0.0 | 0.4 | GO:0039694 | viral RNA genome replication(GO:0039694) RNA replication(GO:0039703) |
| 0.0 | 0.4 | GO:0034204 | lipid translocation(GO:0034204) phospholipid translocation(GO:0045332) |
| 0.0 | 0.4 | GO:0045747 | positive regulation of Notch signaling pathway(GO:0045747) |
| 0.0 | 0.1 | GO:0007379 | segment specification(GO:0007379) |
| 0.0 | 0.3 | GO:0034315 | regulation of Arp2/3 complex-mediated actin nucleation(GO:0034315) |
| 0.0 | 0.5 | GO:0034308 | primary alcohol metabolic process(GO:0034308) |
| 0.0 | 1.3 | GO:0051225 | spindle assembly(GO:0051225) |
| 0.0 | 0.0 | GO:1902856 | negative regulation of nonmotile primary cilium assembly(GO:1902856) |
| 0.0 | 0.8 | GO:0001523 | retinoid metabolic process(GO:0001523) |
| 0.0 | 0.2 | GO:0045662 | negative regulation of myoblast differentiation(GO:0045662) |
| 0.0 | 0.5 | GO:0006270 | DNA replication initiation(GO:0006270) |
Gene overrepresentation in cellular component category:
| Log-likelihood per target | Total log-likelihood | Term | Description |
|---|---|---|---|
| 3.0 | 32.9 | GO:0035692 | macrophage migration inhibitory factor receptor complex(GO:0035692) |
| 1.5 | 6.0 | GO:0034685 | integrin alphav-beta6 complex(GO:0034685) |
| 1.2 | 4.9 | GO:0097125 | cyclin B1-CDK1 complex(GO:0097125) |
| 1.2 | 13.0 | GO:0033588 | Elongator holoenzyme complex(GO:0033588) |
| 1.1 | 3.4 | GO:0044611 | nuclear pore inner ring(GO:0044611) |
| 0.8 | 3.3 | GO:0001405 | presequence translocase-associated import motor(GO:0001405) |
| 0.8 | 6.8 | GO:0032133 | chromosome passenger complex(GO:0032133) |
| 0.8 | 2.3 | GO:0071148 | TEAD-1-YAP complex(GO:0071148) |
| 0.6 | 3.5 | GO:0035867 | alphav-beta3 integrin-IGF-1-IGF1R complex(GO:0035867) |
| 0.5 | 2.7 | GO:1990796 | photoreceptor cell terminal bouton(GO:1990796) |
| 0.5 | 2.2 | GO:0033186 | CAF-1 complex(GO:0033186) |
| 0.5 | 2.1 | GO:0031838 | haptoglobin-hemoglobin complex(GO:0031838) |
| 0.5 | 2.1 | GO:0034365 | discoidal high-density lipoprotein particle(GO:0034365) |
| 0.5 | 1.6 | GO:0071062 | alphav-beta3 integrin-vitronectin complex(GO:0071062) |
| 0.5 | 1.4 | GO:0030689 | Noc complex(GO:0030689) |
| 0.4 | 5.5 | GO:0098647 | collagen type VI trimer(GO:0005589) collagen beaded filament(GO:0098647) |
| 0.4 | 2.1 | GO:0031905 | early endosome lumen(GO:0031905) |
| 0.4 | 2.4 | GO:1990584 | cardiac Troponin complex(GO:1990584) |
| 0.4 | 1.1 | GO:0043512 | inhibin complex(GO:0043511) inhibin A complex(GO:0043512) |
| 0.3 | 1.3 | GO:0036502 | Derlin-1-VIMP complex(GO:0036502) |
| 0.3 | 1.9 | GO:0005785 | signal recognition particle receptor complex(GO:0005785) |
| 0.3 | 2.9 | GO:0042382 | paraspeckles(GO:0042382) |
| 0.3 | 3.1 | GO:0035686 | sperm fibrous sheath(GO:0035686) |
| 0.3 | 1.2 | GO:0002139 | stereocilia coupling link(GO:0002139) |
| 0.2 | 2.3 | GO:0097443 | sorting endosome(GO:0097443) |
| 0.2 | 10.4 | GO:0045095 | keratin filament(GO:0045095) |
| 0.2 | 1.6 | GO:0032982 | myosin filament(GO:0032982) |
| 0.2 | 1.1 | GO:0045160 | myosin I complex(GO:0045160) |
| 0.2 | 3.3 | GO:0045120 | pronucleus(GO:0045120) |
| 0.2 | 4.4 | GO:0031932 | TORC2 complex(GO:0031932) |
| 0.2 | 1.8 | GO:0070765 | gamma-secretase complex(GO:0070765) |
| 0.2 | 3.4 | GO:0031089 | platelet dense granule lumen(GO:0031089) |
| 0.2 | 1.3 | GO:0005672 | transcription factor TFIIA complex(GO:0005672) |
| 0.2 | 2.8 | GO:0031080 | nuclear pore outer ring(GO:0031080) |
| 0.2 | 1.0 | GO:0032437 | cuticular plate(GO:0032437) |
| 0.2 | 2.3 | GO:0071438 | invadopodium membrane(GO:0071438) |
| 0.2 | 0.5 | GO:0097441 | basilar dendrite(GO:0097441) |
| 0.1 | 1.8 | GO:0005577 | fibrinogen complex(GO:0005577) |
| 0.1 | 1.4 | GO:0031595 | nuclear proteasome complex(GO:0031595) |
| 0.1 | 1.2 | GO:0097452 | GAIT complex(GO:0097452) |
| 0.1 | 0.8 | GO:0070554 | synaptobrevin 2-SNAP-25-syntaxin-3-complexin complex(GO:0070554) |
| 0.1 | 2.3 | GO:0005922 | connexon complex(GO:0005922) |
| 0.1 | 0.6 | GO:0031673 | H zone(GO:0031673) |
| 0.1 | 2.6 | GO:0097342 | ripoptosome(GO:0097342) |
| 0.1 | 0.5 | GO:0005899 | insulin receptor complex(GO:0005899) |
| 0.1 | 0.3 | GO:0097058 | CRLF-CLCF1 complex(GO:0097058) |
| 0.1 | 0.6 | GO:0000172 | ribonuclease MRP complex(GO:0000172) |
| 0.1 | 3.9 | GO:0005762 | organellar large ribosomal subunit(GO:0000315) mitochondrial large ribosomal subunit(GO:0005762) |
| 0.1 | 1.0 | GO:0005614 | interstitial matrix(GO:0005614) |
| 0.1 | 1.3 | GO:0017146 | NMDA selective glutamate receptor complex(GO:0017146) |
| 0.1 | 0.4 | GO:0043541 | UDP-N-acetylglucosamine transferase complex(GO:0043541) |
| 0.1 | 2.7 | GO:0071011 | precatalytic spliceosome(GO:0071011) |
| 0.1 | 1.0 | GO:0043020 | NADPH oxidase complex(GO:0043020) |
| 0.1 | 1.5 | GO:0031095 | platelet dense tubular network membrane(GO:0031095) |
| 0.1 | 0.6 | GO:0071953 | elastic fiber(GO:0071953) |
| 0.1 | 0.9 | GO:0097136 | Bcl-2 family protein complex(GO:0097136) |
| 0.1 | 3.0 | GO:0005859 | muscle myosin complex(GO:0005859) |
| 0.1 | 0.5 | GO:0000788 | nuclear nucleosome(GO:0000788) |
| 0.1 | 0.7 | GO:0000220 | vacuolar proton-transporting V-type ATPase, V0 domain(GO:0000220) |
| 0.1 | 1.5 | GO:0014731 | spectrin-associated cytoskeleton(GO:0014731) |
| 0.1 | 0.7 | GO:0036513 | Derlin-1 retrotranslocation complex(GO:0036513) |
| 0.1 | 1.0 | GO:0045239 | tricarboxylic acid cycle enzyme complex(GO:0045239) |
| 0.1 | 0.7 | GO:0005915 | zonula adherens(GO:0005915) |
| 0.1 | 1.1 | GO:0097225 | sperm midpiece(GO:0097225) |
| 0.1 | 0.3 | GO:0045273 | mitochondrial respiratory chain complex II, succinate dehydrogenase complex (ubiquinone)(GO:0005749) succinate dehydrogenase complex (ubiquinone)(GO:0045257) respiratory chain complex II(GO:0045273) succinate dehydrogenase complex(GO:0045281) fumarate reductase complex(GO:0045283) |
| 0.1 | 1.0 | GO:0097228 | sperm principal piece(GO:0097228) |
| 0.1 | 0.3 | GO:0000408 | EKC/KEOPS complex(GO:0000408) |
| 0.0 | 0.4 | GO:0005579 | membrane attack complex(GO:0005579) |
| 0.0 | 2.6 | GO:0016459 | myosin complex(GO:0016459) |
| 0.0 | 0.2 | GO:1990851 | Wnt-Frizzled-LRP5/6 complex(GO:1990851) |
| 0.0 | 0.5 | GO:0000808 | origin recognition complex(GO:0000808) nuclear origin of replication recognition complex(GO:0005664) |
| 0.0 | 22.2 | GO:0005759 | mitochondrial matrix(GO:0005759) |
| 0.0 | 1.2 | GO:0032420 | stereocilium(GO:0032420) |
| 0.0 | 0.3 | GO:0042406 | extrinsic component of endoplasmic reticulum membrane(GO:0042406) |
| 0.0 | 0.6 | GO:0005869 | dynactin complex(GO:0005869) |
| 0.0 | 0.6 | GO:0005736 | DNA-directed RNA polymerase I complex(GO:0005736) |
| 0.0 | 2.1 | GO:0031463 | Cul3-RING ubiquitin ligase complex(GO:0031463) |
| 0.0 | 0.7 | GO:0071437 | invadopodium(GO:0071437) |
| 0.0 | 1.5 | GO:0001917 | photoreceptor inner segment(GO:0001917) |
| 0.0 | 0.4 | GO:0005790 | smooth endoplasmic reticulum(GO:0005790) |
| 0.0 | 1.0 | GO:0032040 | small-subunit processome(GO:0032040) |
| 0.0 | 1.3 | GO:0001533 | cornified envelope(GO:0001533) |
| 0.0 | 0.6 | GO:0036020 | endolysosome membrane(GO:0036020) |
| 0.0 | 2.4 | GO:0034707 | chloride channel complex(GO:0034707) |
| 0.0 | 2.5 | GO:0005778 | peroxisomal membrane(GO:0005778) microbody membrane(GO:0031903) |
| 0.0 | 0.8 | GO:0030687 | preribosome, large subunit precursor(GO:0030687) |
| 0.0 | 2.5 | GO:0005643 | nuclear pore(GO:0005643) |
| 0.0 | 0.3 | GO:0005641 | nuclear envelope lumen(GO:0005641) |
| 0.0 | 0.2 | GO:0071541 | eukaryotic translation initiation factor 3 complex, eIF3m(GO:0071541) |
| 0.0 | 1.7 | GO:0005581 | collagen trimer(GO:0005581) |
| 0.0 | 2.6 | GO:0045111 | intermediate filament cytoskeleton(GO:0045111) |
| 0.0 | 0.4 | GO:0005662 | DNA replication factor A complex(GO:0005662) |
| 0.0 | 1.8 | GO:0035580 | specific granule lumen(GO:0035580) |
| 0.0 | 0.6 | GO:0005719 | nuclear euchromatin(GO:0005719) |
| 0.0 | 0.1 | GO:0030893 | meiotic cohesin complex(GO:0030893) |
| 0.0 | 1.8 | GO:0032588 | trans-Golgi network membrane(GO:0032588) |
| 0.0 | 0.1 | GO:0070044 | synaptobrevin 2-SNAP-25-syntaxin-1a complex(GO:0070044) |
| 0.0 | 2.2 | GO:0005913 | cell-cell adherens junction(GO:0005913) |
| 0.0 | 1.6 | GO:0030864 | cortical actin cytoskeleton(GO:0030864) |
| 0.0 | 1.1 | GO:0005771 | multivesicular body(GO:0005771) |
| 0.0 | 0.3 | GO:0005721 | pericentric heterochromatin(GO:0005721) |
| 0.0 | 17.6 | GO:0005789 | endoplasmic reticulum membrane(GO:0005789) |
| 0.0 | 0.6 | GO:0030863 | cortical cytoskeleton(GO:0030863) |
| 0.0 | 2.3 | GO:0031225 | anchored component of membrane(GO:0031225) |
| 0.0 | 4.5 | GO:0005743 | mitochondrial inner membrane(GO:0005743) |
| 0.0 | 0.9 | GO:0072686 | mitotic spindle(GO:0072686) |
| 0.0 | 1.0 | GO:0000777 | condensed chromosome kinetochore(GO:0000777) |
| 0.0 | 0.2 | GO:1990454 | L-type voltage-gated calcium channel complex(GO:1990454) |
| 0.0 | 0.3 | GO:0009925 | basal plasma membrane(GO:0009925) |
| 0.0 | 0.4 | GO:0016592 | mediator complex(GO:0016592) |
| 0.0 | 1.9 | GO:0072562 | blood microparticle(GO:0072562) |
| 0.0 | 1.4 | GO:0005923 | bicellular tight junction(GO:0005923) |
Gene overrepresentation in molecular function category:
| Log-likelihood per target | Total log-likelihood | Term | Description |
|---|---|---|---|
| 1.5 | 4.4 | GO:0003974 | UDP-N-acetylglucosamine 4-epimerase activity(GO:0003974) UDP-glucose 4-epimerase activity(GO:0003978) |
| 1.3 | 5.2 | GO:0004853 | uroporphyrinogen decarboxylase activity(GO:0004853) |
| 1.2 | 15.2 | GO:1990825 | sequence-specific mRNA binding(GO:1990825) |
| 1.1 | 40.4 | GO:0005540 | hyaluronic acid binding(GO:0005540) |
| 0.9 | 5.3 | GO:0043023 | ribosomal large subunit binding(GO:0043023) |
| 0.8 | 3.4 | GO:0060230 | lipoprotein lipase activator activity(GO:0060230) |
| 0.8 | 4.9 | GO:0061575 | cyclin-dependent protein serine/threonine kinase activator activity(GO:0061575) |
| 0.8 | 29.4 | GO:0001972 | retinoic acid binding(GO:0001972) glucuronosyltransferase activity(GO:0015020) |
| 0.7 | 1.5 | GO:0043682 | copper-exporting ATPase activity(GO:0004008) copper-transporting ATPase activity(GO:0043682) |
| 0.7 | 2.1 | GO:0035650 | AP-1 adaptor complex binding(GO:0035650) AP-3 adaptor complex binding(GO:0035651) |
| 0.6 | 3.9 | GO:0004489 | methylenetetrahydrofolate reductase (NAD(P)H) activity(GO:0004489) |
| 0.5 | 4.3 | GO:0004126 | cytidine deaminase activity(GO:0004126) |
| 0.5 | 3.7 | GO:0005134 | interleukin-2 receptor binding(GO:0005134) |
| 0.5 | 2.0 | GO:0003938 | IMP dehydrogenase activity(GO:0003938) |
| 0.5 | 1.5 | GO:0004618 | phosphoglycerate kinase activity(GO:0004618) |
| 0.4 | 4.3 | GO:0004784 | superoxide dismutase activity(GO:0004784) oxidoreductase activity, acting on superoxide radicals as acceptor(GO:0016721) |
| 0.4 | 2.1 | GO:0004370 | glycerol kinase activity(GO:0004370) |
| 0.4 | 1.2 | GO:0035605 | peptidyl-cysteine S-nitrosylase activity(GO:0035605) |
| 0.4 | 1.6 | GO:0008192 | RNA guanylyltransferase activity(GO:0008192) |
| 0.4 | 4.0 | GO:0016918 | retinal binding(GO:0016918) |
| 0.4 | 1.1 | GO:0008511 | sodium:potassium:chloride symporter activity(GO:0008511) |
| 0.3 | 1.0 | GO:0036487 | nitric-oxide synthase inhibitor activity(GO:0036487) |
| 0.3 | 3.4 | GO:0031013 | troponin I binding(GO:0031013) |
| 0.3 | 1.4 | GO:0001632 | leukotriene B4 receptor activity(GO:0001632) |
| 0.3 | 4.0 | GO:0015129 | lactate transmembrane transporter activity(GO:0015129) |
| 0.3 | 1.9 | GO:0005047 | signal recognition particle binding(GO:0005047) |
| 0.3 | 2.5 | GO:0015349 | thyroid hormone transmembrane transporter activity(GO:0015349) |
| 0.3 | 6.2 | GO:0008510 | sodium:bicarbonate symporter activity(GO:0008510) |
| 0.3 | 2.1 | GO:0030492 | hemoglobin binding(GO:0030492) |
| 0.3 | 2.3 | GO:0030229 | very-low-density lipoprotein particle receptor activity(GO:0030229) |
| 0.3 | 1.1 | GO:0031716 | calcitonin receptor binding(GO:0031716) |
| 0.3 | 1.1 | GO:0047708 | biotinidase activity(GO:0047708) |
| 0.3 | 0.8 | GO:0030337 | DNA polymerase processivity factor activity(GO:0030337) |
| 0.3 | 0.8 | GO:0005173 | stem cell factor receptor binding(GO:0005173) |
| 0.3 | 1.0 | GO:0004356 | glutamate-ammonia ligase activity(GO:0004356) ammonia ligase activity(GO:0016211) acid-ammonia (or amide) ligase activity(GO:0016880) |
| 0.2 | 5.2 | GO:0017049 | GTP-Rho binding(GO:0017049) |
| 0.2 | 3.7 | GO:0008140 | cAMP response element binding protein binding(GO:0008140) |
| 0.2 | 0.9 | GO:0004477 | methenyltetrahydrofolate cyclohydrolase activity(GO:0004477) methylenetetrahydrofolate dehydrogenase (NAD+) activity(GO:0004487) methylenetetrahydrofolate dehydrogenase (NADP+) activity(GO:0004488) |
| 0.2 | 3.3 | GO:0046976 | histone methyltransferase activity (H3-K27 specific)(GO:0046976) |
| 0.2 | 2.5 | GO:0005049 | nuclear export signal receptor activity(GO:0005049) |
| 0.2 | 0.9 | GO:0016426 | tRNA (adenine) methyltransferase activity(GO:0016426) |
| 0.2 | 4.1 | GO:0031996 | thioesterase binding(GO:0031996) |
| 0.2 | 1.1 | GO:0034647 | histone demethylase activity (H3-trimethyl-K4 specific)(GO:0034647) |
| 0.2 | 0.7 | GO:0098518 | polynucleotide phosphatase activity(GO:0098518) |
| 0.2 | 3.1 | GO:0005172 | vascular endothelial growth factor receptor binding(GO:0005172) |
| 0.2 | 3.5 | GO:0043295 | glutathione binding(GO:0043295) |
| 0.2 | 2.6 | GO:0005344 | oxygen transporter activity(GO:0005344) |
| 0.2 | 0.7 | GO:0004531 | deoxyribonuclease II activity(GO:0004531) |
| 0.2 | 1.7 | GO:0005381 | iron ion transmembrane transporter activity(GO:0005381) |
| 0.2 | 6.1 | GO:0017056 | structural constituent of nuclear pore(GO:0017056) |
| 0.2 | 2.4 | GO:0022840 | leak channel activity(GO:0022840) narrow pore channel activity(GO:0022842) |
| 0.2 | 1.2 | GO:0016812 | hydrolase activity, acting on carbon-nitrogen (but not peptide) bonds, in cyclic amides(GO:0016812) |
| 0.2 | 2.1 | GO:0004022 | alcohol dehydrogenase (NAD) activity(GO:0004022) |
| 0.2 | 1.7 | GO:0045545 | syndecan binding(GO:0045545) |
| 0.2 | 2.6 | GO:0015125 | bile acid transmembrane transporter activity(GO:0015125) |
| 0.2 | 2.4 | GO:0000774 | adenyl-nucleotide exchange factor activity(GO:0000774) |
| 0.2 | 2.2 | GO:0070087 | chromo shadow domain binding(GO:0070087) |
| 0.2 | 2.9 | GO:0017128 | phospholipid scramblase activity(GO:0017128) |
| 0.2 | 4.9 | GO:0070300 | phosphatidic acid binding(GO:0070300) |
| 0.2 | 1.6 | GO:0005375 | copper ion transmembrane transporter activity(GO:0005375) |
| 0.2 | 2.6 | GO:0045236 | CXCR chemokine receptor binding(GO:0045236) |
| 0.2 | 2.9 | GO:0015095 | magnesium ion transmembrane transporter activity(GO:0015095) |
| 0.2 | 1.0 | GO:0035800 | deubiquitinase activator activity(GO:0035800) |
| 0.2 | 0.7 | GO:0004348 | glucosylceramidase activity(GO:0004348) |
| 0.2 | 0.5 | GO:0052795 | exo-alpha-(2->3)-sialidase activity(GO:0052794) exo-alpha-(2->6)-sialidase activity(GO:0052795) exo-alpha-(2->8)-sialidase activity(GO:0052796) |
| 0.2 | 0.6 | GO:0031728 | CCR3 chemokine receptor binding(GO:0031728) |
| 0.2 | 1.4 | GO:0036402 | proteasome-activating ATPase activity(GO:0036402) |
| 0.2 | 0.6 | GO:1902122 | chenodeoxycholic acid binding(GO:1902122) |
| 0.1 | 13.3 | GO:0004869 | cysteine-type endopeptidase inhibitor activity(GO:0004869) |
| 0.1 | 3.3 | GO:0052629 | phosphatidylinositol-3,5-bisphosphate 3-phosphatase activity(GO:0052629) |
| 0.1 | 1.3 | GO:0050682 | AF-2 domain binding(GO:0050682) |
| 0.1 | 0.6 | GO:0005412 | glucose:sodium symporter activity(GO:0005412) |
| 0.1 | 2.2 | GO:0005149 | interleukin-1 receptor binding(GO:0005149) |
| 0.1 | 0.8 | GO:0051373 | FATZ binding(GO:0051373) |
| 0.1 | 0.7 | GO:0035673 | oligopeptide transmembrane transporter activity(GO:0035673) |
| 0.1 | 0.5 | GO:0008422 | beta-glucosidase activity(GO:0008422) |
| 0.1 | 0.8 | GO:0009378 | four-way junction helicase activity(GO:0009378) |
| 0.1 | 1.8 | GO:0043024 | ribosomal small subunit binding(GO:0043024) |
| 0.1 | 0.7 | GO:0019531 | oxalate transmembrane transporter activity(GO:0019531) |
| 0.1 | 0.4 | GO:0004577 | N-acetylglucosaminyldiphosphodolichol N-acetylglucosaminyltransferase activity(GO:0004577) |
| 0.1 | 0.4 | GO:0008502 | melatonin receptor activity(GO:0008502) |
| 0.1 | 1.1 | GO:0034711 | inhibin binding(GO:0034711) |
| 0.1 | 1.2 | GO:0033038 | bitter taste receptor activity(GO:0033038) |
| 0.1 | 3.9 | GO:0005123 | death receptor binding(GO:0005123) |
| 0.1 | 1.1 | GO:0004957 | prostaglandin E receptor activity(GO:0004957) |
| 0.1 | 2.0 | GO:0008391 | arachidonic acid monooxygenase activity(GO:0008391) arachidonic acid epoxygenase activity(GO:0008392) |
| 0.1 | 0.7 | GO:1904264 | ubiquitin protein ligase activity involved in ERAD pathway(GO:1904264) |
| 0.1 | 0.5 | GO:0005052 | peroxisome matrix targeting signal-1 binding(GO:0005052) |
| 0.1 | 1.2 | GO:0031545 | peptidyl-proline 4-dioxygenase activity(GO:0031545) |
| 0.1 | 0.4 | GO:0019976 | interleukin-2 receptor activity(GO:0004911) interleukin-2 binding(GO:0019976) |
| 0.1 | 2.2 | GO:0098641 | cadherin binding involved in cell-cell adhesion(GO:0098641) |
| 0.1 | 0.3 | GO:0034353 | RNA pyrophosphohydrolase activity(GO:0034353) |
| 0.1 | 0.6 | GO:0030267 | hydroxypyruvate reductase activity(GO:0016618) glyoxylate reductase (NADP) activity(GO:0030267) |
| 0.1 | 1.3 | GO:1990381 | ubiquitin-specific protease binding(GO:1990381) |
| 0.1 | 0.8 | GO:0004321 | fatty-acyl-CoA synthase activity(GO:0004321) |
| 0.1 | 2.3 | GO:0070064 | proline-rich region binding(GO:0070064) |
| 0.1 | 1.5 | GO:0045028 | G-protein coupled nucleotide receptor activity(GO:0001608) G-protein coupled purinergic nucleotide receptor activity(GO:0045028) |
| 0.1 | 0.9 | GO:0016174 | NAD(P)H oxidase activity(GO:0016174) |
| 0.1 | 1.4 | GO:0051400 | BH domain binding(GO:0051400) |
| 0.1 | 2.1 | GO:0005104 | fibroblast growth factor receptor binding(GO:0005104) |
| 0.1 | 0.2 | GO:0098640 | integrin binding involved in cell-matrix adhesion(GO:0098640) |
| 0.1 | 1.5 | GO:0005385 | zinc ion transmembrane transporter activity(GO:0005385) |
| 0.1 | 2.3 | GO:0032813 | tumor necrosis factor receptor superfamily binding(GO:0032813) |
| 0.1 | 1.9 | GO:0016702 | oxidoreductase activity, acting on single donors with incorporation of molecular oxygen, incorporation of two atoms of oxygen(GO:0016702) |
| 0.1 | 1.1 | GO:0019871 | sodium channel inhibitor activity(GO:0019871) |
| 0.1 | 0.4 | GO:0008142 | oxysterol binding(GO:0008142) |
| 0.1 | 0.3 | GO:0008177 | succinate dehydrogenase (ubiquinone) activity(GO:0008177) |
| 0.1 | 0.2 | GO:1904928 | coreceptor activity involved in canonical Wnt signaling pathway(GO:1904928) |
| 0.1 | 0.8 | GO:0070700 | BMP receptor binding(GO:0070700) |
| 0.1 | 4.7 | GO:0016836 | hydro-lyase activity(GO:0016836) |
| 0.1 | 1.2 | GO:0016493 | C-C chemokine receptor activity(GO:0016493) |
| 0.1 | 7.5 | GO:0003725 | double-stranded RNA binding(GO:0003725) |
| 0.1 | 10.4 | GO:0005178 | integrin binding(GO:0005178) |
| 0.1 | 1.0 | GO:0050664 | superoxide-generating NADPH oxidase activity(GO:0016175) oxidoreductase activity, acting on NAD(P)H, oxygen as acceptor(GO:0050664) |
| 0.1 | 0.9 | GO:0008320 | protein transmembrane transporter activity(GO:0008320) |
| 0.1 | 1.5 | GO:0005545 | 1-phosphatidylinositol binding(GO:0005545) |
| 0.1 | 0.6 | GO:0070492 | oligosaccharide binding(GO:0070492) |
| 0.1 | 1.1 | GO:0070016 | armadillo repeat domain binding(GO:0070016) |
| 0.1 | 7.1 | GO:0004860 | protein kinase inhibitor activity(GO:0004860) |
| 0.1 | 0.6 | GO:0004526 | ribonuclease P activity(GO:0004526) |
| 0.1 | 1.1 | GO:0017160 | Ral GTPase binding(GO:0017160) |
| 0.1 | 1.2 | GO:0016876 | aminoacyl-tRNA ligase activity(GO:0004812) ligase activity, forming carbon-oxygen bonds(GO:0016875) ligase activity, forming aminoacyl-tRNA and related compounds(GO:0016876) |
| 0.1 | 4.5 | GO:0004715 | non-membrane spanning protein tyrosine kinase activity(GO:0004715) |
| 0.1 | 0.3 | GO:0005138 | ciliary neurotrophic factor receptor binding(GO:0005127) interleukin-6 receptor binding(GO:0005138) |
| 0.1 | 0.4 | GO:0015165 | pyrimidine nucleotide-sugar transmembrane transporter activity(GO:0015165) |
| 0.1 | 0.4 | GO:0003810 | protein-glutamine gamma-glutamyltransferase activity(GO:0003810) |
| 0.1 | 0.3 | GO:0097322 | 7SK snRNA binding(GO:0097322) |
| 0.0 | 2.7 | GO:0004693 | cyclin-dependent protein serine/threonine kinase activity(GO:0004693) |
| 0.0 | 0.7 | GO:0005542 | folic acid binding(GO:0005542) |
| 0.0 | 0.7 | GO:0019864 | IgG binding(GO:0019864) |
| 0.0 | 1.3 | GO:0017025 | TBP-class protein binding(GO:0017025) |
| 0.0 | 0.4 | GO:0035251 | UDP-glucosyltransferase activity(GO:0035251) |
| 0.0 | 0.2 | GO:0017159 | pantetheine hydrolase activity(GO:0017159) |
| 0.0 | 11.7 | GO:0004252 | serine-type endopeptidase activity(GO:0004252) |
| 0.0 | 1.0 | GO:0005355 | glucose transmembrane transporter activity(GO:0005355) |
| 0.0 | 0.5 | GO:0022851 | GABA-gated chloride ion channel activity(GO:0022851) |
| 0.0 | 0.6 | GO:0001054 | RNA polymerase I activity(GO:0001054) |
| 0.0 | 0.4 | GO:0035005 | 1-phosphatidylinositol-4-phosphate 3-kinase activity(GO:0035005) |
| 0.0 | 3.6 | GO:0004867 | serine-type endopeptidase inhibitor activity(GO:0004867) |
| 0.0 | 0.1 | GO:0036033 | mediator complex binding(GO:0036033) |
| 0.0 | 0.6 | GO:0098748 | clathrin adaptor activity(GO:0035615) endocytic adaptor activity(GO:0098748) |
| 0.0 | 0.2 | GO:0010465 | nerve growth factor receptor activity(GO:0010465) |
| 0.0 | 1.7 | GO:0008138 | protein tyrosine/serine/threonine phosphatase activity(GO:0008138) |
| 0.0 | 0.5 | GO:0003688 | DNA replication origin binding(GO:0003688) |
| 0.0 | 1.5 | GO:0005484 | SNAP receptor activity(GO:0005484) |
| 0.0 | 1.9 | GO:0008186 | ATP-dependent RNA helicase activity(GO:0004004) RNA-dependent ATPase activity(GO:0008186) |
| 0.0 | 3.7 | GO:0033613 | activating transcription factor binding(GO:0033613) |
| 0.0 | 1.0 | GO:0005546 | phosphatidylinositol-4,5-bisphosphate binding(GO:0005546) |
| 0.0 | 1.0 | GO:0043015 | gamma-tubulin binding(GO:0043015) |
| 0.0 | 1.6 | GO:0051018 | protein kinase A binding(GO:0051018) |
| 0.0 | 0.9 | GO:0042169 | SH2 domain binding(GO:0042169) |
| 0.0 | 0.8 | GO:0017075 | syntaxin-1 binding(GO:0017075) |
| 0.0 | 2.7 | GO:0008307 | structural constituent of muscle(GO:0008307) |
| 0.0 | 0.7 | GO:0019905 | syntaxin binding(GO:0019905) |
| 0.0 | 1.1 | GO:0005160 | transforming growth factor beta receptor binding(GO:0005160) |
| 0.0 | 1.0 | GO:0008188 | neuropeptide receptor activity(GO:0008188) |
| 0.0 | 2.5 | GO:0000980 | RNA polymerase II distal enhancer sequence-specific DNA binding(GO:0000980) |
| 0.0 | 0.7 | GO:0005031 | tumor necrosis factor-activated receptor activity(GO:0005031) death receptor activity(GO:0005035) |
| 0.0 | 1.2 | GO:0031683 | G-protein beta/gamma-subunit complex binding(GO:0031683) |
| 0.0 | 1.8 | GO:0004843 | thiol-dependent ubiquitin-specific protease activity(GO:0004843) |
| 0.0 | 1.9 | GO:0004222 | metalloendopeptidase activity(GO:0004222) |
| 0.0 | 4.7 | GO:0003735 | structural constituent of ribosome(GO:0003735) |
| 0.0 | 1.4 | GO:0005070 | SH3/SH2 adaptor activity(GO:0005070) |
| 0.0 | 1.7 | GO:0005201 | extracellular matrix structural constituent(GO:0005201) |
| 0.0 | 0.3 | GO:0051864 | histone demethylase activity (H3-K36 specific)(GO:0051864) |
| 0.0 | 1.0 | GO:0051879 | Hsp90 protein binding(GO:0051879) |
| 0.0 | 0.1 | GO:0033857 | diphosphoinositol-pentakisphosphate kinase activity(GO:0033857) |
| 0.0 | 9.0 | GO:0005198 | structural molecule activity(GO:0005198) |
| 0.0 | 0.3 | GO:0070273 | phosphatidylinositol-4-phosphate binding(GO:0070273) |
| 0.0 | 0.2 | GO:0086056 | voltage-gated calcium channel activity involved in AV node cell action potential(GO:0086056) |
| 0.0 | 1.1 | GO:0004879 | RNA polymerase II transcription factor activity, ligand-activated sequence-specific DNA binding(GO:0004879) transcription factor activity, direct ligand regulated sequence-specific DNA binding(GO:0098531) |
| 0.0 | 1.8 | GO:0005319 | lipid transporter activity(GO:0005319) |
| 0.0 | 1.2 | GO:0017022 | myosin binding(GO:0017022) |
| 0.0 | 1.3 | GO:0004725 | protein tyrosine phosphatase activity(GO:0004725) |
| 0.0 | 1.8 | GO:0008083 | growth factor activity(GO:0008083) |
| 0.0 | 1.5 | GO:0004497 | monooxygenase activity(GO:0004497) |
| 0.0 | 0.3 | GO:0015467 | G-protein activated inward rectifier potassium channel activity(GO:0015467) |
| 0.0 | 0.9 | GO:0005544 | calcium-dependent phospholipid binding(GO:0005544) |
| 0.0 | 0.3 | GO:0008569 | ATP-dependent microtubule motor activity, minus-end-directed(GO:0008569) |
| 0.0 | 0.3 | GO:0030544 | Hsp70 protein binding(GO:0030544) |
| 0.0 | 1.3 | GO:0017124 | SH3 domain binding(GO:0017124) |
| 0.0 | 0.7 | GO:0051117 | ATPase binding(GO:0051117) |
Gene overrepresentation in curated gene sets: canonical pathways category:
| Log-likelihood per target | Total log-likelihood | Term | Description |
|---|---|---|---|
| 0.9 | 36.0 | SA MMP CYTOKINE CONNECTION | Cytokines can induce activation of matrix metalloproteinases, which degrade extracellular matrix. |
| 0.3 | 8.3 | PID INTEGRIN5 PATHWAY | Beta5 beta6 beta7 and beta8 integrin cell surface interactions |
| 0.2 | 3.8 | PID CIRCADIAN PATHWAY | Circadian rhythm pathway |
| 0.2 | 15.0 | PID FOXM1 PATHWAY | FOXM1 transcription factor network |
| 0.1 | 2.2 | PID TCR RAS PATHWAY | Ras signaling in the CD4+ TCR pathway |
| 0.1 | 5.5 | PID FRA PATHWAY | Validated transcriptional targets of AP1 family members Fra1 and Fra2 |
| 0.1 | 8.6 | PID TAP63 PATHWAY | Validated transcriptional targets of TAp63 isoforms |
| 0.1 | 1.3 | PID ANGIOPOIETIN RECEPTOR PATHWAY | Angiopoietin receptor Tie2-mediated signaling |
| 0.1 | 1.3 | PID HIV NEF PATHWAY | HIV-1 Nef: Negative effector of Fas and TNF-alpha |
| 0.1 | 10.3 | PID E2F PATHWAY | E2F transcription factor network |
| 0.1 | 1.5 | PID VEGF VEGFR PATHWAY | VEGF and VEGFR signaling network |
| 0.1 | 2.6 | SA FAS SIGNALING | The TNF-type receptor Fas induces apoptosis on ligand binding. |
| 0.1 | 3.1 | PID SYNDECAN 2 PATHWAY | Syndecan-2-mediated signaling events |
| 0.1 | 4.3 | PID DELTA NP63 PATHWAY | Validated transcriptional targets of deltaNp63 isoforms |
| 0.1 | 4.3 | PID PI3KCI AKT PATHWAY | Class I PI3K signaling events mediated by Akt |
| 0.1 | 1.8 | PID SYNDECAN 3 PATHWAY | Syndecan-3-mediated signaling events |
| 0.1 | 4.0 | PID NFAT TFPATHWAY | Calcineurin-regulated NFAT-dependent transcription in lymphocytes |
| 0.1 | 2.1 | PID IL27 PATHWAY | IL27-mediated signaling events |
| 0.1 | 3.1 | ST G ALPHA I PATHWAY | G alpha i Pathway |
| 0.1 | 1.2 | NABA BASEMENT MEMBRANES | Genes encoding structural components of basement membranes |
| 0.1 | 1.2 | PID HIF1A PATHWAY | Hypoxic and oxygen homeostasis regulation of HIF-1-alpha |
| 0.1 | 1.8 | PID GLYPICAN 1PATHWAY | Glypican 1 network |
| 0.1 | 3.5 | PID CERAMIDE PATHWAY | Ceramide signaling pathway |
| 0.1 | 0.3 | PID SYNDECAN 1 PATHWAY | Syndecan-1-mediated signaling events |
| 0.0 | 1.4 | PID SYNDECAN 4 PATHWAY | Syndecan-4-mediated signaling events |
| 0.0 | 1.8 | PID UPA UPAR PATHWAY | Urokinase-type plasminogen activator (uPA) and uPAR-mediated signaling |
| 0.0 | 0.8 | PID KIT PATHWAY | Signaling events mediated by Stem cell factor receptor (c-Kit) |
| 0.0 | 1.7 | NABA COLLAGENS | Genes encoding collagen proteins |
| 0.0 | 1.8 | SIG REGULATION OF THE ACTIN CYTOSKELETON BY RHO GTPASES | Genes related to regulation of the actin cytoskeleton |
| 0.0 | 0.8 | PID PRL SIGNALING EVENTS PATHWAY | Signaling events mediated by PRL |
| 0.0 | 1.1 | PID ALK1 PATHWAY | ALK1 signaling events |
| 0.0 | 1.6 | PID P38 ALPHA BETA DOWNSTREAM PATHWAY | Signaling mediated by p38-alpha and p38-beta |
| 0.0 | 0.7 | PID DNA PK PATHWAY | DNA-PK pathway in nonhomologous end joining |
| 0.0 | 0.6 | PID ATF2 PATHWAY | ATF-2 transcription factor network |
| 0.0 | 1.4 | PID AP1 PATHWAY | AP-1 transcription factor network |
| 0.0 | 1.6 | PID RAC1 REG PATHWAY | Regulation of RAC1 activity |
| 0.0 | 1.3 | PID HNF3A PATHWAY | FOXA1 transcription factor network |
| 0.0 | 2.4 | PID MYC ACTIV PATHWAY | Validated targets of C-MYC transcriptional activation |
| 0.0 | 0.4 | ST DIFFERENTIATION PATHWAY IN PC12 CELLS | Differentiation Pathway in PC12 Cells; this is a specific case of PAC1 Receptor Pathway. |
| 0.0 | 4.2 | NABA ECM REGULATORS | Genes encoding enzymes and their regulators involved in the remodeling of the extracellular matrix |
| 0.0 | 0.7 | PID CD8 TCR DOWNSTREAM PATHWAY | Downstream signaling in naïve CD8+ T cells |
| 0.0 | 0.1 | ST IL 13 PATHWAY | Interleukin 13 (IL-13) Pathway |
| 0.0 | 0.2 | SIG INSULIN RECEPTOR PATHWAY IN CARDIAC MYOCYTES | Genes related to the insulin receptor pathway |
| 0.0 | 2.7 | NABA ECM AFFILIATED | Genes encoding proteins affiliated structurally or functionally to extracellular matrix proteins |
| 0.0 | 5.0 | NABA MATRISOME ASSOCIATED | Ensemble of genes encoding ECM-associated proteins including ECM-affilaited proteins, ECM regulators and secreted factors |
| 0.0 | 0.6 | PID RXR VDR PATHWAY | RXR and RAR heterodimerization with other nuclear receptor |
| 0.0 | 0.4 | PID CDC42 REG PATHWAY | Regulation of CDC42 activity |
| 0.0 | 0.2 | PID WNT CANONICAL PATHWAY | Canonical Wnt signaling pathway |
| 0.0 | 0.4 | ST FAS SIGNALING PATHWAY | Fas Signaling Pathway |
Gene overrepresentation in curated gene sets: REACTOME pathways category:
| Log-likelihood per target | Total log-likelihood | Term | Description |
|---|---|---|---|
| 1.7 | 40.4 | REACTOME HYALURONAN UPTAKE AND DEGRADATION | Genes involved in Hyaluronan uptake and degradation |
| 0.7 | 17.4 | REACTOME GLUCURONIDATION | Genes involved in Glucuronidation |
| 0.6 | 5.4 | REACTOME E2F ENABLED INHIBITION OF PRE REPLICATION COMPLEX FORMATION | Genes involved in E2F-enabled inhibition of pre-replication complex formation |
| 0.5 | 15.2 | REACTOME G1 S SPECIFIC TRANSCRIPTION | Genes involved in G1/S-Specific Transcription |
| 0.3 | 5.1 | REACTOME TRANSPORT OF ORGANIC ANIONS | Genes involved in Transport of organic anions |
| 0.2 | 4.0 | REACTOME BILE SALT AND ORGANIC ANION SLC TRANSPORTERS | Genes involved in Bile salt and organic anion SLC transporters |
| 0.2 | 5.5 | REACTOME CS DS DEGRADATION | Genes involved in CS/DS degradation |
| 0.2 | 6.0 | REACTOME METAL ION SLC TRANSPORTERS | Genes involved in Metal ion SLC transporters |
| 0.2 | 3.3 | REACTOME SYNTHESIS OF PIPS AT THE LATE ENDOSOME MEMBRANE | Genes involved in Synthesis of PIPs at the late endosome membrane |
| 0.2 | 4.1 | REACTOME NRIF SIGNALS CELL DEATH FROM THE NUCLEUS | Genes involved in NRIF signals cell death from the nucleus |
| 0.2 | 2.2 | REACTOME RAF MAP KINASE CASCADE | Genes involved in RAF/MAP kinase cascade |
| 0.2 | 3.3 | REACTOME COMMON PATHWAY | Genes involved in Common Pathway |
| 0.2 | 5.2 | REACTOME METABOLISM OF PORPHYRINS | Genes involved in Metabolism of porphyrins |
| 0.2 | 6.1 | REACTOME REGULATION OF GLUCOKINASE BY GLUCOKINASE REGULATORY PROTEIN | Genes involved in Regulation of Glucokinase by Glucokinase Regulatory Protein |
| 0.1 | 4.8 | REACTOME METABOLISM OF CARBOHYDRATES | Genes involved in Metabolism of carbohydrates |
| 0.1 | 2.0 | REACTOME PURINE RIBONUCLEOSIDE MONOPHOSPHATE BIOSYNTHESIS | Genes involved in Purine ribonucleoside monophosphate biosynthesis |
| 0.1 | 2.3 | REACTOME GAP JUNCTION ASSEMBLY | Genes involved in Gap junction assembly |
| 0.1 | 2.4 | REACTOME EICOSANOID LIGAND BINDING RECEPTORS | Genes involved in Eicosanoid ligand-binding receptors |
| 0.1 | 2.0 | REACTOME XENOBIOTICS | Genes involved in Xenobiotics |
| 0.1 | 2.3 | REACTOME CHYLOMICRON MEDIATED LIPID TRANSPORT | Genes involved in Chylomicron-mediated lipid transport |
| 0.1 | 3.5 | REACTOME GLUTATHIONE CONJUGATION | Genes involved in Glutathione conjugation |
| 0.1 | 4.3 | REACTOME PIP3 ACTIVATES AKT SIGNALING | Genes involved in PIP3 activates AKT signaling |
| 0.1 | 1.5 | REACTOME VEGF LIGAND RECEPTOR INTERACTIONS | Genes involved in VEGF ligand-receptor interactions |
| 0.1 | 2.3 | REACTOME SIGNALING BY HIPPO | Genes involved in Signaling by Hippo |
| 0.1 | 0.6 | REACTOME TRYPTOPHAN CATABOLISM | Genes involved in Tryptophan catabolism |
| 0.1 | 2.6 | REACTOME EXTRINSIC PATHWAY FOR APOPTOSIS | Genes involved in Extrinsic Pathway for Apoptosis |
| 0.1 | 1.0 | REACTOME REGULATION OF INSULIN SECRETION BY ACETYLCHOLINE | Genes involved in Regulation of Insulin Secretion by Acetylcholine |
| 0.1 | 1.1 | REACTOME INHIBITION OF REPLICATION INITIATION OF DAMAGED DNA BY RB1 E2F1 | Genes involved in Inhibition of replication initiation of damaged DNA by RB1/E2F1 |
| 0.1 | 5.1 | REACTOME STRIATED MUSCLE CONTRACTION | Genes involved in Striated Muscle Contraction |
| 0.1 | 1.2 | REACTOME MITOCHONDRIAL TRNA AMINOACYLATION | Genes involved in Mitochondrial tRNA aminoacylation |
| 0.1 | 3.6 | REACTOME SMAD2 SMAD3 SMAD4 HETEROTRIMER REGULATES TRANSCRIPTION | Genes involved in SMAD2/SMAD3:SMAD4 heterotrimer regulates transcription |
| 0.1 | 1.6 | REACTOME PROTEOLYTIC CLEAVAGE OF SNARE COMPLEX PROTEINS | Genes involved in Proteolytic cleavage of SNARE complex proteins |
| 0.1 | 5.3 | REACTOME REGULATION OF ORNITHINE DECARBOXYLASE ODC | Genes involved in Regulation of ornithine decarboxylase (ODC) |
| 0.1 | 2.3 | REACTOME POST TRANSLATIONAL MODIFICATION SYNTHESIS OF GPI ANCHORED PROTEINS | Genes involved in Post-translational modification: synthesis of GPI-anchored proteins |
| 0.1 | 1.3 | REACTOME DSCAM INTERACTIONS | Genes involved in DSCAM interactions |
| 0.1 | 0.6 | REACTOME IL 7 SIGNALING | Genes involved in Interleukin-7 signaling |
| 0.1 | 1.4 | REACTOME NOREPINEPHRINE NEUROTRANSMITTER RELEASE CYCLE | Genes involved in Norepinephrine Neurotransmitter Release Cycle |
| 0.1 | 2.4 | REACTOME AMINE COMPOUND SLC TRANSPORTERS | Genes involved in Amine compound SLC transporters |
| 0.1 | 1.7 | REACTOME APC C CDC20 MEDIATED DEGRADATION OF MITOTIC PROTEINS | Genes involved in APC/C:Cdc20 mediated degradation of mitotic proteins |
| 0.1 | 3.3 | REACTOME MITOCHONDRIAL PROTEIN IMPORT | Genes involved in Mitochondrial Protein Import |
| 0.1 | 1.5 | REACTOME PRE NOTCH PROCESSING IN GOLGI | Genes involved in Pre-NOTCH Processing in Golgi |
| 0.1 | 1.2 | REACTOME CITRIC ACID CYCLE TCA CYCLE | Genes involved in Citric acid cycle (TCA cycle) |
| 0.0 | 0.5 | REACTOME CREATION OF C4 AND C2 ACTIVATORS | Genes involved in Creation of C4 and C2 activators |
| 0.0 | 2.4 | REACTOME IL1 SIGNALING | Genes involved in Interleukin-1 signaling |
| 0.0 | 0.3 | REACTOME GAB1 SIGNALOSOME | Genes involved in GAB1 signalosome |
| 0.0 | 0.5 | REACTOME DIGESTION OF DIETARY CARBOHYDRATE | Genes involved in Digestion of dietary carbohydrate |
| 0.0 | 1.7 | REACTOME TIGHT JUNCTION INTERACTIONS | Genes involved in Tight junction interactions |
| 0.0 | 3.9 | REACTOME MITOTIC PROMETAPHASE | Genes involved in Mitotic Prometaphase |
| 0.0 | 1.6 | REACTOME SMOOTH MUSCLE CONTRACTION | Genes involved in Smooth Muscle Contraction |
| 0.0 | 2.1 | REACTOME SIGNAL TRANSDUCTION BY L1 | Genes involved in Signal transduction by L1 |
| 0.0 | 0.8 | REACTOME COSTIMULATION BY THE CD28 FAMILY | Genes involved in Costimulation by the CD28 family |
| 0.0 | 2.0 | REACTOME RNA POL II TRANSCRIPTION PRE INITIATION AND PROMOTER OPENING | Genes involved in RNA Polymerase II Transcription Pre-Initiation And Promoter Opening |
| 0.0 | 0.3 | REACTOME BETA DEFENSINS | Genes involved in Beta defensins |
| 0.0 | 0.9 | REACTOME POST CHAPERONIN TUBULIN FOLDING PATHWAY | Genes involved in Post-chaperonin tubulin folding pathway |
| 0.0 | 1.3 | REACTOME CELL CELL JUNCTION ORGANIZATION | Genes involved in Cell-cell junction organization |
| 0.0 | 0.7 | REACTOME KERATAN SULFATE BIOSYNTHESIS | Genes involved in Keratan sulfate biosynthesis |
| 0.0 | 2.8 | REACTOME NUCLEAR RECEPTOR TRANSCRIPTION PATHWAY | Genes involved in Nuclear Receptor transcription pathway |
| 0.0 | 1.7 | REACTOME COLLAGEN FORMATION | Genes involved in Collagen formation |
| 0.0 | 1.0 | REACTOME TRAF6 MEDIATED IRF7 ACTIVATION | Genes involved in TRAF6 mediated IRF7 activation |
| 0.0 | 1.2 | REACTOME GLYCOLYSIS | Genes involved in Glycolysis |
| 0.0 | 1.1 | REACTOME GLYCOSPHINGOLIPID METABOLISM | Genes involved in Glycosphingolipid metabolism |
| 0.0 | 1.0 | REACTOME INTERACTION BETWEEN L1 AND ANKYRINS | Genes involved in Interaction between L1 and Ankyrins |
| 0.0 | 0.9 | REACTOME INTRINSIC PATHWAY FOR APOPTOSIS | Genes involved in Intrinsic Pathway for Apoptosis |
| 0.0 | 0.4 | REACTOME P2Y RECEPTORS | Genes involved in P2Y receptors |
| 0.0 | 0.8 | REACTOME PHASE II CONJUGATION | Genes involved in Phase II conjugation |
| 0.0 | 0.4 | REACTOME G ALPHA Q SIGNALLING EVENTS | Genes involved in G alpha (q) signalling events |
| 0.0 | 0.5 | REACTOME CELL EXTRACELLULAR MATRIX INTERACTIONS | Genes involved in Cell-extracellular matrix interactions |
| 0.0 | 0.4 | REACTOME TRANSPORT OF VITAMINS NUCLEOSIDES AND RELATED MOLECULES | Genes involved in Transport of vitamins, nucleosides, and related molecules |
| 0.0 | 1.1 | REACTOME REGULATION OF MRNA STABILITY BY PROTEINS THAT BIND AU RICH ELEMENTS | Genes involved in Regulation of mRNA Stability by Proteins that Bind AU-rich Elements |
| 0.0 | 0.3 | REACTOME FGFR1 LIGAND BINDING AND ACTIVATION | Genes involved in FGFR1 ligand binding and activation |
| 0.0 | 0.4 | REACTOME MRNA SPLICING MINOR PATHWAY | Genes involved in mRNA Splicing - Minor Pathway |
| 0.0 | 1.0 | REACTOME LOSS OF NLP FROM MITOTIC CENTROSOMES | Genes involved in Loss of Nlp from mitotic centrosomes |
| 0.0 | 0.5 | REACTOME GABA A RECEPTOR ACTIVATION | Genes involved in GABA A receptor activation |
| 0.0 | 0.4 | REACTOME DCC MEDIATED ATTRACTIVE SIGNALING | Genes involved in DCC mediated attractive signaling |
| 0.0 | 0.4 | REACTOME BIOSYNTHESIS OF THE N GLYCAN PRECURSOR DOLICHOL LIPID LINKED OLIGOSACCHARIDE LLO AND TRANSFER TO A NASCENT PROTEIN | Genes involved in Biosynthesis of the N-glycan precursor (dolichol lipid-linked oligosaccharide, LLO) and transfer to a nascent protein |
| 0.0 | 0.4 | REACTOME COMPLEMENT CASCADE | Genes involved in Complement cascade |
| 0.0 | 0.4 | REACTOME SYNTHESIS OF PIPS AT THE PLASMA MEMBRANE | Genes involved in Synthesis of PIPs at the plasma membrane |
| 0.0 | 0.3 | REACTOME INHIBITION OF VOLTAGE GATED CA2 CHANNELS VIA GBETA GAMMA SUBUNITS | Genes involved in Inhibition of voltage gated Ca2+ channels via Gbeta/gamma subunits |
| 0.0 | 0.2 | REACTOME INHIBITION OF INSULIN SECRETION BY ADRENALINE NORADRENALINE | Genes involved in Inhibition of Insulin Secretion by Adrenaline/Noradrenaline |
| 0.0 | 0.3 | REACTOME OXYGEN DEPENDENT PROLINE HYDROXYLATION OF HYPOXIA INDUCIBLE FACTOR ALPHA | Genes involved in Oxygen-dependent Proline Hydroxylation of Hypoxia-inducible Factor Alpha |