Project
GNF SymAtlas + NCI-60 cancer cell lines, human (Su, 2004; Ross, 2000)
Navigation
Downloads
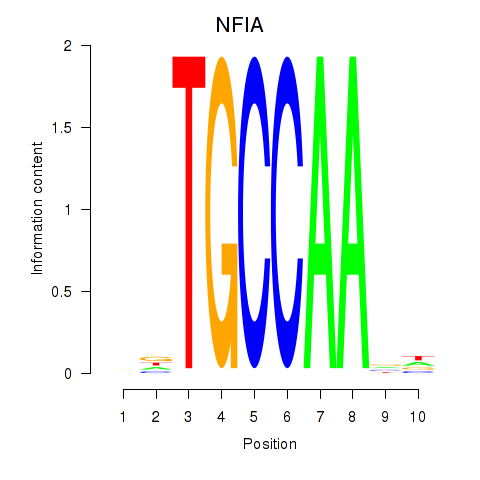
Results for NFIA
Z-value: 0.82
Motif logo
Transcription factors associated with NFIA
| Gene Symbol | Gene ID | Gene Info |
|---|---|---|
|
NFIA
|
ENSG00000162599.17 | NFIA |
Activity profile of NFIA motif
Sorted Z-values of NFIA motif
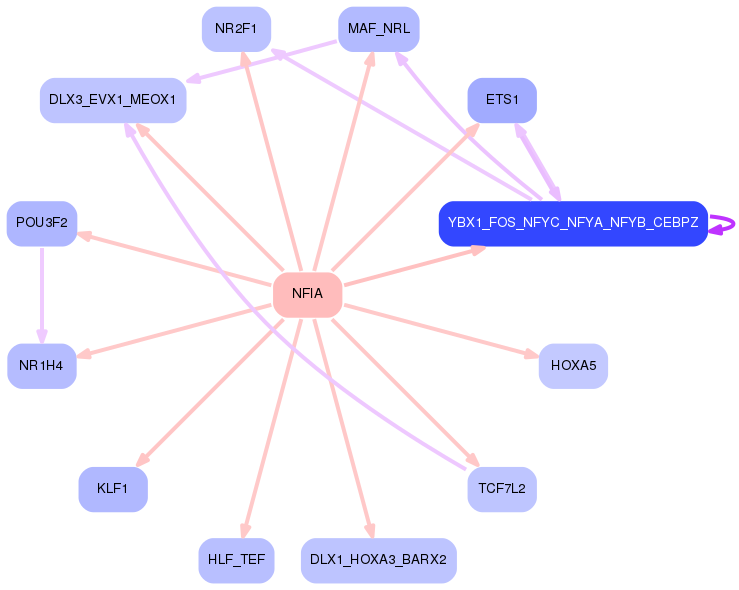
Network of associatons between targets according to the STRING database.

First level regulatory network of NFIA
Gene Ontology Analysis
Gene overrepresentation in biological process category:
| Log-likelihood per target | Total log-likelihood | Term | Description |
|---|---|---|---|
| 2.9 | 17.6 | GO:0038016 | insulin receptor internalization(GO:0038016) |
| 2.4 | 7.1 | GO:0036292 | DNA rewinding(GO:0036292) |
| 2.2 | 8.8 | GO:1902530 | regulation of protein linear polyubiquitination(GO:1902528) positive regulation of protein linear polyubiquitination(GO:1902530) |
| 2.1 | 20.8 | GO:0036309 | protein localization to M-band(GO:0036309) protein localization to T-tubule(GO:0036371) |
| 2.0 | 6.0 | GO:0007181 | transforming growth factor beta receptor complex assembly(GO:0007181) |
| 1.3 | 13.4 | GO:0021633 | optic nerve structural organization(GO:0021633) |
| 1.3 | 11.7 | GO:0001661 | conditioned taste aversion(GO:0001661) |
| 1.3 | 3.8 | GO:0052331 | hemolysis by symbiont of host erythrocytes(GO:0019836) hemolysis in other organism(GO:0044179) hemolysis in other organism involved in symbiotic interaction(GO:0052331) |
| 1.2 | 11.1 | GO:0050882 | voluntary musculoskeletal movement(GO:0050882) |
| 1.2 | 2.5 | GO:1904049 | negative regulation of spontaneous neurotransmitter secretion(GO:1904049) |
| 1.2 | 18.0 | GO:0001778 | plasma membrane repair(GO:0001778) |
| 1.2 | 4.8 | GO:1904640 | response to methionine(GO:1904640) |
| 1.1 | 3.4 | GO:0044278 | cell wall disruption in other organism(GO:0044278) |
| 1.1 | 4.5 | GO:0071395 | response to jasmonic acid(GO:0009753) cellular response to jasmonic acid stimulus(GO:0071395) |
| 1.1 | 4.5 | GO:0090290 | positive regulation of osteoclast proliferation(GO:0090290) negative regulation of bone mineralization involved in bone maturation(GO:1900158) |
| 1.1 | 3.2 | GO:0021913 | regulation of transcription from RNA polymerase II promoter involved in ventral spinal cord interneuron specification(GO:0021913) |
| 1.1 | 6.5 | GO:0060414 | aorta smooth muscle tissue morphogenesis(GO:0060414) |
| 1.0 | 3.1 | GO:0002503 | peptide antigen assembly with MHC class II protein complex(GO:0002503) |
| 1.0 | 6.1 | GO:0006651 | diacylglycerol biosynthetic process(GO:0006651) |
| 1.0 | 21.3 | GO:0001829 | trophectodermal cell differentiation(GO:0001829) |
| 1.0 | 1.9 | GO:2000118 | regulation of sodium-dependent phosphate transport(GO:2000118) |
| 1.0 | 9.5 | GO:0006537 | glutamate biosynthetic process(GO:0006537) gamma-aminobutyric acid biosynthetic process(GO:0009449) |
| 0.9 | 0.9 | GO:0051040 | regulation of calcium-independent cell-cell adhesion(GO:0051040) |
| 0.9 | 4.6 | GO:0015688 | response to mycotoxin(GO:0010046) iron chelate transport(GO:0015688) siderophore transport(GO:0015891) |
| 0.9 | 5.4 | GO:0046092 | deoxycytidine metabolic process(GO:0046092) |
| 0.9 | 11.6 | GO:0070327 | thyroid hormone transport(GO:0070327) |
| 0.9 | 3.5 | GO:1904383 | response to sodium phosphate(GO:1904383) |
| 0.9 | 16.6 | GO:0015671 | oxygen transport(GO:0015671) |
| 0.8 | 6.8 | GO:0003190 | atrioventricular valve formation(GO:0003190) |
| 0.7 | 8.7 | GO:0051612 | negative regulation of neurotransmitter uptake(GO:0051581) regulation of serotonin uptake(GO:0051611) negative regulation of serotonin uptake(GO:0051612) |
| 0.7 | 4.3 | GO:0072502 | cellular phosphate ion homeostasis(GO:0030643) cellular trivalent inorganic anion homeostasis(GO:0072502) |
| 0.7 | 6.5 | GO:0061370 | testosterone biosynthetic process(GO:0061370) |
| 0.7 | 2.8 | GO:0072180 | mesonephric duct morphogenesis(GO:0072180) |
| 0.7 | 3.5 | GO:0046013 | regulation of T cell homeostatic proliferation(GO:0046013) |
| 0.7 | 2.7 | GO:0072092 | ureteric bud invasion(GO:0072092) |
| 0.7 | 12.9 | GO:0060347 | heart trabecula formation(GO:0060347) |
| 0.7 | 1.3 | GO:0016098 | monoterpenoid metabolic process(GO:0016098) |
| 0.6 | 5.8 | GO:0035356 | cellular triglyceride homeostasis(GO:0035356) |
| 0.6 | 2.5 | GO:0031161 | phosphatidylinositol catabolic process(GO:0031161) |
| 0.6 | 1.2 | GO:0030240 | skeletal muscle thin filament assembly(GO:0030240) |
| 0.6 | 2.3 | GO:0006556 | S-adenosylmethionine biosynthetic process(GO:0006556) |
| 0.6 | 12.0 | GO:0042759 | long-chain fatty acid biosynthetic process(GO:0042759) |
| 0.6 | 2.8 | GO:0071109 | superior temporal gyrus development(GO:0071109) |
| 0.6 | 1.1 | GO:0046110 | xanthine metabolic process(GO:0046110) |
| 0.5 | 7.1 | GO:0043589 | skin morphogenesis(GO:0043589) |
| 0.5 | 1.6 | GO:0031585 | regulation of inositol 1,4,5-trisphosphate-sensitive calcium-release channel activity(GO:0031585) positive regulation of inositol 1,4,5-trisphosphate-sensitive calcium-release channel activity(GO:0031587) |
| 0.5 | 2.1 | GO:0021615 | glossopharyngeal nerve morphogenesis(GO:0021615) |
| 0.5 | 2.1 | GO:0046440 | L-lysine catabolic process to acetyl-CoA(GO:0019474) L-lysine catabolic process(GO:0019477) L-lysine metabolic process(GO:0046440) |
| 0.5 | 1.5 | GO:0043605 | cellular amide catabolic process(GO:0043605) |
| 0.5 | 2.0 | GO:0002933 | lipid hydroxylation(GO:0002933) |
| 0.5 | 3.5 | GO:0043587 | tongue morphogenesis(GO:0043587) |
| 0.5 | 4.5 | GO:0030578 | PML body organization(GO:0030578) |
| 0.5 | 3.0 | GO:0018343 | protein farnesylation(GO:0018343) |
| 0.5 | 8.8 | GO:0051823 | regulation of synapse structural plasticity(GO:0051823) |
| 0.5 | 1.9 | GO:0048686 | regulation of sprouting of injured axon(GO:0048686) regulation of axon extension involved in regeneration(GO:0048690) |
| 0.5 | 3.7 | GO:2000467 | positive regulation of glycogen (starch) synthase activity(GO:2000467) |
| 0.5 | 1.8 | GO:0060535 | trachea cartilage morphogenesis(GO:0060535) |
| 0.4 | 1.7 | GO:0000023 | maltose metabolic process(GO:0000023) |
| 0.4 | 1.3 | GO:0001544 | initiation of primordial ovarian follicle growth(GO:0001544) |
| 0.4 | 3.8 | GO:0099566 | regulation of postsynaptic cytosolic calcium ion concentration(GO:0099566) |
| 0.4 | 1.7 | GO:0021684 | cerebellar granular layer formation(GO:0021684) cerebellar granule cell differentiation(GO:0021707) |
| 0.4 | 2.9 | GO:0015705 | iodide transport(GO:0015705) |
| 0.4 | 11.2 | GO:0001502 | cartilage condensation(GO:0001502) |
| 0.4 | 1.6 | GO:2000393 | negative regulation of lamellipodium morphogenesis(GO:2000393) |
| 0.4 | 1.6 | GO:0033058 | directional locomotion(GO:0033058) |
| 0.4 | 6.6 | GO:0010457 | centriole-centriole cohesion(GO:0010457) |
| 0.4 | 3.7 | GO:0034058 | endosomal vesicle fusion(GO:0034058) |
| 0.4 | 1.5 | GO:0036159 | inner dynein arm assembly(GO:0036159) |
| 0.4 | 1.4 | GO:0002541 | activation of plasma proteins involved in acute inflammatory response(GO:0002541) positive regulation of fibrinolysis(GO:0051919) |
| 0.4 | 5.0 | GO:0036158 | outer dynein arm assembly(GO:0036158) |
| 0.4 | 1.4 | GO:0086097 | phospholipase C-activating angiotensin-activated signaling pathway(GO:0086097) |
| 0.4 | 1.1 | GO:0046416 | D-amino acid metabolic process(GO:0046416) |
| 0.3 | 6.6 | GO:0055003 | cardiac myofibril assembly(GO:0055003) |
| 0.3 | 6.8 | GO:0006957 | complement activation, alternative pathway(GO:0006957) |
| 0.3 | 2.0 | GO:0071798 | response to prostaglandin D(GO:0071798) cellular response to prostaglandin D stimulus(GO:0071799) |
| 0.3 | 4.3 | GO:0042738 | exogenous drug catabolic process(GO:0042738) |
| 0.3 | 3.6 | GO:0032914 | positive regulation of transforming growth factor beta1 production(GO:0032914) |
| 0.3 | 4.5 | GO:0021670 | lateral ventricle development(GO:0021670) |
| 0.3 | 3.7 | GO:1904469 | positive regulation of tumor necrosis factor secretion(GO:1904469) |
| 0.3 | 2.1 | GO:0051791 | medium-chain fatty acid metabolic process(GO:0051791) |
| 0.3 | 0.6 | GO:0002581 | negative regulation of antigen processing and presentation of peptide or polysaccharide antigen via MHC class II(GO:0002581) |
| 0.3 | 1.2 | GO:0072660 | maintenance of protein location in membrane(GO:0072658) maintenance of protein location in plasma membrane(GO:0072660) positive regulation of membrane depolarization during cardiac muscle cell action potential(GO:1900827) |
| 0.3 | 3.6 | GO:0097688 | AMPA glutamate receptor clustering(GO:0097113) glutamate receptor clustering(GO:0097688) |
| 0.3 | 0.9 | GO:0071934 | thiamine transport(GO:0015888) thiamine transmembrane transport(GO:0071934) |
| 0.3 | 13.5 | GO:0021952 | central nervous system projection neuron axonogenesis(GO:0021952) |
| 0.3 | 0.9 | GO:0061056 | sclerotome development(GO:0061056) |
| 0.3 | 1.4 | GO:0010572 | positive regulation of platelet activation(GO:0010572) |
| 0.3 | 1.6 | GO:0006001 | fructose catabolic process(GO:0006001) fructose catabolic process to hydroxyacetone phosphate and glyceraldehyde-3-phosphate(GO:0061624) |
| 0.3 | 1.0 | GO:0002727 | natural killer cell cytokine production(GO:0002370) regulation of natural killer cell cytokine production(GO:0002727) |
| 0.3 | 2.8 | GO:0046951 | ketone body biosynthetic process(GO:0046951) |
| 0.3 | 1.0 | GO:0035610 | protein side chain deglutamylation(GO:0035610) |
| 0.3 | 1.8 | GO:0018342 | protein prenylation(GO:0018342) protein geranylgeranylation(GO:0018344) prenylation(GO:0097354) |
| 0.3 | 5.6 | GO:0090527 | actin filament reorganization(GO:0090527) |
| 0.2 | 1.5 | GO:0033029 | regulation of neutrophil apoptotic process(GO:0033029) |
| 0.2 | 1.7 | GO:0010908 | regulation of heparan sulfate proteoglycan biosynthetic process(GO:0010908) positive regulation of heparan sulfate proteoglycan biosynthetic process(GO:0010909) canonical Wnt signaling pathway involved in positive regulation of epithelial to mesenchymal transition(GO:0044334) positive regulation of proteoglycan biosynthetic process(GO:1902730) |
| 0.2 | 2.9 | GO:2000389 | regulation of neutrophil extravasation(GO:2000389) |
| 0.2 | 2.3 | GO:0061436 | regulation of water loss via skin(GO:0033561) establishment of skin barrier(GO:0061436) |
| 0.2 | 0.7 | GO:0002361 | CD4-positive, CD25-positive, alpha-beta regulatory T cell differentiation(GO:0002361) |
| 0.2 | 11.6 | GO:0032728 | positive regulation of interferon-beta production(GO:0032728) |
| 0.2 | 3.9 | GO:0070493 | thrombin receptor signaling pathway(GO:0070493) |
| 0.2 | 4.8 | GO:0033169 | histone H3-K9 demethylation(GO:0033169) |
| 0.2 | 12.9 | GO:0043268 | positive regulation of potassium ion transport(GO:0043268) |
| 0.2 | 0.7 | GO:2000320 | negative regulation of T-helper 17 type immune response(GO:2000317) negative regulation of T-helper 17 cell differentiation(GO:2000320) |
| 0.2 | 2.0 | GO:0002175 | protein localization to paranode region of axon(GO:0002175) |
| 0.2 | 1.8 | GO:1902474 | positive regulation of protein localization to synapse(GO:1902474) |
| 0.2 | 2.8 | GO:0006703 | estrogen biosynthetic process(GO:0006703) |
| 0.2 | 5.4 | GO:0071420 | cellular response to histamine(GO:0071420) |
| 0.2 | 5.0 | GO:0044126 | regulation of growth of symbiont in host(GO:0044126) |
| 0.2 | 2.9 | GO:2000052 | positive regulation of non-canonical Wnt signaling pathway(GO:2000052) |
| 0.2 | 1.0 | GO:0009624 | response to nematode(GO:0009624) |
| 0.2 | 1.9 | GO:0010756 | positive regulation of plasminogen activation(GO:0010756) |
| 0.2 | 7.2 | GO:0097120 | receptor localization to synapse(GO:0097120) |
| 0.2 | 1.7 | GO:0006857 | oligopeptide transport(GO:0006857) |
| 0.2 | 1.3 | GO:0038172 | negative regulation of T-helper 1 type immune response(GO:0002826) interleukin-33-mediated signaling pathway(GO:0038172) |
| 0.2 | 1.1 | GO:1902172 | keratinocyte apoptotic process(GO:0097283) regulation of keratinocyte apoptotic process(GO:1902172) |
| 0.2 | 1.1 | GO:0032483 | regulation of Rab protein signal transduction(GO:0032483) |
| 0.2 | 0.7 | GO:0044336 | canonical Wnt signaling pathway involved in negative regulation of apoptotic process(GO:0044336) |
| 0.2 | 0.5 | GO:0070681 | glutaminyl-tRNAGln biosynthesis via transamidation(GO:0070681) |
| 0.2 | 0.5 | GO:0098937 | dendritic transport(GO:0098935) anterograde dendritic transport(GO:0098937) |
| 0.2 | 1.6 | GO:0080182 | histone H3-K4 trimethylation(GO:0080182) |
| 0.2 | 1.2 | GO:1902514 | regulation of calcium ion transmembrane transport via high voltage-gated calcium channel(GO:1902514) positive regulation of calcium ion transmembrane transport via high voltage-gated calcium channel(GO:1904879) |
| 0.2 | 0.9 | GO:0061146 | Peyer's patch morphogenesis(GO:0061146) lymphocyte migration into lymphoid organs(GO:0097021) |
| 0.2 | 2.6 | GO:0003334 | keratinocyte development(GO:0003334) |
| 0.2 | 1.0 | GO:0061737 | leukotriene signaling pathway(GO:0061737) |
| 0.2 | 1.8 | GO:0021979 | hypothalamus cell differentiation(GO:0021979) |
| 0.2 | 2.0 | GO:1901898 | negative regulation of relaxation of cardiac muscle(GO:1901898) |
| 0.2 | 2.9 | GO:0032060 | bleb assembly(GO:0032060) |
| 0.2 | 2.2 | GO:0034372 | very-low-density lipoprotein particle remodeling(GO:0034372) |
| 0.2 | 0.5 | GO:0072023 | ascending thin limb development(GO:0072021) thick ascending limb development(GO:0072023) metanephric ascending thin limb development(GO:0072218) metanephric thick ascending limb development(GO:0072233) metanephric loop of Henle development(GO:0072236) |
| 0.2 | 6.6 | GO:0048791 | calcium ion-regulated exocytosis of neurotransmitter(GO:0048791) |
| 0.2 | 0.8 | GO:0045959 | regulation of complement activation, classical pathway(GO:0030450) negative regulation of complement activation, classical pathway(GO:0045959) |
| 0.2 | 2.7 | GO:0060732 | positive regulation of inositol phosphate biosynthetic process(GO:0060732) |
| 0.2 | 4.2 | GO:0042572 | retinol metabolic process(GO:0042572) |
| 0.1 | 0.9 | GO:1904781 | positive regulation of protein localization to centrosome(GO:1904781) |
| 0.1 | 1.3 | GO:0060754 | positive regulation of mast cell chemotaxis(GO:0060754) |
| 0.1 | 0.4 | GO:1904845 | response to L-glutamine(GO:1904844) cellular response to L-glutamine(GO:1904845) |
| 0.1 | 0.3 | GO:0097325 | melanocyte proliferation(GO:0097325) |
| 0.1 | 1.7 | GO:0048681 | negative regulation of axon regeneration(GO:0048681) |
| 0.1 | 1.7 | GO:0014894 | response to muscle inactivity involved in regulation of muscle adaptation(GO:0014877) response to denervation involved in regulation of muscle adaptation(GO:0014894) |
| 0.1 | 1.5 | GO:0097107 | postsynaptic density organization(GO:0097106) postsynaptic density assembly(GO:0097107) gephyrin clustering involved in postsynaptic density assembly(GO:0097116) excitatory synapse assembly(GO:1904861) |
| 0.1 | 1.3 | GO:0014051 | gamma-aminobutyric acid secretion(GO:0014051) |
| 0.1 | 1.5 | GO:0030321 | transepithelial chloride transport(GO:0030321) |
| 0.1 | 1.2 | GO:0003360 | brainstem development(GO:0003360) |
| 0.1 | 10.0 | GO:0000381 | regulation of alternative mRNA splicing, via spliceosome(GO:0000381) |
| 0.1 | 4.8 | GO:0035774 | positive regulation of insulin secretion involved in cellular response to glucose stimulus(GO:0035774) |
| 0.1 | 1.7 | GO:0051531 | NFAT protein import into nucleus(GO:0051531) |
| 0.1 | 5.7 | GO:0007520 | myoblast fusion(GO:0007520) |
| 0.1 | 2.0 | GO:1904706 | negative regulation of vascular smooth muscle cell proliferation(GO:1904706) |
| 0.1 | 1.6 | GO:0035269 | protein O-linked mannosylation(GO:0035269) |
| 0.1 | 4.3 | GO:0071108 | protein K48-linked deubiquitination(GO:0071108) |
| 0.1 | 0.7 | GO:0019441 | tryptophan catabolic process to kynurenine(GO:0019441) |
| 0.1 | 0.9 | GO:1900748 | positive regulation of vascular endothelial growth factor signaling pathway(GO:1900748) |
| 0.1 | 0.5 | GO:0009804 | coumarin metabolic process(GO:0009804) |
| 0.1 | 0.6 | GO:0021785 | branchiomotor neuron axon guidance(GO:0021785) |
| 0.1 | 0.3 | GO:1904017 | cellular response to Thyroglobulin triiodothyronine(GO:1904017) |
| 0.1 | 1.3 | GO:0071313 | cellular response to caffeine(GO:0071313) |
| 0.1 | 1.4 | GO:0009642 | response to light intensity(GO:0009642) |
| 0.1 | 4.2 | GO:0010039 | response to iron ion(GO:0010039) |
| 0.1 | 0.7 | GO:0003344 | pericardium morphogenesis(GO:0003344) |
| 0.1 | 2.4 | GO:0016338 | calcium-independent cell-cell adhesion via plasma membrane cell-adhesion molecules(GO:0016338) |
| 0.1 | 4.5 | GO:0015701 | bicarbonate transport(GO:0015701) |
| 0.1 | 0.1 | GO:1902725 | negative regulation of satellite cell differentiation(GO:1902725) |
| 0.1 | 1.7 | GO:0060044 | negative regulation of JUN kinase activity(GO:0043508) negative regulation of cardiac muscle cell proliferation(GO:0060044) |
| 0.1 | 0.9 | GO:0009048 | dosage compensation(GO:0007549) dosage compensation by inactivation of X chromosome(GO:0009048) |
| 0.1 | 2.2 | GO:0070262 | peptidyl-serine dephosphorylation(GO:0070262) |
| 0.1 | 2.8 | GO:0097503 | sialylation(GO:0097503) |
| 0.1 | 10.2 | GO:0070268 | cornification(GO:0070268) |
| 0.1 | 0.5 | GO:0090080 | positive regulation of MAPKKK cascade by fibroblast growth factor receptor signaling pathway(GO:0090080) |
| 0.1 | 0.5 | GO:0072423 | response to cell cycle checkpoint signaling(GO:0072396) response to DNA integrity checkpoint signaling(GO:0072402) response to DNA damage checkpoint signaling(GO:0072423) |
| 0.1 | 6.9 | GO:0070125 | mitochondrial translational elongation(GO:0070125) |
| 0.1 | 3.1 | GO:0060325 | face morphogenesis(GO:0060325) |
| 0.1 | 5.7 | GO:0003407 | neural retina development(GO:0003407) |
| 0.1 | 2.3 | GO:0015012 | heparan sulfate proteoglycan biosynthetic process(GO:0015012) |
| 0.1 | 2.5 | GO:0045332 | lipid translocation(GO:0034204) phospholipid translocation(GO:0045332) |
| 0.1 | 3.9 | GO:0051931 | regulation of sensory perception of pain(GO:0051930) regulation of sensory perception(GO:0051931) |
| 0.1 | 5.4 | GO:0033275 | muscle filament sliding(GO:0030049) actin-myosin filament sliding(GO:0033275) |
| 0.1 | 0.7 | GO:0070995 | NADPH oxidation(GO:0070995) |
| 0.1 | 0.9 | GO:0007351 | blastoderm segmentation(GO:0007350) tripartite regional subdivision(GO:0007351) anterior/posterior axis specification, embryo(GO:0008595) |
| 0.1 | 1.0 | GO:1903025 | regulation of RNA polymerase II regulatory region sequence-specific DNA binding(GO:1903025) |
| 0.1 | 1.2 | GO:0006704 | glucocorticoid biosynthetic process(GO:0006704) |
| 0.1 | 0.7 | GO:0042090 | interleukin-12 biosynthetic process(GO:0042090) regulation of interleukin-12 biosynthetic process(GO:0045075) |
| 0.1 | 1.0 | GO:2001214 | regulation of vasculogenesis(GO:2001212) positive regulation of vasculogenesis(GO:2001214) |
| 0.1 | 0.4 | GO:0061502 | early endosome to recycling endosome transport(GO:0061502) |
| 0.1 | 0.1 | GO:0030210 | heparin metabolic process(GO:0030202) heparin biosynthetic process(GO:0030210) |
| 0.1 | 1.8 | GO:2000369 | regulation of clathrin-mediated endocytosis(GO:2000369) |
| 0.1 | 2.6 | GO:0043552 | positive regulation of phosphatidylinositol 3-kinase activity(GO:0043552) |
| 0.1 | 1.7 | GO:0019433 | triglyceride catabolic process(GO:0019433) |
| 0.1 | 0.3 | GO:0044245 | polysaccharide digestion(GO:0044245) |
| 0.1 | 3.0 | GO:0009409 | response to cold(GO:0009409) |
| 0.1 | 2.8 | GO:0010165 | response to X-ray(GO:0010165) |
| 0.1 | 2.2 | GO:0006509 | membrane protein ectodomain proteolysis(GO:0006509) |
| 0.1 | 1.3 | GO:0060009 | Sertoli cell development(GO:0060009) |
| 0.1 | 0.5 | GO:0032836 | glomerular basement membrane development(GO:0032836) |
| 0.1 | 0.2 | GO:0009298 | GDP-mannose biosynthetic process(GO:0009298) |
| 0.1 | 13.1 | GO:0060271 | cilium morphogenesis(GO:0060271) |
| 0.0 | 0.6 | GO:2000574 | regulation of microtubule motor activity(GO:2000574) |
| 0.0 | 0.6 | GO:0006449 | regulation of translational termination(GO:0006449) |
| 0.0 | 1.7 | GO:0009251 | polysaccharide catabolic process(GO:0000272) glycogen catabolic process(GO:0005980) glucan catabolic process(GO:0009251) cellular polysaccharide catabolic process(GO:0044247) |
| 0.0 | 0.9 | GO:0016254 | preassembly of GPI anchor in ER membrane(GO:0016254) |
| 0.0 | 4.1 | GO:0006749 | glutathione metabolic process(GO:0006749) |
| 0.0 | 1.2 | GO:0032012 | regulation of ARF protein signal transduction(GO:0032012) |
| 0.0 | 0.3 | GO:0003402 | planar cell polarity pathway involved in axis elongation(GO:0003402) |
| 0.0 | 2.2 | GO:0045652 | regulation of megakaryocyte differentiation(GO:0045652) |
| 0.0 | 1.6 | GO:0033173 | calcineurin-NFAT signaling cascade(GO:0033173) |
| 0.0 | 1.5 | GO:0010107 | potassium ion import(GO:0010107) |
| 0.0 | 0.3 | GO:0015939 | pantothenate metabolic process(GO:0015939) |
| 0.0 | 0.3 | GO:0060012 | synaptic transmission, glycinergic(GO:0060012) |
| 0.0 | 0.4 | GO:0015825 | L-serine transport(GO:0015825) |
| 0.0 | 3.7 | GO:0007286 | spermatid development(GO:0007286) |
| 0.0 | 2.8 | GO:0032418 | lysosome localization(GO:0032418) |
| 0.0 | 0.1 | GO:0006106 | fumarate metabolic process(GO:0006106) glycerol biosynthetic process(GO:0006114) aspartate catabolic process(GO:0006533) |
| 0.0 | 0.6 | GO:0051281 | positive regulation of release of sequestered calcium ion into cytosol(GO:0051281) |
| 0.0 | 1.9 | GO:0030888 | regulation of B cell proliferation(GO:0030888) |
| 0.0 | 3.4 | GO:0030449 | regulation of complement activation(GO:0030449) |
| 0.0 | 1.9 | GO:0006501 | C-terminal protein lipidation(GO:0006501) |
| 0.0 | 1.6 | GO:0048384 | retinoic acid receptor signaling pathway(GO:0048384) |
| 0.0 | 1.3 | GO:0070830 | bicellular tight junction assembly(GO:0070830) |
| 0.0 | 0.3 | GO:0055091 | phospholipid homeostasis(GO:0055091) |
| 0.0 | 1.9 | GO:0090630 | activation of GTPase activity(GO:0090630) |
| 0.0 | 1.2 | GO:0016266 | O-glycan processing(GO:0016266) |
| 0.0 | 3.2 | GO:0010977 | negative regulation of neuron projection development(GO:0010977) |
| 0.0 | 0.5 | GO:2000811 | negative regulation of anoikis(GO:2000811) |
| 0.0 | 1.5 | GO:0038083 | peptidyl-tyrosine autophosphorylation(GO:0038083) |
| 0.0 | 0.3 | GO:0015937 | coenzyme A biosynthetic process(GO:0015937) |
| 0.0 | 2.6 | GO:0007519 | skeletal muscle tissue development(GO:0007519) skeletal muscle organ development(GO:0060538) |
| 0.0 | 0.7 | GO:0019228 | neuronal action potential(GO:0019228) |
| 0.0 | 0.7 | GO:0006654 | phosphatidic acid biosynthetic process(GO:0006654) |
| 0.0 | 1.0 | GO:0050829 | defense response to Gram-negative bacterium(GO:0050829) |
| 0.0 | 1.6 | GO:0000422 | mitophagy(GO:0000422) mitochondrion disassembly(GO:0061726) |
| 0.0 | 0.6 | GO:0007140 | male meiosis(GO:0007140) |
| 0.0 | 0.2 | GO:0032331 | negative regulation of chondrocyte differentiation(GO:0032331) |
| 0.0 | 0.6 | GO:0007274 | neuromuscular synaptic transmission(GO:0007274) |
| 0.0 | 0.4 | GO:0031113 | regulation of microtubule polymerization(GO:0031113) |
| 0.0 | 0.7 | GO:0010923 | negative regulation of phosphatase activity(GO:0010923) |
| 0.0 | 0.8 | GO:0006027 | glycosaminoglycan catabolic process(GO:0006027) |
| 0.0 | 0.4 | GO:0000027 | ribosomal large subunit assembly(GO:0000027) |
Gene overrepresentation in cellular component category:
| Log-likelihood per target | Total log-likelihood | Term | Description |
|---|---|---|---|
| 3.6 | 18.0 | GO:0005826 | actomyosin contractile ring(GO:0005826) |
| 1.5 | 11.7 | GO:0035976 | AP1 complex(GO:0035976) |
| 1.4 | 20.4 | GO:0005833 | hemoglobin complex(GO:0005833) |
| 1.3 | 6.7 | GO:0001652 | granular component(GO:0001652) |
| 1.3 | 17.2 | GO:0005583 | fibrillar collagen trimer(GO:0005583) banded collagen fibril(GO:0098643) |
| 1.1 | 4.4 | GO:0005602 | complement component C1 complex(GO:0005602) |
| 1.0 | 11.1 | GO:0005955 | calcineurin complex(GO:0005955) |
| 1.0 | 16.9 | GO:0033010 | paranodal junction(GO:0033010) |
| 0.9 | 6.8 | GO:0005579 | membrane attack complex(GO:0005579) |
| 0.8 | 3.8 | GO:0044308 | axonal spine(GO:0044308) |
| 0.7 | 2.2 | GO:0070931 | Golgi-associated vesicle lumen(GO:0070931) |
| 0.7 | 5.0 | GO:0036157 | outer dynein arm(GO:0036157) |
| 0.5 | 6.4 | GO:0097539 | ciliary transition fiber(GO:0097539) |
| 0.5 | 13.3 | GO:0044295 | axonal growth cone(GO:0044295) |
| 0.5 | 3.7 | GO:0044354 | pinosome(GO:0044352) macropinosome(GO:0044354) |
| 0.4 | 1.8 | GO:0005968 | Rab-protein geranylgeranyltransferase complex(GO:0005968) |
| 0.4 | 5.1 | GO:0043240 | Fanconi anaemia nuclear complex(GO:0043240) |
| 0.4 | 3.0 | GO:0097512 | cardiac myofibril(GO:0097512) |
| 0.4 | 1.7 | GO:1990578 | perinuclear endoplasmic reticulum membrane(GO:1990578) |
| 0.4 | 3.1 | GO:0016012 | sarcoglycan complex(GO:0016012) |
| 0.4 | 5.8 | GO:0032982 | myosin filament(GO:0032982) |
| 0.4 | 1.9 | GO:0072534 | perineuronal net(GO:0072534) |
| 0.4 | 21.1 | GO:0031430 | M band(GO:0031430) |
| 0.4 | 12.8 | GO:0044224 | juxtaparanode region of axon(GO:0044224) |
| 0.4 | 2.5 | GO:0044326 | dendritic spine neck(GO:0044326) |
| 0.3 | 1.2 | GO:0097059 | CNTFR-CLCF1 complex(GO:0097059) |
| 0.3 | 4.3 | GO:0043083 | synaptic cleft(GO:0043083) |
| 0.3 | 1.7 | GO:0014802 | terminal cisterna(GO:0014802) |
| 0.3 | 10.4 | GO:0034451 | centriolar satellite(GO:0034451) |
| 0.2 | 4.8 | GO:1990454 | L-type voltage-gated calcium channel complex(GO:1990454) |
| 0.2 | 0.7 | GO:0033011 | perinuclear theca(GO:0033011) cytoskeletal calyx(GO:0033150) |
| 0.2 | 8.7 | GO:0046658 | anchored component of plasma membrane(GO:0046658) |
| 0.2 | 3.7 | GO:0042613 | MHC class II protein complex(GO:0042613) |
| 0.2 | 0.9 | GO:0045160 | myosin I complex(GO:0045160) |
| 0.2 | 0.5 | GO:0030956 | glutamyl-tRNA(Gln) amidotransferase complex(GO:0030956) |
| 0.2 | 6.9 | GO:0005762 | organellar large ribosomal subunit(GO:0000315) mitochondrial large ribosomal subunit(GO:0005762) |
| 0.2 | 1.7 | GO:0005964 | phosphorylase kinase complex(GO:0005964) |
| 0.2 | 4.1 | GO:0097440 | apical dendrite(GO:0097440) |
| 0.2 | 3.7 | GO:0043218 | compact myelin(GO:0043218) |
| 0.2 | 1.0 | GO:0034751 | aryl hydrocarbon receptor complex(GO:0034751) |
| 0.2 | 3.8 | GO:0005581 | collagen trimer(GO:0005581) |
| 0.2 | 1.6 | GO:0017146 | NMDA selective glutamate receptor complex(GO:0017146) |
| 0.2 | 2.6 | GO:0005859 | muscle myosin complex(GO:0005859) |
| 0.2 | 0.5 | GO:0043293 | apoptosome(GO:0043293) |
| 0.2 | 2.1 | GO:0005862 | muscle thin filament tropomyosin(GO:0005862) |
| 0.2 | 7.8 | GO:0033017 | sarcoplasmic reticulum membrane(GO:0033017) |
| 0.2 | 5.9 | GO:0032590 | dendrite membrane(GO:0032590) |
| 0.2 | 2.1 | GO:0032045 | guanyl-nucleotide exchange factor complex(GO:0032045) |
| 0.1 | 12.3 | GO:0045334 | clathrin-coated endocytic vesicle(GO:0045334) |
| 0.1 | 1.7 | GO:0070369 | beta-catenin-TCF7L2 complex(GO:0070369) |
| 0.1 | 5.8 | GO:0045095 | keratin filament(GO:0045095) |
| 0.1 | 1.7 | GO:0005577 | fibrinogen complex(GO:0005577) |
| 0.1 | 12.8 | GO:0035580 | specific granule lumen(GO:0035580) |
| 0.1 | 1.6 | GO:0097427 | microtubule bundle(GO:0097427) |
| 0.1 | 1.0 | GO:0031466 | Cul5-RING ubiquitin ligase complex(GO:0031466) |
| 0.1 | 2.3 | GO:0016529 | sarcoplasmic reticulum(GO:0016529) |
| 0.1 | 1.5 | GO:0016342 | catenin complex(GO:0016342) |
| 0.1 | 2.7 | GO:0005719 | nuclear euchromatin(GO:0005719) |
| 0.1 | 2.5 | GO:0002080 | acrosomal membrane(GO:0002080) |
| 0.1 | 8.4 | GO:0030672 | synaptic vesicle membrane(GO:0030672) exocytic vesicle membrane(GO:0099501) |
| 0.1 | 10.6 | GO:0035578 | azurophil granule lumen(GO:0035578) |
| 0.1 | 2.0 | GO:0000930 | gamma-tubulin complex(GO:0000930) |
| 0.1 | 0.6 | GO:0044614 | nuclear pore cytoplasmic filaments(GO:0044614) |
| 0.1 | 0.9 | GO:0044300 | cerebellar mossy fiber(GO:0044300) |
| 0.1 | 33.9 | GO:0005578 | proteinaceous extracellular matrix(GO:0005578) |
| 0.1 | 1.1 | GO:0031088 | platelet dense granule membrane(GO:0031088) |
| 0.1 | 8.2 | GO:0005814 | centriole(GO:0005814) |
| 0.1 | 5.6 | GO:0031093 | platelet alpha granule lumen(GO:0031093) |
| 0.1 | 2.0 | GO:0009925 | basal plasma membrane(GO:0009925) |
| 0.1 | 1.6 | GO:0090665 | dystrophin-associated glycoprotein complex(GO:0016010) glycoprotein complex(GO:0090665) |
| 0.1 | 0.6 | GO:0035686 | sperm fibrous sheath(GO:0035686) |
| 0.1 | 3.2 | GO:0005782 | peroxisomal matrix(GO:0005782) microbody lumen(GO:0031907) |
| 0.1 | 2.2 | GO:0034364 | high-density lipoprotein particle(GO:0034364) |
| 0.1 | 2.2 | GO:0000159 | protein phosphatase type 2A complex(GO:0000159) |
| 0.1 | 5.9 | GO:0034705 | voltage-gated potassium channel complex(GO:0008076) potassium channel complex(GO:0034705) |
| 0.1 | 1.7 | GO:0098878 | ionotropic glutamate receptor complex(GO:0008328) neurotransmitter receptor complex(GO:0098878) |
| 0.1 | 0.6 | GO:0002116 | semaphorin receptor complex(GO:0002116) |
| 0.0 | 0.7 | GO:0043194 | axon initial segment(GO:0043194) |
| 0.0 | 1.6 | GO:0030173 | integral component of Golgi membrane(GO:0030173) |
| 0.0 | 3.5 | GO:0032580 | Golgi cisterna membrane(GO:0032580) |
| 0.0 | 1.9 | GO:0001533 | cornified envelope(GO:0001533) |
| 0.0 | 2.3 | GO:0005801 | cis-Golgi network(GO:0005801) |
| 0.0 | 0.1 | GO:0070939 | Dsl1p complex(GO:0070939) |
| 0.0 | 2.3 | GO:0001669 | acrosomal vesicle(GO:0001669) |
| 0.0 | 0.5 | GO:0032839 | dendrite cytoplasm(GO:0032839) |
| 0.0 | 0.6 | GO:0016327 | apicolateral plasma membrane(GO:0016327) |
| 0.0 | 1.2 | GO:0042629 | mast cell granule(GO:0042629) |
| 0.0 | 2.4 | GO:0031519 | PcG protein complex(GO:0031519) |
| 0.0 | 2.4 | GO:0005882 | intermediate filament(GO:0005882) |
| 0.0 | 3.5 | GO:0031225 | anchored component of membrane(GO:0031225) |
| 0.0 | 5.2 | GO:0005802 | trans-Golgi network(GO:0005802) |
| 0.0 | 0.3 | GO:0071438 | invadopodium membrane(GO:0071438) |
| 0.0 | 1.6 | GO:0035097 | histone methyltransferase complex(GO:0035097) |
| 0.0 | 0.3 | GO:0043020 | NADPH oxidase complex(GO:0043020) |
| 0.0 | 1.0 | GO:0001917 | photoreceptor inner segment(GO:0001917) |
| 0.0 | 1.9 | GO:0034707 | chloride channel complex(GO:0034707) |
| 0.0 | 0.3 | GO:0036057 | filtration diaphragm(GO:0036056) slit diaphragm(GO:0036057) |
| 0.0 | 6.4 | GO:0098857 | membrane raft(GO:0045121) membrane microdomain(GO:0098857) |
| 0.0 | 2.0 | GO:0030018 | Z disc(GO:0030018) |
| 0.0 | 0.1 | GO:0061689 | tricellular tight junction(GO:0061689) |
| 0.0 | 2.5 | GO:0031227 | intrinsic component of endoplasmic reticulum membrane(GO:0031227) |
| 0.0 | 1.3 | GO:0042734 | presynaptic membrane(GO:0042734) |
| 0.0 | 3.7 | GO:0009897 | external side of plasma membrane(GO:0009897) |
| 0.0 | 12.7 | GO:0005789 | endoplasmic reticulum membrane(GO:0005789) |
| 0.0 | 2.0 | GO:0031234 | extrinsic component of cytoplasmic side of plasma membrane(GO:0031234) |
| 0.0 | 0.6 | GO:0005669 | transcription factor TFIID complex(GO:0005669) |
| 0.0 | 0.1 | GO:0042589 | zymogen granule membrane(GO:0042589) |
| 0.0 | 0.6 | GO:0032153 | cell division site(GO:0032153) cell division site part(GO:0032155) |
| 0.0 | 18.4 | GO:0031226 | intrinsic component of plasma membrane(GO:0031226) |
| 0.0 | 0.5 | GO:0036126 | sperm flagellum(GO:0036126) |
| 0.0 | 0.8 | GO:0044215 | other organism(GO:0044215) other organism cell(GO:0044216) other organism part(GO:0044217) |
Gene overrepresentation in molecular function category:
| Log-likelihood per target | Total log-likelihood | Term | Description |
|---|---|---|---|
| 2.5 | 4.9 | GO:0000822 | inositol hexakisphosphate binding(GO:0000822) |
| 2.2 | 17.6 | GO:0015235 | cobalamin transporter activity(GO:0015235) |
| 2.0 | 6.1 | GO:0047006 | 17-alpha,20-alpha-dihydroxypregn-4-en-3-one dehydrogenase activity(GO:0047006) |
| 1.7 | 5.0 | GO:0030305 | heparanase activity(GO:0030305) |
| 1.4 | 4.2 | GO:0004421 | hydroxymethylglutaryl-CoA synthase activity(GO:0004421) |
| 1.4 | 11.1 | GO:0005220 | inositol 1,4,5-trisphosphate-sensitive calcium-release channel activity(GO:0005220) |
| 1.2 | 1.2 | GO:0047023 | androsterone dehydrogenase activity(GO:0047023) |
| 1.1 | 5.6 | GO:0008889 | glycerophosphodiester phosphodiesterase activity(GO:0008889) |
| 1.1 | 16.6 | GO:0005344 | oxygen transporter activity(GO:0005344) |
| 1.0 | 13.6 | GO:0048407 | platelet-derived growth factor binding(GO:0048407) |
| 1.0 | 12.0 | GO:0019911 | structural constituent of myelin sheath(GO:0019911) |
| 1.0 | 3.8 | GO:0030492 | hemoglobin binding(GO:0030492) |
| 0.9 | 2.8 | GO:0060422 | peptidyl-dipeptidase inhibitor activity(GO:0060422) |
| 0.9 | 6.5 | GO:0047045 | testosterone 17-beta-dehydrogenase (NADP+) activity(GO:0047045) |
| 0.9 | 2.6 | GO:0008321 | Ral guanyl-nucleotide exchange factor activity(GO:0008321) |
| 0.9 | 3.5 | GO:0019976 | interleukin-2 receptor activity(GO:0004911) interleukin-2 binding(GO:0019976) |
| 0.8 | 5.0 | GO:0008142 | oxysterol binding(GO:0008142) |
| 0.8 | 5.4 | GO:0004797 | deoxycytidine kinase activity(GO:0004137) thymidine kinase activity(GO:0004797) |
| 0.8 | 3.8 | GO:0001595 | angiotensin receptor activity(GO:0001595) angiotensin type II receptor activity(GO:0004945) |
| 0.7 | 2.2 | GO:0032093 | SAM domain binding(GO:0032093) |
| 0.7 | 4.3 | GO:0070004 | cysteine-type carboxypeptidase activity(GO:0016807) cysteine-type exopeptidase activity(GO:0070004) |
| 0.7 | 10.6 | GO:0070324 | thyroid hormone binding(GO:0070324) |
| 0.7 | 2.8 | GO:0047288 | monosialoganglioside sialyltransferase activity(GO:0047288) |
| 0.7 | 9.5 | GO:0015501 | glutamate:sodium symporter activity(GO:0015501) |
| 0.7 | 3.9 | GO:0015057 | thrombin receptor activity(GO:0015057) |
| 0.6 | 7.1 | GO:0036310 | annealing helicase activity(GO:0036310) |
| 0.6 | 14.1 | GO:0015271 | outward rectifier potassium channel activity(GO:0015271) |
| 0.6 | 6.6 | GO:0042301 | phosphate ion binding(GO:0042301) inositol 1,4,5 trisphosphate binding(GO:0070679) |
| 0.6 | 2.3 | GO:0015018 | galactosylgalactosylxylosylprotein 3-beta-glucuronosyltransferase activity(GO:0015018) |
| 0.6 | 2.2 | GO:0008798 | beta-aspartyl-peptidase activity(GO:0008798) |
| 0.5 | 1.6 | GO:0061609 | fructose-1-phosphate aldolase activity(GO:0061609) |
| 0.5 | 1.6 | GO:0003845 | 11-beta-hydroxysteroid dehydrogenase [NAD(P)] activity(GO:0003845) |
| 0.5 | 21.3 | GO:0000146 | microfilament motor activity(GO:0000146) |
| 0.5 | 2.0 | GO:1902122 | chenodeoxycholic acid binding(GO:1902122) |
| 0.5 | 2.9 | GO:0047696 | beta-adrenergic receptor kinase activity(GO:0047696) |
| 0.5 | 3.8 | GO:0004971 | AMPA glutamate receptor activity(GO:0004971) |
| 0.5 | 4.6 | GO:0070492 | oligosaccharide binding(GO:0070492) |
| 0.4 | 1.3 | GO:0002113 | interleukin-33 binding(GO:0002113) |
| 0.4 | 3.6 | GO:0031811 | G-protein coupled nucleotide receptor binding(GO:0031811) P2Y1 nucleotide receptor binding(GO:0031812) |
| 0.4 | 1.7 | GO:0032450 | maltose alpha-glucosidase activity(GO:0032450) |
| 0.4 | 2.1 | GO:0047374 | sterol esterase activity(GO:0004771) methylumbelliferyl-acetate deacetylase activity(GO:0047374) |
| 0.4 | 2.1 | GO:0016647 | oxidoreductase activity, acting on the CH-NH group of donors, oxygen as acceptor(GO:0016647) |
| 0.4 | 3.2 | GO:0044323 | retinoic acid-responsive element binding(GO:0044323) |
| 0.4 | 22.0 | GO:0030507 | spectrin binding(GO:0030507) |
| 0.4 | 10.0 | GO:0016712 | oxidoreductase activity, acting on paired donors, with incorporation or reduction of molecular oxygen, reduced flavin or flavoprotein as one donor, and incorporation of one atom of oxygen(GO:0016712) |
| 0.4 | 5.0 | GO:0045504 | dynein heavy chain binding(GO:0045504) |
| 0.4 | 1.8 | GO:0004663 | Rab geranylgeranyltransferase activity(GO:0004663) |
| 0.3 | 1.7 | GO:0015198 | oligopeptide transporter activity(GO:0015198) |
| 0.3 | 2.4 | GO:0001225 | RNA polymerase II transcription coactivator binding(GO:0001225) |
| 0.3 | 5.4 | GO:0008503 | benzodiazepine receptor activity(GO:0008503) |
| 0.3 | 2.5 | GO:0052833 | inositol monophosphate 1-phosphatase activity(GO:0008934) inositol monophosphate 3-phosphatase activity(GO:0052832) inositol monophosphate 4-phosphatase activity(GO:0052833) inositol monophosphate phosphatase activity(GO:0052834) |
| 0.3 | 1.0 | GO:0004874 | aryl hydrocarbon receptor activity(GO:0004874) |
| 0.3 | 0.9 | GO:0004958 | prostaglandin F receptor activity(GO:0004958) |
| 0.3 | 0.9 | GO:0015234 | thiamine transmembrane transporter activity(GO:0015234) thiamine uptake transmembrane transporter activity(GO:0015403) |
| 0.3 | 1.4 | GO:0008422 | beta-glucosidase activity(GO:0008422) |
| 0.3 | 1.9 | GO:0004457 | lactate dehydrogenase activity(GO:0004457) L-lactate dehydrogenase activity(GO:0004459) |
| 0.3 | 3.8 | GO:0015643 | toxic substance binding(GO:0015643) |
| 0.3 | 1.6 | GO:0042285 | UDP-xylosyltransferase activity(GO:0035252) xylosyltransferase activity(GO:0042285) |
| 0.3 | 3.7 | GO:0032395 | MHC class II receptor activity(GO:0032395) |
| 0.3 | 1.3 | GO:0043183 | vascular endothelial growth factor receptor 1 binding(GO:0043183) |
| 0.3 | 1.0 | GO:0001632 | leukotriene B4 receptor activity(GO:0001632) |
| 0.3 | 4.8 | GO:0032454 | histone demethylase activity (H3-K9 specific)(GO:0032454) |
| 0.2 | 1.5 | GO:0008440 | inositol-1,4,5-trisphosphate 3-kinase activity(GO:0008440) |
| 0.2 | 4.1 | GO:0004745 | retinol dehydrogenase activity(GO:0004745) |
| 0.2 | 2.6 | GO:0005021 | vascular endothelial growth factor-activated receptor activity(GO:0005021) |
| 0.2 | 0.7 | GO:0004833 | tryptophan 2,3-dioxygenase activity(GO:0004833) |
| 0.2 | 0.7 | GO:0017153 | sodium:dicarboxylate symporter activity(GO:0017153) |
| 0.2 | 0.9 | GO:0042015 | interleukin-20 binding(GO:0042015) |
| 0.2 | 1.1 | GO:0043546 | molybdopterin cofactor binding(GO:0043546) |
| 0.2 | 1.1 | GO:0048248 | CXCR3 chemokine receptor binding(GO:0048248) |
| 0.2 | 10.5 | GO:0004683 | calmodulin-dependent protein kinase activity(GO:0004683) |
| 0.2 | 1.5 | GO:0071553 | uridine nucleotide receptor activity(GO:0015065) G-protein coupled pyrimidinergic nucleotide receptor activity(GO:0071553) |
| 0.2 | 6.1 | GO:0004435 | phosphatidylinositol phospholipase C activity(GO:0004435) |
| 0.2 | 1.7 | GO:0046935 | 1-phosphatidylinositol-3-kinase regulator activity(GO:0046935) |
| 0.2 | 4.5 | GO:0048018 | receptor agonist activity(GO:0048018) |
| 0.2 | 5.9 | GO:0004181 | metallocarboxypeptidase activity(GO:0004181) |
| 0.2 | 1.6 | GO:0004972 | NMDA glutamate receptor activity(GO:0004972) |
| 0.2 | 4.6 | GO:0008239 | dipeptidyl-peptidase activity(GO:0008239) |
| 0.2 | 8.8 | GO:0043027 | cysteine-type endopeptidase inhibitor activity involved in apoptotic process(GO:0043027) |
| 0.2 | 1.6 | GO:0050682 | AF-2 domain binding(GO:0050682) |
| 0.2 | 4.8 | GO:0005523 | tropomyosin binding(GO:0005523) |
| 0.2 | 0.5 | GO:0050567 | amidase activity(GO:0004040) glutaminyl-tRNA synthase (glutamine-hydrolyzing) activity(GO:0050567) |
| 0.2 | 1.7 | GO:0004970 | ionotropic glutamate receptor activity(GO:0004970) |
| 0.2 | 1.9 | GO:0030280 | structural constituent of epidermis(GO:0030280) |
| 0.2 | 15.5 | GO:0005201 | extracellular matrix structural constituent(GO:0005201) |
| 0.2 | 1.8 | GO:0035612 | AP-2 adaptor complex binding(GO:0035612) |
| 0.2 | 4.8 | GO:0008331 | high voltage-gated calcium channel activity(GO:0008331) |
| 0.1 | 3.0 | GO:0008510 | sodium:bicarbonate symporter activity(GO:0008510) |
| 0.1 | 18.8 | GO:0004222 | metalloendopeptidase activity(GO:0004222) |
| 0.1 | 1.7 | GO:0097371 | MDM2/MDM4 family protein binding(GO:0097371) |
| 0.1 | 1.2 | GO:0004897 | ciliary neurotrophic factor receptor activity(GO:0004897) |
| 0.1 | 2.6 | GO:0045295 | gamma-catenin binding(GO:0045295) |
| 0.1 | 1.6 | GO:0034452 | dynactin binding(GO:0034452) |
| 0.1 | 0.9 | GO:0015349 | thyroid hormone transmembrane transporter activity(GO:0015349) |
| 0.1 | 1.1 | GO:0004957 | prostaglandin E receptor activity(GO:0004957) |
| 0.1 | 0.6 | GO:0001129 | RNA polymerase II transcription factor activity, TBP-class protein binding, involved in preinitiation complex assembly(GO:0001129) RNA polymerase II transcription factor activity, TBP-class protein binding(GO:0001132) |
| 0.1 | 0.8 | GO:0003810 | protein-glutamine gamma-glutamyltransferase activity(GO:0003810) |
| 0.1 | 2.2 | GO:0034185 | apolipoprotein binding(GO:0034185) |
| 0.1 | 1.9 | GO:0005104 | fibroblast growth factor receptor binding(GO:0005104) |
| 0.1 | 1.5 | GO:0016813 | hydrolase activity, acting on carbon-nitrogen (but not peptide) bonds, in linear amidines(GO:0016813) |
| 0.1 | 3.3 | GO:0030546 | receptor activator activity(GO:0030546) |
| 0.1 | 1.5 | GO:0033130 | acetylcholine receptor binding(GO:0033130) |
| 0.1 | 7.2 | GO:0035255 | ionotropic glutamate receptor binding(GO:0035255) |
| 0.1 | 2.5 | GO:0004012 | phospholipid-translocating ATPase activity(GO:0004012) |
| 0.1 | 0.7 | GO:0004499 | N,N-dimethylaniline monooxygenase activity(GO:0004499) |
| 0.1 | 1.6 | GO:0042800 | histone methyltransferase activity (H3-K4 specific)(GO:0042800) |
| 0.1 | 1.5 | GO:0004089 | carbonate dehydratase activity(GO:0004089) |
| 0.1 | 4.1 | GO:0004364 | glutathione transferase activity(GO:0004364) |
| 0.1 | 4.4 | GO:0017112 | Rab guanyl-nucleotide exchange factor activity(GO:0017112) |
| 0.1 | 1.5 | GO:0015467 | G-protein activated inward rectifier potassium channel activity(GO:0015467) |
| 0.1 | 5.6 | GO:0070412 | R-SMAD binding(GO:0070412) |
| 0.1 | 0.4 | GO:0004427 | inorganic diphosphatase activity(GO:0004427) |
| 0.1 | 0.7 | GO:0046920 | alpha-(1->3)-fucosyltransferase activity(GO:0046920) |
| 0.1 | 0.3 | GO:0017159 | pantetheine hydrolase activity(GO:0017159) |
| 0.1 | 1.5 | GO:0001083 | transcription factor activity, RNA polymerase II basal transcription factor binding(GO:0001083) |
| 0.1 | 1.8 | GO:0005540 | hyaluronic acid binding(GO:0005540) |
| 0.1 | 1.6 | GO:0050321 | tau-protein kinase activity(GO:0050321) |
| 0.1 | 2.1 | GO:0071837 | HMG box domain binding(GO:0071837) |
| 0.1 | 3.0 | GO:0003785 | actin monomer binding(GO:0003785) |
| 0.1 | 0.6 | GO:0034713 | type I transforming growth factor beta receptor binding(GO:0034713) |
| 0.1 | 0.4 | GO:0031708 | endothelin B receptor binding(GO:0031708) |
| 0.1 | 12.1 | GO:0001078 | transcriptional repressor activity, RNA polymerase II core promoter proximal region sequence-specific binding(GO:0001078) |
| 0.1 | 0.7 | GO:0051371 | muscle alpha-actinin binding(GO:0051371) |
| 0.1 | 1.9 | GO:0097200 | cysteine-type endopeptidase activity involved in execution phase of apoptosis(GO:0097200) |
| 0.1 | 0.3 | GO:0016934 | extracellular-glycine-gated ion channel activity(GO:0016933) extracellular-glycine-gated chloride channel activity(GO:0016934) |
| 0.1 | 1.1 | GO:0016641 | oxidoreductase activity, acting on the CH-NH2 group of donors, oxygen as acceptor(GO:0016641) |
| 0.1 | 1.0 | GO:0005149 | interleukin-1 receptor binding(GO:0005149) |
| 0.1 | 2.3 | GO:0016765 | transferase activity, transferring alkyl or aryl (other than methyl) groups(GO:0016765) |
| 0.1 | 3.5 | GO:0032934 | sterol binding(GO:0032934) |
| 0.1 | 0.5 | GO:0045499 | chemorepellent activity(GO:0045499) |
| 0.1 | 0.3 | GO:0004594 | pantothenate kinase activity(GO:0004594) |
| 0.1 | 2.0 | GO:0043015 | gamma-tubulin binding(GO:0043015) |
| 0.1 | 2.0 | GO:0043236 | laminin binding(GO:0043236) |
| 0.1 | 8.4 | GO:0008201 | heparin binding(GO:0008201) |
| 0.1 | 0.6 | GO:0017154 | semaphorin receptor activity(GO:0017154) |
| 0.0 | 10.4 | GO:0004252 | serine-type endopeptidase activity(GO:0004252) |
| 0.0 | 3.8 | GO:0003774 | motor activity(GO:0003774) |
| 0.0 | 7.4 | GO:0044325 | ion channel binding(GO:0044325) |
| 0.0 | 1.7 | GO:0046875 | ephrin receptor binding(GO:0046875) |
| 0.0 | 1.2 | GO:0005086 | ARF guanyl-nucleotide exchange factor activity(GO:0005086) |
| 0.0 | 1.1 | GO:0016702 | oxidoreductase activity, acting on single donors with incorporation of molecular oxygen, incorporation of two atoms of oxygen(GO:0016702) |
| 0.0 | 0.4 | GO:0015194 | L-serine transmembrane transporter activity(GO:0015194) serine transmembrane transporter activity(GO:0022889) |
| 0.0 | 0.3 | GO:0031697 | beta-1 adrenergic receptor binding(GO:0031697) |
| 0.0 | 4.7 | GO:0017137 | Rab GTPase binding(GO:0017137) |
| 0.0 | 0.1 | GO:0080130 | L-phenylalanine:2-oxoglutarate aminotransferase activity(GO:0080130) |
| 0.0 | 1.1 | GO:0004869 | cysteine-type endopeptidase inhibitor activity(GO:0004869) |
| 0.0 | 0.5 | GO:0008656 | cysteine-type endopeptidase activator activity involved in apoptotic process(GO:0008656) |
| 0.0 | 1.2 | GO:0042169 | SH2 domain binding(GO:0042169) |
| 0.0 | 0.5 | GO:0019864 | IgG binding(GO:0019864) |
| 0.0 | 2.2 | GO:0004722 | protein serine/threonine phosphatase activity(GO:0004722) |
| 0.0 | 1.0 | GO:0008200 | ion channel inhibitor activity(GO:0008200) |
| 0.0 | 0.7 | GO:0005248 | voltage-gated sodium channel activity(GO:0005248) voltage-gated ion channel activity involved in regulation of postsynaptic membrane potential(GO:1905030) |
| 0.0 | 0.8 | GO:0004709 | MAP kinase kinase kinase activity(GO:0004709) |
| 0.0 | 0.3 | GO:0004065 | arylsulfatase activity(GO:0004065) |
| 0.0 | 1.4 | GO:0004715 | non-membrane spanning protein tyrosine kinase activity(GO:0004715) |
| 0.0 | 3.6 | GO:0005516 | calmodulin binding(GO:0005516) |
| 0.0 | 5.2 | GO:0005088 | Ras guanyl-nucleotide exchange factor activity(GO:0005088) |
| 0.0 | 0.5 | GO:0001784 | phosphotyrosine binding(GO:0001784) |
| 0.0 | 1.9 | GO:0008307 | structural constituent of muscle(GO:0008307) |
| 0.0 | 1.7 | GO:0005254 | chloride channel activity(GO:0005254) |
| 0.0 | 0.2 | GO:0004791 | thioredoxin-disulfide reductase activity(GO:0004791) |
| 0.0 | 0.2 | GO:0035727 | lysophosphatidic acid binding(GO:0035727) |
| 0.0 | 0.1 | GO:0019237 | centromeric DNA binding(GO:0019237) |
| 0.0 | 1.2 | GO:0008375 | acetylglucosaminyltransferase activity(GO:0008375) |
| 0.0 | 0.2 | GO:0016868 | intramolecular transferase activity, phosphotransferases(GO:0016868) |
| 0.0 | 0.5 | GO:0019894 | kinesin binding(GO:0019894) |
| 0.0 | 0.6 | GO:0051018 | protein kinase A binding(GO:0051018) |
| 0.0 | 0.9 | GO:0005262 | calcium channel activity(GO:0005262) |
| 0.0 | 0.1 | GO:0004461 | lactose synthase activity(GO:0004461) |
| 0.0 | 0.2 | GO:0043325 | phosphatidylinositol-3,4-bisphosphate binding(GO:0043325) |
| 0.0 | 0.2 | GO:0051428 | peptide hormone receptor binding(GO:0051428) |
Gene overrepresentation in curated gene sets: canonical pathways category:
| Log-likelihood per target | Total log-likelihood | Term | Description |
|---|---|---|---|
| 0.7 | 8.8 | PID ATF2 PATHWAY | ATF-2 transcription factor network |
| 0.5 | 21.4 | ST WNT CA2 CYCLIC GMP PATHWAY | Wnt/Ca2+/cyclic GMP signaling. |
| 0.3 | 13.4 | PID PDGFRA PATHWAY | PDGFR-alpha signaling pathway |
| 0.3 | 19.2 | PID AMB2 NEUTROPHILS PATHWAY | amb2 Integrin signaling |
| 0.3 | 20.7 | PID FRA PATHWAY | Validated transcriptional targets of AP1 family members Fra1 and Fra2 |
| 0.2 | 17.7 | PID HNF3B PATHWAY | FOXA2 and FOXA3 transcription factor networks |
| 0.2 | 8.2 | PID RAS PATHWAY | Regulation of Ras family activation |
| 0.2 | 9.3 | SA CASPASE CASCADE | Apoptosis is mediated by caspases, cysteine proteases arranged in a proteolytic cascade. |
| 0.2 | 3.0 | PID THROMBIN PAR4 PATHWAY | PAR4-mediated thrombin signaling events |
| 0.2 | 3.9 | PID VEGF VEGFR PATHWAY | VEGF and VEGFR signaling network |
| 0.2 | 7.3 | NABA PROTEOGLYCANS | Genes encoding proteoglycans |
| 0.2 | 3.8 | PID EPHB FWD PATHWAY | EPHB forward signaling |
| 0.2 | 7.3 | NABA COLLAGENS | Genes encoding collagen proteins |
| 0.1 | 2.2 | PID IL2 1PATHWAY | IL2-mediated signaling events |
| 0.1 | 25.0 | NABA ECM AFFILIATED | Genes encoding proteins affiliated structurally or functionally to extracellular matrix proteins |
| 0.1 | 4.5 | PID HIF2PATHWAY | HIF-2-alpha transcription factor network |
| 0.1 | 7.9 | PID NFAT TFPATHWAY | Calcineurin-regulated NFAT-dependent transcription in lymphocytes |
| 0.1 | 29.7 | NABA ECM REGULATORS | Genes encoding enzymes and their regulators involved in the remodeling of the extracellular matrix |
| 0.1 | 3.6 | ST GA12 PATHWAY | G alpha 12 Pathway |
| 0.1 | 1.8 | SA PROGRAMMED CELL DEATH | Programmed cell death, or apoptosis, eliminates damaged or unneeded cells. |
| 0.1 | 1.2 | PID ENDOTHELIN PATHWAY | Endothelins |
| 0.1 | 0.8 | PID P38 MKK3 6PATHWAY | p38 MAPK signaling pathway |
| 0.1 | 1.2 | PID FCER1 PATHWAY | Fc-epsilon receptor I signaling in mast cells |
| 0.1 | 1.1 | PID IL23 PATHWAY | IL23-mediated signaling events |
| 0.1 | 1.1 | PID CONE PATHWAY | Visual signal transduction: Cones |
| 0.0 | 1.1 | PID LIS1 PATHWAY | Lissencephaly gene (LIS1) in neuronal migration and development |
| 0.0 | 1.2 | PID ECADHERIN KERATINOCYTE PATHWAY | E-cadherin signaling in keratinocytes |
| 0.0 | 1.9 | PID RXR VDR PATHWAY | RXR and RAR heterodimerization with other nuclear receptor |
| 0.0 | 1.8 | PID IL12 STAT4 PATHWAY | IL12 signaling mediated by STAT4 |
| 0.0 | 1.3 | PID IL2 PI3K PATHWAY | IL2 signaling events mediated by PI3K |
| 0.0 | 1.6 | PID REELIN PATHWAY | Reelin signaling pathway |
| 0.0 | 2.2 | PID ANGIOPOIETIN RECEPTOR PATHWAY | Angiopoietin receptor Tie2-mediated signaling |
| 0.0 | 0.8 | PID EPO PATHWAY | EPO signaling pathway |
| 0.0 | 0.9 | PID WNT CANONICAL PATHWAY | Canonical Wnt signaling pathway |
| 0.0 | 1.7 | PID AP1 PATHWAY | AP-1 transcription factor network |
| 0.0 | 1.1 | PID TXA2PATHWAY | Thromboxane A2 receptor signaling |
| 0.0 | 0.3 | PID RETINOIC ACID PATHWAY | Retinoic acid receptors-mediated signaling |
| 0.0 | 0.8 | PID CD40 PATHWAY | CD40/CD40L signaling |
| 0.0 | 1.4 | PID LKB1 PATHWAY | LKB1 signaling events |
| 0.0 | 0.9 | PID HNF3A PATHWAY | FOXA1 transcription factor network |
| 0.0 | 1.1 | PID BMP PATHWAY | BMP receptor signaling |
| 0.0 | 0.2 | PID HEDGEHOG 2PATHWAY | Signaling events mediated by the Hedgehog family |
| 0.0 | 0.8 | ST INTEGRIN SIGNALING PATHWAY | Integrin Signaling Pathway |
Gene overrepresentation in curated gene sets: REACTOME pathways category:
| Log-likelihood per target | Total log-likelihood | Term | Description |
|---|---|---|---|
| 0.6 | 11.0 | REACTOME PLATELET ADHESION TO EXPOSED COLLAGEN | Genes involved in Platelet Adhesion to exposed collagen |
| 0.6 | 9.6 | REACTOME KERATAN SULFATE DEGRADATION | Genes involved in Keratan sulfate degradation |
| 0.5 | 7.5 | REACTOME ANDROGEN BIOSYNTHESIS | Genes involved in Androgen biosynthesis |
| 0.4 | 14.2 | REACTOME UNBLOCKING OF NMDA RECEPTOR GLUTAMATE BINDING AND ACTIVATION | Genes involved in Unblocking of NMDA receptor, glutamate binding and activation |
| 0.4 | 11.7 | REACTOME ACTIVATION OF THE AP1 FAMILY OF TRANSCRIPTION FACTORS | Genes involved in Activation of the AP-1 family of transcription factors |
| 0.4 | 7.7 | REACTOME XENOBIOTICS | Genes involved in Xenobiotics |
| 0.4 | 4.4 | REACTOME CREATION OF C4 AND C2 ACTIVATORS | Genes involved in Creation of C4 and C2 activators |
| 0.3 | 7.7 | REACTOME HS GAG DEGRADATION | Genes involved in HS-GAG degradation |
| 0.2 | 4.7 | REACTOME TRANSPORT OF ORGANIC ANIONS | Genes involved in Transport of organic anions |
| 0.2 | 14.1 | REACTOME VOLTAGE GATED POTASSIUM CHANNELS | Genes involved in Voltage gated Potassium channels |
| 0.2 | 3.9 | REACTOME VEGF LIGAND RECEPTOR INTERACTIONS | Genes involved in VEGF ligand-receptor interactions |
| 0.2 | 7.6 | REACTOME COMPLEMENT CASCADE | Genes involved in Complement cascade |
| 0.2 | 13.0 | REACTOME NCAM1 INTERACTIONS | Genes involved in NCAM1 interactions |
| 0.2 | 9.0 | REACTOME INTRINSIC PATHWAY FOR APOPTOSIS | Genes involved in Intrinsic Pathway for Apoptosis |
| 0.2 | 2.0 | REACTOME PROSTANOID LIGAND RECEPTORS | Genes involved in Prostanoid ligand receptors |
| 0.1 | 3.7 | REACTOME REGULATION OF INSULIN LIKE GROWTH FACTOR IGF ACTIVITY BY INSULIN LIKE GROWTH FACTOR BINDING PROTEINS IGFBPS | Genes involved in Regulation of Insulin-like Growth Factor (IGF) Activity by Insulin-like Growth Factor Binding Proteins (IGFBPs) |
| 0.1 | 1.0 | REACTOME EICOSANOID LIGAND BINDING RECEPTORS | Genes involved in Eicosanoid ligand-binding receptors |
| 0.1 | 5.4 | REACTOME GABA A RECEPTOR ACTIVATION | Genes involved in GABA A receptor activation |
| 0.1 | 5.4 | REACTOME PYRIMIDINE METABOLISM | Genes involved in Pyrimidine metabolism |
| 0.1 | 11.3 | REACTOME AMINO ACID AND OLIGOPEPTIDE SLC TRANSPORTERS | Genes involved in Amino acid and oligopeptide SLC transporters |
| 0.1 | 1.1 | REACTOME PURINE CATABOLISM | Genes involved in Purine catabolism |
| 0.1 | 2.2 | REACTOME CHYLOMICRON MEDIATED LIPID TRANSPORT | Genes involved in Chylomicron-mediated lipid transport |
| 0.1 | 4.1 | REACTOME GLUTATHIONE CONJUGATION | Genes involved in Glutathione conjugation |
| 0.1 | 3.8 | REACTOME TIE2 SIGNALING | Genes involved in Tie2 Signaling |
| 0.1 | 3.7 | REACTOME SPHINGOLIPID DE NOVO BIOSYNTHESIS | Genes involved in Sphingolipid de novo biosynthesis |
| 0.1 | 3.5 | REACTOME IL RECEPTOR SHC SIGNALING | Genes involved in Interleukin receptor SHC signaling |
| 0.1 | 0.7 | REACTOME TRYPTOPHAN CATABOLISM | Genes involved in Tryptophan catabolism |
| 0.1 | 2.3 | REACTOME A TETRASACCHARIDE LINKER SEQUENCE IS REQUIRED FOR GAG SYNTHESIS | Genes involved in A tetrasaccharide linker sequence is required for GAG synthesis |
| 0.1 | 1.2 | REACTOME SYNTHESIS OF BILE ACIDS AND BILE SALTS VIA 24 HYDROXYCHOLESTEROL | Genes involved in Synthesis of bile acids and bile salts via 24-hydroxycholesterol |
| 0.1 | 2.4 | REACTOME SULFUR AMINO ACID METABOLISM | Genes involved in Sulfur amino acid metabolism |
| 0.1 | 1.6 | REACTOME P2Y RECEPTORS | Genes involved in P2Y receptors |
| 0.1 | 1.5 | REACTOME REVERSIBLE HYDRATION OF CARBON DIOXIDE | Genes involved in Reversible Hydration of Carbon Dioxide |
| 0.1 | 6.0 | REACTOME STRIATED MUSCLE CONTRACTION | Genes involved in Striated Muscle Contraction |
| 0.1 | 2.3 | REACTOME CYTOCHROME P450 ARRANGED BY SUBSTRATE TYPE | Genes involved in Cytochrome P450 - arranged by substrate type |
| 0.1 | 1.4 | REACTOME INTRINSIC PATHWAY | Genes involved in Intrinsic Pathway |
| 0.1 | 1.6 | REACTOME STEROID HORMONES | Genes involved in Steroid hormones |
| 0.1 | 2.8 | REACTOME ADHERENS JUNCTIONS INTERACTIONS | Genes involved in Adherens junctions interactions |
| 0.1 | 2.0 | REACTOME DARPP 32 EVENTS | Genes involved in DARPP-32 events |
| 0.1 | 1.7 | REACTOME GLYCOGEN BREAKDOWN GLYCOGENOLYSIS | Genes involved in Glycogen breakdown (glycogenolysis) |
| 0.1 | 2.4 | REACTOME CELL CELL JUNCTION ORGANIZATION | Genes involved in Cell-cell junction organization |
| 0.1 | 1.8 | REACTOME IL 3 5 AND GM CSF SIGNALING | Genes involved in Interleukin-3, 5 and GM-CSF signaling |
| 0.1 | 8.8 | REACTOME FACTORS INVOLVED IN MEGAKARYOCYTE DEVELOPMENT AND PLATELET PRODUCTION | Genes involved in Factors involved in megakaryocyte development and platelet production |
| 0.1 | 0.9 | REACTOME SIGNALING BY NODAL | Genes involved in Signaling by NODAL |
| 0.0 | 1.9 | REACTOME INTERACTION BETWEEN L1 AND ANKYRINS | Genes involved in Interaction between L1 and Ankyrins |
| 0.0 | 5.1 | REACTOME NUCLEAR RECEPTOR TRANSCRIPTION PATHWAY | Genes involved in Nuclear Receptor transcription pathway |
| 0.0 | 2.5 | REACTOME ION TRANSPORT BY P TYPE ATPASES | Genes involved in Ion transport by P-type ATPases |
| 0.0 | 0.7 | REACTOME BILE SALT AND ORGANIC ANION SLC TRANSPORTERS | Genes involved in Bile salt and organic anion SLC transporters |
| 0.0 | 1.5 | REACTOME INHIBITION OF VOLTAGE GATED CA2 CHANNELS VIA GBETA GAMMA SUBUNITS | Genes involved in Inhibition of voltage gated Ca2+ channels via Gbeta/gamma subunits |
| 0.0 | 0.9 | REACTOME SYNTHESIS OF GLYCOSYLPHOSPHATIDYLINOSITOL GPI | Genes involved in Synthesis of glycosylphosphatidylinositol (GPI) |
| 0.0 | 2.9 | REACTOME LOSS OF NLP FROM MITOTIC CENTROSOMES | Genes involved in Loss of Nlp from mitotic centrosomes |
| 0.0 | 1.4 | REACTOME CHOLESTEROL BIOSYNTHESIS | Genes involved in Cholesterol biosynthesis |
| 0.0 | 0.3 | REACTOME ION CHANNEL TRANSPORT | Genes involved in Ion channel transport |
| 0.0 | 1.1 | REACTOME CELL EXTRACELLULAR MATRIX INTERACTIONS | Genes involved in Cell-extracellular matrix interactions |
| 0.0 | 1.3 | REACTOME PIP3 ACTIVATES AKT SIGNALING | Genes involved in PIP3 activates AKT signaling |
| 0.0 | 0.4 | REACTOME SEMA3A PLEXIN REPULSION SIGNALING BY INHIBITING INTEGRIN ADHESION | Genes involved in SEMA3A-Plexin repulsion signaling by inhibiting Integrin adhesion |
| 0.0 | 0.7 | REACTOME PHASE1 FUNCTIONALIZATION OF COMPOUNDS | Genes involved in Phase 1 - Functionalization of compounds |
| 0.0 | 0.3 | REACTOME DIGESTION OF DIETARY CARBOHYDRATE | Genes involved in Digestion of dietary carbohydrate |
| 0.0 | 0.3 | REACTOME THE ACTIVATION OF ARYLSULFATASES | Genes involved in The activation of arylsulfatases |
| 0.0 | 0.3 | REACTOME VITAMIN B5 PANTOTHENATE METABOLISM | Genes involved in Vitamin B5 (pantothenate) metabolism |
| 0.0 | 1.1 | REACTOME L1CAM INTERACTIONS | Genes involved in L1CAM interactions |
| 0.0 | 1.0 | REACTOME MYOGENESIS | Genes involved in Myogenesis |
| 0.0 | 1.1 | REACTOME CELL SURFACE INTERACTIONS AT THE VASCULAR WALL | Genes involved in Cell surface interactions at the vascular wall |
| 0.0 | 0.5 | REACTOME GLUCURONIDATION | Genes involved in Glucuronidation |
| 0.0 | 0.3 | REACTOME NEPHRIN INTERACTIONS | Genes involved in Nephrin interactions |
| 0.0 | 2.9 | REACTOME SIGNALING BY RHO GTPASES | Genes involved in Signaling by Rho GTPases |
| 0.0 | 1.1 | REACTOME CHEMOKINE RECEPTORS BIND CHEMOKINES | Genes involved in Chemokine receptors bind chemokines |
| 0.0 | 0.9 | REACTOME METABOLISM OF VITAMINS AND COFACTORS | Genes involved in Metabolism of vitamins and cofactors |
| 0.0 | 0.2 | REACTOME SYNTHESIS OF SUBSTRATES IN N GLYCAN BIOSYTHESIS | Genes involved in Synthesis of substrates in N-glycan biosythesis |