Project
GNF SymAtlas + NCI-60 cancer cell lines, human (Su, 2004; Ross, 2000)
Navigation
Downloads
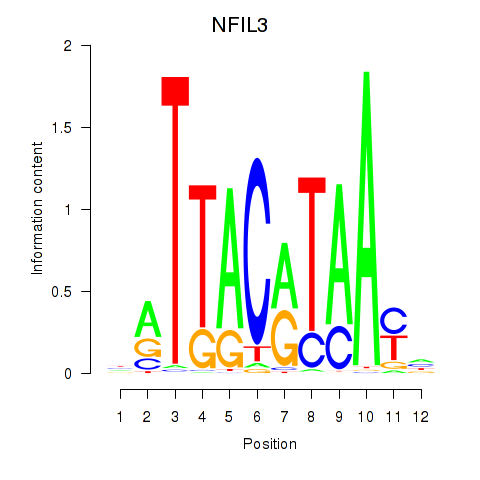
Results for NFIL3
Z-value: 1.55
Motif logo
Transcription factors associated with NFIL3
| Gene Symbol | Gene ID | Gene Info |
|---|---|---|
|
NFIL3
|
ENSG00000165030.4 | NFIL3 |
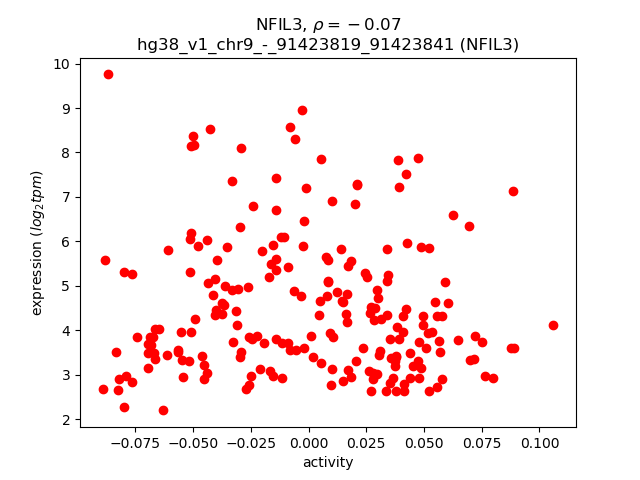
Activity-expression correlation:
| Gene | Promoter | Pearson corr. coef. | P-value | Plot |
|---|---|---|---|---|
| NFIL3 | hg38_v1_chr9_-_91423819_91423841 | -0.07 | 3.3e-01 | Click! |
Activity profile of NFIL3 motif
Sorted Z-values of NFIL3 motif
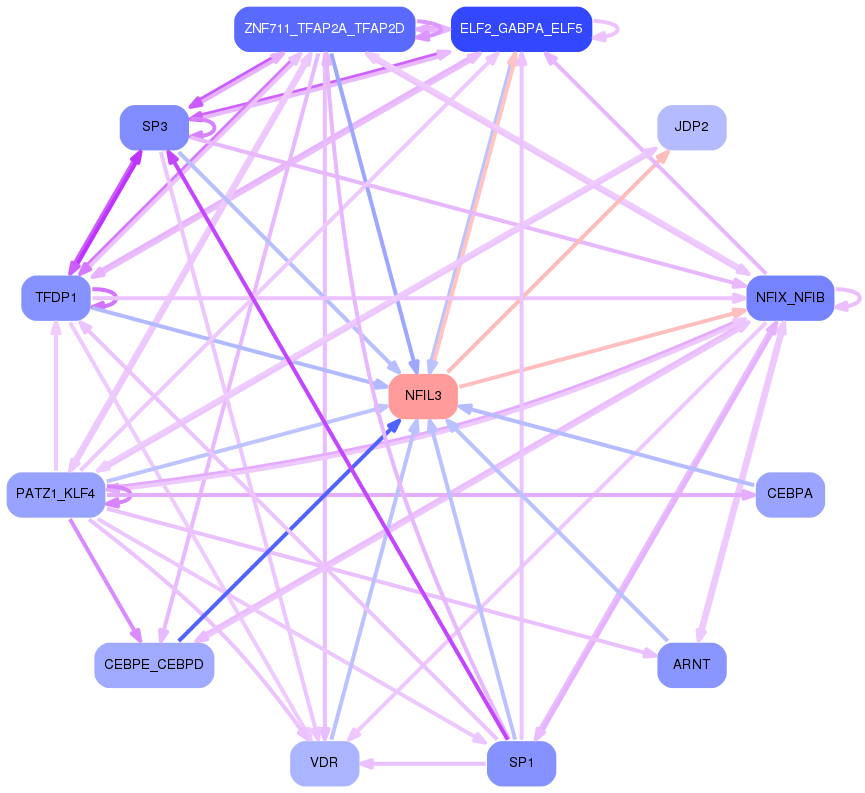
Network of associatons between targets according to the STRING database.

First level regulatory network of NFIL3
Gene Ontology Analysis
Gene overrepresentation in biological process category:
| Log-likelihood per target | Total log-likelihood | Term | Description |
|---|---|---|---|
| 15.8 | 78.9 | GO:1902998 | regulation of neuronal signal transduction(GO:1902847) positive regulation of neurofibrillary tangle assembly(GO:1902998) |
| 14.5 | 43.6 | GO:0007199 | G-protein coupled receptor signaling pathway coupled to cGMP nucleotide second messenger(GO:0007199) response to muscle activity involved in regulation of muscle adaptation(GO:0014873) |
| 10.6 | 138.4 | GO:1900747 | negative regulation of vascular endothelial growth factor signaling pathway(GO:1900747) |
| 9.3 | 27.9 | GO:0006982 | response to lipid hydroperoxide(GO:0006982) |
| 8.7 | 26.0 | GO:0030185 | nitric oxide transport(GO:0030185) |
| 5.2 | 31.3 | GO:0009753 | response to jasmonic acid(GO:0009753) cellular response to jasmonic acid stimulus(GO:0071395) |
| 5.0 | 15.0 | GO:0045643 | regulation of eosinophil differentiation(GO:0045643) positive regulation of eosinophil differentiation(GO:0045645) |
| 4.8 | 19.1 | GO:0010958 | regulation of amino acid import(GO:0010958) |
| 4.2 | 16.9 | GO:0010900 | negative regulation of phosphatidylcholine catabolic process(GO:0010900) |
| 4.0 | 11.9 | GO:0051684 | maintenance of Golgi location(GO:0051684) |
| 3.9 | 15.5 | GO:0086097 | phospholipase C-activating angiotensin-activated signaling pathway(GO:0086097) |
| 3.4 | 13.5 | GO:0010652 | regulation of cell communication by chemical coupling(GO:0010645) positive regulation of cell communication by chemical coupling(GO:0010652) |
| 3.3 | 19.9 | GO:0070131 | positive regulation of mitochondrial translation(GO:0070131) |
| 3.1 | 21.8 | GO:2000324 | positive regulation of glucocorticoid receptor signaling pathway(GO:2000324) |
| 3.0 | 9.0 | GO:0001983 | regulation of systemic arterial blood pressure by carotid sinus baroreceptor feedback(GO:0001978) baroreceptor response to increased systemic arterial blood pressure(GO:0001983) |
| 2.9 | 8.8 | GO:1903567 | negative regulation of protein localization to cilium(GO:1903565) regulation of protein localization to ciliary membrane(GO:1903567) negative regulation of protein localization to ciliary membrane(GO:1903568) |
| 2.9 | 25.8 | GO:1902902 | negative regulation of autophagosome assembly(GO:1902902) |
| 2.8 | 11.2 | GO:1904640 | response to methionine(GO:1904640) |
| 2.8 | 16.5 | GO:0060373 | regulation of ventricular cardiac muscle cell membrane depolarization(GO:0060373) |
| 2.7 | 16.0 | GO:0071442 | positive regulation of histone H3-K14 acetylation(GO:0071442) |
| 2.7 | 10.6 | GO:1990535 | regulation of intracellular calcium activated chloride channel activity(GO:1902938) neuron projection maintenance(GO:1990535) |
| 2.5 | 15.2 | GO:0006651 | diacylglycerol biosynthetic process(GO:0006651) |
| 2.5 | 9.8 | GO:0005986 | sucrose biosynthetic process(GO:0005986) |
| 2.5 | 17.2 | GO:0070560 | protein secretion by platelet(GO:0070560) |
| 2.4 | 21.9 | GO:0002175 | protein localization to paranode region of axon(GO:0002175) |
| 2.4 | 12.1 | GO:0071727 | toll-like receptor TLR1:TLR2 signaling pathway(GO:0038123) response to triacyl bacterial lipopeptide(GO:0071725) cellular response to triacyl bacterial lipopeptide(GO:0071727) |
| 2.4 | 7.2 | GO:0002143 | tRNA wobble position uridine thiolation(GO:0002143) enzyme active site formation(GO:0018307) |
| 2.4 | 7.2 | GO:0060474 | positive regulation of sperm motility involved in capacitation(GO:0060474) |
| 2.4 | 16.6 | GO:0033591 | response to L-ascorbic acid(GO:0033591) |
| 2.4 | 16.5 | GO:0038172 | interleukin-33-mediated signaling pathway(GO:0038172) |
| 2.3 | 23.2 | GO:0009449 | gamma-aminobutyric acid biosynthetic process(GO:0009449) |
| 2.3 | 18.2 | GO:0007506 | gonadal mesoderm development(GO:0007506) |
| 2.2 | 8.8 | GO:1900138 | negative regulation of phospholipase A2 activity(GO:1900138) |
| 2.1 | 2.1 | GO:0071947 | protein deubiquitination involved in ubiquitin-dependent protein catabolic process(GO:0071947) |
| 2.1 | 6.4 | GO:0061026 | cardiac muscle tissue regeneration(GO:0061026) |
| 2.1 | 8.4 | GO:0071231 | cellular response to folic acid(GO:0071231) |
| 2.1 | 2.1 | GO:0003330 | regulation of extracellular matrix constituent secretion(GO:0003330) positive regulation of extracellular matrix constituent secretion(GO:0003331) |
| 2.0 | 14.2 | GO:0061370 | testosterone biosynthetic process(GO:0061370) |
| 2.0 | 17.9 | GO:1902035 | positive regulation of hematopoietic stem cell proliferation(GO:1902035) |
| 2.0 | 17.9 | GO:1903898 | negative regulation of PERK-mediated unfolded protein response(GO:1903898) negative regulation of endoplasmic reticulum stress-induced eIF2 alpha phosphorylation(GO:1903912) |
| 2.0 | 9.9 | GO:0072144 | mesangial cell development(GO:0072143) glomerular mesangial cell development(GO:0072144) mesenchyme migration(GO:0090131) |
| 2.0 | 5.9 | GO:0046271 | phenylpropanoid catabolic process(GO:0046271) |
| 1.9 | 7.6 | GO:0051037 | regulation of transcription involved in meiotic cell cycle(GO:0051037) |
| 1.9 | 9.5 | GO:0018243 | protein O-linked glycosylation via threonine(GO:0018243) |
| 1.8 | 5.5 | GO:1905237 | response to cyclosporin A(GO:1905237) |
| 1.8 | 5.4 | GO:0071206 | establishment of protein localization to juxtaparanode region of axon(GO:0071206) |
| 1.8 | 5.4 | GO:2000296 | negative regulation of hydrogen peroxide catabolic process(GO:2000296) |
| 1.7 | 60.8 | GO:0045187 | regulation of circadian sleep/wake cycle, sleep(GO:0045187) |
| 1.6 | 11.4 | GO:0048050 | post-embryonic eye morphogenesis(GO:0048050) |
| 1.6 | 9.8 | GO:0051012 | microtubule sliding(GO:0051012) |
| 1.6 | 4.9 | GO:1901895 | negative regulation of calcium-transporting ATPase activity(GO:1901895) |
| 1.6 | 6.4 | GO:0046485 | ether lipid metabolic process(GO:0046485) |
| 1.6 | 11.1 | GO:1904879 | positive regulation of calcium ion transmembrane transport via high voltage-gated calcium channel(GO:1904879) |
| 1.6 | 18.8 | GO:0006069 | ethanol oxidation(GO:0006069) |
| 1.5 | 20.0 | GO:0045919 | positive regulation of cytolysis(GO:0045919) |
| 1.5 | 9.1 | GO:0016554 | cytidine to uridine editing(GO:0016554) |
| 1.5 | 16.6 | GO:0010499 | proteasomal ubiquitin-independent protein catabolic process(GO:0010499) |
| 1.5 | 4.5 | GO:0009804 | phenylpropanoid metabolic process(GO:0009698) coumarin metabolic process(GO:0009804) |
| 1.5 | 3.0 | GO:0032227 | negative regulation of synaptic transmission, dopaminergic(GO:0032227) |
| 1.5 | 10.4 | GO:2001023 | regulation of response to drug(GO:2001023) |
| 1.4 | 24.4 | GO:0036149 | phosphatidylinositol acyl-chain remodeling(GO:0036149) |
| 1.4 | 14.2 | GO:0008354 | germ cell migration(GO:0008354) |
| 1.4 | 8.4 | GO:0048807 | female genitalia morphogenesis(GO:0048807) |
| 1.4 | 4.2 | GO:0052047 | interaction with other organism via secreted substance involved in symbiotic interaction(GO:0052047) negative regulation of cell-cell adhesion mediated by cadherin(GO:2000048) |
| 1.4 | 8.1 | GO:0035617 | stress granule disassembly(GO:0035617) |
| 1.3 | 10.7 | GO:0010936 | negative regulation of macrophage cytokine production(GO:0010936) |
| 1.3 | 4.0 | GO:0030573 | bile acid catabolic process(GO:0030573) |
| 1.3 | 5.3 | GO:1902159 | regulation of cyclic nucleotide-gated ion channel activity(GO:1902159) |
| 1.3 | 28.7 | GO:0052695 | cellular glucuronidation(GO:0052695) |
| 1.3 | 7.8 | GO:0048549 | positive regulation of pinocytosis(GO:0048549) |
| 1.3 | 3.9 | GO:1904582 | proepicardium development(GO:0003342) septum transversum development(GO:0003343) regulation of intracellular mRNA localization(GO:1904580) positive regulation of intracellular mRNA localization(GO:1904582) |
| 1.3 | 3.8 | GO:1903487 | regulation of lactation(GO:1903487) |
| 1.3 | 3.8 | GO:0051097 | negative regulation of helicase activity(GO:0051097) |
| 1.2 | 4.9 | GO:1900158 | hormone-mediated apoptotic signaling pathway(GO:0008628) positive regulation of osteoclast proliferation(GO:0090290) negative regulation of bone mineralization involved in bone maturation(GO:1900158) |
| 1.2 | 4.9 | GO:0060084 | synaptic transmission involved in micturition(GO:0060084) |
| 1.2 | 17.1 | GO:0021942 | radial glia guided migration of Purkinje cell(GO:0021942) |
| 1.2 | 6.0 | GO:1901350 | cell-cell signaling involved in cell-cell junction organization(GO:1901350) |
| 1.2 | 14.4 | GO:0051581 | negative regulation of neurotransmitter uptake(GO:0051581) regulation of serotonin uptake(GO:0051611) negative regulation of serotonin uptake(GO:0051612) |
| 1.2 | 21.5 | GO:0071028 | nuclear RNA surveillance(GO:0071027) nuclear mRNA surveillance(GO:0071028) |
| 1.2 | 10.7 | GO:0006528 | asparagine metabolic process(GO:0006528) |
| 1.2 | 5.8 | GO:0010701 | positive regulation of norepinephrine secretion(GO:0010701) |
| 1.2 | 13.8 | GO:0001514 | selenocysteine incorporation(GO:0001514) translational readthrough(GO:0006451) |
| 1.2 | 6.9 | GO:0036112 | medium-chain fatty-acyl-CoA metabolic process(GO:0036112) |
| 1.1 | 8.0 | GO:1903237 | negative regulation of leukocyte tethering or rolling(GO:1903237) |
| 1.1 | 10.2 | GO:2000124 | regulation of endocannabinoid signaling pathway(GO:2000124) |
| 1.1 | 17.7 | GO:0051256 | mitotic spindle midzone assembly(GO:0051256) |
| 1.1 | 7.7 | GO:0045329 | carnitine biosynthetic process(GO:0045329) |
| 1.1 | 16.2 | GO:0043562 | cellular response to nitrogen starvation(GO:0006995) cellular response to nitrogen levels(GO:0043562) |
| 1.1 | 4.3 | GO:0019477 | L-lysine catabolic process to acetyl-CoA(GO:0019474) L-lysine catabolic process(GO:0019477) L-lysine metabolic process(GO:0046440) |
| 1.1 | 5.3 | GO:0044856 | plasma membrane raft distribution(GO:0044855) plasma membrane raft localization(GO:0044856) plasma membrane raft polarization(GO:0044858) regulation of plasma membrane raft polarization(GO:1903906) |
| 1.1 | 4.2 | GO:0046601 | positive regulation of centriole replication(GO:0046601) |
| 1.0 | 16.8 | GO:0018298 | protein-chromophore linkage(GO:0018298) |
| 1.0 | 2.1 | GO:1903413 | cellular response to bile acid(GO:1903413) |
| 1.0 | 5.2 | GO:0014004 | microglia differentiation(GO:0014004) microglia development(GO:0014005) |
| 1.0 | 7.2 | GO:0090074 | negative regulation of protein homodimerization activity(GO:0090074) |
| 1.0 | 29.9 | GO:0035428 | hexose transmembrane transport(GO:0035428) glucose transmembrane transport(GO:1904659) |
| 1.0 | 8.2 | GO:0061709 | reticulophagy(GO:0061709) |
| 1.0 | 4.1 | GO:0097089 | methyl-branched fatty acid metabolic process(GO:0097089) |
| 1.0 | 3.0 | GO:0031938 | growth involved in heart morphogenesis(GO:0003241) cardiac muscle tissue growth involved in heart morphogenesis(GO:0003245) regulation of chromatin silencing at telomere(GO:0031938) |
| 1.0 | 5.1 | GO:0008298 | intracellular mRNA localization(GO:0008298) |
| 1.0 | 3.0 | GO:2000832 | negative regulation of steroid hormone secretion(GO:2000832) negative regulation of corticosteroid hormone secretion(GO:2000847) negative regulation of glucocorticoid secretion(GO:2000850) |
| 1.0 | 15.9 | GO:0090361 | platelet-derived growth factor production(GO:0090360) regulation of platelet-derived growth factor production(GO:0090361) |
| 1.0 | 10.9 | GO:0051791 | medium-chain fatty acid metabolic process(GO:0051791) |
| 1.0 | 3.0 | GO:0032707 | negative regulation of interleukin-23 production(GO:0032707) |
| 1.0 | 2.9 | GO:0010193 | response to ozone(GO:0010193) |
| 1.0 | 3.9 | GO:0006556 | S-adenosylmethionine biosynthetic process(GO:0006556) |
| 1.0 | 2.9 | GO:0001300 | chronological cell aging(GO:0001300) |
| 1.0 | 11.5 | GO:0070777 | D-aspartate transport(GO:0070777) D-aspartate import(GO:0070779) |
| 1.0 | 3.8 | GO:2000639 | regulation of SREBP signaling pathway(GO:2000638) negative regulation of SREBP signaling pathway(GO:2000639) |
| 0.9 | 3.8 | GO:0015722 | canalicular bile acid transport(GO:0015722) |
| 0.9 | 11.2 | GO:0034983 | peptidyl-lysine deacetylation(GO:0034983) |
| 0.9 | 2.8 | GO:0061034 | olfactory bulb mitral cell layer development(GO:0061034) |
| 0.9 | 3.6 | GO:0050960 | detection of temperature stimulus involved in thermoception(GO:0050960) response to capsazepine(GO:1901594) |
| 0.9 | 6.4 | GO:0042483 | negative regulation of odontogenesis(GO:0042483) |
| 0.9 | 2.6 | GO:1903774 | positive regulation of viral budding via host ESCRT complex(GO:1903774) |
| 0.9 | 5.2 | GO:1903936 | cellular response to sodium arsenite(GO:1903936) |
| 0.9 | 7.8 | GO:0048243 | norepinephrine secretion(GO:0048243) |
| 0.9 | 2.6 | GO:1903015 | regulation of exo-alpha-sialidase activity(GO:1903015) |
| 0.9 | 1.7 | GO:1900365 | positive regulation of mRNA polyadenylation(GO:1900365) |
| 0.9 | 2.6 | GO:0031959 | mineralocorticoid receptor signaling pathway(GO:0031959) regulation of cardiac vascular smooth muscle cell differentiation(GO:2000722) |
| 0.8 | 5.1 | GO:0060915 | fibroblast growth factor receptor signaling pathway involved in negative regulation of apoptotic process in bone marrow(GO:0035602) fibroblast growth factor receptor signaling pathway involved in hemopoiesis(GO:0035603) fibroblast growth factor receptor signaling pathway involved in positive regulation of cell proliferation in bone marrow(GO:0035604) squamous basal epithelial stem cell differentiation involved in prostate gland acinus development(GO:0060529) fibroblast growth factor receptor signaling pathway involved in mammary gland specification(GO:0060595) mammary gland bud formation(GO:0060615) branch elongation involved in salivary gland morphogenesis(GO:0060667) mesenchymal cell differentiation involved in lung development(GO:0060915) |
| 0.8 | 10.1 | GO:0008090 | retrograde axonal transport(GO:0008090) |
| 0.8 | 2.5 | GO:0042427 | isoquinoline alkaloid metabolic process(GO:0033076) serotonin biosynthetic process(GO:0042427) phytoalexin metabolic process(GO:0052314) |
| 0.8 | 5.8 | GO:1901509 | regulation of endothelial tube morphogenesis(GO:1901509) |
| 0.8 | 10.6 | GO:0043983 | histone H4-K12 acetylation(GO:0043983) |
| 0.8 | 5.7 | GO:0080009 | mRNA methylation(GO:0080009) |
| 0.8 | 4.1 | GO:2000323 | negative regulation of glucocorticoid receptor signaling pathway(GO:2000323) |
| 0.8 | 4.1 | GO:0061624 | fructose catabolic process(GO:0006001) fructose catabolic process to hydroxyacetone phosphate and glyceraldehyde-3-phosphate(GO:0061624) |
| 0.8 | 6.4 | GO:2000467 | positive regulation of glycogen (starch) synthase activity(GO:2000467) |
| 0.8 | 6.3 | GO:0061302 | smooth muscle cell-matrix adhesion(GO:0061302) |
| 0.8 | 2.3 | GO:0042819 | pyridoxine metabolic process(GO:0008614) pyridoxine biosynthetic process(GO:0008615) vitamin B6 biosynthetic process(GO:0042819) |
| 0.8 | 1.5 | GO:0051795 | positive regulation of catagen(GO:0051795) |
| 0.8 | 2.3 | GO:0090234 | regulation of kinetochore assembly(GO:0090234) |
| 0.7 | 5.9 | GO:0042904 | 9-cis-retinoic acid biosynthetic process(GO:0042904) 9-cis-retinoic acid metabolic process(GO:0042905) |
| 0.7 | 3.0 | GO:0006987 | activation of signaling protein activity involved in unfolded protein response(GO:0006987) |
| 0.7 | 6.6 | GO:0045054 | constitutive secretory pathway(GO:0045054) |
| 0.7 | 11.0 | GO:0021702 | cerebellar Purkinje cell layer formation(GO:0021694) cerebellar Purkinje cell differentiation(GO:0021702) |
| 0.7 | 19.8 | GO:0044458 | motile cilium assembly(GO:0044458) |
| 0.7 | 2.2 | GO:0002416 | IgG immunoglobulin transcytosis in epithelial cells mediated by FcRn immunoglobulin receptor(GO:0002416) |
| 0.7 | 12.9 | GO:0006590 | thyroid hormone generation(GO:0006590) |
| 0.7 | 2.1 | GO:0097498 | endothelial tube lumen extension(GO:0097498) |
| 0.7 | 1.4 | GO:1900005 | positive regulation of serine-type endopeptidase activity(GO:1900005) positive regulation of serine-type peptidase activity(GO:1902573) |
| 0.7 | 2.8 | GO:0021965 | spinal cord ventral commissure morphogenesis(GO:0021965) |
| 0.7 | 10.4 | GO:0042744 | hydrogen peroxide catabolic process(GO:0042744) |
| 0.7 | 2.7 | GO:0001080 | nitrogen catabolite regulation of transcription from RNA polymerase II promoter(GO:0001079) nitrogen catabolite activation of transcription from RNA polymerase II promoter(GO:0001080) regulation of urea metabolic process(GO:0034255) intracellular bile acid receptor signaling pathway(GO:0038185) interleukin-17 secretion(GO:0072615) nitrogen catabolite regulation of transcription(GO:0090293) nitrogen catabolite activation of transcription(GO:0090294) regulation of nitrogen cycle metabolic process(GO:1903314) positive regulation of glutamate metabolic process(GO:2000213) regulation of ammonia assimilation cycle(GO:2001248) positive regulation of ammonia assimilation cycle(GO:2001250) |
| 0.7 | 2.0 | GO:1901529 | positive regulation of anion channel activity(GO:1901529) |
| 0.7 | 3.9 | GO:0060054 | positive regulation of epithelial cell proliferation involved in wound healing(GO:0060054) |
| 0.6 | 12.3 | GO:0010763 | positive regulation of fibroblast migration(GO:0010763) |
| 0.6 | 6.5 | GO:2000348 | regulation of CD40 signaling pathway(GO:2000348) |
| 0.6 | 25.1 | GO:0008045 | motor neuron axon guidance(GO:0008045) |
| 0.6 | 1.9 | GO:0009720 | detection of hormone stimulus(GO:0009720) |
| 0.6 | 3.8 | GO:0008218 | bioluminescence(GO:0008218) |
| 0.6 | 2.5 | GO:0033306 | phytol metabolic process(GO:0033306) fatty alcohol metabolic process(GO:1903173) |
| 0.6 | 2.5 | GO:0030200 | proteoglycan catabolic process(GO:0030167) heparan sulfate proteoglycan catabolic process(GO:0030200) |
| 0.6 | 1.8 | GO:1904781 | positive regulation of protein localization to centrosome(GO:1904781) |
| 0.6 | 9.1 | GO:0045725 | positive regulation of glycogen biosynthetic process(GO:0045725) |
| 0.6 | 1.8 | GO:0044179 | hemolysis by symbiont of host erythrocytes(GO:0019836) hemolysis in other organism(GO:0044179) hemolysis in other organism involved in symbiotic interaction(GO:0052331) |
| 0.6 | 9.1 | GO:0097151 | positive regulation of inhibitory postsynaptic potential(GO:0097151) modulation of inhibitory postsynaptic potential(GO:0098828) |
| 0.6 | 9.7 | GO:0033539 | fatty acid beta-oxidation using acyl-CoA dehydrogenase(GO:0033539) |
| 0.6 | 1.8 | GO:0038155 | interleukin-23-mediated signaling pathway(GO:0038155) |
| 0.6 | 4.2 | GO:0015705 | iodide transport(GO:0015705) |
| 0.6 | 2.4 | GO:0019086 | late viral transcription(GO:0019086) |
| 0.6 | 9.4 | GO:0042420 | dopamine catabolic process(GO:0042420) |
| 0.6 | 9.9 | GO:0048681 | negative regulation of axon regeneration(GO:0048681) |
| 0.6 | 8.1 | GO:0000076 | DNA replication checkpoint(GO:0000076) |
| 0.6 | 3.5 | GO:0033274 | response to vitamin B2(GO:0033274) heterochromatin maintenance(GO:0070829) |
| 0.6 | 14.9 | GO:1904380 | endoplasmic reticulum mannose trimming(GO:1904380) |
| 0.6 | 5.1 | GO:0000050 | urea cycle(GO:0000050) |
| 0.6 | 4.5 | GO:1904354 | negative regulation of telomere capping(GO:1904354) |
| 0.6 | 3.4 | GO:0046541 | saliva secretion(GO:0046541) |
| 0.5 | 6.0 | GO:0006030 | chitin metabolic process(GO:0006030) chitin catabolic process(GO:0006032) |
| 0.5 | 5.9 | GO:0008612 | peptidyl-lysine modification to peptidyl-hypusine(GO:0008612) |
| 0.5 | 1.1 | GO:0002018 | renin-angiotensin regulation of aldosterone production(GO:0002018) |
| 0.5 | 9.5 | GO:0014029 | neural crest formation(GO:0014029) |
| 0.5 | 2.6 | GO:0001971 | negative regulation of activation of membrane attack complex(GO:0001971) |
| 0.5 | 4.2 | GO:0000480 | endonucleolytic cleavage in 5'-ETS of tricistronic rRNA transcript (SSU-rRNA, 5.8S rRNA, LSU-rRNA)(GO:0000480) |
| 0.5 | 9.4 | GO:1901897 | regulation of relaxation of cardiac muscle(GO:1901897) |
| 0.5 | 6.2 | GO:0045792 | negative regulation of cell size(GO:0045792) |
| 0.5 | 3.6 | GO:2000660 | negative regulation of interleukin-1-mediated signaling pathway(GO:2000660) |
| 0.5 | 3.1 | GO:0086073 | cardiac muscle cell-cardiac muscle cell adhesion(GO:0086042) bundle of His cell-Purkinje myocyte adhesion involved in cell communication(GO:0086073) |
| 0.5 | 5.1 | GO:0001842 | neural fold formation(GO:0001842) |
| 0.5 | 5.1 | GO:0008635 | activation of cysteine-type endopeptidase activity involved in apoptotic process by cytochrome c(GO:0008635) |
| 0.5 | 12.5 | GO:1902259 | regulation of delayed rectifier potassium channel activity(GO:1902259) |
| 0.5 | 5.5 | GO:0008627 | intrinsic apoptotic signaling pathway in response to osmotic stress(GO:0008627) |
| 0.5 | 4.0 | GO:0000160 | phosphorelay signal transduction system(GO:0000160) |
| 0.5 | 3.5 | GO:0006655 | phosphatidylglycerol biosynthetic process(GO:0006655) |
| 0.5 | 5.9 | GO:0002430 | complement receptor mediated signaling pathway(GO:0002430) |
| 0.5 | 4.4 | GO:0035457 | cellular response to interferon-alpha(GO:0035457) |
| 0.5 | 10.2 | GO:2000785 | regulation of autophagosome assembly(GO:2000785) |
| 0.5 | 49.0 | GO:0050911 | detection of chemical stimulus involved in sensory perception of smell(GO:0050911) |
| 0.5 | 4.3 | GO:1903142 | positive regulation of endothelial cell development(GO:1901552) positive regulation of establishment of endothelial barrier(GO:1903142) |
| 0.5 | 2.8 | GO:2000767 | positive regulation of cytoplasmic translation(GO:2000767) |
| 0.5 | 2.8 | GO:0034201 | response to oleic acid(GO:0034201) |
| 0.5 | 4.2 | GO:2001106 | regulation of Rho guanyl-nucleotide exchange factor activity(GO:2001106) |
| 0.5 | 1.8 | GO:0038194 | thyroid-stimulating hormone signaling pathway(GO:0038194) cellular response to glycoprotein(GO:1904588) cellular response to thyrotropin-releasing hormone(GO:1905229) |
| 0.5 | 2.7 | GO:0047484 | regulation of response to osmotic stress(GO:0047484) |
| 0.5 | 2.3 | GO:0030913 | paranodal junction assembly(GO:0030913) |
| 0.5 | 1.8 | GO:2000864 | estrogen secretion(GO:0035937) estradiol secretion(GO:0035938) regulation of estrogen secretion(GO:2000861) regulation of estradiol secretion(GO:2000864) |
| 0.4 | 4.9 | GO:0043152 | induction of bacterial agglutination(GO:0043152) |
| 0.4 | 15.4 | GO:0018149 | peptide cross-linking(GO:0018149) |
| 0.4 | 11.4 | GO:0045332 | lipid translocation(GO:0034204) phospholipid translocation(GO:0045332) |
| 0.4 | 3.1 | GO:0071360 | cellular response to exogenous dsRNA(GO:0071360) |
| 0.4 | 1.7 | GO:1904428 | negative regulation of tubulin deacetylation(GO:1904428) |
| 0.4 | 12.1 | GO:0016246 | RNA interference(GO:0016246) |
| 0.4 | 6.5 | GO:0030208 | dermatan sulfate biosynthetic process(GO:0030208) |
| 0.4 | 3.0 | GO:2001205 | negative regulation of osteoclast development(GO:2001205) |
| 0.4 | 72.2 | GO:0007156 | homophilic cell adhesion via plasma membrane adhesion molecules(GO:0007156) |
| 0.4 | 2.5 | GO:0002943 | tRNA dihydrouridine synthesis(GO:0002943) |
| 0.4 | 5.0 | GO:0048742 | regulation of skeletal muscle fiber development(GO:0048742) |
| 0.4 | 5.8 | GO:0035330 | regulation of hippo signaling(GO:0035330) |
| 0.4 | 2.5 | GO:0006701 | progesterone biosynthetic process(GO:0006701) |
| 0.4 | 3.7 | GO:0080182 | histone H3-K4 trimethylation(GO:0080182) |
| 0.4 | 4.5 | GO:0021740 | trigeminal sensory nucleus development(GO:0021730) principal sensory nucleus of trigeminal nerve development(GO:0021740) negative regulation of epithelial cell proliferation involved in lung morphogenesis(GO:2000795) |
| 0.4 | 3.7 | GO:0045039 | protein import into mitochondrial inner membrane(GO:0045039) |
| 0.4 | 6.4 | GO:0071257 | cellular response to electrical stimulus(GO:0071257) |
| 0.4 | 2.0 | GO:0031022 | nuclear migration along microfilament(GO:0031022) |
| 0.4 | 2.0 | GO:0046167 | glycerol-3-phosphate biosynthetic process(GO:0046167) |
| 0.4 | 4.3 | GO:0035845 | photoreceptor cell outer segment organization(GO:0035845) |
| 0.4 | 3.2 | GO:0070170 | regulation of tooth mineralization(GO:0070170) |
| 0.4 | 0.8 | GO:0010749 | regulation of nitric oxide mediated signal transduction(GO:0010749) negative regulation of nitric oxide mediated signal transduction(GO:0010751) |
| 0.4 | 7.4 | GO:0043651 | linoleic acid metabolic process(GO:0043651) |
| 0.4 | 4.3 | GO:1904469 | positive regulation of tumor necrosis factor secretion(GO:1904469) |
| 0.4 | 8.4 | GO:0015721 | bile acid and bile salt transport(GO:0015721) |
| 0.4 | 6.8 | GO:0019373 | epoxygenase P450 pathway(GO:0019373) |
| 0.4 | 1.1 | GO:0007525 | somatic muscle development(GO:0007525) |
| 0.4 | 2.6 | GO:0042908 | xenobiotic transport(GO:0042908) |
| 0.4 | 4.4 | GO:0015871 | choline transport(GO:0015871) |
| 0.4 | 4.0 | GO:0031053 | primary miRNA processing(GO:0031053) |
| 0.4 | 2.5 | GO:1990822 | regulation of arginine metabolic process(GO:0000821) basic amino acid transmembrane transport(GO:1990822) |
| 0.4 | 5.4 | GO:0007258 | JUN phosphorylation(GO:0007258) |
| 0.4 | 11.3 | GO:1903959 | regulation of anion transmembrane transport(GO:1903959) |
| 0.3 | 12.0 | GO:0021542 | dentate gyrus development(GO:0021542) |
| 0.3 | 2.7 | GO:0010898 | positive regulation of triglyceride catabolic process(GO:0010898) |
| 0.3 | 4.4 | GO:0031274 | positive regulation of pseudopodium assembly(GO:0031274) |
| 0.3 | 2.0 | GO:0072383 | plus-end-directed vesicle transport along microtubule(GO:0072383) |
| 0.3 | 6.8 | GO:0006907 | pinocytosis(GO:0006907) |
| 0.3 | 9.4 | GO:0006699 | bile acid biosynthetic process(GO:0006699) |
| 0.3 | 2.0 | GO:0022027 | interkinetic nuclear migration(GO:0022027) |
| 0.3 | 2.3 | GO:0033353 | S-adenosylmethionine cycle(GO:0033353) |
| 0.3 | 1.3 | GO:0060010 | Sertoli cell fate commitment(GO:0060010) |
| 0.3 | 3.6 | GO:0048251 | elastic fiber assembly(GO:0048251) |
| 0.3 | 3.9 | GO:0003351 | epithelial cilium movement(GO:0003351) |
| 0.3 | 4.2 | GO:1990573 | potassium ion import across plasma membrane(GO:1990573) |
| 0.3 | 3.5 | GO:0034219 | carbohydrate transmembrane transport(GO:0034219) |
| 0.3 | 4.4 | GO:0001778 | plasma membrane repair(GO:0001778) |
| 0.3 | 1.9 | GO:0007288 | sperm axoneme assembly(GO:0007288) |
| 0.3 | 2.8 | GO:2000427 | positive regulation of apoptotic cell clearance(GO:2000427) |
| 0.3 | 1.8 | GO:0001692 | histamine metabolic process(GO:0001692) histidine catabolic process(GO:0006548) imidazole-containing compound catabolic process(GO:0052805) |
| 0.3 | 7.7 | GO:0010569 | regulation of double-strand break repair via homologous recombination(GO:0010569) |
| 0.3 | 1.2 | GO:0032747 | interleukin-23 production(GO:0032627) regulation of interleukin-23 production(GO:0032667) positive regulation of interleukin-23 production(GO:0032747) |
| 0.3 | 1.5 | GO:0032571 | response to vitamin K(GO:0032571) chemokine (C-C motif) ligand 2 secretion(GO:0035926) regulation of chemokine (C-C motif) ligand 2 secretion(GO:1904207) positive regulation of chemokine (C-C motif) ligand 2 secretion(GO:1904209) |
| 0.3 | 11.0 | GO:0031102 | neuron projection regeneration(GO:0031102) |
| 0.3 | 3.6 | GO:0034505 | tooth mineralization(GO:0034505) |
| 0.3 | 3.9 | GO:0019227 | neuronal action potential propagation(GO:0019227) action potential propagation(GO:0098870) |
| 0.3 | 5.9 | GO:0046855 | phosphorylated carbohydrate dephosphorylation(GO:0046838) inositol phosphate dephosphorylation(GO:0046855) |
| 0.3 | 10.0 | GO:0045022 | early endosome to late endosome transport(GO:0045022) |
| 0.3 | 0.9 | GO:1905246 | regulation of choline O-acetyltransferase activity(GO:1902769) positive regulation of choline O-acetyltransferase activity(GO:1902771) negative regulation of tau-protein kinase activity(GO:1902948) positive regulation of early endosome to recycling endosome transport(GO:1902955) negative regulation of aspartic-type endopeptidase activity involved in amyloid precursor protein catabolic process(GO:1902960) negative regulation of neurofibrillary tangle assembly(GO:1902997) negative regulation of aspartic-type peptidase activity(GO:1905246) |
| 0.3 | 3.5 | GO:0002021 | response to dietary excess(GO:0002021) |
| 0.3 | 5.4 | GO:0002726 | positive regulation of T cell cytokine production(GO:0002726) |
| 0.3 | 0.9 | GO:0002025 | vasodilation by norepinephrine-epinephrine involved in regulation of systemic arterial blood pressure(GO:0002025) |
| 0.3 | 2.0 | GO:0032525 | somite rostral/caudal axis specification(GO:0032525) |
| 0.3 | 5.6 | GO:0031065 | positive regulation of histone deacetylation(GO:0031065) |
| 0.3 | 14.6 | GO:0006509 | membrane protein ectodomain proteolysis(GO:0006509) |
| 0.3 | 0.6 | GO:0050955 | thermoception(GO:0050955) |
| 0.3 | 1.9 | GO:0017196 | N-terminal peptidyl-methionine acetylation(GO:0017196) |
| 0.3 | 3.2 | GO:0048240 | sperm capacitation(GO:0048240) |
| 0.3 | 3.5 | GO:0051386 | regulation of neurotrophin TRK receptor signaling pathway(GO:0051386) |
| 0.3 | 3.2 | GO:0031665 | negative regulation of lipopolysaccharide-mediated signaling pathway(GO:0031665) |
| 0.3 | 4.2 | GO:0003334 | keratinocyte development(GO:0003334) |
| 0.3 | 11.1 | GO:0010107 | potassium ion import(GO:0010107) |
| 0.3 | 4.2 | GO:0034380 | high-density lipoprotein particle assembly(GO:0034380) |
| 0.3 | 0.8 | GO:0001812 | positive regulation of type I hypersensitivity(GO:0001812) |
| 0.3 | 3.2 | GO:0014809 | regulation of skeletal muscle contraction by regulation of release of sequestered calcium ion(GO:0014809) |
| 0.3 | 1.3 | GO:0050651 | dermatan sulfate proteoglycan biosynthetic process(GO:0050651) |
| 0.3 | 2.8 | GO:0043691 | reverse cholesterol transport(GO:0043691) |
| 0.3 | 6.2 | GO:2001269 | positive regulation of cysteine-type endopeptidase activity involved in apoptotic signaling pathway(GO:2001269) |
| 0.3 | 4.3 | GO:0060394 | negative regulation of pathway-restricted SMAD protein phosphorylation(GO:0060394) |
| 0.3 | 1.3 | GO:0090309 | positive regulation of methylation-dependent chromatin silencing(GO:0090309) |
| 0.3 | 5.1 | GO:0046033 | AMP metabolic process(GO:0046033) |
| 0.3 | 21.1 | GO:0051965 | positive regulation of synapse assembly(GO:0051965) |
| 0.3 | 9.1 | GO:0006693 | prostanoid metabolic process(GO:0006692) prostaglandin metabolic process(GO:0006693) |
| 0.3 | 4.0 | GO:0090231 | regulation of spindle checkpoint(GO:0090231) |
| 0.3 | 2.3 | GO:0016322 | neuron remodeling(GO:0016322) |
| 0.2 | 0.5 | GO:0002836 | positive regulation of response to tumor cell(GO:0002836) positive regulation of immune response to tumor cell(GO:0002839) |
| 0.2 | 4.4 | GO:0008210 | estrogen metabolic process(GO:0008210) |
| 0.2 | 13.7 | GO:0006953 | acute-phase response(GO:0006953) |
| 0.2 | 4.1 | GO:0003301 | physiological muscle hypertrophy(GO:0003298) physiological cardiac muscle hypertrophy(GO:0003301) cell growth involved in cardiac muscle cell development(GO:0061049) |
| 0.2 | 9.9 | GO:0043268 | positive regulation of potassium ion transport(GO:0043268) |
| 0.2 | 1.2 | GO:0002933 | lipid hydroxylation(GO:0002933) |
| 0.2 | 8.8 | GO:0000188 | inactivation of MAPK activity(GO:0000188) |
| 0.2 | 1.8 | GO:0006776 | vitamin A metabolic process(GO:0006776) |
| 0.2 | 3.4 | GO:0042572 | retinol metabolic process(GO:0042572) |
| 0.2 | 2.1 | GO:0036066 | protein O-linked fucosylation(GO:0036066) |
| 0.2 | 6.4 | GO:0072337 | modified amino acid transport(GO:0072337) |
| 0.2 | 5.8 | GO:0034035 | purine ribonucleoside bisphosphate metabolic process(GO:0034035) 3'-phosphoadenosine 5'-phosphosulfate metabolic process(GO:0050427) |
| 0.2 | 3.8 | GO:0006750 | glutathione biosynthetic process(GO:0006750) |
| 0.2 | 4.2 | GO:0042311 | vasodilation(GO:0042311) |
| 0.2 | 2.2 | GO:0034308 | primary alcohol metabolic process(GO:0034308) |
| 0.2 | 6.3 | GO:0030517 | negative regulation of axon extension(GO:0030517) |
| 0.2 | 7.6 | GO:1904893 | negative regulation of JAK-STAT cascade(GO:0046426) negative regulation of STAT cascade(GO:1904893) |
| 0.2 | 1.0 | GO:0038165 | oncostatin-M-mediated signaling pathway(GO:0038165) leukemia inhibitory factor signaling pathway(GO:0048861) |
| 0.2 | 1.2 | GO:0071105 | response to interleukin-11(GO:0071105) |
| 0.2 | 1.8 | GO:0043950 | positive regulation of cAMP-mediated signaling(GO:0043950) |
| 0.2 | 1.8 | GO:0001672 | regulation of chromatin assembly or disassembly(GO:0001672) |
| 0.2 | 3.3 | GO:0033141 | positive regulation of peptidyl-serine phosphorylation of STAT protein(GO:0033141) |
| 0.2 | 11.4 | GO:0061178 | regulation of insulin secretion involved in cellular response to glucose stimulus(GO:0061178) |
| 0.2 | 1.3 | GO:0022605 | ovarian cumulus expansion(GO:0001550) oogenesis stage(GO:0022605) fused antrum stage(GO:0048165) negative regulation of chondrocyte proliferation(GO:1902731) |
| 0.2 | 1.3 | GO:0032534 | regulation of microvillus assembly(GO:0032534) |
| 0.2 | 2.2 | GO:0014046 | dopamine secretion(GO:0014046) regulation of dopamine secretion(GO:0014059) |
| 0.2 | 3.9 | GO:0046069 | cGMP catabolic process(GO:0046069) |
| 0.2 | 2.0 | GO:0031915 | positive regulation of synaptic plasticity(GO:0031915) |
| 0.2 | 0.7 | GO:0043314 | negative regulation of neutrophil degranulation(GO:0043314) |
| 0.2 | 13.2 | GO:0030574 | collagen catabolic process(GO:0030574) |
| 0.2 | 4.8 | GO:0045898 | regulation of RNA polymerase II transcriptional preinitiation complex assembly(GO:0045898) |
| 0.2 | 3.1 | GO:0035455 | response to interferon-alpha(GO:0035455) |
| 0.2 | 7.5 | GO:1903146 | regulation of mitophagy(GO:1903146) |
| 0.2 | 2.5 | GO:0045821 | positive regulation of glycolytic process(GO:0045821) |
| 0.2 | 3.3 | GO:0043153 | entrainment of circadian clock by photoperiod(GO:0043153) |
| 0.1 | 3.1 | GO:0097120 | receptor localization to synapse(GO:0097120) |
| 0.1 | 0.6 | GO:0021860 | pyramidal neuron differentiation(GO:0021859) pyramidal neuron development(GO:0021860) |
| 0.1 | 2.7 | GO:0045662 | negative regulation of myoblast differentiation(GO:0045662) |
| 0.1 | 0.4 | GO:0050917 | sensory perception of umami taste(GO:0050917) |
| 0.1 | 0.4 | GO:0044313 | protein K6-linked deubiquitination(GO:0044313) |
| 0.1 | 1.0 | GO:0032689 | negative regulation of interferon-gamma production(GO:0032689) |
| 0.1 | 1.7 | GO:0060272 | embryonic skeletal joint morphogenesis(GO:0060272) |
| 0.1 | 1.3 | GO:1900103 | positive regulation of endoplasmic reticulum unfolded protein response(GO:1900103) |
| 0.1 | 1.8 | GO:0006349 | regulation of gene expression by genetic imprinting(GO:0006349) |
| 0.1 | 1.5 | GO:0030277 | maintenance of gastrointestinal epithelium(GO:0030277) |
| 0.1 | 2.8 | GO:0051281 | positive regulation of release of sequestered calcium ion into cytosol(GO:0051281) |
| 0.1 | 2.3 | GO:0002003 | angiotensin maturation(GO:0002003) |
| 0.1 | 3.7 | GO:0035987 | endodermal cell differentiation(GO:0035987) |
| 0.1 | 2.3 | GO:0008535 | respiratory chain complex IV assembly(GO:0008535) |
| 0.1 | 1.1 | GO:0036150 | phosphatidylserine acyl-chain remodeling(GO:0036150) |
| 0.1 | 1.8 | GO:0042340 | keratan sulfate catabolic process(GO:0042340) |
| 0.1 | 4.2 | GO:0046825 | regulation of protein export from nucleus(GO:0046825) |
| 0.1 | 0.3 | GO:1902951 | negative regulation of dendritic spine maintenance(GO:1902951) |
| 0.1 | 3.6 | GO:0048488 | synaptic vesicle endocytosis(GO:0048488) |
| 0.1 | 6.2 | GO:0032091 | negative regulation of protein binding(GO:0032091) |
| 0.1 | 3.2 | GO:0015695 | organic cation transport(GO:0015695) |
| 0.1 | 11.3 | GO:0050806 | positive regulation of synaptic transmission(GO:0050806) |
| 0.1 | 1.1 | GO:0032688 | negative regulation of interferon-beta production(GO:0032688) |
| 0.1 | 0.9 | GO:0002480 | antigen processing and presentation of exogenous peptide antigen via MHC class I, TAP-independent(GO:0002480) |
| 0.1 | 7.4 | GO:0035308 | negative regulation of protein dephosphorylation(GO:0035308) |
| 0.1 | 1.2 | GO:0015919 | peroxisomal membrane transport(GO:0015919) protein import into peroxisome membrane(GO:0045046) |
| 0.1 | 7.6 | GO:0045814 | negative regulation of gene expression, epigenetic(GO:0045814) |
| 0.1 | 3.8 | GO:0031640 | killing of cells of other organism(GO:0031640) disruption of cells of other organism(GO:0044364) |
| 0.1 | 0.2 | GO:0051835 | positive regulation of synapse structural plasticity(GO:0051835) |
| 0.1 | 2.1 | GO:0033344 | cholesterol efflux(GO:0033344) |
| 0.1 | 1.6 | GO:0005513 | detection of calcium ion(GO:0005513) |
| 0.1 | 1.1 | GO:0045793 | positive regulation of cell size(GO:0045793) |
| 0.1 | 3.6 | GO:0015701 | bicarbonate transport(GO:0015701) |
| 0.1 | 0.5 | GO:0010623 | programmed cell death involved in cell development(GO:0010623) |
| 0.1 | 4.2 | GO:0001895 | retina homeostasis(GO:0001895) |
| 0.1 | 0.8 | GO:0010457 | centriole-centriole cohesion(GO:0010457) |
| 0.1 | 3.5 | GO:0046677 | response to antibiotic(GO:0046677) |
| 0.1 | 1.7 | GO:0051016 | barbed-end actin filament capping(GO:0051016) |
| 0.1 | 2.7 | GO:0048008 | platelet-derived growth factor receptor signaling pathway(GO:0048008) |
| 0.1 | 3.5 | GO:1903779 | regulation of cardiac conduction(GO:1903779) |
| 0.1 | 2.3 | GO:0050855 | regulation of B cell receptor signaling pathway(GO:0050855) |
| 0.1 | 3.6 | GO:0007214 | gamma-aminobutyric acid signaling pathway(GO:0007214) |
| 0.1 | 2.6 | GO:0000083 | regulation of transcription involved in G1/S transition of mitotic cell cycle(GO:0000083) |
| 0.1 | 1.6 | GO:0014911 | positive regulation of smooth muscle cell migration(GO:0014911) |
| 0.1 | 7.2 | GO:0006937 | regulation of muscle contraction(GO:0006937) |
| 0.1 | 0.6 | GO:0006384 | transcription initiation from RNA polymerase III promoter(GO:0006384) |
| 0.1 | 4.6 | GO:0003279 | cardiac septum development(GO:0003279) |
| 0.1 | 0.3 | GO:0070294 | renal sodium ion transport(GO:0003096) renal sodium ion absorption(GO:0070294) |
| 0.1 | 0.5 | GO:0001865 | NK T cell differentiation(GO:0001865) |
| 0.1 | 6.3 | GO:0007586 | digestion(GO:0007586) |
| 0.1 | 0.4 | GO:2000576 | positive regulation of microtubule motor activity(GO:2000576) |
| 0.1 | 2.0 | GO:0007274 | neuromuscular synaptic transmission(GO:0007274) |
| 0.1 | 1.7 | GO:0008089 | anterograde axonal transport(GO:0008089) |
| 0.1 | 0.4 | GO:0002523 | leukocyte migration involved in inflammatory response(GO:0002523) |
| 0.1 | 3.1 | GO:0071349 | interleukin-12-mediated signaling pathway(GO:0035722) cellular response to interleukin-12(GO:0071349) |
| 0.1 | 1.9 | GO:0032922 | circadian regulation of gene expression(GO:0032922) |
| 0.1 | 0.9 | GO:0051482 | positive regulation of cytosolic calcium ion concentration involved in phospholipase C-activating G-protein coupled signaling pathway(GO:0051482) |
| 0.1 | 1.8 | GO:0001881 | receptor recycling(GO:0001881) |
| 0.0 | 0.4 | GO:0033189 | response to vitamin A(GO:0033189) |
| 0.0 | 1.1 | GO:0031116 | positive regulation of microtubule polymerization(GO:0031116) |
| 0.0 | 2.7 | GO:0007193 | adenylate cyclase-inhibiting G-protein coupled receptor signaling pathway(GO:0007193) |
| 0.0 | 0.8 | GO:0034656 | nucleobase-containing small molecule catabolic process(GO:0034656) |
| 0.0 | 0.8 | GO:0032411 | positive regulation of transporter activity(GO:0032411) |
| 0.0 | 0.2 | GO:0038016 | insulin receptor internalization(GO:0038016) |
| 0.0 | 2.2 | GO:1902476 | chloride transmembrane transport(GO:1902476) |
| 0.0 | 1.1 | GO:0016338 | calcium-independent cell-cell adhesion via plasma membrane cell-adhesion molecules(GO:0016338) |
| 0.0 | 0.4 | GO:0072592 | oxygen metabolic process(GO:0072592) |
| 0.0 | 0.2 | GO:0006127 | glycerophosphate shuttle(GO:0006127) |
| 0.0 | 0.4 | GO:0006020 | inositol metabolic process(GO:0006020) |
| 0.0 | 1.3 | GO:0007212 | dopamine receptor signaling pathway(GO:0007212) |
| 0.0 | 3.0 | GO:0090630 | activation of GTPase activity(GO:0090630) |
| 0.0 | 0.4 | GO:0010800 | positive regulation of peptidyl-threonine phosphorylation(GO:0010800) |
| 0.0 | 1.9 | GO:0006501 | C-terminal protein lipidation(GO:0006501) |
| 0.0 | 0.5 | GO:1901663 | ubiquinone metabolic process(GO:0006743) ubiquinone biosynthetic process(GO:0006744) quinone biosynthetic process(GO:1901663) |
| 0.0 | 1.9 | GO:0048754 | branching morphogenesis of an epithelial tube(GO:0048754) |
| 0.0 | 0.7 | GO:0050918 | positive chemotaxis(GO:0050918) |
| 0.0 | 1.0 | GO:0001676 | long-chain fatty acid metabolic process(GO:0001676) |
| 0.0 | 0.5 | GO:0032012 | regulation of ARF protein signal transduction(GO:0032012) |
| 0.0 | 0.2 | GO:0060334 | regulation of interferon-gamma-mediated signaling pathway(GO:0060334) |
| 0.0 | 0.2 | GO:0006957 | complement activation, alternative pathway(GO:0006957) |
| 0.0 | 0.4 | GO:0030317 | sperm motility(GO:0030317) |
| 0.0 | 2.2 | GO:0006869 | lipid transport(GO:0006869) |
| 0.0 | 0.0 | GO:0038043 | interleukin-5-mediated signaling pathway(GO:0038043) |
Gene overrepresentation in cellular component category:
| Log-likelihood per target | Total log-likelihood | Term | Description |
|---|---|---|---|
| 9.9 | 128.2 | GO:0098647 | collagen type VI trimer(GO:0005589) collagen beaded filament(GO:0098647) |
| 7.8 | 31.3 | GO:0031838 | haptoglobin-hemoglobin complex(GO:0031838) |
| 5.9 | 17.8 | GO:0097224 | sperm connecting piece(GO:0097224) |
| 5.3 | 84.9 | GO:0034366 | spherical high-density lipoprotein particle(GO:0034366) |
| 5.2 | 15.6 | GO:0070931 | Golgi-associated vesicle lumen(GO:0070931) |
| 4.2 | 16.8 | GO:0070695 | FHF complex(GO:0070695) |
| 3.3 | 9.9 | GO:0030485 | smooth muscle contractile fiber(GO:0030485) |
| 2.5 | 22.3 | GO:0072546 | ER membrane protein complex(GO:0072546) |
| 2.3 | 7.0 | GO:0030127 | COPII vesicle coat(GO:0030127) |
| 2.3 | 11.7 | GO:0097454 | Schwann cell microvillus(GO:0097454) |
| 2.3 | 9.1 | GO:0030895 | apolipoprotein B mRNA editing enzyme complex(GO:0030895) |
| 2.2 | 15.5 | GO:0098560 | cytoplasmic side of late endosome membrane(GO:0098560) |
| 1.8 | 7.2 | GO:0005899 | insulin receptor complex(GO:0005899) |
| 1.7 | 5.1 | GO:0043293 | apoptosome(GO:0043293) |
| 1.7 | 15.0 | GO:0046696 | lipopolysaccharide receptor complex(GO:0046696) |
| 1.7 | 8.3 | GO:0031673 | H zone(GO:0031673) |
| 1.6 | 6.6 | GO:0000801 | central element(GO:0000801) |
| 1.6 | 8.1 | GO:0030896 | checkpoint clamp complex(GO:0030896) |
| 1.5 | 5.8 | GO:0070044 | synaptobrevin 2-SNAP-25-syntaxin-1a-complexin I complex(GO:0070032) synaptobrevin 2-SNAP-25-syntaxin-1a complex(GO:0070044) |
| 1.4 | 4.2 | GO:0098536 | deuterosome(GO:0098536) |
| 1.4 | 5.6 | GO:0000308 | cytoplasmic cyclin-dependent protein kinase holoenzyme complex(GO:0000308) |
| 1.4 | 15.2 | GO:0098651 | basement membrane collagen trimer(GO:0098651) |
| 1.3 | 11.6 | GO:0032133 | chromosome passenger complex(GO:0032133) |
| 1.3 | 6.3 | GO:0043527 | tRNA methyltransferase complex(GO:0043527) |
| 1.2 | 8.6 | GO:0032021 | NELF complex(GO:0032021) |
| 1.2 | 34.1 | GO:0034364 | high-density lipoprotein particle(GO:0034364) |
| 1.1 | 7.8 | GO:0044352 | pinosome(GO:0044352) macropinosome(GO:0044354) |
| 1.1 | 4.4 | GO:0008275 | gamma-tubulin small complex(GO:0008275) |
| 1.1 | 15.4 | GO:0035253 | ciliary rootlet(GO:0035253) |
| 1.0 | 2.1 | GO:0045179 | apical cortex(GO:0045179) |
| 1.0 | 18.3 | GO:0033270 | paranode region of axon(GO:0033270) |
| 1.0 | 3.0 | GO:0033011 | perinuclear theca(GO:0033011) cytoskeletal calyx(GO:0033150) |
| 1.0 | 21.7 | GO:0031362 | anchored component of external side of plasma membrane(GO:0031362) |
| 1.0 | 3.0 | GO:1990597 | AIP1-IRE1 complex(GO:1990597) |
| 1.0 | 6.8 | GO:0044279 | other organism cell membrane(GO:0044218) other organism membrane(GO:0044279) |
| 1.0 | 2.9 | GO:0071821 | FANCM-MHF complex(GO:0071821) |
| 1.0 | 2.9 | GO:0072563 | endothelial microparticle(GO:0072563) |
| 1.0 | 9.6 | GO:0005614 | interstitial matrix(GO:0005614) |
| 0.9 | 13.8 | GO:0097433 | dense body(GO:0097433) |
| 0.9 | 4.5 | GO:0070847 | core mediator complex(GO:0070847) |
| 0.9 | 15.0 | GO:0000164 | protein phosphatase type 1 complex(GO:0000164) |
| 0.8 | 5.7 | GO:1990635 | proximal dendrite(GO:1990635) |
| 0.8 | 12.2 | GO:0030478 | actin cap(GO:0030478) |
| 0.7 | 13.5 | GO:0005922 | connexon complex(GO:0005922) |
| 0.7 | 4.5 | GO:0009331 | glycerol-3-phosphate dehydrogenase complex(GO:0009331) |
| 0.7 | 16.1 | GO:0001518 | voltage-gated sodium channel complex(GO:0001518) |
| 0.7 | 2.2 | GO:0000333 | telomerase catalytic core complex(GO:0000333) |
| 0.6 | 28.1 | GO:0032590 | dendrite membrane(GO:0032590) |
| 0.6 | 0.6 | GO:0044393 | microspike(GO:0044393) |
| 0.6 | 3.7 | GO:0042721 | mitochondrial inner membrane protein insertion complex(GO:0042721) |
| 0.6 | 1.8 | GO:0072536 | interleukin-23 receptor complex(GO:0072536) |
| 0.6 | 16.3 | GO:0031304 | intrinsic component of mitochondrial inner membrane(GO:0031304) integral component of mitochondrial inner membrane(GO:0031305) |
| 0.6 | 4.1 | GO:0033391 | chromatoid body(GO:0033391) |
| 0.5 | 3.8 | GO:1990452 | Parkin-FBXW7-Cul1 ubiquitin ligase complex(GO:1990452) |
| 0.5 | 5.4 | GO:0033268 | node of Ranvier(GO:0033268) |
| 0.5 | 13.2 | GO:0014731 | spectrin-associated cytoskeleton(GO:0014731) |
| 0.5 | 2.6 | GO:0016012 | sarcoglycan complex(GO:0016012) |
| 0.5 | 10.4 | GO:1990454 | L-type voltage-gated calcium channel complex(GO:1990454) |
| 0.5 | 2.1 | GO:0032144 | 4-aminobutyrate transaminase complex(GO:0032144) |
| 0.5 | 3.1 | GO:0097208 | alveolar lamellar body(GO:0097208) |
| 0.5 | 18.7 | GO:0031092 | platelet alpha granule membrane(GO:0031092) |
| 0.5 | 15.0 | GO:0044322 | endoplasmic reticulum quality control compartment(GO:0044322) |
| 0.5 | 6.0 | GO:0005921 | gap junction(GO:0005921) |
| 0.5 | 52.6 | GO:0031091 | platelet alpha granule(GO:0031091) |
| 0.4 | 8.5 | GO:0097440 | apical dendrite(GO:0097440) |
| 0.4 | 8.0 | GO:0097225 | sperm midpiece(GO:0097225) |
| 0.4 | 2.2 | GO:0045293 | MIS complex(GO:0036396) mRNA editing complex(GO:0045293) |
| 0.4 | 7.7 | GO:0000242 | pericentriolar material(GO:0000242) |
| 0.4 | 4.5 | GO:0044300 | cerebellar mossy fiber(GO:0044300) |
| 0.4 | 2.8 | GO:0045252 | oxoglutarate dehydrogenase complex(GO:0045252) |
| 0.4 | 3.6 | GO:0071953 | elastic fiber(GO:0071953) |
| 0.4 | 149.9 | GO:0005578 | proteinaceous extracellular matrix(GO:0005578) |
| 0.4 | 3.8 | GO:0046581 | intercellular canaliculus(GO:0046581) |
| 0.4 | 5.6 | GO:0005916 | fascia adherens(GO:0005916) |
| 0.4 | 16.2 | GO:0001533 | cornified envelope(GO:0001533) |
| 0.3 | 11.5 | GO:0030673 | axolemma(GO:0030673) |
| 0.3 | 3.1 | GO:0060077 | inhibitory synapse(GO:0060077) |
| 0.3 | 1.7 | GO:0036128 | CatSper complex(GO:0036128) |
| 0.3 | 2.0 | GO:0070554 | synaptobrevin 2-SNAP-25-syntaxin-1a-complexin II complex(GO:0070033) synaptobrevin 2-SNAP-25-syntaxin-3-complexin complex(GO:0070554) |
| 0.3 | 1.3 | GO:1990578 | perinuclear endoplasmic reticulum membrane(GO:1990578) |
| 0.3 | 3.2 | GO:0000439 | core TFIIH complex(GO:0000439) |
| 0.3 | 2.9 | GO:0044294 | dendritic growth cone(GO:0044294) |
| 0.3 | 7.3 | GO:0002080 | acrosomal membrane(GO:0002080) |
| 0.3 | 1.9 | GO:0002177 | manchette(GO:0002177) |
| 0.3 | 10.8 | GO:0016581 | NuRD complex(GO:0016581) CHD-type complex(GO:0090545) |
| 0.3 | 1.8 | GO:0043203 | axon hillock(GO:0043203) |
| 0.3 | 8.6 | GO:0005892 | acetylcholine-gated channel complex(GO:0005892) |
| 0.3 | 2.6 | GO:0000813 | ESCRT I complex(GO:0000813) |
| 0.3 | 6.8 | GO:0090533 | cation-transporting ATPase complex(GO:0090533) |
| 0.3 | 12.5 | GO:0048786 | presynaptic active zone(GO:0048786) |
| 0.3 | 3.2 | GO:0016013 | syntrophin complex(GO:0016013) |
| 0.3 | 12.1 | GO:0097546 | ciliary base(GO:0097546) |
| 0.3 | 2.1 | GO:0016342 | catenin complex(GO:0016342) |
| 0.3 | 5.9 | GO:0034451 | centriolar satellite(GO:0034451) |
| 0.3 | 24.2 | GO:0005791 | rough endoplasmic reticulum(GO:0005791) |
| 0.3 | 16.4 | GO:0001669 | acrosomal vesicle(GO:0001669) |
| 0.2 | 4.7 | GO:0036038 | MKS complex(GO:0036038) |
| 0.2 | 32.3 | GO:0034705 | voltage-gated potassium channel complex(GO:0008076) potassium channel complex(GO:0034705) |
| 0.2 | 3.4 | GO:0031083 | BLOC-1 complex(GO:0031083) |
| 0.2 | 3.8 | GO:0042589 | zymogen granule membrane(GO:0042589) |
| 0.2 | 1.2 | GO:0031313 | extrinsic component of endosome membrane(GO:0031313) |
| 0.2 | 2.8 | GO:0042788 | polysomal ribosome(GO:0042788) |
| 0.2 | 17.0 | GO:0036064 | ciliary basal body(GO:0036064) |
| 0.2 | 6.0 | GO:0035327 | transcriptionally active chromatin(GO:0035327) |
| 0.2 | 14.6 | GO:0005881 | cytoplasmic microtubule(GO:0005881) |
| 0.2 | 2.0 | GO:0034992 | microtubule organizing center attachment site(GO:0034992) LINC complex(GO:0034993) |
| 0.2 | 2.4 | GO:0008024 | cyclin/CDK positive transcription elongation factor complex(GO:0008024) |
| 0.2 | 2.3 | GO:0030870 | Mre11 complex(GO:0030870) |
| 0.2 | 28.1 | GO:0030426 | growth cone(GO:0030426) |
| 0.2 | 2.7 | GO:0035371 | microtubule plus-end(GO:0035371) |
| 0.2 | 59.7 | GO:0060076 | excitatory synapse(GO:0060076) |
| 0.2 | 3.5 | GO:0000786 | nucleosome(GO:0000786) |
| 0.2 | 2.7 | GO:0031462 | Cul2-RING ubiquitin ligase complex(GO:0031462) |
| 0.2 | 1.7 | GO:0030427 | site of polarized growth(GO:0030427) |
| 0.2 | 23.1 | GO:0016324 | apical plasma membrane(GO:0016324) |
| 0.2 | 2.3 | GO:0030008 | TRAPP complex(GO:0030008) |
| 0.2 | 0.9 | GO:0031905 | early endosome lumen(GO:0031905) |
| 0.2 | 0.7 | GO:0042406 | extrinsic component of endoplasmic reticulum membrane(GO:0042406) |
| 0.2 | 1.8 | GO:0005638 | lamin filament(GO:0005638) |
| 0.2 | 1.6 | GO:0043020 | NADPH oxidase complex(GO:0043020) |
| 0.1 | 9.7 | GO:0035580 | specific granule lumen(GO:0035580) |
| 0.1 | 4.6 | GO:1902711 | GABA-A receptor complex(GO:1902711) |
| 0.1 | 0.7 | GO:0098554 | cytoplasmic side of endoplasmic reticulum membrane(GO:0098554) |
| 0.1 | 3.1 | GO:0005581 | collagen trimer(GO:0005581) |
| 0.1 | 23.1 | GO:0030424 | axon(GO:0030424) |
| 0.1 | 11.1 | GO:0045211 | postsynaptic membrane(GO:0045211) |
| 0.1 | 1.8 | GO:0009897 | external side of plasma membrane(GO:0009897) |
| 0.1 | 0.7 | GO:0036056 | filtration diaphragm(GO:0036056) slit diaphragm(GO:0036057) |
| 0.1 | 2.3 | GO:0001891 | phagocytic cup(GO:0001891) |
| 0.1 | 4.4 | GO:0030315 | T-tubule(GO:0030315) |
| 0.1 | 4.3 | GO:0005859 | muscle myosin complex(GO:0005859) |
| 0.1 | 1.1 | GO:0033256 | I-kappaB/NF-kappaB complex(GO:0033256) |
| 0.1 | 1.3 | GO:1990712 | HFE-transferrin receptor complex(GO:1990712) |
| 0.1 | 6.5 | GO:0005834 | heterotrimeric G-protein complex(GO:0005834) |
| 0.1 | 10.7 | GO:0005923 | bicellular tight junction(GO:0005923) |
| 0.1 | 3.4 | GO:0016235 | aggresome(GO:0016235) |
| 0.1 | 4.7 | GO:0005801 | cis-Golgi network(GO:0005801) |
| 0.1 | 1.6 | GO:0033116 | endoplasmic reticulum-Golgi intermediate compartment membrane(GO:0033116) |
| 0.1 | 8.5 | GO:0044306 | neuron projection terminus(GO:0044306) |
| 0.1 | 3.5 | GO:0008305 | integrin complex(GO:0008305) |
| 0.1 | 2.6 | GO:0030173 | integral component of Golgi membrane(GO:0030173) |
| 0.1 | 2.8 | GO:0045177 | apical part of cell(GO:0045177) |
| 0.1 | 6.3 | GO:0005776 | autophagosome(GO:0005776) |
| 0.1 | 5.9 | GO:0031514 | motile cilium(GO:0031514) |
| 0.1 | 16.3 | GO:0016323 | basolateral plasma membrane(GO:0016323) |
| 0.1 | 0.3 | GO:0005927 | muscle tendon junction(GO:0005927) |
| 0.1 | 11.1 | GO:0005802 | trans-Golgi network(GO:0005802) |
| 0.1 | 0.9 | GO:0034362 | low-density lipoprotein particle(GO:0034362) |
| 0.1 | 1.4 | GO:0016529 | sarcoplasmic reticulum(GO:0016529) |
| 0.1 | 7.3 | GO:0005770 | late endosome(GO:0005770) |
| 0.1 | 2.7 | GO:0005903 | brush border(GO:0005903) |
| 0.1 | 1.9 | GO:0005795 | Golgi stack(GO:0005795) |
| 0.1 | 0.7 | GO:0031235 | intrinsic component of the cytoplasmic side of the plasma membrane(GO:0031235) |
| 0.1 | 0.9 | GO:0016281 | eukaryotic translation initiation factor 4F complex(GO:0016281) |
| 0.1 | 0.7 | GO:0008385 | IkappaB kinase complex(GO:0008385) |
| 0.0 | 2.8 | GO:0005796 | Golgi lumen(GO:0005796) |
| 0.0 | 1.1 | GO:0005719 | nuclear euchromatin(GO:0005719) |
| 0.0 | 7.0 | GO:0072562 | blood microparticle(GO:0072562) |
| 0.0 | 0.4 | GO:0097427 | microtubule bundle(GO:0097427) |
| 0.0 | 1.2 | GO:1902562 | NuA4 histone acetyltransferase complex(GO:0035267) H4/H2A histone acetyltransferase complex(GO:0043189) H4 histone acetyltransferase complex(GO:1902562) |
| 0.0 | 0.5 | GO:0031906 | late endosome lumen(GO:0031906) |
| 0.0 | 1.2 | GO:0005779 | integral component of peroxisomal membrane(GO:0005779) intrinsic component of peroxisomal membrane(GO:0031231) |
| 0.0 | 1.6 | GO:0005891 | voltage-gated calcium channel complex(GO:0005891) |
| 0.0 | 59.0 | GO:0031226 | intrinsic component of plasma membrane(GO:0031226) |
| 0.0 | 8.1 | GO:0005789 | endoplasmic reticulum membrane(GO:0005789) |
| 0.0 | 2.4 | GO:0005913 | cell-cell adherens junction(GO:0005913) |
| 0.0 | 0.4 | GO:0034707 | chloride channel complex(GO:0034707) |
| 0.0 | 3.8 | GO:0005788 | endoplasmic reticulum lumen(GO:0005788) |
| 0.0 | 0.4 | GO:0031588 | nucleotide-activated protein kinase complex(GO:0031588) |
| 0.0 | 1.7 | GO:0101003 | ficolin-1-rich granule membrane(GO:0101003) |
| 0.0 | 5.4 | GO:0005741 | mitochondrial outer membrane(GO:0005741) |
| 0.0 | 1.9 | GO:0031225 | anchored component of membrane(GO:0031225) |
| 0.0 | 56.5 | GO:0031224 | intrinsic component of membrane(GO:0031224) |
| 0.0 | 0.7 | GO:0032154 | cleavage furrow(GO:0032154) cell surface furrow(GO:0097610) |
Gene overrepresentation in molecular function category:
| Log-likelihood per target | Total log-likelihood | Term | Description |
|---|---|---|---|
| 6.8 | 27.2 | GO:0016434 | rRNA (cytosine) methyltransferase activity(GO:0016434) |
| 6.6 | 26.3 | GO:0008798 | beta-aspartyl-peptidase activity(GO:0008798) |
| 6.5 | 25.8 | GO:0004667 | prostaglandin-D synthase activity(GO:0004667) |
| 6.0 | 29.9 | GO:0047086 | phenanthrene 9,10-monooxygenase activity(GO:0018636) ketosteroid monooxygenase activity(GO:0047086) trans-1,2-dihydrobenzene-1,2-diol dehydrogenase activity(GO:0047115) |
| 5.5 | 16.5 | GO:0002113 | interleukin-33 binding(GO:0002113) |
| 5.4 | 21.5 | GO:0034353 | RNA pyrophosphohydrolase activity(GO:0034353) |
| 5.2 | 36.2 | GO:0030492 | hemoglobin binding(GO:0030492) |
| 5.2 | 15.5 | GO:0001596 | angiotensin type I receptor activity(GO:0001596) |
| 5.0 | 15.0 | GO:0005137 | interleukin-5 receptor binding(GO:0005137) |
| 3.7 | 14.7 | GO:0016019 | peptidoglycan receptor activity(GO:0016019) |
| 3.3 | 9.9 | GO:0070052 | collagen V binding(GO:0070052) |
| 3.2 | 74.3 | GO:0051787 | misfolded protein binding(GO:0051787) |
| 3.1 | 24.6 | GO:0004024 | alcohol dehydrogenase activity, zinc-dependent(GO:0004024) |
| 2.9 | 11.4 | GO:0005006 | epidermal growth factor-activated receptor activity(GO:0005006) |
| 2.8 | 14.2 | GO:0047045 | testosterone 17-beta-dehydrogenase (NADP+) activity(GO:0047045) |
| 2.7 | 21.5 | GO:0008970 | phosphatidylcholine 1-acylhydrolase activity(GO:0008970) |
| 2.7 | 228.7 | GO:0050840 | extracellular matrix binding(GO:0050840) |
| 2.6 | 12.9 | GO:0004447 | iodide peroxidase activity(GO:0004447) |
| 2.5 | 7.4 | GO:0008336 | gamma-butyrobetaine dioxygenase activity(GO:0008336) |
| 2.5 | 29.7 | GO:0008430 | selenium binding(GO:0008430) |
| 2.5 | 9.8 | GO:0042132 | fructose 1,6-bisphosphate 1-phosphatase activity(GO:0042132) |
| 2.4 | 45.2 | GO:0031702 | type 1 angiotensin receptor binding(GO:0031702) |
| 2.4 | 14.2 | GO:0042392 | sphingosine-1-phosphate phosphatase activity(GO:0042392) |
| 2.3 | 7.0 | GO:0004611 | phosphoenolpyruvate carboxykinase activity(GO:0004611) phosphoenolpyruvate carboxykinase (GTP) activity(GO:0004613) |
| 2.3 | 32.6 | GO:0015501 | glutamate:sodium symporter activity(GO:0015501) |
| 2.3 | 9.0 | GO:0031716 | calcitonin receptor binding(GO:0031716) |
| 2.2 | 13.5 | GO:0086075 | gap junction channel activity involved in cardiac conduction electrical coupling(GO:0086075) |
| 2.2 | 10.9 | GO:0047374 | sterol esterase activity(GO:0004771) methylumbelliferyl-acetate deacetylase activity(GO:0047374) |
| 2.2 | 6.5 | GO:0047757 | chondroitin-glucuronate 5-epimerase activity(GO:0047757) |
| 2.1 | 10.6 | GO:1903135 | cupric ion binding(GO:1903135) |
| 2.1 | 8.4 | GO:0061714 | folic acid receptor activity(GO:0061714) |
| 2.1 | 8.4 | GO:0008508 | bile acid:sodium symporter activity(GO:0008508) |
| 1.9 | 7.7 | GO:0016426 | tRNA (adenine) methyltransferase activity(GO:0016426) |
| 1.9 | 5.7 | GO:0016422 | mRNA (2'-O-methyladenosine-N6-)-methyltransferase activity(GO:0016422) |
| 1.9 | 18.8 | GO:0005549 | odorant binding(GO:0005549) |
| 1.9 | 16.9 | GO:0060228 | phosphatidylcholine-sterol O-acyltransferase activator activity(GO:0060228) |
| 1.8 | 17.8 | GO:0032027 | myosin light chain binding(GO:0032027) |
| 1.7 | 12.0 | GO:0035368 | selenocysteine insertion sequence binding(GO:0035368) |
| 1.6 | 24.3 | GO:0016813 | hydrolase activity, acting on carbon-nitrogen (but not peptide) bonds, in linear amidines(GO:0016813) |
| 1.5 | 12.2 | GO:0086006 | voltage-gated sodium channel activity involved in cardiac muscle cell action potential(GO:0086006) |
| 1.5 | 4.5 | GO:0031727 | CCR2 chemokine receptor binding(GO:0031727) |
| 1.5 | 9.0 | GO:0004882 | androgen receptor activity(GO:0004882) |
| 1.4 | 16.8 | GO:0008020 | G-protein coupled photoreceptor activity(GO:0008020) |
| 1.4 | 1.4 | GO:0047023 | androsterone dehydrogenase activity(GO:0047023) |
| 1.4 | 4.1 | GO:0061609 | fructose-1-phosphate aldolase activity(GO:0061609) |
| 1.3 | 5.2 | GO:0061752 | telomeric repeat-containing RNA binding(GO:0061752) |
| 1.3 | 11.6 | GO:0035174 | histone serine kinase activity(GO:0035174) |
| 1.2 | 4.9 | GO:0022850 | serotonin-gated cation channel activity(GO:0022850) |
| 1.2 | 3.6 | GO:0005150 | interleukin-1, Type I receptor binding(GO:0005150) |
| 1.2 | 44.4 | GO:0015020 | glucuronosyltransferase activity(GO:0015020) |
| 1.1 | 11.4 | GO:0004321 | fatty-acyl-CoA synthase activity(GO:0004321) |
| 1.1 | 3.4 | GO:0046848 | hydroxyapatite binding(GO:0046848) |
| 1.1 | 4.4 | GO:0015220 | choline transmembrane transporter activity(GO:0015220) |
| 1.1 | 6.6 | GO:0016433 | rRNA (adenine-N6,N6-)-dimethyltransferase activity(GO:0000179) rRNA (adenine) methyltransferase activity(GO:0016433) |
| 1.1 | 4.4 | GO:0052812 | phosphatidylinositol-3,4-bisphosphate 5-kinase activity(GO:0052812) |
| 1.1 | 20.1 | GO:0008391 | arachidonic acid monooxygenase activity(GO:0008391) arachidonic acid epoxygenase activity(GO:0008392) |
| 1.1 | 14.8 | GO:0086080 | protein binding involved in heterotypic cell-cell adhesion(GO:0086080) |
| 1.1 | 6.3 | GO:0038062 | protein tyrosine kinase collagen receptor activity(GO:0038062) |
| 1.0 | 4.1 | GO:0042030 | ATPase inhibitor activity(GO:0042030) |
| 1.0 | 29.9 | GO:0005355 | glucose transmembrane transporter activity(GO:0005355) |
| 1.0 | 6.2 | GO:0016812 | hydrolase activity, acting on carbon-nitrogen (but not peptide) bonds, in cyclic amides(GO:0016812) |
| 1.0 | 5.1 | GO:0046899 | nucleoside triphosphate adenylate kinase activity(GO:0046899) |
| 1.0 | 10.8 | GO:0001135 | transcription factor activity, RNA polymerase II transcription factor recruiting(GO:0001135) |
| 1.0 | 5.7 | GO:0031735 | CCR10 chemokine receptor binding(GO:0031735) |
| 0.9 | 9.4 | GO:0008131 | primary amine oxidase activity(GO:0008131) |
| 0.9 | 6.4 | GO:0016714 | oxidoreductase activity, acting on paired donors, with incorporation or reduction of molecular oxygen, reduced pteridine as one donor, and incorporation of one atom of oxygen(GO:0016714) |
| 0.9 | 3.5 | GO:0004142 | diacylglycerol cholinephosphotransferase activity(GO:0004142) |
| 0.8 | 5.9 | GO:0048039 | ubiquinone binding(GO:0048039) |
| 0.8 | 2.5 | GO:1990430 | extracellular matrix protein binding(GO:1990430) |
| 0.8 | 2.5 | GO:0046577 | long-chain-alcohol oxidase activity(GO:0046577) |
| 0.8 | 10.4 | GO:0086056 | voltage-gated calcium channel activity involved in AV node cell action potential(GO:0086056) |
| 0.8 | 4.0 | GO:0000155 | phosphorelay sensor kinase activity(GO:0000155) |
| 0.8 | 12.8 | GO:0016918 | retinal binding(GO:0016918) |
| 0.7 | 3.0 | GO:0050473 | arachidonate 15-lipoxygenase activity(GO:0050473) |
| 0.7 | 5.9 | GO:0005534 | galactose binding(GO:0005534) |
| 0.7 | 10.2 | GO:0047372 | acylglycerol lipase activity(GO:0047372) |
| 0.7 | 3.6 | GO:0097603 | temperature-gated ion channel activity(GO:0097603) |
| 0.7 | 2.9 | GO:0004348 | glucosylceramidase activity(GO:0004348) |
| 0.7 | 10.1 | GO:0005078 | MAP-kinase scaffold activity(GO:0005078) |
| 0.7 | 3.6 | GO:0030109 | HLA-B specific inhibitory MHC class I receptor activity(GO:0030109) |
| 0.7 | 3.6 | GO:0016647 | oxidoreductase activity, acting on the CH-NH group of donors, oxygen as acceptor(GO:0016647) |
| 0.7 | 14.2 | GO:0017136 | NAD-dependent histone deacetylase activity(GO:0017136) |
| 0.7 | 6.3 | GO:0015272 | ATP-activated inward rectifier potassium channel activity(GO:0015272) |
| 0.7 | 3.4 | GO:0004045 | aminoacyl-tRNA hydrolase activity(GO:0004045) |
| 0.7 | 2.7 | GO:1902122 | chenodeoxycholic acid binding(GO:1902122) |
| 0.7 | 9.5 | GO:0004653 | polypeptide N-acetylgalactosaminyltransferase activity(GO:0004653) |
| 0.7 | 1.3 | GO:0004104 | cholinesterase activity(GO:0004104) |
| 0.7 | 4.0 | GO:0032296 | ribonuclease III activity(GO:0004525) double-stranded RNA-specific ribonuclease activity(GO:0032296) |
| 0.6 | 15.7 | GO:0005242 | inward rectifier potassium channel activity(GO:0005242) |
| 0.6 | 17.5 | GO:0005521 | lamin binding(GO:0005521) |
| 0.6 | 17.3 | GO:0004435 | phosphatidylinositol phospholipase C activity(GO:0004435) |
| 0.6 | 11.7 | GO:0050811 | GABA receptor binding(GO:0050811) |
| 0.6 | 3.6 | GO:0030021 | extracellular matrix structural constituent conferring compression resistance(GO:0030021) structural constituent of tooth enamel(GO:0030345) |
| 0.6 | 1.8 | GO:0042020 | interleukin-23 binding(GO:0042019) interleukin-23 receptor activity(GO:0042020) |
| 0.6 | 4.2 | GO:0004445 | inositol-polyphosphate 5-phosphatase activity(GO:0004445) |
| 0.6 | 3.5 | GO:0004489 | methylenetetrahydrofolate reductase (NAD(P)H) activity(GO:0004489) |
| 0.6 | 4.0 | GO:0050294 | steroid sulfotransferase activity(GO:0050294) |
| 0.6 | 2.8 | GO:0004792 | thiosulfate sulfurtransferase activity(GO:0004792) |
| 0.6 | 2.8 | GO:0004591 | oxoglutarate dehydrogenase (succinyl-transferring) activity(GO:0004591) |
| 0.5 | 6.0 | GO:0004568 | chitinase activity(GO:0004568) chitin binding(GO:0008061) |
| 0.5 | 4.3 | GO:0044547 | DNA topoisomerase binding(GO:0044547) |
| 0.5 | 2.2 | GO:0019770 | IgG receptor activity(GO:0019770) |
| 0.5 | 11.3 | GO:0005247 | voltage-gated chloride channel activity(GO:0005247) |
| 0.5 | 5.8 | GO:0043008 | ATP-dependent protein binding(GO:0043008) |
| 0.5 | 5.2 | GO:0051425 | PTB domain binding(GO:0051425) |
| 0.5 | 2.1 | GO:0047298 | 4-aminobutyrate transaminase activity(GO:0003867) succinate-semialdehyde dehydrogenase binding(GO:0032145) (S)-3-amino-2-methylpropionate transaminase activity(GO:0047298) |
| 0.5 | 2.0 | GO:0004906 | interferon-gamma receptor activity(GO:0004906) |
| 0.5 | 2.5 | GO:0004365 | glyceraldehyde-3-phosphate dehydrogenase (NAD+) (phosphorylating) activity(GO:0004365) glyceraldehyde-3-phosphate dehydrogenase (NAD(P)+) (phosphorylating) activity(GO:0043891) |
| 0.5 | 5.9 | GO:0004875 | complement receptor activity(GO:0004875) |
| 0.5 | 5.8 | GO:0004062 | aryl sulfotransferase activity(GO:0004062) |
| 0.5 | 2.9 | GO:0017040 | ceramidase activity(GO:0017040) |
| 0.5 | 1.9 | GO:0017159 | pantetheine hydrolase activity(GO:0017159) |
| 0.5 | 1.5 | GO:0017129 | triglyceride binding(GO:0017129) |
| 0.5 | 1.9 | GO:0034041 | sterol-transporting ATPase activity(GO:0034041) |
| 0.5 | 1.4 | GO:0031731 | CCR6 chemokine receptor binding(GO:0031731) |
| 0.5 | 14.4 | GO:0031418 | L-ascorbic acid binding(GO:0031418) |
| 0.5 | 8.8 | GO:0043395 | heparan sulfate proteoglycan binding(GO:0043395) |
| 0.5 | 6.4 | GO:0004716 | receptor signaling protein tyrosine kinase activity(GO:0004716) |
| 0.5 | 16.7 | GO:0042056 | chemoattractant activity(GO:0042056) |
| 0.5 | 15.8 | GO:0017075 | syntaxin-1 binding(GO:0017075) |
| 0.4 | 11.7 | GO:0015248 | sterol transporter activity(GO:0015248) |
| 0.4 | 1.8 | GO:0048248 | CXCR3 chemokine receptor binding(GO:0048248) |
| 0.4 | 2.2 | GO:0047273 | galactosylgalactosylglucosylceramide beta-D-acetylgalactosaminyltransferase activity(GO:0047273) |
| 0.4 | 13.2 | GO:0004602 | glutathione peroxidase activity(GO:0004602) |
| 0.4 | 11.0 | GO:0043325 | phosphatidylinositol-3,4-bisphosphate binding(GO:0043325) |
| 0.4 | 3.9 | GO:0047144 | 2-acylglycerol-3-phosphate O-acyltransferase activity(GO:0047144) |
| 0.4 | 11.4 | GO:0004012 | phospholipid-translocating ATPase activity(GO:0004012) |
| 0.4 | 22.6 | GO:0005080 | protein kinase C binding(GO:0005080) |
| 0.4 | 4.3 | GO:0005221 | intracellular cyclic nucleotide activated cation channel activity(GO:0005221) cyclic nucleotide-gated ion channel activity(GO:0043855) |
| 0.4 | 2.6 | GO:0018479 | benzaldehyde dehydrogenase (NAD+) activity(GO:0018479) |
| 0.4 | 5.1 | GO:0005007 | fibroblast growth factor-activated receptor activity(GO:0005007) |
| 0.4 | 2.5 | GO:0017150 | tRNA dihydrouridine synthase activity(GO:0017150) |
| 0.4 | 4.2 | GO:0070181 | small ribosomal subunit rRNA binding(GO:0070181) |
| 0.4 | 9.9 | GO:0005248 | voltage-gated sodium channel activity(GO:0005248) voltage-gated ion channel activity involved in regulation of postsynaptic membrane potential(GO:1905030) |
| 0.4 | 2.5 | GO:0001042 | RNA polymerase I core binding(GO:0001042) |
| 0.4 | 5.2 | GO:0031681 | G-protein beta-subunit binding(GO:0031681) |
| 0.4 | 1.6 | GO:0019826 | oxygen sensor activity(GO:0019826) |
| 0.4 | 2.0 | GO:0004370 | glycerol kinase activity(GO:0004370) |
| 0.4 | 12.9 | GO:0070182 | DNA polymerase binding(GO:0070182) |
| 0.4 | 2.3 | GO:0051880 | G-quadruplex DNA binding(GO:0051880) |
| 0.4 | 3.1 | GO:0005087 | Ran guanyl-nucleotide exchange factor activity(GO:0005087) |
| 0.4 | 2.3 | GO:0004013 | adenosylhomocysteinase activity(GO:0004013) trialkylsulfonium hydrolase activity(GO:0016802) |
| 0.4 | 4.2 | GO:0004691 | cAMP-dependent protein kinase activity(GO:0004691) |
| 0.4 | 5.3 | GO:0045159 | myosin II binding(GO:0045159) |
| 0.4 | 4.1 | GO:0019957 | C-C chemokine binding(GO:0019957) |
| 0.4 | 3.0 | GO:0001875 | lipopolysaccharide receptor activity(GO:0001875) |
| 0.4 | 8.8 | GO:0001965 | G-protein alpha-subunit binding(GO:0001965) |
| 0.4 | 1.8 | GO:0034648 | histone demethylase activity (H3-trimethyl-K4 specific)(GO:0034647) histone demethylase activity (H3-dimethyl-K4 specific)(GO:0034648) |
| 0.4 | 9.9 | GO:0005104 | fibroblast growth factor receptor binding(GO:0005104) |
| 0.4 | 15.2 | GO:0046875 | ephrin receptor binding(GO:0046875) |
| 0.3 | 2.8 | GO:0003726 | double-stranded RNA adenosine deaminase activity(GO:0003726) |
| 0.3 | 1.0 | GO:0004923 | leukemia inhibitory factor receptor activity(GO:0004923) |
| 0.3 | 8.3 | GO:0051010 | microtubule plus-end binding(GO:0051010) |
| 0.3 | 1.3 | GO:0030976 | thiamine pyrophosphate binding(GO:0030976) |
| 0.3 | 2.3 | GO:0016641 | oxidoreductase activity, acting on the CH-NH2 group of donors, oxygen as acceptor(GO:0016641) |
| 0.3 | 1.3 | GO:0005168 | neurotrophin TRKA receptor binding(GO:0005168) |
| 0.3 | 30.1 | GO:0004984 | olfactory receptor activity(GO:0004984) |
| 0.3 | 3.8 | GO:0097027 | ubiquitin-protein transferase activator activity(GO:0097027) |
| 0.3 | 6.4 | GO:0072349 | modified amino acid transmembrane transporter activity(GO:0072349) |
| 0.3 | 3.8 | GO:0015125 | bile acid transmembrane transporter activity(GO:0015125) |
| 0.3 | 6.9 | GO:0005251 | delayed rectifier potassium channel activity(GO:0005251) |
| 0.3 | 5.6 | GO:0035925 | mRNA 3'-UTR AU-rich region binding(GO:0035925) |
| 0.3 | 2.4 | GO:1990405 | protein antigen binding(GO:1990405) |
| 0.3 | 2.1 | GO:0035035 | histone acetyltransferase binding(GO:0035035) |
| 0.3 | 2.6 | GO:0016783 | sulfurtransferase activity(GO:0016783) |
| 0.3 | 1.4 | GO:0043546 | molybdopterin cofactor binding(GO:0043546) |
| 0.3 | 15.8 | GO:0005544 | calcium-dependent phospholipid binding(GO:0005544) |
| 0.3 | 4.5 | GO:0004551 | nucleotide diphosphatase activity(GO:0004551) |
| 0.3 | 0.9 | GO:0004939 | beta-adrenergic receptor activity(GO:0004939) |
| 0.3 | 1.7 | GO:0008420 | CTD phosphatase activity(GO:0008420) |
| 0.3 | 6.2 | GO:0004806 | triglyceride lipase activity(GO:0004806) |
| 0.3 | 0.8 | GO:0047631 | ADP-ribose diphosphatase activity(GO:0047631) |
| 0.3 | 27.2 | GO:0004867 | serine-type endopeptidase inhibitor activity(GO:0004867) |
| 0.3 | 3.5 | GO:0046870 | cadmium ion binding(GO:0046870) |
| 0.3 | 6.6 | GO:0070006 | metalloaminopeptidase activity(GO:0070006) |
| 0.3 | 2.4 | GO:0097322 | 7SK snRNA binding(GO:0097322) |
| 0.3 | 4.9 | GO:0048018 | receptor agonist activity(GO:0048018) |
| 0.3 | 11.0 | GO:0005158 | insulin receptor binding(GO:0005158) |
| 0.3 | 6.9 | GO:0005523 | tropomyosin binding(GO:0005523) |
| 0.3 | 1.5 | GO:0048101 | calcium- and calmodulin-regulated 3',5'-cyclic-GMP phosphodiesterase activity(GO:0048101) |
| 0.2 | 0.5 | GO:0005143 | interleukin-12 receptor binding(GO:0005143) |
| 0.2 | 14.8 | GO:0030507 | spectrin binding(GO:0030507) |
| 0.2 | 4.1 | GO:0008093 | cytoskeletal adaptor activity(GO:0008093) |
| 0.2 | 3.9 | GO:0004016 | adenylate cyclase activity(GO:0004016) |
| 0.2 | 2.8 | GO:0015266 | protein channel activity(GO:0015266) |
| 0.2 | 0.5 | GO:0008559 | xenobiotic-transporting ATPase activity(GO:0008559) xenobiotic transporter activity(GO:0042910) |
| 0.2 | 5.6 | GO:0008574 | ATP-dependent microtubule motor activity, plus-end-directed(GO:0008574) |
| 0.2 | 1.8 | GO:0004996 | thyroid-stimulating hormone receptor activity(GO:0004996) |
| 0.2 | 1.8 | GO:0016493 | C-C chemokine receptor activity(GO:0016493) |
| 0.2 | 2.5 | GO:0015174 | basic amino acid transmembrane transporter activity(GO:0015174) |
| 0.2 | 5.7 | GO:0070402 | NADPH binding(GO:0070402) |
| 0.2 | 1.8 | GO:0015643 | toxic substance binding(GO:0015643) |
| 0.2 | 0.4 | GO:0008431 | vitamin E binding(GO:0008431) |
| 0.2 | 1.3 | GO:0019863 | IgE binding(GO:0019863) |
| 0.2 | 3.3 | GO:0005132 | type I interferon receptor binding(GO:0005132) |
| 0.2 | 2.8 | GO:0008097 | 5S rRNA binding(GO:0008097) |
| 0.2 | 4.7 | GO:0098641 | cadherin binding involved in cell-cell adhesion(GO:0098641) |
| 0.2 | 3.0 | GO:0005161 | platelet-derived growth factor receptor binding(GO:0005161) |
| 0.2 | 4.1 | GO:0008510 | sodium:bicarbonate symporter activity(GO:0008510) |
| 0.2 | 1.2 | GO:0030368 | interleukin-17 receptor activity(GO:0030368) |
| 0.2 | 2.0 | GO:0001968 | fibronectin binding(GO:0001968) |
| 0.2 | 2.4 | GO:0004118 | cGMP-stimulated cyclic-nucleotide phosphodiesterase activity(GO:0004118) |
| 0.2 | 1.6 | GO:0008934 | inositol monophosphate 1-phosphatase activity(GO:0008934) inositol monophosphate 3-phosphatase activity(GO:0052832) inositol monophosphate 4-phosphatase activity(GO:0052833) inositol monophosphate phosphatase activity(GO:0052834) |
| 0.2 | 3.4 | GO:0051371 | muscle alpha-actinin binding(GO:0051371) |
| 0.2 | 2.5 | GO:0070330 | aromatase activity(GO:0070330) |
| 0.2 | 2.5 | GO:0016909 | JUN kinase activity(GO:0004705) SAP kinase activity(GO:0016909) |
| 0.2 | 15.5 | GO:0005201 | extracellular matrix structural constituent(GO:0005201) |
| 0.2 | 3.0 | GO:0038036 | sphingosine-1-phosphate receptor activity(GO:0038036) |
| 0.2 | 2.1 | GO:0005391 | sodium:potassium-exchanging ATPase activity(GO:0005391) |
| 0.2 | 12.6 | GO:0001540 | beta-amyloid binding(GO:0001540) |
| 0.2 | 3.2 | GO:0002162 | dystroglycan binding(GO:0002162) |
| 0.2 | 3.0 | GO:0031005 | filamin binding(GO:0031005) |
| 0.2 | 1.1 | GO:0004028 | 3-chloroallyl aldehyde dehydrogenase activity(GO:0004028) |
| 0.2 | 0.9 | GO:0045125 | bioactive lipid receptor activity(GO:0045125) |
| 0.2 | 5.7 | GO:0005001 | transmembrane receptor protein tyrosine phosphatase activity(GO:0005001) transmembrane receptor protein phosphatase activity(GO:0019198) |
| 0.2 | 5.8 | GO:0003785 | actin monomer binding(GO:0003785) |
| 0.2 | 5.1 | GO:0097200 | cysteine-type endopeptidase activity involved in execution phase of apoptosis(GO:0097200) |
| 0.2 | 2.5 | GO:0045294 | alpha-catenin binding(GO:0045294) |
| 0.2 | 7.7 | GO:0004683 | calmodulin-dependent protein kinase activity(GO:0004683) |
| 0.2 | 5.1 | GO:0005031 | tumor necrosis factor-activated receptor activity(GO:0005031) death receptor activity(GO:0005035) |
| 0.2 | 3.7 | GO:0042166 | acetylcholine binding(GO:0042166) |
| 0.2 | 1.3 | GO:0044323 | retinoic acid-responsive element binding(GO:0044323) |
| 0.2 | 10.2 | GO:0004712 | protein serine/threonine/tyrosine kinase activity(GO:0004712) |
| 0.2 | 2.4 | GO:0015280 | ligand-gated sodium channel activity(GO:0015280) |
| 0.2 | 5.1 | GO:0004709 | MAP kinase kinase kinase activity(GO:0004709) |
| 0.2 | 5.6 | GO:0004385 | guanylate kinase activity(GO:0004385) |
| 0.2 | 1.2 | GO:0050693 | LBD domain binding(GO:0050693) |
| 0.1 | 3.2 | GO:0008519 | ammonium transmembrane transporter activity(GO:0008519) |
| 0.1 | 1.9 | GO:0030284 | estrogen receptor activity(GO:0030284) |
| 0.1 | 13.9 | GO:0042626 | ATPase activity, coupled to transmembrane movement of substances(GO:0042626) |
| 0.1 | 3.5 | GO:0015144 | carbohydrate transmembrane transporter activity(GO:0015144) carbohydrate transporter activity(GO:1901476) |
| 0.1 | 8.8 | GO:0004497 | monooxygenase activity(GO:0004497) |
| 0.1 | 1.9 | GO:0004596 | peptide alpha-N-acetyltransferase activity(GO:0004596) |
| 0.1 | 20.7 | GO:0044325 | ion channel binding(GO:0044325) |
| 0.1 | 3.5 | GO:0031489 | myosin V binding(GO:0031489) |
| 0.1 | 5.5 | GO:0048487 | beta-tubulin binding(GO:0048487) |
| 0.1 | 4.6 | GO:0004890 | GABA-A receptor activity(GO:0004890) |
| 0.1 | 8.9 | GO:0008307 | structural constituent of muscle(GO:0008307) |
| 0.1 | 3.7 | GO:0071889 | 14-3-3 protein binding(GO:0071889) |
| 0.1 | 2.1 | GO:1990380 | Lys48-specific deubiquitinase activity(GO:1990380) |
| 0.1 | 13.2 | GO:0019210 | kinase inhibitor activity(GO:0019210) |
| 0.1 | 2.6 | GO:0001848 | complement binding(GO:0001848) |
| 0.1 | 1.5 | GO:0036374 | glutathione hydrolase activity(GO:0036374) |
| 0.1 | 0.9 | GO:0016724 | ferroxidase activity(GO:0004322) oxidoreductase activity, oxidizing metal ions, oxygen as acceptor(GO:0016724) |
| 0.1 | 2.2 | GO:0019870 | potassium channel inhibitor activity(GO:0019870) |
| 0.1 | 47.5 | GO:0003779 | actin binding(GO:0003779) |
| 0.1 | 1.3 | GO:0005025 | transforming growth factor beta receptor activity, type I(GO:0005025) |
| 0.1 | 69.6 | GO:0005509 | calcium ion binding(GO:0005509) |
| 0.1 | 6.3 | GO:0008408 | 3'-5' exonuclease activity(GO:0008408) |
| 0.1 | 1.4 | GO:0017049 | GTP-Rho binding(GO:0017049) |
| 0.1 | 11.8 | GO:0005179 | hormone activity(GO:0005179) |
| 0.1 | 3.3 | GO:0048306 | calcium-dependent protein binding(GO:0048306) |
| 0.1 | 1.9 | GO:0036041 | long-chain fatty acid binding(GO:0036041) |
| 0.1 | 2.9 | GO:0005319 | lipid transporter activity(GO:0005319) |
| 0.1 | 0.8 | GO:0017081 | chloride channel regulator activity(GO:0017081) |
| 0.1 | 0.4 | GO:0033857 | diphosphoinositol-pentakisphosphate kinase activity(GO:0033857) |
| 0.1 | 0.4 | GO:0070492 | oligosaccharide binding(GO:0070492) |
| 0.1 | 1.0 | GO:0005229 | intracellular calcium activated chloride channel activity(GO:0005229) |
| 0.1 | 12.1 | GO:0035091 | phosphatidylinositol binding(GO:0035091) |
| 0.1 | 8.5 | GO:0000979 | RNA polymerase II core promoter sequence-specific DNA binding(GO:0000979) |
| 0.1 | 106.9 | GO:0003700 | nucleic acid binding transcription factor activity(GO:0001071) transcription factor activity, sequence-specific DNA binding(GO:0003700) |
| 0.1 | 0.4 | GO:0019958 | C-X-C chemokine binding(GO:0019958) |
| 0.1 | 0.9 | GO:0016423 | tRNA (guanine) methyltransferase activity(GO:0016423) |
| 0.1 | 0.4 | GO:0052658 | inositol-1,4,5-trisphosphate 5-phosphatase activity(GO:0052658) |
| 0.1 | 1.1 | GO:0005159 | insulin-like growth factor receptor binding(GO:0005159) |
| 0.1 | 0.9 | GO:0030371 | translation repressor activity(GO:0030371) |
| 0.1 | 1.1 | GO:0016805 | dipeptidase activity(GO:0016805) |
| 0.1 | 2.7 | GO:0020037 | heme binding(GO:0020037) |
| 0.1 | 0.7 | GO:0016290 | palmitoyl-CoA hydrolase activity(GO:0016290) |
| 0.0 | 5.2 | GO:0004222 | metalloendopeptidase activity(GO:0004222) |
| 0.0 | 2.3 | GO:0017112 | Rab guanyl-nucleotide exchange factor activity(GO:0017112) |
| 0.0 | 0.4 | GO:0016004 | phospholipase activator activity(GO:0016004) |
| 0.0 | 0.3 | GO:0004977 | melanocortin receptor activity(GO:0004977) |
| 0.0 | 1.3 | GO:0016782 | transferase activity, transferring sulfur-containing groups(GO:0016782) |
| 0.0 | 2.0 | GO:0008528 | peptide receptor activity(GO:0001653) G-protein coupled peptide receptor activity(GO:0008528) |
| 0.0 | 1.0 | GO:0003899 | DNA-directed RNA polymerase activity(GO:0003899) |
| 0.0 | 0.0 | GO:0001223 | transcription coactivator binding(GO:0001223) |
| 0.0 | 0.4 | GO:0005254 | chloride channel activity(GO:0005254) |
| 0.0 | 0.4 | GO:0031683 | G-protein beta/gamma-subunit complex binding(GO:0031683) |
| 0.0 | 0.0 | GO:0004914 | interleukin-5 receptor activity(GO:0004914) |
Gene overrepresentation in curated gene sets: canonical pathways category:
| Log-likelihood per target | Total log-likelihood | Term | Description |
|---|---|---|---|
| 2.4 | 120.1 | NABA PROTEOGLYCANS | Genes encoding proteoglycans |
| 1.2 | 7.0 | PID WNT CANONICAL PATHWAY | Canonical Wnt signaling pathway |
| 0.9 | 67.2 | PID INTEGRIN A4B1 PATHWAY | Alpha4 beta1 integrin signaling events |
| 0.8 | 15.2 | NABA BASEMENT MEMBRANES | Genes encoding structural components of basement membranes |
| 0.8 | 30.0 | PID PRL SIGNALING EVENTS PATHWAY | Signaling events mediated by PRL |
| 0.8 | 168.2 | NABA ECM GLYCOPROTEINS | Genes encoding structural ECM glycoproteins |
| 0.7 | 16.0 | SA PROGRAMMED CELL DEATH | Programmed cell death, or apoptosis, eliminates damaged or unneeded cells. |
| 0.7 | 95.4 | PID MYC REPRESS PATHWAY | Validated targets of C-MYC transcriptional repression |
| 0.7 | 17.3 | PID IL5 PATHWAY | IL5-mediated signaling events |
| 0.6 | 33.4 | PID NCADHERIN PATHWAY | N-cadherin signaling events |
| 0.5 | 14.3 | PID HDAC CLASSIII PATHWAY | Signaling events mediated by HDAC Class III |
| 0.5 | 20.9 | PID ATM PATHWAY | ATM pathway |
| 0.4 | 10.5 | ST ADRENERGIC | Adrenergic Pathway |
| 0.4 | 5.6 | PID ATF2 PATHWAY | ATF-2 transcription factor network |
| 0.4 | 1.3 | PID S1P S1P2 PATHWAY | S1P2 pathway |
| 0.4 | 26.2 | PID ARF6 TRAFFICKING PATHWAY | Arf6 trafficking events |
| 0.4 | 1.7 | SA G2 AND M PHASES | Cdc25 activates the cdc2/cyclin B complex to induce the G2/M transition. |
| 0.4 | 36.7 | SIG PIP3 SIGNALING IN CARDIAC MYOCTES | Genes related to PIP3 signaling in cardiac myocytes |
| 0.4 | 18.7 | PID GLYPICAN 1PATHWAY | Glypican 1 network |
| 0.4 | 4.9 | ST PAC1 RECEPTOR PATHWAY | PAC1 Receptor Pathway |
| 0.4 | 15.9 | PID RAS PATHWAY | Regulation of Ras family activation |
| 0.3 | 13.7 | PID IL23 PATHWAY | IL23-mediated signaling events |
| 0.3 | 3.0 | PID S1P S1P3 PATHWAY | S1P3 pathway |
| 0.3 | 4.1 | ST MYOCYTE AD PATHWAY | Myocyte Adrenergic Pathway is a specific case of the generalized Adrenergic Pathway. |
| 0.3 | 4.2 | PID IL3 PATHWAY | IL3-mediated signaling events |
| 0.3 | 2.6 | PID TRAIL PATHWAY | TRAIL signaling pathway |
| 0.3 | 13.2 | PID IL1 PATHWAY | IL1-mediated signaling events |
| 0.3 | 8.5 | PID NEPHRIN NEPH1 PATHWAY | Nephrin/Neph1 signaling in the kidney podocyte |
| 0.3 | 9.3 | PID FRA PATHWAY | Validated transcriptional targets of AP1 family members Fra1 and Fra2 |
| 0.3 | 7.1 | PID INSULIN PATHWAY | Insulin Pathway |
| 0.3 | 3.0 | PID S1P S1P1 PATHWAY | S1P1 pathway |
| 0.3 | 5.1 | PID TOLL ENDOGENOUS PATHWAY | Endogenous TLR signaling |
| 0.3 | 17.4 | PID RAC1 REG PATHWAY | Regulation of RAC1 activity |
| 0.3 | 2.8 | PID RET PATHWAY | Signaling events regulated by Ret tyrosine kinase |
| 0.2 | 10.9 | PID FGF PATHWAY | FGF signaling pathway |
| 0.2 | 6.7 | PID AR NONGENOMIC PATHWAY | Nongenotropic Androgen signaling |
| 0.2 | 2.9 | ST GRANULE CELL SURVIVAL PATHWAY | Granule Cell Survival Pathway is a specific case of more general PAC1 Receptor Pathway. |
| 0.2 | 2.0 | ST INTERFERON GAMMA PATHWAY | Interferon gamma pathway. |
| 0.2 | 3.6 | PID PI3K PLC TRK PATHWAY | Trk receptor signaling mediated by PI3K and PLC-gamma |
| 0.2 | 2.1 | PID ECADHERIN KERATINOCYTE PATHWAY | E-cadherin signaling in keratinocytes |
| 0.2 | 6.2 | PID MET PATHWAY | Signaling events mediated by Hepatocyte Growth Factor Receptor (c-Met) |
| 0.2 | 14.3 | ST FAS SIGNALING PATHWAY | Fas Signaling Pathway |
| 0.2 | 4.2 | PID SYNDECAN 4 PATHWAY | Syndecan-4-mediated signaling events |
| 0.2 | 42.5 | NABA ECM REGULATORS | Genes encoding enzymes and their regulators involved in the remodeling of the extracellular matrix |
| 0.2 | 9.7 | PID IL4 2PATHWAY | IL4-mediated signaling events |
| 0.1 | 1.6 | PID IL27 PATHWAY | IL27-mediated signaling events |
| 0.1 | 2.5 | PID CIRCADIAN PATHWAY | Circadian rhythm pathway |
| 0.1 | 20.9 | NABA ECM AFFILIATED | Genes encoding proteins affiliated structurally or functionally to extracellular matrix proteins |
| 0.1 | 5.9 | PID RXR VDR PATHWAY | RXR and RAR heterodimerization with other nuclear receptor |
| 0.1 | 6.4 | PID HNF3B PATHWAY | FOXA2 and FOXA3 transcription factor networks |
| 0.1 | 2.3 | PID A6B1 A6B4 INTEGRIN PATHWAY | a6b1 and a6b4 Integrin signaling |
| 0.1 | 4.7 | PID DELTA NP63 PATHWAY | Validated transcriptional targets of deltaNp63 isoforms |
| 0.1 | 2.5 | PID ARF6 PATHWAY | Arf6 signaling events |
| 0.1 | 1.6 | PID PTP1B PATHWAY | Signaling events mediated by PTP1B |
| 0.1 | 0.7 | PID ARF6 DOWNSTREAM PATHWAY | Arf6 downstream pathway |
| 0.1 | 1.3 | PID WNT NONCANONICAL PATHWAY | Noncanonical Wnt signaling pathway |
| 0.1 | 1.9 | PID PI3KCI PATHWAY | Class I PI3K signaling events |
| 0.1 | 5.3 | PID HDAC CLASSI PATHWAY | Signaling events mediated by HDAC Class I |
| 0.1 | 3.3 | PID CD8 TCR DOWNSTREAM PATHWAY | Downstream signaling in naïve CD8+ T cells |
| 0.1 | 2.8 | PID MTOR 4PATHWAY | mTOR signaling pathway |
| 0.1 | 1.3 | PID FCER1 PATHWAY | Fc-epsilon receptor I signaling in mast cells |
| 0.0 | 1.3 | PID ERBB1 DOWNSTREAM PATHWAY | ErbB1 downstream signaling |
| 0.0 | 1.3 | PID RHODOPSIN PATHWAY | Visual signal transduction: Rods |
| 0.0 | 1.0 | NABA CORE MATRISOME | Ensemble of genes encoding core extracellular matrix including ECM glycoproteins, collagens and proteoglycans |
| 0.0 | 0.9 | PID HIF2PATHWAY | HIF-2-alpha transcription factor network |
| 0.0 | 1.8 | PID REG GR PATHWAY | Glucocorticoid receptor regulatory network |
| 0.0 | 0.5 | PID ERB GENOMIC PATHWAY | Validated nuclear estrogen receptor beta network |
| 0.0 | 0.7 | PID ECADHERIN STABILIZATION PATHWAY | Stabilization and expansion of the E-cadherin adherens junction |
| 0.0 | 7.0 | NABA MATRISOME ASSOCIATED | Ensemble of genes encoding ECM-associated proteins including ECM-affilaited proteins, ECM regulators and secreted factors |
| 0.0 | 0.6 | SIG REGULATION OF THE ACTIN CYTOSKELETON BY RHO GTPASES | Genes related to regulation of the actin cytoskeleton |
| 0.0 | 1.0 | PID TRKR PATHWAY | Neurotrophic factor-mediated Trk receptor signaling |
| 0.0 | 0.4 | PID TCR CALCIUM PATHWAY | Calcium signaling in the CD4+ TCR pathway |
Gene overrepresentation in curated gene sets: REACTOME pathways category:
| Log-likelihood per target | Total log-likelihood | Term | Description |
|---|---|---|---|
| 4.7 | 128.2 | REACTOME CS DS DEGRADATION | Genes involved in CS/DS degradation |
| 2.5 | 24.6 | REACTOME ETHANOL OXIDATION | Genes involved in Ethanol oxidation |
| 2.0 | 23.9 | REACTOME REGULATION OF THE FANCONI ANEMIA PATHWAY | Genes involved in Regulation of the Fanconi anemia pathway |
| 1.6 | 40.4 | REACTOME GLUCURONIDATION | Genes involved in Glucuronidation |
| 1.5 | 20.1 | REACTOME TRAF6 MEDIATED INDUCTION OF TAK1 COMPLEX | Genes involved in TRAF6 mediated induction of TAK1 complex |
| 1.5 | 16.8 | REACTOME OPSINS | Genes involved in Opsins |
| 1.4 | 24.4 | REACTOME ACYL CHAIN REMODELLING OF PI | Genes involved in Acyl chain remodelling of PI |
| 1.2 | 1.2 | REACTOME SYNTHESIS OF BILE ACIDS AND BILE SALTS | Genes involved in Synthesis of bile acids and bile salts |
| 1.1 | 24.4 | REACTOME NOREPINEPHRINE NEUROTRANSMITTER RELEASE CYCLE | Genes involved in Norepinephrine Neurotransmitter Release Cycle |
| 1.0 | 14.2 | REACTOME ANDROGEN BIOSYNTHESIS | Genes involved in Androgen biosynthesis |
| 0.9 | 16.0 | REACTOME XENOBIOTICS | Genes involved in Xenobiotics |
| 0.9 | 17.6 | REACTOME AMINE DERIVED HORMONES | Genes involved in Amine-derived hormones |
| 0.9 | 14.0 | REACTOME RECYCLING OF BILE ACIDS AND SALTS | Genes involved in Recycling of bile acids and salts |
| 0.7 | 13.5 | REACTOME GAP JUNCTION ASSEMBLY | Genes involved in Gap junction assembly |
| 0.7 | 6.0 | REACTOME CIRCADIAN REPRESSION OF EXPRESSION BY REV ERBA | Genes involved in Circadian Repression of Expression by REV-ERBA |
| 0.7 | 111.0 | REACTOME RESPONSE TO ELEVATED PLATELET CYTOSOLIC CA2 | Genes involved in Response to elevated platelet cytosolic Ca2+ |
| 0.6 | 6.2 | REACTOME BETA DEFENSINS | Genes involved in Beta defensins |
| 0.6 | 8.0 | REACTOME ABACAVIR TRANSPORT AND METABOLISM | Genes involved in Abacavir transport and metabolism |
| 0.5 | 11.9 | REACTOME ABCA TRANSPORTERS IN LIPID HOMEOSTASIS | Genes involved in ABCA transporters in lipid homeostasis |
| 0.5 | 21.8 | REACTOME AMYLOIDS | Genes involved in Amyloids |
| 0.5 | 24.0 | REACTOME SMOOTH MUSCLE CONTRACTION | Genes involved in Smooth Muscle Contraction |
| 0.5 | 8.5 | REACTOME INHIBITION OF REPLICATION INITIATION OF DAMAGED DNA BY RB1 E2F1 | Genes involved in Inhibition of replication initiation of damaged DNA by RB1/E2F1 |
| 0.5 | 10.9 | REACTOME FGFR2C LIGAND BINDING AND ACTIVATION | Genes involved in FGFR2c ligand binding and activation |
| 0.4 | 9.9 | REACTOME APOPTOTIC CLEAVAGE OF CELL ADHESION PROTEINS | Genes involved in Apoptotic cleavage of cell adhesion proteins |
| 0.4 | 40.2 | REACTOME OLFACTORY SIGNALING PATHWAY | Genes involved in Olfactory Signaling Pathway |
| 0.4 | 9.8 | REACTOME CYTOSOLIC SULFONATION OF SMALL MOLECULES | Genes involved in Cytosolic sulfonation of small molecules |
| 0.4 | 14.5 | REACTOME HORMONE SENSITIVE LIPASE HSL MEDIATED TRIACYLGLYCEROL HYDROLYSIS | Genes involved in Hormone-sensitive lipase (HSL)-mediated triacylglycerol hydrolysis |
| 0.4 | 8.6 | REACTOME PRESYNAPTIC NICOTINIC ACETYLCHOLINE RECEPTORS | Genes involved in Presynaptic nicotinic acetylcholine receptors |
| 0.4 | 76.7 | REACTOME PEPTIDE LIGAND BINDING RECEPTORS | Genes involved in Peptide ligand-binding receptors |
| 0.4 | 2.6 | REACTOME MEMBRANE BINDING AND TARGETTING OF GAG PROTEINS | Genes involved in Membrane binding and targetting of GAG proteins |
| 0.4 | 27.5 | REACTOME NCAM1 INTERACTIONS | Genes involved in NCAM1 interactions |
| 0.4 | 6.9 | REACTOME SEMA3A PLEXIN REPULSION SIGNALING BY INHIBITING INTEGRIN ADHESION | Genes involved in SEMA3A-Plexin repulsion signaling by inhibiting Integrin adhesion |
| 0.4 | 5.1 | REACTOME ROLE OF DCC IN REGULATING APOPTOSIS | Genes involved in Role of DCC in regulating apoptosis |
| 0.4 | 16.7 | REACTOME INWARDLY RECTIFYING K CHANNELS | Genes involved in Inwardly rectifying K+ channels |
| 0.3 | 16.4 | REACTOME GLUCONEOGENESIS | Genes involved in Gluconeogenesis |
| 0.3 | 14.3 | REACTOME INTERACTION BETWEEN L1 AND ANKYRINS | Genes involved in Interaction between L1 and Ankyrins |
| 0.3 | 17.6 | REACTOME ION TRANSPORT BY P TYPE ATPASES | Genes involved in Ion transport by P-type ATPases |
| 0.3 | 11.2 | REACTOME GLUTATHIONE CONJUGATION | Genes involved in Glutathione conjugation |
| 0.3 | 13.3 | REACTOME COLLAGEN FORMATION | Genes involved in Collagen formation |
| 0.3 | 15.8 | REACTOME VOLTAGE GATED POTASSIUM CHANNELS | Genes involved in Voltage gated Potassium channels |
| 0.3 | 14.3 | REACTOME IL RECEPTOR SHC SIGNALING | Genes involved in Interleukin receptor SHC signaling |
| 0.3 | 10.2 | REACTOME CHONDROITIN SULFATE DERMATAN SULFATE METABOLISM | Genes involved in Chondroitin sulfate/dermatan sulfate metabolism |
| 0.3 | 12.0 | REACTOME O LINKED GLYCOSYLATION OF MUCINS | Genes involved in O-linked glycosylation of mucins |
| 0.2 | 4.3 | REACTOME SYNTHESIS OF PA | Genes involved in Synthesis of PA |
| 0.2 | 4.0 | REACTOME MICRORNA MIRNA BIOGENESIS | Genes involved in MicroRNA (miRNA) Biogenesis |
| 0.2 | 4.4 | REACTOME GLUCAGON TYPE LIGAND RECEPTORS | Genes involved in Glucagon-type ligand receptors |
| 0.2 | 3.9 | REACTOME DESTABILIZATION OF MRNA BY BRF1 | Genes involved in Destabilization of mRNA by Butyrate Response Factor 1 (BRF1) |
| 0.2 | 16.1 | REACTOME AMINO ACID AND OLIGOPEPTIDE SLC TRANSPORTERS | Genes involved in Amino acid and oligopeptide SLC transporters |
| 0.2 | 3.9 | REACTOME PHASE II CONJUGATION | Genes involved in Phase II conjugation |
| 0.2 | 2.5 | REACTOME JNK C JUN KINASES PHOSPHORYLATION AND ACTIVATION MEDIATED BY ACTIVATED HUMAN TAK1 | Genes involved in JNK (c-Jun kinases) phosphorylation and activation mediated by activated human TAK1 |
| 0.2 | 4.4 | REACTOME AMINE COMPOUND SLC TRANSPORTERS | Genes involved in Amine compound SLC transporters |
| 0.2 | 7.4 | REACTOME IL1 SIGNALING | Genes involved in Interleukin-1 signaling |
| 0.2 | 1.8 | REACTOME HORMONE LIGAND BINDING RECEPTORS | Genes involved in Hormone ligand-binding receptors |
| 0.2 | 3.4 | REACTOME PROTEOLYTIC CLEAVAGE OF SNARE COMPLEX PROTEINS | Genes involved in Proteolytic cleavage of SNARE complex proteins |
| 0.2 | 2.8 | REACTOME INITIAL TRIGGERING OF COMPLEMENT | Genes involved in Initial triggering of complement |
| 0.2 | 3.8 | REACTOME REGULATION OF INSULIN LIKE GROWTH FACTOR IGF ACTIVITY BY INSULIN LIKE GROWTH FACTOR BINDING PROTEINS IGFBPS | Genes involved in Regulation of Insulin-like Growth Factor (IGF) Activity by Insulin-like Growth Factor Binding Proteins (IGFBPs) |
| 0.2 | 8.8 | REACTOME G ALPHA Z SIGNALLING EVENTS | Genes involved in G alpha (z) signalling events |
| 0.2 | 5.9 | REACTOME PTM GAMMA CARBOXYLATION HYPUSINE FORMATION AND ARYLSULFATASE ACTIVATION | Genes involved in PTM: gamma carboxylation, hypusine formation and arylsulfatase activation |
| 0.2 | 1.8 | REACTOME KERATAN SULFATE DEGRADATION | Genes involved in Keratan sulfate degradation |
| 0.1 | 3.3 | REACTOME REGULATION OF IFNA SIGNALING | Genes involved in Regulation of IFNA signaling |
| 0.1 | 3.1 | REACTOME FACILITATIVE NA INDEPENDENT GLUCOSE TRANSPORTERS | Genes involved in Facilitative Na+-independent glucose transporters |
| 0.1 | 1.7 | REACTOME ABC FAMILY PROTEINS MEDIATED TRANSPORT | Genes involved in ABC-family proteins mediated transport |
| 0.1 | 2.1 | REACTOME GABA SYNTHESIS RELEASE REUPTAKE AND DEGRADATION | Genes involved in GABA synthesis, release, reuptake and degradation |
| 0.1 | 1.4 | REACTOME SYNTHESIS OF BILE ACIDS AND BILE SALTS VIA 24 HYDROXYCHOLESTEROL | Genes involved in Synthesis of bile acids and bile salts via 24-hydroxycholesterol |
| 0.1 | 2.1 | REACTOME CLASS C 3 METABOTROPIC GLUTAMATE PHEROMONE RECEPTORS | Genes involved in Class C/3 (Metabotropic glutamate/pheromone receptors) |
| 0.1 | 7.8 | REACTOME NUCLEAR SIGNALING BY ERBB4 | Genes involved in Nuclear signaling by ERBB4 |
| 0.1 | 4.3 | REACTOME DOWNREGULATION OF TGF BETA RECEPTOR SIGNALING | Genes involved in Downregulation of TGF-beta receptor signaling |
| 0.1 | 2.0 | REACTOME REGULATION OF IFNG SIGNALING | Genes involved in Regulation of IFNG signaling |
| 0.1 | 51.5 | REACTOME GENERIC TRANSCRIPTION PATHWAY | Genes involved in Generic Transcription Pathway |
| 0.1 | 10.6 | REACTOME G ALPHA S SIGNALLING EVENTS | Genes involved in G alpha (s) signalling events |
| 0.1 | 3.8 | REACTOME ADHERENS JUNCTIONS INTERACTIONS | Genes involved in Adherens junctions interactions |
| 0.1 | 3.2 | REACTOME ACTIVATED AMPK STIMULATES FATTY ACID OXIDATION IN MUSCLE | Genes involved in Activated AMPK stimulates fatty-acid oxidation in muscle |
| 0.1 | 1.1 | REACTOME NEGATIVE REGULATION OF THE PI3K AKT NETWORK | Genes involved in Negative regulation of the PI3K/AKT network |
| 0.1 | 1.5 | REACTOME HDL MEDIATED LIPID TRANSPORT | Genes involved in HDL-mediated lipid transport |
| 0.1 | 3.8 | REACTOME NOTCH1 INTRACELLULAR DOMAIN REGULATES TRANSCRIPTION | Genes involved in NOTCH1 Intracellular Domain Regulates Transcription |
| 0.1 | 1.1 | REACTOME DIGESTION OF DIETARY CARBOHYDRATE | Genes involved in Digestion of dietary carbohydrate |
| 0.1 | 8.1 | REACTOME SIGNALING BY PDGF | Genes involved in Signaling by PDGF |
| 0.1 | 3.6 | REACTOME GABA RECEPTOR ACTIVATION | Genes involved in GABA receptor activation |
| 0.1 | 0.9 | REACTOME ENDOSOMAL VACUOLAR PATHWAY | Genes involved in Endosomal/Vacuolar pathway |
| 0.1 | 2.4 | REACTOME POST CHAPERONIN TUBULIN FOLDING PATHWAY | Genes involved in Post-chaperonin tubulin folding pathway |
| 0.1 | 6.0 | REACTOME INTERFERON ALPHA BETA SIGNALING | Genes involved in Interferon alpha/beta signaling |
| 0.1 | 4.3 | REACTOME STRIATED MUSCLE CONTRACTION | Genes involved in Striated Muscle Contraction |
| 0.1 | 2.6 | REACTOME EXTRINSIC PATHWAY FOR APOPTOSIS | Genes involved in Extrinsic Pathway for Apoptosis |
| 0.1 | 2.9 | REACTOME CELL CELL JUNCTION ORGANIZATION | Genes involved in Cell-cell junction organization |
| 0.1 | 3.6 | REACTOME BIOLOGICAL OXIDATIONS | Genes involved in Biological oxidations |
| 0.1 | 4.5 | REACTOME CELL SURFACE INTERACTIONS AT THE VASCULAR WALL | Genes involved in Cell surface interactions at the vascular wall |
| 0.1 | 3.1 | REACTOME GLYCEROPHOSPHOLIPID BIOSYNTHESIS | Genes involved in Glycerophospholipid biosynthesis |
| 0.0 | 1.5 | REACTOME CLASS A1 RHODOPSIN LIKE RECEPTORS | Genes involved in Class A/1 (Rhodopsin-like receptors) |
| 0.0 | 0.8 | REACTOME HEMOSTASIS | Genes involved in Hemostasis |
| 0.0 | 1.0 | REACTOME CITRIC ACID CYCLE TCA CYCLE | Genes involved in Citric acid cycle (TCA cycle) |
| 0.0 | 2.0 | REACTOME MEIOTIC SYNAPSIS | Genes involved in Meiotic Synapsis |
| 0.0 | 0.6 | REACTOME CGMP EFFECTS | Genes involved in cGMP effects |
| 0.0 | 0.1 | REACTOME PLATELET ADHESION TO EXPOSED COLLAGEN | Genes involved in Platelet Adhesion to exposed collagen |
| 0.0 | 1.1 | REACTOME TRANSPORT OF INORGANIC CATIONS ANIONS AND AMINO ACIDS OLIGOPEPTIDES | Genes involved in Transport of inorganic cations/anions and amino acids/oligopeptides |
| 0.0 | 0.5 | REACTOME APOPTOTIC CLEAVAGE OF CELLULAR PROTEINS | Genes involved in Apoptotic cleavage of cellular proteins |