Project
GNF SymAtlas + NCI-60 cancer cell lines, human (Su, 2004; Ross, 2000)
Navigation
Downloads
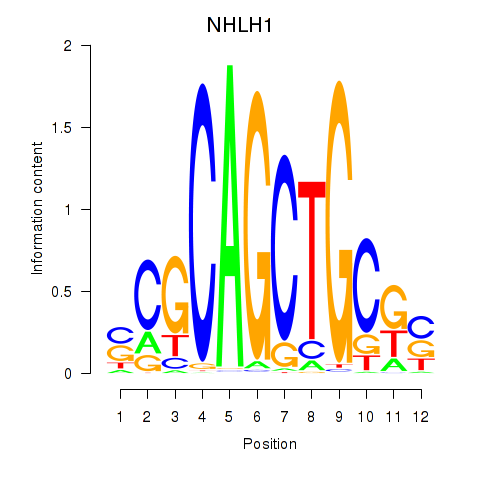
Results for NHLH1
Z-value: 1.52
Motif logo
Transcription factors associated with NHLH1
| Gene Symbol | Gene ID | Gene Info |
|---|---|---|
|
NHLH1
|
ENSG00000171786.6 | NHLH1 |
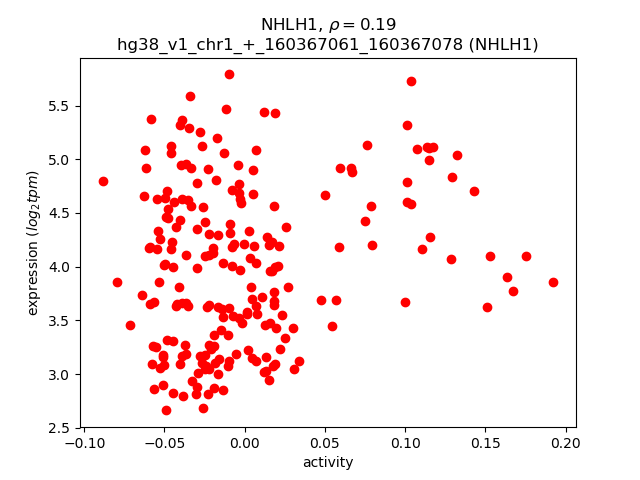
Activity-expression correlation:
| Gene | Promoter | Pearson corr. coef. | P-value | Plot |
|---|---|---|---|---|
| NHLH1 | hg38_v1_chr1_+_160367061_160367078 | 0.19 | 4.3e-03 | Click! |
Activity profile of NHLH1 motif
Sorted Z-values of NHLH1 motif
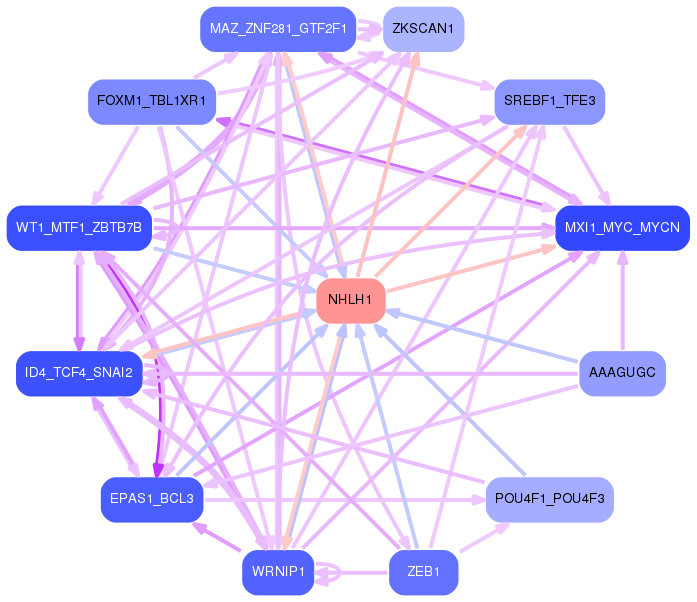
Network of associatons between targets according to the STRING database.

First level regulatory network of NHLH1
| Promoter | Score | Transcript | Gene | Gene Info |
|---|---|---|---|---|
| chr16_+_23835946 | 65.57 |
ENST00000321728.12
ENST00000643927.1 |
PRKCB
|
protein kinase C beta |
| chr13_-_36131286 | 32.98 |
ENST00000255448.8
ENST00000379892.4 |
DCLK1
|
doublecortin like kinase 1 |
| chr14_-_23352741 | 31.16 |
ENST00000354772.9
|
SLC22A17
|
solute carrier family 22 member 17 |
| chr8_+_24914942 | 30.69 |
ENST00000433454.3
|
NEFM
|
neurofilament medium |
| chr10_+_103277129 | 29.86 |
ENST00000369849.9
|
INA
|
internexin neuronal intermediate filament protein alpha |
| chr6_-_83709019 | 27.26 |
ENST00000519779.5
ENST00000369694.6 ENST00000195649.10 |
SNAP91
|
synaptosome associated protein 91 |
| chr14_+_99684283 | 27.26 |
ENST00000261835.8
|
CYP46A1
|
cytochrome P450 family 46 subfamily A member 1 |
| chr1_+_10210562 | 24.91 |
ENST00000377093.9
ENST00000676179.1 |
KIF1B
|
kinesin family member 1B |
| chr6_-_83709141 | 24.82 |
ENST00000521743.5
|
SNAP91
|
synaptosome associated protein 91 |
| chr6_-_3157536 | 24.23 |
ENST00000333628.4
|
TUBB2A
|
tubulin beta 2A class IIa |
| chr9_-_109167159 | 23.63 |
ENST00000561981.5
|
FRRS1L
|
ferric chelate reductase 1 like |
| chr20_+_45408276 | 22.59 |
ENST00000372710.5
ENST00000443296.1 |
DBNDD2
|
dysbindin domain containing 2 |
| chr5_-_74641419 | 21.98 |
ENST00000618628.4
ENST00000510316.5 ENST00000508331.1 |
ENC1
|
ectodermal-neural cortex 1 |
| chr6_-_83709382 | 21.98 |
ENST00000520302.5
ENST00000520213.5 ENST00000439399.6 |
SNAP91
|
synaptosome associated protein 91 |
| chr7_-_727242 | 21.88 |
ENST00000537384.6
ENST00000417852.5 |
PRKAR1B
|
protein kinase cAMP-dependent type I regulatory subunit beta |
| chr1_-_21622509 | 21.45 |
ENST00000374761.6
|
RAP1GAP
|
RAP1 GTPase activating protein |
| chr8_-_97277890 | 20.04 |
ENST00000322128.5
|
TSPYL5
|
TSPY like 5 |
| chr22_+_31944527 | 19.56 |
ENST00000248975.6
|
YWHAH
|
tyrosine 3-monooxygenase/tryptophan 5-monooxygenase activation protein eta |
| chr22_+_31944500 | 19.18 |
ENST00000397492.1
|
YWHAH
|
tyrosine 3-monooxygenase/tryptophan 5-monooxygenase activation protein eta |
| chr13_-_36131352 | 18.96 |
ENST00000360631.8
|
DCLK1
|
doublecortin like kinase 1 |
| chr1_-_85465147 | 18.87 |
ENST00000284031.13
|
DDAH1
|
dimethylarginine dimethylaminohydrolase 1 |
| chr8_+_24913752 | 18.68 |
ENST00000518131.5
ENST00000221166.10 ENST00000437366.2 |
NEFM
|
neurofilament medium |
| chr19_+_35030626 | 18.01 |
ENST00000638536.1
|
SCN1B
|
sodium voltage-gated channel beta subunit 1 |
| chr20_+_38805686 | 17.86 |
ENST00000299824.6
ENST00000373331.2 |
PPP1R16B
|
protein phosphatase 1 regulatory subunit 16B |
| chr19_+_4304632 | 17.85 |
ENST00000597590.5
|
FSD1
|
fibronectin type III and SPRY domain containing 1 |
| chr16_+_6483379 | 17.45 |
ENST00000552089.5
|
RBFOX1
|
RNA binding fox-1 homolog 1 |
| chr16_+_6483728 | 17.40 |
ENST00000675459.1
ENST00000551752.5 |
RBFOX1
|
RNA binding fox-1 homolog 1 |
| chr16_+_7510102 | 16.92 |
ENST00000682918.1
ENST00000683326.1 ENST00000570626.2 |
RBFOX1
|
RNA binding fox-1 homolog 1 |
| chr1_-_3796478 | 16.92 |
ENST00000378251.3
|
LRRC47
|
leucine rich repeat containing 47 |
| chr17_-_58529344 | 16.81 |
ENST00000317268.7
|
SEPTIN4
|
septin 4 |
| chr19_+_4304588 | 16.61 |
ENST00000221856.11
|
FSD1
|
fibronectin type III and SPRY domain containing 1 |
| chr17_-_58529303 | 16.52 |
ENST00000580844.5
|
SEPTIN4
|
septin 4 |
| chr17_-_58529277 | 16.50 |
ENST00000579371.5
|
SEPTIN4
|
septin 4 |
| chr1_+_51236252 | 16.39 |
ENST00000242719.4
|
RNF11
|
ring finger protein 11 |
| chr14_-_23352872 | 16.29 |
ENST00000397267.5
|
SLC22A17
|
solute carrier family 22 member 17 |
| chr4_+_153153023 | 16.16 |
ENST00000676458.1
ENST00000675782.1 |
TRIM2
|
tripartite motif containing 2 |
| chr16_+_280572 | 16.14 |
ENST00000219409.8
|
ARHGDIG
|
Rho GDP dissociation inhibitor gamma |
| chr16_+_6483813 | 16.12 |
ENST00000675653.1
|
RBFOX1
|
RNA binding fox-1 homolog 1 |
| chr5_+_157266079 | 15.60 |
ENST00000616178.4
ENST00000522463.5 ENST00000435847.6 ENST00000620254.5 ENST00000521420.5 ENST00000617629.4 |
CYFIP2
|
cytoplasmic FMR1 interacting protein 2 |
| chr1_+_32886456 | 15.10 |
ENST00000373467.4
|
HPCA
|
hippocalcin |
| chr7_-_727611 | 15.04 |
ENST00000403562.5
|
PRKAR1B
|
protein kinase cAMP-dependent type I regulatory subunit beta |
| chr14_-_103522696 | 14.99 |
ENST00000553878.5
ENST00000348956.7 ENST00000557530.1 |
CKB
|
creatine kinase B |
| chr16_+_280448 | 14.33 |
ENST00000447871.5
|
ARHGDIG
|
Rho GDP dissociation inhibitor gamma |
| chr1_+_50109817 | 14.13 |
ENST00000652353.1
ENST00000371821.6 ENST00000652274.1 |
ELAVL4
|
ELAV like RNA binding protein 4 |
| chr3_+_167735704 | 13.88 |
ENST00000446050.7
ENST00000295777.9 ENST00000472747.2 |
SERPINI1
|
serpin family I member 1 |
| chr19_-_49441508 | 13.87 |
ENST00000221485.8
|
SLC17A7
|
solute carrier family 17 member 7 |
| chr19_+_35030438 | 13.65 |
ENST00000415950.5
ENST00000262631.11 |
SCN1B
|
sodium voltage-gated channel beta subunit 1 |
| chr17_+_46590669 | 13.37 |
ENST00000398238.8
|
NSF
|
N-ethylmaleimide sensitive factor, vesicle fusing ATPase |
| chr1_+_50109620 | 13.12 |
ENST00000371819.1
|
ELAVL4
|
ELAV like RNA binding protein 4 |
| chr19_+_35030711 | 13.11 |
ENST00000595652.5
|
SCN1B
|
sodium voltage-gated channel beta subunit 1 |
| chrX_+_110944285 | 13.06 |
ENST00000425146.5
ENST00000446737.5 |
PAK3
|
p21 (RAC1) activated kinase 3 |
| chr12_-_89708816 | 12.75 |
ENST00000428670.8
|
ATP2B1
|
ATPase plasma membrane Ca2+ transporting 1 |
| chr3_-_133895577 | 12.51 |
ENST00000543906.5
|
RAB6B
|
RAB6B, member RAS oncogene family |
| chr4_-_101347327 | 12.46 |
ENST00000394853.8
|
PPP3CA
|
protein phosphatase 3 catalytic subunit alpha |
| chr3_-_133895867 | 12.43 |
ENST00000285208.9
|
RAB6B
|
RAB6B, member RAS oncogene family |
| chr11_-_695215 | 12.26 |
ENST00000382409.4
|
DEAF1
|
DEAF1 transcription factor |
| chr11_-_66568524 | 12.12 |
ENST00000679160.1
ENST00000678305.1 ENST00000310325.10 ENST00000677896.1 ENST00000677587.1 ENST00000679347.1 ENST00000677005.1 ENST00000678872.1 ENST00000679024.1 ENST00000678471.1 ENST00000524994.6 |
CTSF
|
cathepsin F |
| chr16_+_1706163 | 12.01 |
ENST00000250894.8
ENST00000673691.1 ENST00000356010.9 ENST00000610761.2 |
MAPK8IP3
|
mitogen-activated protein kinase 8 interacting protein 3 |
| chr3_-_33659441 | 12.00 |
ENST00000650653.1
ENST00000480013.6 |
CLASP2
|
cytoplasmic linker associated protein 2 |
| chr14_-_100587404 | 11.95 |
ENST00000554140.2
|
BEGAIN
|
brain enriched guanylate kinase associated |
| chr15_+_24954912 | 11.80 |
ENST00000584968.5
ENST00000346403.10 ENST00000554227.6 ENST00000390687.9 ENST00000579070.5 ENST00000577565.1 ENST00000577949.5 ENST00000338327.4 |
SNRPN
SNURF
|
small nuclear ribonucleoprotein polypeptide N SNRPN upstream reading frame |
| chr4_-_101347492 | 11.78 |
ENST00000394854.8
|
PPP3CA
|
protein phosphatase 3 catalytic subunit alpha |
| chr6_+_30880780 | 11.69 |
ENST00000460944.6
ENST00000324771.12 |
DDR1
|
discoidin domain receptor tyrosine kinase 1 |
| chr12_-_6470667 | 11.49 |
ENST00000361716.8
ENST00000396308.4 |
VAMP1
|
vesicle associated membrane protein 1 |
| chr12_-_27780236 | 11.45 |
ENST00000381273.4
|
MANSC4
|
MANSC domain containing 4 |
| chr17_-_81166160 | 11.39 |
ENST00000326724.9
|
AATK
|
apoptosis associated tyrosine kinase |
| chr14_-_23302823 | 11.38 |
ENST00000452015.9
|
PPP1R3E
|
protein phosphatase 1 regulatory subunit 3E |
| chr5_+_72107453 | 11.38 |
ENST00000296755.12
ENST00000511641.2 |
MAP1B
|
microtubule associated protein 1B |
| chr4_-_101347471 | 11.35 |
ENST00000323055.10
ENST00000512215.5 |
PPP3CA
|
protein phosphatase 3 catalytic subunit alpha |
| chr4_+_153153105 | 11.05 |
ENST00000437508.7
|
TRIM2
|
tripartite motif containing 2 |
| chr6_+_29656993 | 10.94 |
ENST00000376888.6
|
MOG
|
myelin oligodendrocyte glycoprotein |
| chr1_-_177164673 | 10.93 |
ENST00000424564.2
ENST00000361833.7 |
ASTN1
|
astrotactin 1 |
| chr11_-_66347560 | 10.80 |
ENST00000311181.5
|
B4GAT1
|
beta-1,4-glucuronyltransferase 1 |
| chr2_-_86337617 | 10.68 |
ENST00000538924.7
ENST00000535845.6 |
REEP1
|
receptor accessory protein 1 |
| chr1_+_50109788 | 10.64 |
ENST00000651258.1
|
ELAVL4
|
ELAV like RNA binding protein 4 |
| chr16_-_29899043 | 10.63 |
ENST00000346932.9
ENST00000350527.7 ENST00000568380.1 |
SEZ6L2
|
seizure related 6 homolog like 2 |
| chr11_+_65890627 | 10.62 |
ENST00000312579.4
|
CCDC85B
|
coiled-coil domain containing 85B |
| chr1_+_87331668 | 10.52 |
ENST00000370542.1
|
LMO4
|
LIM domain only 4 |
| chr6_+_29657085 | 10.38 |
ENST00000376917.8
ENST00000376894.8 |
MOG
|
myelin oligodendrocyte glycoprotein |
| chr17_-_80476597 | 10.18 |
ENST00000306773.5
|
NPTX1
|
neuronal pentraxin 1 |
| chr17_+_68259164 | 10.12 |
ENST00000448504.6
|
ARSG
|
arylsulfatase G |
| chr1_-_182391783 | 10.11 |
ENST00000331872.11
ENST00000339526.8 |
GLUL
|
glutamate-ammonia ligase |
| chr14_-_26598025 | 10.06 |
ENST00000539517.7
|
NOVA1
|
NOVA alternative splicing regulator 1 |
| chr2_-_86337654 | 9.96 |
ENST00000165698.9
|
REEP1
|
receptor accessory protein 1 |
| chr6_+_29657120 | 9.88 |
ENST00000396704.7
ENST00000416766.6 ENST00000483013.5 ENST00000490427.5 ENST00000376891.8 ENST00000376898.7 ENST00000396701.6 ENST00000494692.5 ENST00000431798.6 |
MOG
|
myelin oligodendrocyte glycoprotein |
| chr15_+_43510945 | 9.85 |
ENST00000382031.5
|
MAP1A
|
microtubule associated protein 1A |
| chr4_-_185775890 | 9.81 |
ENST00000437304.6
|
SORBS2
|
sorbin and SH3 domain containing 2 |
| chr9_-_89178810 | 9.73 |
ENST00000375835.9
|
SHC3
|
SHC adaptor protein 3 |
| chr1_-_182391363 | 9.50 |
ENST00000417584.6
|
GLUL
|
glutamate-ammonia ligase |
| chr3_+_35639589 | 9.33 |
ENST00000428373.5
|
ARPP21
|
cAMP regulated phosphoprotein 21 |
| chr19_+_46601296 | 9.29 |
ENST00000598871.5
ENST00000291295.14 ENST00000594523.5 |
CALM3
|
calmodulin 3 |
| chr10_+_132537778 | 9.21 |
ENST00000368594.8
|
INPP5A
|
inositol polyphosphate-5-phosphatase A |
| chr11_+_17734732 | 9.09 |
ENST00000379472.4
ENST00000675775.1 ENST00000265969.8 ENST00000640318.2 ENST00000639325.2 |
KCNC1
|
potassium voltage-gated channel subfamily C member 1 |
| chr12_-_6470643 | 8.95 |
ENST00000535180.5
ENST00000400911.7 |
VAMP1
|
vesicle associated membrane protein 1 |
| chr16_+_56191476 | 8.91 |
ENST00000262493.12
|
GNAO1
|
G protein subunit alpha o1 |
| chr16_-_29899245 | 8.85 |
ENST00000537485.5
|
SEZ6L2
|
seizure related 6 homolog like 2 |
| chr9_-_76692181 | 8.81 |
ENST00000376717.6
ENST00000223609.10 |
PRUNE2
|
prune homolog 2 with BCH domain |
| chr14_-_64972143 | 8.73 |
ENST00000267512.9
|
RAB15
|
RAB15, member RAS oncogene family |
| chr1_+_228487356 | 8.72 |
ENST00000305943.9
|
RNF187
|
ring finger protein 187 |
| chr12_+_120650492 | 8.68 |
ENST00000351200.6
|
CABP1
|
calcium binding protein 1 |
| chr10_-_125823221 | 8.67 |
ENST00000420761.5
ENST00000368797.10 |
UROS
|
uroporphyrinogen III synthase |
| chr8_+_85463997 | 8.56 |
ENST00000285379.10
|
CA2
|
carbonic anhydrase 2 |
| chr19_-_3061403 | 8.56 |
ENST00000586839.1
|
TLE5
|
TLE family member 5, transcriptional modulator |
| chr19_+_10106688 | 8.39 |
ENST00000430370.1
|
PPAN
|
peter pan homolog |
| chr7_+_111091119 | 8.30 |
ENST00000308478.10
|
LRRN3
|
leucine rich repeat neuronal 3 |
| chr13_+_34942263 | 8.24 |
ENST00000379939.7
ENST00000400445.7 |
NBEA
|
neurobeachin |
| chr11_-_35419542 | 8.17 |
ENST00000643305.1
ENST00000644351.1 ENST00000278379.9 ENST00000644779.1 |
SLC1A2
|
solute carrier family 1 member 2 |
| chr11_-_66958366 | 8.17 |
ENST00000651036.1
ENST00000652125.1 ENST00000531614.6 ENST00000524491.6 ENST00000529047.6 ENST00000393960.7 ENST00000393958.7 ENST00000528403.6 ENST00000651854.1 |
PC
|
pyruvate carboxylase |
| chr7_+_45574358 | 8.15 |
ENST00000297323.12
|
ADCY1
|
adenylate cyclase 1 |
| chr18_+_11689210 | 8.04 |
ENST00000334049.11
|
GNAL
|
G protein subunit alpha L |
| chr6_-_166627244 | 7.94 |
ENST00000265678.9
|
RPS6KA2
|
ribosomal protein S6 kinase A2 |
| chr10_-_125823089 | 7.86 |
ENST00000368774.1
ENST00000368778.7 ENST00000649536.1 |
UROS
|
uroporphyrinogen III synthase |
| chr15_+_40252888 | 7.76 |
ENST00000559139.5
ENST00000560669.5 ENST00000542403.3 |
PAK6
|
p21 (RAC1) activated kinase 6 |
| chr8_+_41490553 | 7.67 |
ENST00000405786.2
ENST00000357743.9 |
GOLGA7
|
golgin A7 |
| chr7_+_111091006 | 7.63 |
ENST00000451085.5
ENST00000422987.3 ENST00000421101.1 |
LRRN3
|
leucine rich repeat neuronal 3 |
| chr12_+_7155867 | 7.53 |
ENST00000535313.2
ENST00000331148.5 |
CLSTN3
|
calsyntenin 3 |
| chr6_-_154510675 | 7.53 |
ENST00000607772.6
|
CNKSR3
|
CNKSR family member 3 |
| chr19_-_49072699 | 7.50 |
ENST00000221444.2
|
KCNA7
|
potassium voltage-gated channel subfamily A member 7 |
| chr16_+_22814154 | 7.48 |
ENST00000261374.4
|
HS3ST2
|
heparan sulfate-glucosamine 3-sulfotransferase 2 |
| chr4_-_185775271 | 7.47 |
ENST00000430503.5
ENST00000319454.10 ENST00000450341.5 |
SORBS2
|
sorbin and SH3 domain containing 2 |
| chr3_-_73624840 | 7.46 |
ENST00000308537.4
ENST00000263666.9 |
PDZRN3
|
PDZ domain containing ring finger 3 |
| chr2_-_73284431 | 7.45 |
ENST00000521871.5
ENST00000520530.3 |
FBXO41
|
F-box protein 41 |
| chr16_-_74774812 | 7.40 |
ENST00000219368.8
|
FA2H
|
fatty acid 2-hydroxylase |
| chr17_-_28951285 | 7.21 |
ENST00000577226.5
|
PHF12
|
PHD finger protein 12 |
| chr5_+_140114085 | 7.20 |
ENST00000331327.5
|
PURA
|
purine rich element binding protein A |
| chrX_-_69165509 | 7.09 |
ENST00000361478.1
|
PJA1
|
praja ring finger ubiquitin ligase 1 |
| chr14_-_64972233 | 7.07 |
ENST00000533601.7
|
RAB15
|
RAB15, member RAS oncogene family |
| chrX_-_69165430 | 7.03 |
ENST00000374584.3
ENST00000590146.1 ENST00000374571.5 |
PJA1
|
praja ring finger ubiquitin ligase 1 |
| chr7_-_712940 | 7.00 |
ENST00000544935.5
ENST00000430040.5 ENST00000456696.2 ENST00000406797.5 |
PRKAR1B
|
protein kinase cAMP-dependent type I regulatory subunit beta |
| chr4_+_70704713 | 6.85 |
ENST00000417478.6
|
RUFY3
|
RUN and FYVE domain containing 3 |
| chr3_-_195909711 | 6.66 |
ENST00000333602.14
|
TNK2
|
tyrosine kinase non receptor 2 |
| chr8_+_135457442 | 6.56 |
ENST00000355849.10
|
KHDRBS3
|
KH RNA binding domain containing, signal transduction associated 3 |
| chr5_-_218136 | 6.39 |
ENST00000296824.4
|
CCDC127
|
coiled-coil domain containing 127 |
| chr17_-_58517835 | 6.39 |
ENST00000579921.1
ENST00000579925.5 ENST00000323456.9 |
MTMR4
|
myotubularin related protein 4 |
| chr4_-_36244438 | 6.30 |
ENST00000303965.9
|
ARAP2
|
ArfGAP with RhoGAP domain, ankyrin repeat and PH domain 2 |
| chr9_-_23821275 | 6.30 |
ENST00000380110.8
|
ELAVL2
|
ELAV like RNA binding protein 2 |
| chr11_+_12110569 | 6.25 |
ENST00000683283.1
ENST00000256194.8 |
MICAL2
|
microtubule associated monooxygenase, calponin and LIM domain containing 2 |
| chr16_-_29926155 | 6.11 |
ENST00000567795.3
ENST00000568000.6 ENST00000561540.2 |
KCTD13
|
potassium channel tetramerization domain containing 13 |
| chr1_+_174877430 | 6.02 |
ENST00000392064.6
|
RABGAP1L
|
RAB GTPase activating protein 1 like |
| chr11_-_35420050 | 6.01 |
ENST00000395753.6
ENST00000395750.6 ENST00000645634.1 |
SLC1A2
|
solute carrier family 1 member 2 |
| chr19_+_46601237 | 6.00 |
ENST00000597743.5
|
CALM3
|
calmodulin 3 |
| chr2_+_65056382 | 5.81 |
ENST00000377990.7
ENST00000537589.1 ENST00000260569.4 |
CEP68
|
centrosomal protein 68 |
| chr11_+_61766073 | 5.80 |
ENST00000675319.1
|
MYRF
|
myelin regulatory factor |
| chr2_-_11670186 | 5.78 |
ENST00000306928.6
|
NTSR2
|
neurotensin receptor 2 |
| chr5_-_134411847 | 5.51 |
ENST00000458198.3
ENST00000395009.3 |
CDKN2AIPNL
|
CDKN2A interacting protein N-terminal like |
| chr2_-_229271221 | 5.47 |
ENST00000392054.7
ENST00000409462.1 ENST00000392055.8 |
PID1
|
phosphotyrosine interaction domain containing 1 |
| chr16_+_19211157 | 5.44 |
ENST00000568433.1
|
SYT17
|
synaptotagmin 17 |
| chr1_-_84690406 | 5.42 |
ENST00000605755.5
ENST00000342203.8 ENST00000437941.6 |
SSX2IP
|
SSX family member 2 interacting protein |
| chr1_-_237004440 | 5.41 |
ENST00000464121.3
|
MT1HL1
|
metallothionein 1H like 1 |
| chr7_+_73433761 | 5.37 |
ENST00000344575.5
|
FZD9
|
frizzled class receptor 9 |
| chr11_-_61430008 | 5.31 |
ENST00000394888.8
|
CPSF7
|
cleavage and polyadenylation specific factor 7 |
| chr1_-_83999097 | 5.29 |
ENST00000260505.13
ENST00000610996.1 |
TTLL7
|
tubulin tyrosine ligase like 7 |
| chr2_+_10911924 | 5.20 |
ENST00000295082.3
|
KCNF1
|
potassium voltage-gated channel modifier subfamily F member 1 |
| chr1_-_153946652 | 5.09 |
ENST00000361217.9
|
DENND4B
|
DENN domain containing 4B |
| chr7_+_100015572 | 5.03 |
ENST00000535170.5
|
ZKSCAN1
|
zinc finger with KRAB and SCAN domains 1 |
| chr9_+_122941003 | 5.00 |
ENST00000373647.9
ENST00000402311.5 |
RABGAP1
|
RAB GTPase activating protein 1 |
| chr4_+_61201223 | 4.96 |
ENST00000512091.6
|
ADGRL3
|
adhesion G protein-coupled receptor L3 |
| chrX_-_43973382 | 4.96 |
ENST00000642620.1
ENST00000647044.1 |
NDP
|
norrin cystine knot growth factor NDP |
| chr15_+_79311137 | 4.95 |
ENST00000424155.6
ENST00000536821.5 |
TMED3
|
transmembrane p24 trafficking protein 3 |
| chrX_-_6227180 | 4.94 |
ENST00000381093.6
|
NLGN4X
|
neuroligin 4 X-linked |
| chr11_-_61429934 | 4.94 |
ENST00000541963.5
ENST00000477890.6 ENST00000439958.8 |
CPSF7
|
cleavage and polyadenylation specific factor 7 |
| chr19_-_14206168 | 4.90 |
ENST00000361434.7
ENST00000340736.10 |
ADGRL1
|
adhesion G protein-coupled receptor L1 |
| chr19_-_46661132 | 4.83 |
ENST00000410105.2
ENST00000391916.7 |
DACT3
|
dishevelled binding antagonist of beta catenin 3 |
| chr11_+_71527267 | 4.77 |
ENST00000398536.6
|
KRTAP5-7
|
keratin associated protein 5-7 |
| chr1_+_89524819 | 4.74 |
ENST00000439853.6
ENST00000330947.7 ENST00000449440.5 ENST00000640258.1 |
LRRC8B
|
leucine rich repeat containing 8 VRAC subunit B |
| chr9_+_128818491 | 4.73 |
ENST00000372642.5
|
ENDOG
|
endonuclease G |
| chr1_+_89524871 | 4.72 |
ENST00000639264.1
|
LRRC8B
|
leucine rich repeat containing 8 VRAC subunit B |
| chr19_-_58558871 | 4.70 |
ENST00000595957.5
|
UBE2M
|
ubiquitin conjugating enzyme E2 M |
| chr2_+_235669602 | 4.69 |
ENST00000409538.5
|
AGAP1
|
ArfGAP with GTPase domain, ankyrin repeat and PH domain 1 |
| chr1_-_56579555 | 4.61 |
ENST00000371250.4
|
PLPP3
|
phospholipid phosphatase 3 |
| chr4_+_122152308 | 4.59 |
ENST00000679879.1
ENST00000264501.8 |
KIAA1109
|
KIAA1109 |
| chr17_-_75405647 | 4.46 |
ENST00000316804.10
ENST00000316615.9 |
GRB2
|
growth factor receptor bound protein 2 |
| chr15_-_52179881 | 4.36 |
ENST00000396335.8
ENST00000560116.1 ENST00000358784.11 |
GNB5
|
G protein subunit beta 5 |
| chr1_-_201023694 | 4.36 |
ENST00000332129.6
ENST00000422435.2 ENST00000461742.7 |
KIF21B
|
kinesin family member 21B |
| chr14_+_104865256 | 4.35 |
ENST00000414716.8
ENST00000556508.5 ENST00000453495.2 |
CEP170B
|
centrosomal protein 170B |
| chr19_-_5978133 | 4.32 |
ENST00000340578.10
ENST00000591736.5 ENST00000587479.2 |
RANBP3
|
RAN binding protein 3 |
| chr12_-_123268077 | 4.30 |
ENST00000542174.5
|
CDK2AP1
|
cyclin dependent kinase 2 associated protein 1 |
| chr19_-_5978078 | 4.28 |
ENST00000592621.5
ENST00000034275.12 ENST00000591092.5 ENST00000591333.5 ENST00000590623.5 ENST00000439268.6 |
RANBP3
|
RAN binding protein 3 |
| chr2_+_8682046 | 4.27 |
ENST00000331129.3
ENST00000396290.2 |
ID2
|
inhibitor of DNA binding 2 |
| chr17_+_28042660 | 4.24 |
ENST00000407008.8
|
NLK
|
nemo like kinase |
| chr17_-_76726753 | 4.20 |
ENST00000617192.4
|
JMJD6
|
jumonji domain containing 6, arginine demethylase and lysine hydroxylase |
| chr18_-_55586092 | 4.18 |
ENST00000563888.6
ENST00000540999.5 ENST00000627685.2 |
TCF4
|
transcription factor 4 |
| chr12_+_131949893 | 4.17 |
ENST00000389561.7
ENST00000332482.8 ENST00000333577.8 |
EP400
|
E1A binding protein p400 |
| chr2_-_73112885 | 4.15 |
ENST00000486777.7
|
RAB11FIP5
|
RAB11 family interacting protein 5 |
| chr17_-_75405486 | 4.08 |
ENST00000392562.5
|
GRB2
|
growth factor receptor bound protein 2 |
| chr19_-_58558561 | 4.04 |
ENST00000253023.8
|
UBE2M
|
ubiquitin conjugating enzyme E2 M |
| chr17_-_33293247 | 4.04 |
ENST00000225823.7
|
ASIC2
|
acid sensing ion channel subunit 2 |
| chr2_+_15940537 | 4.03 |
ENST00000281043.4
ENST00000638417.1 |
MYCN
|
MYCN proto-oncogene, bHLH transcription factor |
| chr14_-_24442765 | 4.02 |
ENST00000555365.5
ENST00000399395.8 ENST00000553930.5 |
SDR39U1
|
short chain dehydrogenase/reductase family 39U member 1 |
| chr16_+_83899079 | 4.01 |
ENST00000262430.6
|
MLYCD
|
malonyl-CoA decarboxylase |
| chr7_+_100015588 | 3.98 |
ENST00000324306.11
ENST00000426572.5 |
ZKSCAN1
|
zinc finger with KRAB and SCAN domains 1 |
| chr4_+_41360759 | 3.95 |
ENST00000508501.5
ENST00000512946.5 ENST00000313860.11 ENST00000512632.5 ENST00000512820.5 |
LIMCH1
|
LIM and calponin homology domains 1 |
| chr13_-_95644690 | 3.94 |
ENST00000361396.6
ENST00000376829.7 |
DZIP1
|
DAZ interacting zinc finger protein 1 |
| chr19_+_5904856 | 3.93 |
ENST00000339485.4
|
VMAC
|
vimentin type intermediate filament associated coiled-coil protein |
| chr19_-_5567984 | 3.91 |
ENST00000448587.5
|
TINCR
|
TINCR ubiquitin domain containing |
| chr3_+_43286512 | 3.90 |
ENST00000454177.5
ENST00000429705.6 ENST00000296088.12 ENST00000437827.1 |
SNRK
|
SNF related kinase |
| chr19_-_45493208 | 3.89 |
ENST00000430715.6
|
RTN2
|
reticulon 2 |
| chr4_+_40056790 | 3.86 |
ENST00000261435.11
ENST00000515550.1 |
N4BP2
|
NEDD4 binding protein 2 |
| chr4_+_176065827 | 3.86 |
ENST00000508596.6
|
WDR17
|
WD repeat domain 17 |
| chrX_+_119236245 | 3.86 |
ENST00000535419.2
|
PGRMC1
|
progesterone receptor membrane component 1 |
Gene Ontology Analysis
Gene overrepresentation in biological process category:
| Log-likelihood per target | Total log-likelihood | Term | Description |
|---|---|---|---|
| 13.1 | 65.6 | GO:0050861 | positive regulation of B cell receptor signaling pathway(GO:0050861) |
| 12.3 | 49.4 | GO:0033693 | neurofilament bundle assembly(GO:0033693) |
| 9.5 | 47.5 | GO:0015891 | iron chelate transport(GO:0015688) siderophore transport(GO:0015891) |
| 8.9 | 35.6 | GO:1905205 | positive regulation of connective tissue replacement(GO:1905205) |
| 7.5 | 44.8 | GO:0021966 | corticospinal neuron axon guidance(GO:0021966) |
| 6.0 | 17.9 | GO:1902309 | negative regulation of peptidyl-serine dephosphorylation(GO:1902309) |
| 4.9 | 19.6 | GO:0006542 | glutamine biosynthetic process(GO:0006542) |
| 4.6 | 13.9 | GO:0042137 | sequestering of neurotransmitter(GO:0042137) |
| 4.1 | 16.5 | GO:0071418 | cellular response to amine stimulus(GO:0071418) |
| 3.7 | 29.9 | GO:0060052 | neurofilament cytoskeleton organization(GO:0060052) |
| 3.4 | 16.9 | GO:0006432 | phenylalanyl-tRNA aminoacylation(GO:0006432) |
| 2.9 | 47.1 | GO:2000480 | negative regulation of cAMP-dependent protein kinase activity(GO:2000480) |
| 2.9 | 8.6 | GO:0042938 | dipeptide transport(GO:0042938) |
| 2.7 | 21.9 | GO:0032534 | regulation of microvillus assembly(GO:0032534) |
| 2.5 | 15.0 | GO:0030644 | cellular chloride ion homeostasis(GO:0030644) |
| 2.5 | 27.3 | GO:0016127 | cholesterol catabolic process(GO:0006707) sterol catabolic process(GO:0016127) |
| 2.4 | 80.3 | GO:2000369 | regulation of clathrin-mediated endocytosis(GO:2000369) |
| 2.4 | 4.7 | GO:1902512 | positive regulation of apoptotic DNA fragmentation(GO:1902512) |
| 2.3 | 9.1 | GO:0021759 | globus pallidus development(GO:0021759) |
| 2.2 | 15.6 | GO:0051388 | positive regulation of neurotrophin TRK receptor signaling pathway(GO:0051388) |
| 2.2 | 10.8 | GO:0030309 | poly-N-acetyllactosamine metabolic process(GO:0030309) poly-N-acetyllactosamine biosynthetic process(GO:0030311) |
| 2.2 | 15.1 | GO:1902075 | cellular response to salt(GO:1902075) |
| 2.1 | 12.7 | GO:1990034 | calcium ion export from cell(GO:1990034) |
| 2.1 | 6.2 | GO:0010735 | positive regulation of transcription via serum response element binding(GO:0010735) |
| 2.0 | 8.2 | GO:0019074 | viral genome packaging(GO:0019072) viral RNA genome packaging(GO:0019074) |
| 2.0 | 22.0 | GO:0010499 | proteasomal ubiquitin-independent protein catabolic process(GO:0010499) |
| 1.9 | 7.7 | GO:0018230 | peptidyl-L-cysteine S-palmitoylation(GO:0018230) peptidyl-S-diacylglycerol-L-cysteine biosynthetic process from peptidyl-cysteine(GO:0018231) |
| 1.8 | 5.5 | GO:0070346 | positive regulation of fat cell proliferation(GO:0070346) negative regulation of mitochondrial DNA replication(GO:0090298) negative regulation of mitochondrial DNA metabolic process(GO:1901859) |
| 1.8 | 5.4 | GO:1904397 | negative regulation of neuromuscular junction development(GO:1904397) |
| 1.5 | 7.5 | GO:1902474 | positive regulation of protein localization to synapse(GO:1902474) |
| 1.5 | 38.7 | GO:0006706 | steroid catabolic process(GO:0006706) |
| 1.4 | 4.3 | GO:0061030 | epithelial cell differentiation involved in mammary gland alveolus development(GO:0061030) |
| 1.4 | 4.2 | GO:0070078 | peptidyl-lysine hydroxylation to 5-hydroxy-L-lysine(GO:0018395) histone arginine demethylation(GO:0070077) histone H3-R2 demethylation(GO:0070078) histone H4-R3 demethylation(GO:0070079) |
| 1.3 | 11.7 | GO:0061302 | smooth muscle cell-matrix adhesion(GO:0061302) |
| 1.3 | 3.8 | GO:0036111 | very long-chain fatty-acyl-CoA metabolic process(GO:0036111) |
| 1.2 | 4.7 | GO:0009137 | purine nucleoside diphosphate catabolic process(GO:0009137) purine ribonucleoside diphosphate catabolic process(GO:0009181) |
| 1.2 | 51.9 | GO:0021952 | central nervous system projection neuron axonogenesis(GO:0021952) |
| 1.1 | 1.1 | GO:0036378 | calcitriol biosynthetic process from calciol(GO:0036378) |
| 1.1 | 12.0 | GO:1904261 | regulation of basement membrane assembly involved in embryonic body morphogenesis(GO:1904259) positive regulation of basement membrane assembly involved in embryonic body morphogenesis(GO:1904261) basement membrane assembly involved in embryonic body morphogenesis(GO:2001197) |
| 1.1 | 20.6 | GO:0071786 | endoplasmic reticulum tubular network organization(GO:0071786) |
| 1.1 | 8.6 | GO:0046604 | positive regulation of mitotic centrosome separation(GO:0046604) |
| 1.0 | 10.2 | GO:0060385 | axonogenesis involved in innervation(GO:0060385) |
| 1.0 | 18.9 | GO:0043116 | negative regulation of vascular permeability(GO:0043116) |
| 1.0 | 5.0 | GO:0035426 | extracellular matrix-cell signaling(GO:0035426) |
| 1.0 | 20.4 | GO:0035493 | SNARE complex assembly(GO:0035493) |
| 1.0 | 6.7 | GO:0018095 | protein polyglutamylation(GO:0018095) |
| 0.9 | 30.3 | GO:0047497 | establishment of mitochondrion localization, microtubule-mediated(GO:0034643) mitochondrion transport along microtubule(GO:0047497) |
| 0.9 | 2.8 | GO:0002143 | tRNA wobble position uridine thiolation(GO:0002143) enzyme active site formation(GO:0018307) |
| 0.9 | 7.4 | GO:0070164 | negative regulation of adiponectin secretion(GO:0070164) |
| 0.9 | 2.6 | GO:0030327 | prenylated protein catabolic process(GO:0030327) |
| 0.9 | 3.5 | GO:0030035 | microspike assembly(GO:0030035) |
| 0.8 | 5.1 | GO:0032483 | regulation of Rab protein signal transduction(GO:0032483) |
| 0.8 | 12.4 | GO:0070777 | D-aspartate transport(GO:0070777) D-aspartate import(GO:0070779) |
| 0.8 | 4.0 | GO:0003025 | regulation of systemic arterial blood pressure by baroreceptor feedback(GO:0003025) |
| 0.8 | 4.0 | GO:0036115 | fatty-acyl-CoA catabolic process(GO:0036115) |
| 0.8 | 3.2 | GO:1900827 | maintenance of protein location in membrane(GO:0072658) maintenance of protein location in plasma membrane(GO:0072660) positive regulation of membrane depolarization during cardiac muscle cell action potential(GO:1900827) |
| 0.8 | 57.0 | GO:0000381 | regulation of alternative mRNA splicing, via spliceosome(GO:0000381) |
| 0.8 | 2.3 | GO:0034653 | diterpenoid catabolic process(GO:0016103) retinoic acid catabolic process(GO:0034653) |
| 0.8 | 10.5 | GO:0021527 | spinal cord association neuron differentiation(GO:0021527) |
| 0.7 | 2.7 | GO:0035948 | positive regulation of gluconeogenesis by positive regulation of transcription from RNA polymerase II promoter(GO:0035948) |
| 0.7 | 2.0 | GO:0044878 | mitotic cytokinesis checkpoint(GO:0044878) ubiquitin-independent protein catabolic process via the multivesicular body sorting pathway(GO:0090611) positive regulation of viral budding via host ESCRT complex(GO:1903774) |
| 0.7 | 7.4 | GO:0032287 | peripheral nervous system myelin maintenance(GO:0032287) |
| 0.6 | 6.4 | GO:0014877 | response to muscle inactivity involved in regulation of muscle adaptation(GO:0014877) response to denervation involved in regulation of muscle adaptation(GO:0014894) |
| 0.6 | 8.2 | GO:1904321 | response to forskolin(GO:1904321) cellular response to forskolin(GO:1904322) |
| 0.6 | 4.9 | GO:0010936 | negative regulation of macrophage cytokine production(GO:0010936) |
| 0.6 | 5.5 | GO:0060371 | regulation of atrial cardiac muscle cell membrane depolarization(GO:0060371) |
| 0.6 | 1.8 | GO:0001812 | positive regulation of type I hypersensitivity(GO:0001812) |
| 0.6 | 3.6 | GO:1900113 | negative regulation of histone H3-K9 trimethylation(GO:1900113) |
| 0.6 | 1.7 | GO:0060040 | retinal bipolar neuron differentiation(GO:0060040) |
| 0.6 | 2.8 | GO:1900245 | positive regulation of MDA-5 signaling pathway(GO:1900245) |
| 0.6 | 7.2 | GO:0006268 | DNA unwinding involved in DNA replication(GO:0006268) |
| 0.5 | 2.7 | GO:0071494 | cellular response to UV-C(GO:0071494) |
| 0.5 | 12.3 | GO:0033599 | regulation of mammary gland epithelial cell proliferation(GO:0033599) |
| 0.5 | 8.4 | GO:1900364 | single stranded viral RNA replication via double stranded DNA intermediate(GO:0039692) negative regulation of mRNA polyadenylation(GO:1900364) |
| 0.5 | 2.6 | GO:0045872 | positive regulation of rhodopsin gene expression(GO:0045872) |
| 0.5 | 2.0 | GO:1990637 | response to prolactin(GO:1990637) |
| 0.5 | 13.1 | GO:0010763 | positive regulation of fibroblast migration(GO:0010763) |
| 0.5 | 2.5 | GO:0030242 | pexophagy(GO:0030242) |
| 0.5 | 4.9 | GO:0003360 | brainstem development(GO:0003360) |
| 0.5 | 3.4 | GO:1904879 | positive regulation of calcium ion transmembrane transport via high voltage-gated calcium channel(GO:1904879) |
| 0.5 | 8.5 | GO:0060670 | branching involved in labyrinthine layer morphogenesis(GO:0060670) |
| 0.5 | 4.6 | GO:0008354 | germ cell migration(GO:0008354) |
| 0.5 | 1.8 | GO:1904381 | Golgi apparatus mannose trimming(GO:1904381) |
| 0.4 | 20.0 | GO:0071480 | cellular response to gamma radiation(GO:0071480) |
| 0.4 | 2.6 | GO:0019509 | L-methionine biosynthetic process from methylthioadenosine(GO:0019509) |
| 0.4 | 3.1 | GO:0045634 | regulation of melanocyte differentiation(GO:0045634) |
| 0.4 | 2.1 | GO:2000382 | positive regulation of mesoderm development(GO:2000382) |
| 0.4 | 6.9 | GO:0010457 | centriole-centriole cohesion(GO:0010457) |
| 0.4 | 4.8 | GO:0035414 | negative regulation of catenin import into nucleus(GO:0035414) |
| 0.4 | 5.2 | GO:0061577 | calcium ion transmembrane transport via high voltage-gated calcium channel(GO:0061577) |
| 0.4 | 3.1 | GO:0042426 | choline catabolic process(GO:0042426) |
| 0.4 | 3.4 | GO:0036066 | protein O-linked fucosylation(GO:0036066) |
| 0.4 | 23.6 | GO:1900449 | regulation of glutamate receptor signaling pathway(GO:1900449) |
| 0.4 | 1.9 | GO:1900738 | positive regulation of phospholipase C-activating G-protein coupled receptor signaling pathway(GO:1900738) |
| 0.4 | 4.9 | GO:0090129 | positive regulation of synapse maturation(GO:0090129) |
| 0.4 | 15.7 | GO:0006904 | vesicle docking involved in exocytosis(GO:0006904) |
| 0.4 | 25.5 | GO:0051865 | protein autoubiquitination(GO:0051865) |
| 0.4 | 12.7 | GO:0003301 | physiological muscle hypertrophy(GO:0003298) physiological cardiac muscle hypertrophy(GO:0003301) cell growth involved in cardiac muscle cell development(GO:0061049) |
| 0.4 | 10.9 | GO:0007158 | neuron cell-cell adhesion(GO:0007158) |
| 0.3 | 1.4 | GO:0071233 | cellular response to leucine(GO:0071233) |
| 0.3 | 3.1 | GO:2001032 | regulation of double-strand break repair via nonhomologous end joining(GO:2001032) |
| 0.3 | 13.1 | GO:0045026 | plasma membrane fusion(GO:0045026) |
| 0.3 | 7.5 | GO:2000651 | positive regulation of sodium ion transmembrane transporter activity(GO:2000651) |
| 0.3 | 0.9 | GO:1900042 | positive regulation of interleukin-2 secretion(GO:1900042) |
| 0.3 | 2.8 | GO:0060075 | regulation of resting membrane potential(GO:0060075) |
| 0.3 | 20.0 | GO:0051965 | positive regulation of synapse assembly(GO:0051965) |
| 0.3 | 8.0 | GO:0007191 | adenylate cyclase-activating dopamine receptor signaling pathway(GO:0007191) |
| 0.3 | 0.9 | GO:0014736 | regulation of muscle atrophy(GO:0014735) negative regulation of muscle atrophy(GO:0014736) response to injury involved in regulation of muscle adaptation(GO:0014876) |
| 0.3 | 2.2 | GO:0000480 | endonucleolytic cleavage in 5'-ETS of tricistronic rRNA transcript (SSU-rRNA, 5.8S rRNA, LSU-rRNA)(GO:0000480) |
| 0.3 | 2.2 | GO:0035411 | catenin import into nucleus(GO:0035411) |
| 0.3 | 2.4 | GO:0019375 | galactosylceramide biosynthetic process(GO:0006682) galactolipid biosynthetic process(GO:0019375) |
| 0.3 | 0.5 | GO:0097680 | double-strand break repair via classical nonhomologous end joining(GO:0097680) |
| 0.3 | 1.6 | GO:0006931 | substrate-dependent cell migration, cell attachment to substrate(GO:0006931) |
| 0.3 | 4.4 | GO:1901386 | negative regulation of voltage-gated calcium channel activity(GO:1901386) |
| 0.3 | 2.8 | GO:1902083 | negative regulation of peptidyl-cysteine S-nitrosylation(GO:1902083) |
| 0.3 | 1.0 | GO:0097089 | methyl-branched fatty acid metabolic process(GO:0097089) |
| 0.3 | 3.3 | GO:0035020 | regulation of Rac protein signal transduction(GO:0035020) |
| 0.2 | 2.5 | GO:1903800 | positive regulation of production of miRNAs involved in gene silencing by miRNA(GO:1903800) |
| 0.2 | 2.2 | GO:0045176 | apical protein localization(GO:0045176) |
| 0.2 | 0.7 | GO:0061760 | antifungal innate immune response(GO:0061760) |
| 0.2 | 1.2 | GO:0034154 | toll-like receptor 7 signaling pathway(GO:0034154) |
| 0.2 | 13.1 | GO:0006891 | intra-Golgi vesicle-mediated transport(GO:0006891) |
| 0.2 | 1.4 | GO:0006287 | base-excision repair, gap-filling(GO:0006287) |
| 0.2 | 2.5 | GO:0089711 | L-glutamate transmembrane transport(GO:0089711) |
| 0.2 | 3.0 | GO:0007084 | mitotic nuclear envelope reassembly(GO:0007084) |
| 0.2 | 6.8 | GO:2000114 | regulation of establishment of cell polarity(GO:2000114) |
| 0.2 | 3.1 | GO:0090084 | negative regulation of inclusion body assembly(GO:0090084) |
| 0.2 | 1.5 | GO:0042539 | hypotonic salinity response(GO:0042539) cellular hypotonic salinity response(GO:0071477) |
| 0.2 | 2.9 | GO:0098914 | membrane repolarization during atrial cardiac muscle cell action potential(GO:0098914) |
| 0.2 | 5.8 | GO:0031643 | positive regulation of myelination(GO:0031643) |
| 0.2 | 6.2 | GO:0035024 | negative regulation of Rho protein signal transduction(GO:0035024) |
| 0.2 | 9.5 | GO:0045599 | negative regulation of fat cell differentiation(GO:0045599) |
| 0.2 | 4.3 | GO:0070262 | peptidyl-serine dephosphorylation(GO:0070262) |
| 0.2 | 3.6 | GO:0006828 | manganese ion transport(GO:0006828) |
| 0.2 | 3.8 | GO:0043981 | histone H4-K5 acetylation(GO:0043981) histone H4-K8 acetylation(GO:0043982) |
| 0.2 | 0.8 | GO:0033564 | anterior/posterior axon guidance(GO:0033564) |
| 0.2 | 2.7 | GO:0040019 | positive regulation of embryonic development(GO:0040019) |
| 0.2 | 2.1 | GO:0050703 | interleukin-1 alpha secretion(GO:0050703) |
| 0.2 | 1.5 | GO:0021516 | dorsal spinal cord development(GO:0021516) |
| 0.2 | 1.5 | GO:0070235 | regulation of activation-induced cell death of T cells(GO:0070235) negative regulation of activation-induced cell death of T cells(GO:0070236) |
| 0.2 | 9.2 | GO:0048016 | inositol phosphate-mediated signaling(GO:0048016) |
| 0.2 | 0.7 | GO:0006740 | NADPH regeneration(GO:0006740) |
| 0.2 | 0.5 | GO:0032811 | negative regulation of epinephrine secretion(GO:0032811) |
| 0.2 | 4.2 | GO:0042501 | serine phosphorylation of STAT protein(GO:0042501) |
| 0.2 | 7.9 | GO:0007257 | activation of JUN kinase activity(GO:0007257) |
| 0.2 | 5.2 | GO:0032008 | positive regulation of TOR signaling(GO:0032008) |
| 0.2 | 5.6 | GO:0007212 | dopamine receptor signaling pathway(GO:0007212) |
| 0.2 | 10.2 | GO:0035249 | synaptic transmission, glutamatergic(GO:0035249) |
| 0.2 | 2.6 | GO:0045116 | protein neddylation(GO:0045116) |
| 0.2 | 1.3 | GO:0097039 | protein linear polyubiquitination(GO:0097039) |
| 0.2 | 2.3 | GO:1903608 | protein localization to cytoplasmic stress granule(GO:1903608) |
| 0.1 | 2.8 | GO:0043046 | DNA methylation involved in gamete generation(GO:0043046) |
| 0.1 | 2.4 | GO:0048820 | hair follicle maturation(GO:0048820) |
| 0.1 | 0.6 | GO:0060743 | epithelial cell maturation involved in prostate gland development(GO:0060743) |
| 0.1 | 1.0 | GO:0006578 | amino-acid betaine biosynthetic process(GO:0006578) carnitine biosynthetic process(GO:0045329) |
| 0.1 | 29.8 | GO:0007266 | Rho protein signal transduction(GO:0007266) |
| 0.1 | 1.0 | GO:0006729 | tetrahydrobiopterin biosynthetic process(GO:0006729) tetrahydrobiopterin metabolic process(GO:0046146) |
| 0.1 | 1.0 | GO:0043615 | astrocyte cell migration(GO:0043615) |
| 0.1 | 0.9 | GO:0051791 | medium-chain fatty acid metabolic process(GO:0051791) |
| 0.1 | 2.7 | GO:0071526 | semaphorin-plexin signaling pathway(GO:0071526) |
| 0.1 | 3.1 | GO:0046475 | glycerophospholipid catabolic process(GO:0046475) |
| 0.1 | 0.6 | GO:0030174 | regulation of DNA-dependent DNA replication initiation(GO:0030174) |
| 0.1 | 20.2 | GO:0046718 | viral entry into host cell(GO:0046718) |
| 0.1 | 0.3 | GO:1904742 | regulation of telomeric DNA binding(GO:1904742) |
| 0.1 | 4.3 | GO:0000027 | ribosomal large subunit assembly(GO:0000027) |
| 0.1 | 3.8 | GO:0072661 | protein targeting to plasma membrane(GO:0072661) |
| 0.1 | 1.4 | GO:0001867 | complement activation, lectin pathway(GO:0001867) |
| 0.1 | 8.5 | GO:0007218 | neuropeptide signaling pathway(GO:0007218) |
| 0.1 | 0.5 | GO:1902613 | regulation of anti-Mullerian hormone signaling pathway(GO:1902612) negative regulation of anti-Mullerian hormone signaling pathway(GO:1902613) anti-Mullerian hormone signaling pathway(GO:1990262) |
| 0.1 | 7.2 | GO:0031338 | regulation of vesicle fusion(GO:0031338) |
| 0.1 | 2.5 | GO:0036465 | synaptic vesicle recycling(GO:0036465) |
| 0.1 | 14.0 | GO:0044070 | regulation of anion transport(GO:0044070) |
| 0.1 | 0.4 | GO:0032581 | ER-dependent peroxisome organization(GO:0032581) |
| 0.1 | 0.9 | GO:0046548 | retinal rod cell development(GO:0046548) |
| 0.1 | 1.4 | GO:2000251 | positive regulation of actin cytoskeleton reorganization(GO:2000251) |
| 0.1 | 5.4 | GO:0006906 | vesicle fusion(GO:0006906) |
| 0.1 | 2.0 | GO:0008045 | motor neuron axon guidance(GO:0008045) |
| 0.1 | 0.8 | GO:0034501 | protein localization to kinetochore(GO:0034501) |
| 0.1 | 7.0 | GO:0006369 | termination of RNA polymerase II transcription(GO:0006369) |
| 0.1 | 0.5 | GO:0045079 | negative regulation of chemokine biosynthetic process(GO:0045079) |
| 0.1 | 7.4 | GO:0005977 | glycogen metabolic process(GO:0005977) |
| 0.1 | 0.3 | GO:1901594 | detection of temperature stimulus involved in thermoception(GO:0050960) positive regulation of gastric acid secretion(GO:0060454) response to capsazepine(GO:1901594) |
| 0.1 | 3.9 | GO:0051220 | cytoplasmic sequestering of protein(GO:0051220) |
| 0.1 | 3.6 | GO:0000413 | protein peptidyl-prolyl isomerization(GO:0000413) |
| 0.1 | 1.7 | GO:1902236 | negative regulation of endoplasmic reticulum stress-induced intrinsic apoptotic signaling pathway(GO:1902236) |
| 0.1 | 0.6 | GO:0051045 | negative regulation of membrane protein ectodomain proteolysis(GO:0051045) |
| 0.1 | 4.3 | GO:0045652 | regulation of megakaryocyte differentiation(GO:0045652) |
| 0.1 | 0.7 | GO:0007512 | adult heart development(GO:0007512) |
| 0.1 | 12.9 | GO:0043523 | regulation of neuron apoptotic process(GO:0043523) |
| 0.1 | 2.3 | GO:0051489 | regulation of filopodium assembly(GO:0051489) |
| 0.1 | 6.5 | GO:0021987 | cerebral cortex development(GO:0021987) |
| 0.1 | 1.1 | GO:0007095 | mitotic G2 DNA damage checkpoint(GO:0007095) |
| 0.1 | 0.5 | GO:0032713 | negative regulation of interleukin-4 production(GO:0032713) |
| 0.1 | 3.9 | GO:0065002 | intracellular protein transmembrane transport(GO:0065002) |
| 0.1 | 2.6 | GO:0044380 | protein localization to cytoskeleton(GO:0044380) |
| 0.0 | 1.9 | GO:0038128 | ERBB2 signaling pathway(GO:0038128) |
| 0.0 | 0.1 | GO:0071105 | response to interleukin-11(GO:0071105) |
| 0.0 | 2.3 | GO:0006040 | amino sugar metabolic process(GO:0006040) |
| 0.0 | 0.2 | GO:1903715 | regulation of aerobic respiration(GO:1903715) |
| 0.0 | 0.5 | GO:0007638 | mechanosensory behavior(GO:0007638) |
| 0.0 | 0.2 | GO:0021873 | forebrain neuroblast division(GO:0021873) |
| 0.0 | 2.1 | GO:0046330 | positive regulation of JNK cascade(GO:0046330) |
| 0.0 | 0.1 | GO:0060023 | soft palate development(GO:0060023) |
| 0.0 | 5.1 | GO:0051056 | regulation of small GTPase mediated signal transduction(GO:0051056) |
| 0.0 | 3.3 | GO:0019886 | antigen processing and presentation of exogenous peptide antigen via MHC class II(GO:0019886) |
| 0.0 | 0.7 | GO:0008333 | endosome to lysosome transport(GO:0008333) |
| 0.0 | 0.2 | GO:0007175 | negative regulation of epidermal growth factor-activated receptor activity(GO:0007175) |
| 0.0 | 8.4 | GO:0006397 | mRNA processing(GO:0006397) |
| 0.0 | 2.1 | GO:0008277 | regulation of G-protein coupled receptor protein signaling pathway(GO:0008277) |
| 0.0 | 0.5 | GO:0034314 | Arp2/3 complex-mediated actin nucleation(GO:0034314) |
| 0.0 | 0.8 | GO:0043966 | histone H3 acetylation(GO:0043966) |
| 0.0 | 1.7 | GO:0007156 | homophilic cell adhesion via plasma membrane adhesion molecules(GO:0007156) |
| 0.0 | 0.0 | GO:0060214 | stem cell fate commitment(GO:0048865) endocardium formation(GO:0060214) |
| 0.0 | 0.4 | GO:0042073 | intraciliary transport(GO:0042073) |
Gene overrepresentation in cellular component category:
| Log-likelihood per target | Total log-likelihood | Term | Description |
|---|---|---|---|
| 5.6 | 16.9 | GO:0009328 | phenylalanine-tRNA ligase complex(GO:0009328) |
| 5.0 | 79.2 | GO:0005883 | neurofilament(GO:0005883) |
| 3.2 | 35.6 | GO:0005955 | calcineurin complex(GO:0005955) |
| 2.2 | 47.1 | GO:0005952 | cAMP-dependent protein kinase complex(GO:0005952) |
| 2.2 | 15.2 | GO:0070436 | Grb2-EGFR complex(GO:0070436) |
| 1.8 | 44.8 | GO:0001518 | voltage-gated sodium channel complex(GO:0001518) |
| 1.7 | 13.9 | GO:0060199 | clathrin-sculpted glutamate transport vesicle(GO:0060199) clathrin-sculpted glutamate transport vesicle membrane(GO:0060203) |
| 1.7 | 8.4 | GO:0032044 | DSIF complex(GO:0032044) |
| 1.7 | 15.1 | GO:0044327 | dendritic spine head(GO:0044327) |
| 1.3 | 7.7 | GO:0002178 | palmitoyltransferase complex(GO:0002178) |
| 1.2 | 12.0 | GO:0045180 | basal cortex(GO:0045180) |
| 0.8 | 3.4 | GO:0034457 | Mpp10 complex(GO:0034457) |
| 0.8 | 20.6 | GO:0071782 | endoplasmic reticulum tubular network(GO:0071782) |
| 0.8 | 11.8 | GO:0005687 | U4 snRNP(GO:0005687) |
| 0.7 | 20.1 | GO:0097386 | glial cell projection(GO:0097386) |
| 0.7 | 21.8 | GO:0032809 | neuronal cell body membrane(GO:0032809) cell body membrane(GO:0044298) |
| 0.7 | 3.9 | GO:0097539 | ciliary transition fiber(GO:0097539) |
| 0.6 | 3.9 | GO:0098827 | terminal cisterna(GO:0014802) endoplasmic reticulum subcompartment(GO:0098827) |
| 0.6 | 48.2 | GO:0099501 | synaptic vesicle membrane(GO:0030672) exocytic vesicle membrane(GO:0099501) |
| 0.6 | 63.4 | GO:0005905 | clathrin-coated pit(GO:0005905) |
| 0.5 | 12.8 | GO:0005849 | mRNA cleavage factor complex(GO:0005849) |
| 0.5 | 8.7 | GO:0005662 | DNA replication factor A complex(GO:0005662) |
| 0.5 | 3.8 | GO:0072487 | MSL complex(GO:0072487) |
| 0.4 | 31.9 | GO:0032154 | cleavage furrow(GO:0032154) cell surface furrow(GO:0097610) |
| 0.4 | 8.6 | GO:1990454 | L-type voltage-gated calcium channel complex(GO:1990454) |
| 0.4 | 26.5 | GO:0031463 | Cul3-RING ubiquitin ligase complex(GO:0031463) |
| 0.4 | 2.3 | GO:0005594 | collagen type IX trimer(GO:0005594) |
| 0.4 | 29.8 | GO:0014704 | intercalated disc(GO:0014704) |
| 0.4 | 21.0 | GO:0005871 | kinesin complex(GO:0005871) |
| 0.3 | 10.4 | GO:0030673 | axolemma(GO:0030673) |
| 0.3 | 2.3 | GO:0097165 | nuclear stress granule(GO:0097165) |
| 0.3 | 22.5 | GO:0005834 | heterotrimeric G-protein complex(GO:0005834) |
| 0.3 | 3.1 | GO:0070852 | cell body fiber(GO:0070852) |
| 0.3 | 2.7 | GO:0000125 | PCAF complex(GO:0000125) |
| 0.3 | 4.3 | GO:0008074 | guanylate cyclase complex, soluble(GO:0008074) |
| 0.3 | 68.4 | GO:0005802 | trans-Golgi network(GO:0005802) |
| 0.3 | 40.0 | GO:0043204 | perikaryon(GO:0043204) |
| 0.3 | 3.1 | GO:0030870 | Mre11 complex(GO:0030870) |
| 0.3 | 90.0 | GO:0014069 | postsynaptic density(GO:0014069) postsynaptic specialization(GO:0099572) |
| 0.2 | 2.7 | GO:0032839 | dendrite cytoplasm(GO:0032839) |
| 0.2 | 2.1 | GO:0031464 | Cul4A-RING E3 ubiquitin ligase complex(GO:0031464) |
| 0.2 | 1.4 | GO:0034448 | EGO complex(GO:0034448) Gtr1-Gtr2 GTPase complex(GO:1990131) |
| 0.2 | 6.5 | GO:0031527 | filopodium membrane(GO:0031527) |
| 0.2 | 4.4 | GO:0016580 | Sin3 complex(GO:0016580) |
| 0.2 | 1.5 | GO:0016272 | prefoldin complex(GO:0016272) |
| 0.2 | 1.2 | GO:0097197 | tetraspanin-enriched microdomain(GO:0097197) |
| 0.2 | 2.0 | GO:0031462 | Cul2-RING ubiquitin ligase complex(GO:0031462) |
| 0.2 | 7.3 | GO:0000159 | protein phosphatase type 2A complex(GO:0000159) |
| 0.2 | 0.8 | GO:0000818 | nuclear MIS12/MIND complex(GO:0000818) |
| 0.2 | 7.5 | GO:0031594 | neuromuscular junction(GO:0031594) |
| 0.2 | 2.0 | GO:0090543 | Flemming body(GO:0090543) |
| 0.2 | 3.6 | GO:0005721 | pericentric heterochromatin(GO:0005721) |
| 0.2 | 18.5 | GO:0055037 | recycling endosome(GO:0055037) |
| 0.1 | 4.9 | GO:0030687 | preribosome, large subunit precursor(GO:0030687) |
| 0.1 | 7.8 | GO:0005782 | peroxisomal matrix(GO:0005782) microbody lumen(GO:0031907) |
| 0.1 | 14.9 | GO:0005875 | microtubule associated complex(GO:0005875) |
| 0.1 | 13.1 | GO:0034705 | voltage-gated potassium channel complex(GO:0008076) potassium channel complex(GO:0034705) |
| 0.1 | 38.9 | GO:0031301 | integral component of organelle membrane(GO:0031301) |
| 0.1 | 0.5 | GO:0032807 | DNA ligase IV complex(GO:0032807) |
| 0.1 | 0.4 | GO:0002081 | inner acrosomal membrane(GO:0002079) outer acrosomal membrane(GO:0002081) |
| 0.1 | 21.4 | GO:0001650 | fibrillar center(GO:0001650) |
| 0.1 | 2.5 | GO:0044439 | microbody part(GO:0044438) peroxisomal part(GO:0044439) |
| 0.1 | 2.6 | GO:0080008 | Cul4-RING E3 ubiquitin ligase complex(GO:0080008) |
| 0.1 | 15.0 | GO:0030018 | Z disc(GO:0030018) |
| 0.1 | 0.5 | GO:0035841 | growing cell tip(GO:0035838) new growing cell tip(GO:0035841) cell tip(GO:0051286) |
| 0.1 | 1.4 | GO:0001673 | male germ cell nucleus(GO:0001673) |
| 0.1 | 1.6 | GO:0042589 | zymogen granule membrane(GO:0042589) |
| 0.1 | 1.1 | GO:0071014 | post-mRNA release spliceosomal complex(GO:0071014) |
| 0.1 | 6.5 | GO:0005902 | microvillus(GO:0005902) |
| 0.1 | 0.8 | GO:0000124 | SAGA complex(GO:0000124) |
| 0.1 | 12.0 | GO:0005793 | endoplasmic reticulum-Golgi intermediate compartment(GO:0005793) |
| 0.1 | 3.3 | GO:0034451 | centriolar satellite(GO:0034451) |
| 0.1 | 0.9 | GO:0016529 | sarcoplasmic reticulum(GO:0016529) |
| 0.1 | 1.6 | GO:0031089 | platelet dense granule lumen(GO:0031089) |
| 0.1 | 2.3 | GO:0001917 | photoreceptor inner segment(GO:0001917) |
| 0.1 | 24.3 | GO:0043025 | neuronal cell body(GO:0043025) |
| 0.1 | 6.9 | GO:0031901 | early endosome membrane(GO:0031901) |
| 0.1 | 2.1 | GO:0042629 | mast cell granule(GO:0042629) |
| 0.1 | 19.8 | GO:0005874 | microtubule(GO:0005874) |
| 0.1 | 0.3 | GO:0070187 | telosome(GO:0070187) |
| 0.1 | 5.3 | GO:0000922 | spindle pole(GO:0000922) |
| 0.1 | 3.8 | GO:0042641 | actomyosin(GO:0042641) |
| 0.1 | 2.3 | GO:0030658 | transport vesicle membrane(GO:0030658) |
| 0.1 | 46.2 | GO:0005789 | endoplasmic reticulum membrane(GO:0005789) |
| 0.1 | 2.7 | GO:0042734 | presynaptic membrane(GO:0042734) |
| 0.0 | 17.9 | GO:0000139 | Golgi membrane(GO:0000139) |
| 0.0 | 0.9 | GO:0005791 | rough endoplasmic reticulum(GO:0005791) |
| 0.0 | 4.5 | GO:0030133 | transport vesicle(GO:0030133) |
| 0.0 | 0.3 | GO:0002193 | MAML1-RBP-Jkappa- ICN1 complex(GO:0002193) |
| 0.0 | 0.5 | GO:0005885 | Arp2/3 protein complex(GO:0005885) |
| 0.0 | 3.4 | GO:0005741 | mitochondrial outer membrane(GO:0005741) |
| 0.0 | 0.9 | GO:0001533 | cornified envelope(GO:0001533) |
| 0.0 | 9.8 | GO:0048471 | perinuclear region of cytoplasm(GO:0048471) |
| 0.0 | 0.4 | GO:0030992 | intraciliary transport particle B(GO:0030992) |
| 0.0 | 1.2 | GO:0031234 | extrinsic component of cytoplasmic side of plasma membrane(GO:0031234) |
| 0.0 | 0.3 | GO:0034361 | very-low-density lipoprotein particle(GO:0034361) triglyceride-rich lipoprotein particle(GO:0034385) |
| 0.0 | 2.0 | GO:0005769 | early endosome(GO:0005769) |
| 0.0 | 0.5 | GO:1902711 | GABA-A receptor complex(GO:1902711) |
| 0.0 | 0.5 | GO:0043679 | axon terminus(GO:0043679) |
Gene overrepresentation in molecular function category:
| Log-likelihood per target | Total log-likelihood | Term | Description |
|---|---|---|---|
| 16.4 | 65.6 | GO:0004698 | calcium-dependent protein kinase C activity(GO:0004698) |
| 9.0 | 44.8 | GO:0086062 | voltage-gated sodium channel activity involved in Purkinje myocyte action potential(GO:0086062) |
| 6.9 | 20.6 | GO:0031849 | olfactory receptor binding(GO:0031849) |
| 4.9 | 19.6 | GO:0016211 | glutamate-ammonia ligase activity(GO:0004356) ammonia ligase activity(GO:0016211) acid-ammonia (or amide) ligase activity(GO:0016880) |
| 4.1 | 16.5 | GO:0004852 | uroporphyrinogen-III synthase activity(GO:0004852) |
| 4.0 | 35.6 | GO:0033192 | calmodulin-dependent protein phosphatase activity(GO:0033192) |
| 3.8 | 30.5 | GO:0005094 | Rho GDP-dissociation inhibitor activity(GO:0005094) |
| 3.4 | 16.9 | GO:0004826 | phenylalanine-tRNA ligase activity(GO:0004826) |
| 2.8 | 13.9 | GO:0015319 | sodium:inorganic phosphate symporter activity(GO:0015319) |
| 2.7 | 8.2 | GO:0008294 | calcium- and calmodulin-responsive adenylate cyclase activity(GO:0008294) |
| 2.7 | 18.9 | GO:0016403 | dimethylargininase activity(GO:0016403) |
| 2.7 | 70.1 | GO:0005545 | 1-phosphatidylinositol binding(GO:0005545) |
| 2.4 | 47.1 | GO:0008603 | cAMP-dependent protein kinase regulator activity(GO:0008603) |
| 2.2 | 15.5 | GO:0070739 | protein-glutamic acid ligase activity(GO:0070739) |
| 2.2 | 10.8 | GO:0008532 | N-acetyllactosaminide beta-1,3-N-acetylglucosaminyltransferase activity(GO:0008532) |
| 1.9 | 11.7 | GO:0038062 | protein tyrosine kinase collagen receptor activity(GO:0038062) |
| 1.9 | 15.0 | GO:0004111 | creatine kinase activity(GO:0004111) |
| 1.9 | 7.5 | GO:0008467 | [heparan sulfate]-glucosamine 3-sulfotransferase 1 activity(GO:0008467) |
| 1.8 | 5.5 | GO:0086059 | voltage-gated calcium channel activity involved SA node cell action potential(GO:0086059) |
| 1.8 | 7.2 | GO:0032422 | purine-rich negative regulatory element binding(GO:0032422) |
| 1.6 | 14.0 | GO:0005225 | volume-sensitive anion channel activity(GO:0005225) |
| 1.4 | 4.3 | GO:0032093 | SAM domain binding(GO:0032093) |
| 1.4 | 4.2 | GO:0033749 | histone demethylase activity (H3-R2 specific)(GO:0033746) histone demethylase activity (H4-R3 specific)(GO:0033749) |
| 1.3 | 34.6 | GO:0035259 | glucocorticoid receptor binding(GO:0035259) |
| 1.3 | 3.8 | GO:0033989 | 3alpha,7alpha,12alpha-trihydroxy-5beta-cholest-24-enoyl-CoA hydratase activity(GO:0033989) 17-beta-hydroxysteroid dehydrogenase (NAD+) activity(GO:0044594) |
| 1.2 | 3.7 | GO:0070290 | N-acylphosphatidylethanolamine-specific phospholipase D activity(GO:0070290) |
| 1.0 | 4.0 | GO:0044736 | acid-sensing ion channel activity(GO:0044736) |
| 1.0 | 3.9 | GO:0051734 | ATP-dependent polydeoxyribonucleotide 5'-hydroxyl-kinase activity(GO:0046404) polydeoxyribonucleotide kinase activity(GO:0051733) ATP-dependent polynucleotide kinase activity(GO:0051734) |
| 1.0 | 4.8 | GO:0070097 | delta-catenin binding(GO:0070097) |
| 0.9 | 9.2 | GO:0004445 | inositol-polyphosphate 5-phosphatase activity(GO:0004445) PH domain binding(GO:0042731) |
| 0.9 | 12.4 | GO:0015501 | glutamate:sodium symporter activity(GO:0015501) |
| 0.9 | 3.5 | GO:0016524 | latrotoxin receptor activity(GO:0016524) |
| 0.9 | 12.0 | GO:0005078 | MAP-kinase scaffold activity(GO:0005078) |
| 0.9 | 8.6 | GO:0004064 | arylesterase activity(GO:0004064) |
| 0.8 | 10.1 | GO:0004065 | arylsulfatase activity(GO:0004065) |
| 0.8 | 3.4 | GO:0042134 | rRNA primary transcript binding(GO:0042134) |
| 0.8 | 28.4 | GO:0008395 | steroid hydroxylase activity(GO:0008395) |
| 0.8 | 33.1 | GO:0017091 | AU-rich element binding(GO:0017091) |
| 0.8 | 3.1 | GO:0015220 | choline transmembrane transporter activity(GO:0015220) |
| 0.8 | 4.6 | GO:0042392 | sphingosine-1-phosphate phosphatase activity(GO:0042392) |
| 0.8 | 3.1 | GO:0031826 | type 2A serotonin receptor binding(GO:0031826) |
| 0.8 | 12.0 | GO:0002162 | dystroglycan binding(GO:0002162) |
| 0.7 | 8.9 | GO:0031821 | G-protein coupled serotonin receptor binding(GO:0031821) |
| 0.7 | 8.2 | GO:0004075 | biotin carboxylase activity(GO:0004075) |
| 0.7 | 17.6 | GO:0031489 | myosin V binding(GO:0031489) |
| 0.7 | 8.5 | GO:0005168 | neurotrophin TRKA receptor binding(GO:0005168) |
| 0.7 | 36.7 | GO:0019894 | kinesin binding(GO:0019894) |
| 0.6 | 118.9 | GO:0005200 | structural constituent of cytoskeleton(GO:0005200) |
| 0.6 | 2.8 | GO:0004792 | thiosulfate sulfurtransferase activity(GO:0004792) |
| 0.5 | 13.4 | GO:0017075 | syntaxin-1 binding(GO:0017075) |
| 0.5 | 4.2 | GO:1990405 | protein antigen binding(GO:1990405) |
| 0.5 | 1.5 | GO:0008330 | protein tyrosine/threonine phosphatase activity(GO:0008330) |
| 0.5 | 20.2 | GO:0005484 | SNAP receptor activity(GO:0005484) |
| 0.5 | 3.8 | GO:0043996 | histone acetyltransferase activity (H4-K5 specific)(GO:0043995) histone acetyltransferase activity (H4-K8 specific)(GO:0043996) histone acetyltransferase activity (H4-K16 specific)(GO:0046972) |
| 0.5 | 2.7 | GO:0004468 | lysine N-acetyltransferase activity, acting on acetyl phosphate as donor(GO:0004468) |
| 0.4 | 12.7 | GO:0005388 | calcium-transporting ATPase activity(GO:0005388) |
| 0.4 | 6.5 | GO:0001222 | transcription corepressor binding(GO:0001222) |
| 0.4 | 7.7 | GO:0019706 | protein-cysteine S-palmitoyltransferase activity(GO:0019706) protein-cysteine S-acyltransferase activity(GO:0019707) |
| 0.4 | 1.4 | GO:0001855 | complement component C4b binding(GO:0001855) |
| 0.3 | 1.0 | GO:0016838 | carbon-oxygen lyase activity, acting on phosphates(GO:0016838) |
| 0.3 | 1.6 | GO:0005314 | high-affinity glutamate transmembrane transporter activity(GO:0005314) |
| 0.3 | 3.4 | GO:0086056 | voltage-gated calcium channel activity involved in AV node cell action potential(GO:0086056) |
| 0.3 | 4.9 | GO:0042043 | neurexin family protein binding(GO:0042043) |
| 0.3 | 6.4 | GO:0052629 | phosphatidylinositol-3,5-bisphosphate 3-phosphatase activity(GO:0052629) |
| 0.3 | 2.3 | GO:0060002 | plus-end directed microfilament motor activity(GO:0060002) |
| 0.3 | 3.6 | GO:0070679 | inositol 1,4,5 trisphosphate binding(GO:0070679) |
| 0.3 | 2.8 | GO:0022841 | potassium ion leak channel activity(GO:0022841) |
| 0.3 | 5.2 | GO:0008331 | high voltage-gated calcium channel activity(GO:0008331) |
| 0.3 | 2.3 | GO:0030020 | extracellular matrix structural constituent conferring tensile strength(GO:0030020) |
| 0.3 | 20.9 | GO:0048365 | Rac GTPase binding(GO:0048365) |
| 0.2 | 1.2 | GO:0016176 | superoxide-generating NADPH oxidase activator activity(GO:0016176) |
| 0.2 | 2.6 | GO:0016861 | intramolecular oxidoreductase activity, interconverting aldoses and ketoses(GO:0016861) |
| 0.2 | 7.4 | GO:0043015 | gamma-tubulin binding(GO:0043015) |
| 0.2 | 1.8 | GO:0019863 | immunoglobulin receptor activity(GO:0019763) IgE binding(GO:0019863) |
| 0.2 | 3.1 | GO:0051864 | histone demethylase activity (H3-K36 specific)(GO:0051864) |
| 0.2 | 8.0 | GO:0031683 | G-protein beta/gamma-subunit complex binding(GO:0031683) |
| 0.2 | 1.3 | GO:0043225 | anion transmembrane-transporting ATPase activity(GO:0043225) |
| 0.2 | 6.2 | GO:0071949 | FAD binding(GO:0071949) |
| 0.2 | 8.2 | GO:0070182 | DNA polymerase binding(GO:0070182) |
| 0.2 | 2.4 | GO:0008499 | UDP-galactose:beta-N-acetylglucosamine beta-1,3-galactosyltransferase activity(GO:0008499) |
| 0.2 | 25.3 | GO:0001618 | virus receptor activity(GO:0001618) |
| 0.2 | 4.2 | GO:0001011 | transcription factor activity, sequence-specific DNA binding, RNA polymerase recruiting(GO:0001011) transcription factor activity, TFIIB-class binding(GO:0001087) |
| 0.2 | 2.2 | GO:0015280 | ligand-gated sodium channel activity(GO:0015280) |
| 0.2 | 8.7 | GO:0008139 | nuclear localization sequence binding(GO:0008139) |
| 0.2 | 0.9 | GO:0005294 | neutral L-amino acid secondary active transmembrane transporter activity(GO:0005294) |
| 0.2 | 7.9 | GO:0004712 | protein serine/threonine/tyrosine kinase activity(GO:0004712) |
| 0.2 | 0.9 | GO:0004771 | sterol esterase activity(GO:0004771) methylumbelliferyl-acetate deacetylase activity(GO:0047374) |
| 0.2 | 0.5 | GO:0004938 | alpha2-adrenergic receptor activity(GO:0004938) |
| 0.2 | 0.5 | GO:0005026 | transforming growth factor beta receptor activity, type II(GO:0005026) |
| 0.2 | 3.4 | GO:0005095 | GTPase inhibitor activity(GO:0005095) |
| 0.2 | 6.3 | GO:0005547 | phosphatidylinositol-3,4,5-trisphosphate binding(GO:0005547) |
| 0.2 | 36.9 | GO:0005057 | receptor signaling protein activity(GO:0005057) |
| 0.2 | 1.4 | GO:0051575 | 5'-deoxyribose-5-phosphate lyase activity(GO:0051575) |
| 0.2 | 5.0 | GO:0005109 | frizzled binding(GO:0005109) |
| 0.2 | 6.1 | GO:0008188 | neuropeptide receptor activity(GO:0008188) |
| 0.2 | 11.0 | GO:0030971 | receptor tyrosine kinase binding(GO:0030971) |
| 0.2 | 8.6 | GO:0070412 | R-SMAD binding(GO:0070412) |
| 0.2 | 3.6 | GO:0005527 | macrolide binding(GO:0005527) FK506 binding(GO:0005528) |
| 0.1 | 1.6 | GO:1904264 | ubiquitin protein ligase activity involved in ERAD pathway(GO:1904264) |
| 0.1 | 2.8 | GO:0038191 | neuropilin binding(GO:0038191) |
| 0.1 | 37.4 | GO:0003924 | GTPase activity(GO:0003924) |
| 0.1 | 13.3 | GO:0004867 | serine-type endopeptidase inhibitor activity(GO:0004867) |
| 0.1 | 1.5 | GO:0019215 | intermediate filament binding(GO:0019215) |
| 0.1 | 5.4 | GO:0019905 | syntaxin binding(GO:0019905) |
| 0.1 | 2.1 | GO:0050786 | RAGE receptor binding(GO:0050786) |
| 0.1 | 55.0 | GO:0004842 | ubiquitin-protein transferase activity(GO:0004842) |
| 0.1 | 12.7 | GO:0005249 | voltage-gated potassium channel activity(GO:0005249) |
| 0.1 | 2.5 | GO:0000062 | fatty-acyl-CoA binding(GO:0000062) |
| 0.1 | 0.3 | GO:0060001 | minus-end directed microfilament motor activity(GO:0060001) |
| 0.1 | 0.9 | GO:0089720 | caspase binding(GO:0089720) |
| 0.1 | 3.8 | GO:0017048 | Rho GTPase binding(GO:0017048) |
| 0.1 | 1.5 | GO:0015379 | potassium:chloride symporter activity(GO:0015379) potassium ion symporter activity(GO:0022820) |
| 0.1 | 3.1 | GO:0004622 | lysophospholipase activity(GO:0004622) |
| 0.1 | 2.6 | GO:0030676 | Rac guanyl-nucleotide exchange factor activity(GO:0030676) |
| 0.1 | 21.8 | GO:0008514 | organic anion transmembrane transporter activity(GO:0008514) |
| 0.1 | 2.7 | GO:0003887 | DNA-directed DNA polymerase activity(GO:0003887) |
| 0.1 | 11.0 | GO:0019888 | protein phosphatase regulator activity(GO:0019888) |
| 0.1 | 24.2 | GO:0044822 | mRNA binding(GO:0003729) poly(A) RNA binding(GO:0044822) |
| 0.1 | 1.1 | GO:0017081 | chloride channel regulator activity(GO:0017081) |
| 0.1 | 2.6 | GO:1990841 | promoter-specific chromatin binding(GO:1990841) |
| 0.1 | 1.0 | GO:0015245 | fatty acid transporter activity(GO:0015245) |
| 0.1 | 0.5 | GO:0003910 | DNA ligase (ATP) activity(GO:0003910) |
| 0.1 | 2.3 | GO:0001972 | retinoic acid binding(GO:0001972) |
| 0.1 | 3.1 | GO:0030544 | Hsp70 protein binding(GO:0030544) |
| 0.1 | 5.1 | GO:0098811 | transcriptional activator activity, RNA polymerase II transcription factor binding(GO:0001190) transcriptional repressor activity, RNA polymerase II activating transcription factor binding(GO:0098811) |
| 0.1 | 0.5 | GO:0001640 | adenylate cyclase inhibiting G-protein coupled glutamate receptor activity(GO:0001640) G-protein coupled glutamate receptor activity(GO:0098988) |
| 0.1 | 0.9 | GO:0015929 | hexosaminidase activity(GO:0015929) |
| 0.1 | 6.2 | GO:0020037 | heme binding(GO:0020037) |
| 0.1 | 4.7 | GO:0004536 | deoxyribonuclease activity(GO:0004536) |
| 0.0 | 0.1 | GO:0050698 | proteoglycan sulfotransferase activity(GO:0050698) |
| 0.0 | 1.5 | GO:0044183 | protein binding involved in protein folding(GO:0044183) |
| 0.0 | 0.5 | GO:0022851 | GABA-gated chloride ion channel activity(GO:0022851) |
| 0.0 | 0.3 | GO:0000150 | recombinase activity(GO:0000150) |
| 0.0 | 0.9 | GO:0005544 | calcium-dependent phospholipid binding(GO:0005544) |
| 0.0 | 1.2 | GO:0051539 | 4 iron, 4 sulfur cluster binding(GO:0051539) |
| 0.0 | 1.0 | GO:0017112 | Rab guanyl-nucleotide exchange factor activity(GO:0017112) |
| 0.0 | 0.4 | GO:0004435 | phosphatidylinositol phospholipase C activity(GO:0004435) |
| 0.0 | 1.6 | GO:0051082 | unfolded protein binding(GO:0051082) |
| 0.0 | 0.3 | GO:0015662 | ATPase activity, coupled to transmembrane movement of ions, phosphorylative mechanism(GO:0015662) |
| 0.0 | 4.5 | GO:0005096 | GTPase activator activity(GO:0005096) |
| 0.0 | 2.9 | GO:0008047 | enzyme activator activity(GO:0008047) |
| 0.0 | 0.1 | GO:0035497 | cAMP response element binding(GO:0035497) |
Gene overrepresentation in curated gene sets: canonical pathways category:
| Log-likelihood per target | Total log-likelihood | Term | Description |
|---|---|---|---|
| 3.0 | 65.6 | PID TCR RAS PATHWAY | Ras signaling in the CD4+ TCR pathway |
| 0.9 | 35.4 | PID INSULIN GLUCOSE PATHWAY | Insulin-mediated glucose transport |
| 0.7 | 27.7 | PID HDAC CLASSIII PATHWAY | Signaling events mediated by HDAC Class III |
| 0.7 | 35.6 | PID TCR CALCIUM PATHWAY | Calcium signaling in the CD4+ TCR pathway |
| 0.7 | 16.2 | PID LPA4 PATHWAY | LPA4-mediated signaling events |
| 0.7 | 19.8 | SA B CELL RECEPTOR COMPLEXES | Antigen binding to B cell receptors activates protein tyrosine kinases, such as the Src family, which ultimate activate MAP kinases. |
| 0.5 | 32.4 | PID INTEGRIN A4B1 PATHWAY | Alpha4 beta1 integrin signaling events |
| 0.4 | 17.1 | PID S1P S1P3 PATHWAY | S1P3 pathway |
| 0.4 | 33.1 | PID RHOA REG PATHWAY | Regulation of RhoA activity |
| 0.4 | 20.8 | SIG REGULATION OF THE ACTIN CYTOSKELETON BY RHO GTPASES | Genes related to regulation of the actin cytoskeleton |
| 0.4 | 14.5 | PID NETRIN PATHWAY | Netrin-mediated signaling events |
| 0.3 | 8.7 | PID ERB GENOMIC PATHWAY | Validated nuclear estrogen receptor beta network |
| 0.2 | 8.6 | PID WNT CANONICAL PATHWAY | Canonical Wnt signaling pathway |
| 0.2 | 13.4 | PID ECADHERIN STABILIZATION PATHWAY | Stabilization and expansion of the E-cadherin adherens junction |
| 0.2 | 1.7 | PID WNT SIGNALING PATHWAY | Wnt signaling network |
| 0.2 | 6.3 | PID ARF6 PATHWAY | Arf6 signaling events |
| 0.2 | 4.4 | PID CONE PATHWAY | Visual signal transduction: Cones |
| 0.2 | 6.7 | PID IL8 CXCR2 PATHWAY | IL8- and CXCR2-mediated signaling events |
| 0.1 | 6.9 | PID TRKR PATHWAY | Neurotrophic factor-mediated Trk receptor signaling |
| 0.1 | 5.9 | PID SHP2 PATHWAY | SHP2 signaling |
| 0.1 | 2.0 | PID CXCR4 PATHWAY | CXCR4-mediated signaling events |
| 0.1 | 10.6 | PID BETA CATENIN NUC PATHWAY | Regulation of nuclear beta catenin signaling and target gene transcription |
| 0.1 | 7.8 | ST FAS SIGNALING PATHWAY | Fas Signaling Pathway |
| 0.1 | 1.9 | PID DNA PK PATHWAY | DNA-PK pathway in nonhomologous end joining |
| 0.1 | 20.6 | NABA ECM REGULATORS | Genes encoding enzymes and their regulators involved in the remodeling of the extracellular matrix |
| 0.1 | 0.5 | PID ALK2 PATHWAY | ALK2 signaling events |
| 0.0 | 2.3 | NABA COLLAGENS | Genes encoding collagen proteins |
| 0.0 | 0.9 | SA PROGRAMMED CELL DEATH | Programmed cell death, or apoptosis, eliminates damaged or unneeded cells. |
| 0.0 | 1.2 | PID RAC1 REG PATHWAY | Regulation of RAC1 activity |
| 0.0 | 0.5 | PID P38 MK2 PATHWAY | p38 signaling mediated by MAPKAP kinases |
| 0.0 | 4.6 | NABA ECM AFFILIATED | Genes encoding proteins affiliated structurally or functionally to extracellular matrix proteins |
| 0.0 | 0.4 | PID P38 MKK3 6PATHWAY | p38 MAPK signaling pathway |
| 0.0 | 0.3 | PID PI3K PLC TRK PATHWAY | Trk receptor signaling mediated by PI3K and PLC-gamma |
| 0.0 | 0.6 | PID P53 REGULATION PATHWAY | p53 pathway |
| 0.0 | 0.6 | PID HEDGEHOG GLI PATHWAY | Hedgehog signaling events mediated by Gli proteins |
| 0.0 | 0.2 | PID ERBB4 PATHWAY | ErbB4 signaling events |
Gene overrepresentation in curated gene sets: REACTOME pathways category:
| Log-likelihood per target | Total log-likelihood | Term | Description |
|---|---|---|---|
| 3.0 | 78.9 | REACTOME TRAFFICKING OF GLUR2 CONTAINING AMPA RECEPTORS | Genes involved in Trafficking of GluR2-containing AMPA receptors |
| 2.4 | 28.3 | REACTOME SYNTHESIS OF BILE ACIDS AND BILE SALTS VIA 24 HYDROXYCHOLESTEROL | Genes involved in Synthesis of bile acids and bile salts via 24-hydroxycholesterol |
| 1.7 | 55.2 | REACTOME PKA MEDIATED PHOSPHORYLATION OF CREB | Genes involved in PKA-mediated phosphorylation of CREB |
| 1.6 | 8.0 | REACTOME ADENYLATE CYCLASE ACTIVATING PATHWAY | Genes involved in Adenylate cyclase activating pathway |
| 1.3 | 51.0 | REACTOME DARPP 32 EVENTS | Genes involved in DARPP-32 events |
| 1.1 | 48.9 | REACTOME INTERACTION BETWEEN L1 AND ANKYRINS | Genes involved in Interaction between L1 and Ankyrins |
| 1.0 | 21.7 | REACTOME SIGNAL ATTENUATION | Genes involved in Signal attenuation |
| 0.8 | 23.8 | REACTOME POST CHAPERONIN TUBULIN FOLDING PATHWAY | Genes involved in Post-chaperonin tubulin folding pathway |
| 0.8 | 10.1 | REACTOME THE ACTIVATION OF ARYLSULFATASES | Genes involved in The activation of arylsulfatases |
| 0.8 | 20.2 | REACTOME PROTEOLYTIC CLEAVAGE OF SNARE COMPLEX PROTEINS | Genes involved in Proteolytic cleavage of SNARE complex proteins |
| 0.6 | 19.3 | REACTOME RAP1 SIGNALLING | Genes involved in Rap1 signalling |
| 0.6 | 13.3 | REACTOME GLUTAMATE NEUROTRANSMITTER RELEASE CYCLE | Genes involved in Glutamate Neurotransmitter Release Cycle |
| 0.6 | 16.5 | REACTOME METABOLISM OF PORPHYRINS | Genes involved in Metabolism of porphyrins |
| 0.5 | 21.8 | REACTOME INHIBITION OF INSULIN SECRETION BY ADRENALINE NORADRENALINE | Genes involved in Inhibition of Insulin Secretion by Adrenaline/Noradrenaline |
| 0.5 | 8.6 | REACTOME REVERSIBLE HYDRATION OF CARBON DIOXIDE | Genes involved in Reversible Hydration of Carbon Dioxide |
| 0.5 | 13.5 | REACTOME AMINO ACID SYNTHESIS AND INTERCONVERSION TRANSAMINATION | Genes involved in Amino acid synthesis and interconversion (transamination) |
| 0.4 | 21.8 | REACTOME VOLTAGE GATED POTASSIUM CHANNELS | Genes involved in Voltage gated Potassium channels |
| 0.4 | 6.4 | REACTOME SYNTHESIS OF PIPS AT THE LATE ENDOSOME MEMBRANE | Genes involved in Synthesis of PIPs at the late endosome membrane |
| 0.4 | 2.8 | REACTOME TANDEM PORE DOMAIN POTASSIUM CHANNELS | Genes involved in Tandem pore domain potassium channels |
| 0.4 | 3.1 | REACTOME THROMBOXANE SIGNALLING THROUGH TP RECEPTOR | Genes involved in Thromboxane signalling through TP receptor |
| 0.4 | 5.2 | REACTOME G BETA GAMMA SIGNALLING THROUGH PI3KGAMMA | Genes involved in G beta:gamma signalling through PI3Kgamma |
| 0.3 | 7.0 | REACTOME PROCESSING OF INTRONLESS PRE MRNAS | Genes involved in Processing of Intronless Pre-mRNAs |
| 0.3 | 7.8 | REACTOME ACTIVATION OF RAC | Genes involved in Activation of Rac |
| 0.3 | 3.8 | REACTOME SYNTHESIS OF BILE ACIDS AND BILE SALTS VIA 7ALPHA HYDROXYCHOLESTEROL | Genes involved in Synthesis of bile acids and bile salts via 7alpha-hydroxycholesterol |
| 0.2 | 7.1 | REACTOME ABORTIVE ELONGATION OF HIV1 TRANSCRIPT IN THE ABSENCE OF TAT | Genes involved in Abortive elongation of HIV-1 transcript in the absence of Tat |
| 0.2 | 39.0 | REACTOME SIGNALING BY RHO GTPASES | Genes involved in Signaling by Rho GTPases |
| 0.2 | 7.3 | REACTOME CREB PHOSPHORYLATION THROUGH THE ACTIVATION OF RAS | Genes involved in CREB phosphorylation through the activation of Ras |
| 0.2 | 3.0 | REACTOME NOTCH HLH TRANSCRIPTION PATHWAY | Genes involved in Notch-HLH transcription pathway |
| 0.2 | 2.4 | REACTOME ROLE OF DCC IN REGULATING APOPTOSIS | Genes involved in Role of DCC in regulating apoptosis |
| 0.1 | 1.4 | REACTOME CREATION OF C4 AND C2 ACTIVATORS | Genes involved in Creation of C4 and C2 activators |
| 0.1 | 9.6 | REACTOME AMINO ACID AND OLIGOPEPTIDE SLC TRANSPORTERS | Genes involved in Amino acid and oligopeptide SLC transporters |
| 0.1 | 3.7 | REACTOME SYNTHESIS OF PA | Genes involved in Synthesis of PA |
| 0.1 | 3.1 | REACTOME AMINE COMPOUND SLC TRANSPORTERS | Genes involved in Amine compound SLC transporters |
| 0.1 | 2.7 | REACTOME OTHER SEMAPHORIN INTERACTIONS | Genes involved in Other semaphorin interactions |
| 0.1 | 1.4 | REACTOME SEMA3A PLEXIN REPULSION SIGNALING BY INHIBITING INTEGRIN ADHESION | Genes involved in SEMA3A-Plexin repulsion signaling by inhibiting Integrin adhesion |
| 0.1 | 1.7 | REACTOME MTORC1 MEDIATED SIGNALLING | Genes involved in mTORC1-mediated signalling |
| 0.1 | 2.6 | REACTOME SULFUR AMINO ACID METABOLISM | Genes involved in Sulfur amino acid metabolism |
| 0.1 | 1.6 | REACTOME NFKB ACTIVATION THROUGH FADD RIP1 PATHWAY MEDIATED BY CASPASE 8 AND10 | Genes involved in NF-kB activation through FADD/RIP-1 pathway mediated by caspase-8 and -10 |
| 0.1 | 1.2 | REACTOME PLATELET ADHESION TO EXPOSED COLLAGEN | Genes involved in Platelet Adhesion to exposed collagen |
| 0.1 | 2.0 | REACTOME ENDOSOMAL SORTING COMPLEX REQUIRED FOR TRANSPORT ESCRT | Genes involved in Endosomal Sorting Complex Required For Transport (ESCRT) |
| 0.1 | 3.3 | REACTOME ADHERENS JUNCTIONS INTERACTIONS | Genes involved in Adherens junctions interactions |
| 0.1 | 1.0 | REACTOME TETRAHYDROBIOPTERIN BH4 SYNTHESIS RECYCLING SALVAGE AND REGULATION | Genes involved in Tetrahydrobiopterin (BH4) synthesis, recycling, salvage and regulation |
| 0.1 | 1.5 | REACTOME PREFOLDIN MEDIATED TRANSFER OF SUBSTRATE TO CCT TRIC | Genes involved in Prefoldin mediated transfer of substrate to CCT/TriC |
| 0.1 | 3.4 | REACTOME CYTOCHROME P450 ARRANGED BY SUBSTRATE TYPE | Genes involved in Cytochrome P450 - arranged by substrate type |
| 0.1 | 1.9 | REACTOME SIGNALING BY ERBB2 | Genes involved in Signaling by ERBB2 |
| 0.0 | 0.3 | REACTOME PACKAGING OF TELOMERE ENDS | Genes involved in Packaging Of Telomere Ends |
| 0.0 | 0.7 | REACTOME CITRIC ACID CYCLE TCA CYCLE | Genes involved in Citric acid cycle (TCA cycle) |
| 0.0 | 2.8 | REACTOME METABOLISM OF VITAMINS AND COFACTORS | Genes involved in Metabolism of vitamins and cofactors |
| 0.0 | 1.6 | REACTOME NETRIN1 SIGNALING | Genes involved in Netrin-1 signaling |
| 0.0 | 0.3 | REACTOME GAP JUNCTION DEGRADATION | Genes involved in Gap junction degradation |
| 0.0 | 1.2 | REACTOME LATENT INFECTION OF HOMO SAPIENS WITH MYCOBACTERIUM TUBERCULOSIS | Genes involved in Latent infection of Homo sapiens with Mycobacterium tuberculosis |
| 0.0 | 0.5 | REACTOME INTEGRATION OF PROVIRUS | Genes involved in Integration of provirus |
| 0.0 | 3.3 | REACTOME MHC CLASS II ANTIGEN PRESENTATION | Genes involved in MHC class II antigen presentation |
| 0.0 | 0.5 | REACTOME CLASS C 3 METABOTROPIC GLUTAMATE PHEROMONE RECEPTORS | Genes involved in Class C/3 (Metabotropic glutamate/pheromone receptors) |
| 0.0 | 1.0 | REACTOME COLLAGEN FORMATION | Genes involved in Collagen formation |
| 0.0 | 0.5 | REACTOME GABA A RECEPTOR ACTIVATION | Genes involved in GABA A receptor activation |
| 0.0 | 2.1 | REACTOME PEPTIDE LIGAND BINDING RECEPTORS | Genes involved in Peptide ligand-binding receptors |