|
chr11_-_125496122
Show fit
|
20.27 |
ENST00000527534.1
ENST00000278919.8
ENST00000366139.3
|
FEZ1
|
fasciculation and elongation protein zeta 1
|
|
chr8_-_109648825
Show fit
|
14.21 |
ENST00000533895.5
ENST00000446070.6
ENST00000528331.5
ENST00000526302.5
ENST00000408908.6
ENST00000433638.1
ENST00000524720.5
|
SYBU
|
syntabulin
|
|
chr1_-_11805949
Show fit
|
13.74 |
ENST00000376590.9
|
MTHFR
|
methylenetetrahydrofolate reductase
|
|
chr1_-_11805977
Show fit
|
13.48 |
ENST00000376486.3
|
MTHFR
|
methylenetetrahydrofolate reductase
|
|
chr1_-_11805924
Show fit
|
12.65 |
ENST00000418034.1
|
MTHFR
|
methylenetetrahydrofolate reductase
|
|
chr1_-_25906931
Show fit
|
11.43 |
ENST00000357865.6
|
STMN1
|
stathmin 1
|
|
chr8_+_104223320
Show fit
|
10.60 |
ENST00000339750.3
|
RIMS2
|
regulating synaptic membrane exocytosis 2
|
|
chr13_+_112969179
Show fit
|
10.55 |
ENST00000535094.7
|
MCF2L
|
MCF.2 cell line derived transforming sequence like
|
|
chr19_+_21020675
Show fit
|
9.47 |
ENST00000595401.1
|
ZNF430
|
zinc finger protein 430
|
|
chr6_-_169250825
Show fit
|
9.44 |
ENST00000676869.1
ENST00000676760.1
|
THBS2
|
thrombospondin 2
|
|
chr14_-_23301474
Show fit
|
8.47 |
ENST00000561437.1
ENST00000559942.5
ENST00000560913.1
ENST00000559314.5
ENST00000558058.5
|
PPP1R3E
|
protein phosphatase 1 regulatory subunit 3E
|
|
chr8_+_104223344
Show fit
|
7.91 |
ENST00000523362.5
|
RIMS2
|
regulating synaptic membrane exocytosis 2
|
|
chr13_+_112968496
Show fit
|
7.89 |
ENST00000397030.5
|
MCF2L
|
MCF.2 cell line derived transforming sequence like
|
|
chr15_-_80989792
Show fit
|
7.34 |
ENST00000261758.6
ENST00000561312.5
|
MESD
|
mesoderm development LRP chaperone
|
|
chr5_-_111976925
Show fit
|
6.79 |
ENST00000395634.7
|
NREP
|
neuronal regeneration related protein
|
|
chr3_-_51968387
Show fit
|
6.72 |
ENST00000490063.5
ENST00000468324.5
ENST00000497653.5
ENST00000484633.5
|
PCBP4
|
poly(rC) binding protein 4
|
|
chr19_-_23395418
Show fit
|
6.63 |
ENST00000595533.1
ENST00000397082.2
ENST00000599743.5
ENST00000300619.12
|
ZNF91
|
zinc finger protein 91
|
|
chr7_+_94509793
Show fit
|
6.32 |
ENST00000297273.9
|
CASD1
|
CAS1 domain containing 1
|
|
chr2_+_112584586
Show fit
|
6.24 |
ENST00000409719.1
|
CHCHD5
|
coiled-coil-helix-coiled-coil-helix domain containing 5
|
|
chrX_+_54920796
Show fit
|
6.12 |
ENST00000442098.5
ENST00000430420.5
ENST00000453081.5
ENST00000319167.12
ENST00000622017.4
ENST00000375022.8
ENST00000399736.5
ENST00000440072.5
ENST00000173898.12
ENST00000431115.5
ENST00000440759.5
ENST00000375041.6
|
TRO
|
trophinin
|
|
chr8_-_144475808
Show fit
|
6.06 |
ENST00000377317.5
|
FOXH1
|
forkhead box H1
|
|
chr14_+_24070837
Show fit
|
5.71 |
ENST00000537691.5
ENST00000397016.6
ENST00000560356.5
ENST00000558450.5
|
CPNE6
|
copine 6
|
|
chr9_+_101028721
Show fit
|
5.49 |
ENST00000374874.8
|
PLPPR1
|
phospholipid phosphatase related 1
|
|
chr1_-_11805294
Show fit
|
5.28 |
ENST00000413656.5
ENST00000376592.6
ENST00000376585.6
|
MTHFR
|
methylenetetrahydrofolate reductase
|
|
chr3_+_58237773
Show fit
|
5.28 |
ENST00000478253.6
|
ABHD6
|
abhydrolase domain containing 6, acylglycerol lipase
|
|
chr19_+_21082140
Show fit
|
5.02 |
ENST00000616183.1
ENST00000596053.5
|
ZNF714
|
zinc finger protein 714
|
|
chr1_+_109712272
Show fit
|
4.90 |
ENST00000369812.6
|
GSTM5
|
glutathione S-transferase mu 5
|
|
chr9_+_35490103
Show fit
|
4.86 |
ENST00000361226.8
|
RUSC2
|
RUN and SH3 domain containing 2
|
|
chr18_-_46757012
Show fit
|
4.53 |
ENST00000315087.12
|
ST8SIA5
|
ST8 alpha-N-acetyl-neuraminide alpha-2,8-sialyltransferase 5
|
|
chr16_+_71358713
Show fit
|
4.42 |
ENST00000349553.9
ENST00000302628.9
ENST00000562305.5
|
CALB2
|
calbindin 2
|
|
chr17_-_39918589
Show fit
|
4.25 |
ENST00000309481.11
|
GSDMB
|
gasdermin B
|
|
chr17_-_39918606
Show fit
|
3.82 |
ENST00000418519.6
ENST00000520542.5
|
GSDMB
|
gasdermin B
|
|
chr5_-_43313473
Show fit
|
3.79 |
ENST00000433297.2
|
HMGCS1
|
3-hydroxy-3-methylglutaryl-CoA synthase 1
|
|
chr1_+_109712227
Show fit
|
3.78 |
ENST00000256593.8
|
GSTM5
|
glutathione S-transferase mu 5
|
|
chr1_-_25905989
Show fit
|
3.78 |
ENST00000399728.5
|
STMN1
|
stathmin 1
|
|
chr2_-_102736819
Show fit
|
3.60 |
ENST00000258436.10
|
MFSD9
|
major facilitator superfamily domain containing 9
|
|
chr19_-_57559833
Show fit
|
3.56 |
ENST00000457177.5
|
ZNF550
|
zinc finger protein 550
|
|
chr16_-_18375069
Show fit
|
3.54 |
ENST00000545114.5
|
NPIPA9
|
nuclear pore complex interacting protein family, member A9
|
|
chr2_+_63588953
Show fit
|
3.51 |
ENST00000409908.5
ENST00000442225.5
ENST00000233114.13
ENST00000539945.7
ENST00000409476.5
ENST00000436321.5
|
MDH1
|
malate dehydrogenase 1
|
|
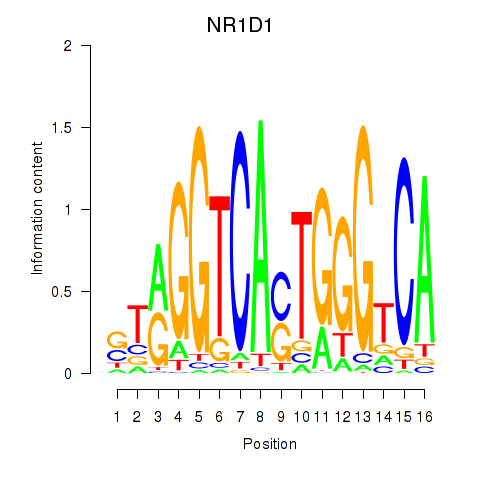
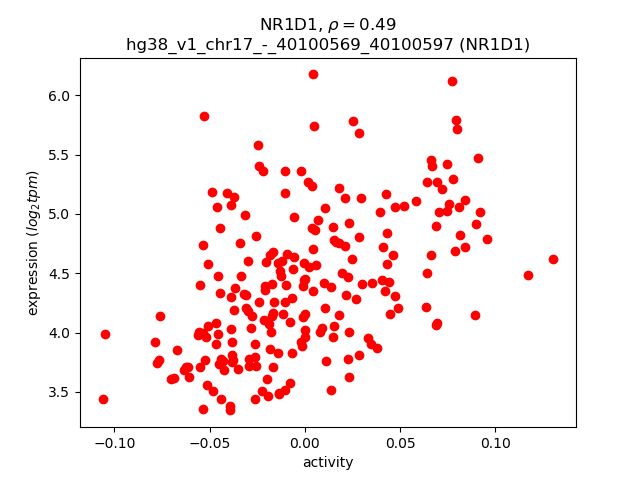
chr17_-_40100569
Show fit
|
3.49 |
ENST00000246672.4
|
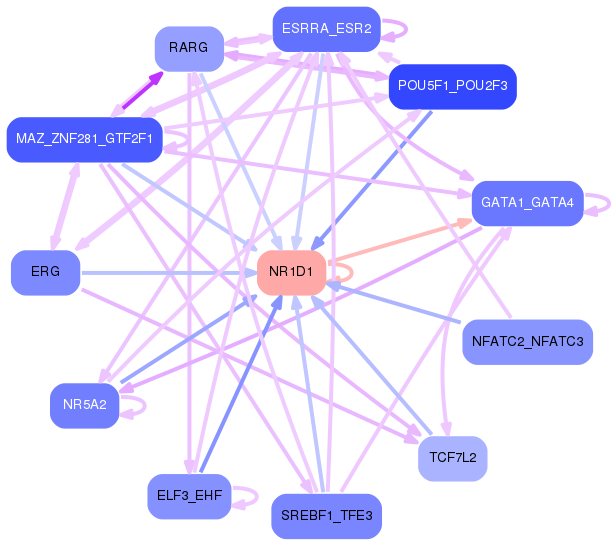
NR1D1
|
nuclear receptor subfamily 1 group D member 1
|
|
chr17_+_50560703
Show fit
|
3.43 |
ENST00000359106.10
|
CACNA1G
|
calcium voltage-gated channel subunit alpha1 G
|
|
chr19_+_21082190
Show fit
|
3.42 |
ENST00000618422.1
ENST00000618008.4
ENST00000425625.5
ENST00000456283.7
|
ZNF714
|
zinc finger protein 714
|
|
chr19_-_38315919
Show fit
|
3.36 |
ENST00000591755.5
ENST00000337679.12
ENST00000339413.11
|
YIF1B
|
Yip1 interacting factor homolog B, membrane trafficking protein
|
|
chr8_+_11704151
Show fit
|
3.36 |
ENST00000526716.5
ENST00000532059.6
ENST00000335135.8
ENST00000622443.3
|
GATA4
|
GATA binding protein 4
|
|
chr7_-_129055158
Show fit
|
3.34 |
ENST00000627585.2
|
TNPO3
|
transportin 3
|
|
chr15_+_65611336
Show fit
|
3.33 |
ENST00000537259.5
|
SLC24A1
|
solute carrier family 24 member 1
|
|
chr19_-_42423100
Show fit
|
3.27 |
ENST00000597001.1
|
LIPE
|
lipase E, hormone sensitive type
|
|
chr5_-_43313403
Show fit
|
3.18 |
ENST00000325110.11
|
HMGCS1
|
3-hydroxy-3-methylglutaryl-CoA synthase 1
|
|
chr6_+_75749272
Show fit
|
3.00 |
ENST00000653423.1
|
MYO6
|
myosin VI
|
|
chr6_+_13574227
Show fit
|
2.95 |
ENST00000680432.1
ENST00000681012.1
ENST00000397350.7
|
SIRT5
|
sirtuin 5
|
|
chr7_-_129055093
Show fit
|
2.95 |
ENST00000482320.5
ENST00000265388.10
ENST00000471234.5
|
TNPO3
|
transportin 3
|
|
chr18_+_33578213
Show fit
|
2.81 |
ENST00000681521.1
ENST00000269197.12
|
ASXL3
|
ASXL transcriptional regulator 3
|
|
chr17_+_6996042
Show fit
|
2.76 |
ENST00000251535.11
|
ALOX12
|
arachidonate 12-lipoxygenase, 12S type
|
|
chr19_-_4455292
Show fit
|
2.61 |
ENST00000394765.7
ENST00000592515.1
|
UBXN6
|
UBX domain protein 6
|
|
chr11_+_60924452
Show fit
|
2.42 |
ENST00000453848.7
ENST00000544065.5
ENST00000005286.8
|
TMEM132A
|
transmembrane protein 132A
|
|
chr19_+_21142024
Show fit
|
2.41 |
ENST00000600692.5
ENST00000599296.5
ENST00000594425.5
ENST00000311048.11
|
ZNF431
|
zinc finger protein 431
|
|
chr15_-_65611110
Show fit
|
2.41 |
ENST00000567744.5
ENST00000568573.1
ENST00000562830.1
ENST00000569491.5
ENST00000561769.1
|
INTS14
|
integrator complex subunit 14
|
|
chr1_-_25906411
Show fit
|
2.41 |
ENST00000455785.7
|
STMN1
|
stathmin 1
|
|
chr3_-_45915698
Show fit
|
2.37 |
ENST00000539217.5
|
LZTFL1
|
leucine zipper transcription factor like 1
|
|
chr11_+_46719193
Show fit
|
2.25 |
ENST00000311907.10
ENST00000530231.5
ENST00000442468.1
|
F2
|
coagulation factor II, thrombin
|
|
chrX_-_49233309
Show fit
|
2.24 |
ENST00000376251.5
ENST00000323022.10
ENST00000376265.2
|
CACNA1F
|
calcium voltage-gated channel subunit alpha1 F
|
|
chr2_+_63589135
Show fit
|
2.22 |
ENST00000432309.6
|
MDH1
|
malate dehydrogenase 1
|
|
chr9_-_33167296
Show fit
|
2.19 |
ENST00000379731.5
ENST00000535206.5
|
B4GALT1
|
beta-1,4-galactosyltransferase 1
|
|
chr7_-_100896123
Show fit
|
2.00 |
ENST00000428317.7
|
ACHE
|
acetylcholinesterase (Cartwright blood group)
|
|
chr6_+_75749231
Show fit
|
1.98 |
ENST00000664209.1
ENST00000369975.6
ENST00000627432.3
ENST00000369985.9
ENST00000369977.8
ENST00000664640.1
ENST00000662603.1
|
MYO6
|
myosin VI
|
|
chr22_-_37484505
Show fit
|
1.92 |
ENST00000442496.1
|
MFNG
|
MFNG O-fucosylpeptide 3-beta-N-acetylglucosaminyltransferase
|
|
chr22_+_45502832
Show fit
|
1.92 |
ENST00000455233.5
ENST00000402984.7
ENST00000262722.11
ENST00000327858.11
ENST00000442170.6
ENST00000340923.9
|
FBLN1
|
fibulin 1
|
|
chr17_+_42854078
Show fit
|
1.89 |
ENST00000591562.1
ENST00000588033.1
|
AOC3
|
amine oxidase copper containing 3
|
|
chr1_+_43933277
Show fit
|
1.71 |
ENST00000414809.7
|
ARTN
|
artemin
|
|
chr6_+_167111789
Show fit
|
1.50 |
ENST00000400926.5
|
CCR6
|
C-C motif chemokine receptor 6
|
|
chr15_-_65611236
Show fit
|
1.49 |
ENST00000420799.7
ENST00000313182.6
ENST00000431261.6
ENST00000652388.1
ENST00000442903.3
|
INTS14
|
integrator complex subunit 14
|
|
chr11_-_18046262
Show fit
|
1.47 |
ENST00000682019.1
|
TPH1
|
tryptophan hydroxylase 1
|
|
chr10_+_11005301
Show fit
|
1.43 |
ENST00000416382.6
ENST00000631460.1
ENST00000631816.1
|
CELF2
|
CUGBP Elav-like family member 2
|
|
chr1_-_168543990
Show fit
|
1.41 |
ENST00000367819.3
|
XCL2
|
X-C motif chemokine ligand 2
|
|
chr19_-_43204223
Show fit
|
1.35 |
ENST00000599746.5
|
PSG4
|
pregnancy specific beta-1-glycoprotein 4
|
|
chr3_-_48685835
Show fit
|
1.31 |
ENST00000439518.5
ENST00000416649.6
ENST00000294129.7
|
NCKIPSD
|
NCK interacting protein with SH3 domain
|
|
chr6_+_75749192
Show fit
|
1.25 |
ENST00000369981.7
|
MYO6
|
myosin VI
|
|
chr7_-_100895878
Show fit
|
1.20 |
ENST00000419336.6
ENST00000241069.11
ENST00000411582.4
ENST00000302913.8
|
ACHE
|
acetylcholinesterase (Cartwright blood group)
|
|
chr13_+_100089015
Show fit
|
1.12 |
ENST00000376286.8
ENST00000376279.7
ENST00000376285.6
|
PCCA
|
propionyl-CoA carboxylase subunit alpha
|
|
chr16_+_77191173
Show fit
|
1.04 |
ENST00000248248.8
ENST00000439557.6
ENST00000545553.1
|
MON1B
|
MON1 homolog B, secretory trafficking associated
|
|
chr11_+_66857056
Show fit
|
0.96 |
ENST00000309602.5
ENST00000393952.3
|
LRFN4
|
leucine rich repeat and fibronectin type III domain containing 4
|
|
chr11_-_119381629
Show fit
|
0.95 |
ENST00000260187.7
ENST00000455332.6
|
USP2
|
ubiquitin specific peptidase 2
|
|
chr1_+_2467437
Show fit
|
0.89 |
ENST00000449969.5
|
PLCH2
|
phospholipase C eta 2
|
|
chr7_+_98106852
Show fit
|
0.88 |
ENST00000297293.6
|
LMTK2
|
lemur tyrosine kinase 2
|
|
chr1_+_197413827
Show fit
|
0.87 |
ENST00000367397.1
ENST00000681519.1
|
CRB1
|
crumbs cell polarity complex component 1
|
|
chr5_+_141150012
Show fit
|
0.72 |
ENST00000231136.4
ENST00000622991.1
|
PCDHB6
|
protocadherin beta 6
|
|
chr19_+_21082224
Show fit
|
0.67 |
ENST00000620627.1
|
ZNF714
|
zinc finger protein 714
|
|
chrX_+_16946862
Show fit
|
0.51 |
ENST00000303843.7
|
REPS2
|
RALBP1 associated Eps domain containing 2
|
|
chr1_+_159826860
Show fit
|
0.38 |
ENST00000289707.10
|
SLAMF8
|
SLAM family member 8
|
|
chr1_+_171090892
Show fit
|
0.37 |
ENST00000367755.9
ENST00000479749.1
|
FMO3
|
flavin containing dimethylaniline monoxygenase 3
|
|
chr11_+_7513966
Show fit
|
0.34 |
ENST00000299492.9
|
PPFIBP2
|
PPFIA binding protein 2
|
|
chr19_-_22422335
Show fit
|
0.25 |
ENST00000357774.9
ENST00000601553.1
ENST00000593657.5
|
ZNF98
|
zinc finger protein 98
|
|
chr12_-_7018465
Show fit
|
0.23 |
ENST00000261407.9
|
LPCAT3
|
lysophosphatidylcholine acyltransferase 3
|
|
chr22_+_26621952
Show fit
|
0.14 |
ENST00000354760.4
|
CRYBA4
|
crystallin beta A4
|
|
chr17_+_6070361
Show fit
|
0.12 |
ENST00000317744.10
|
WSCD1
|
WSC domain containing 1
|
