Project
GNF SymAtlas + NCI-60 cancer cell lines, human (Su, 2004; Ross, 2000)
Navigation
Downloads
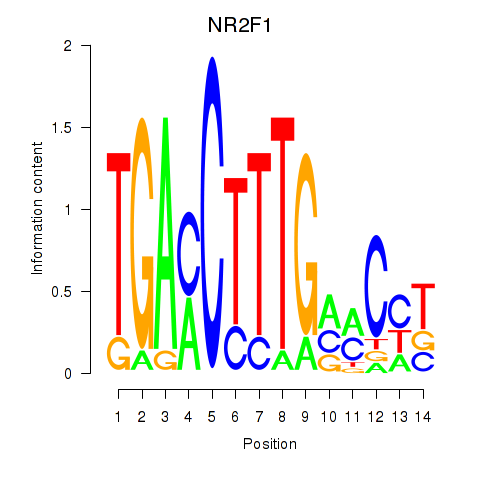
Results for NR2F1
Z-value: 0.90
Motif logo
Transcription factors associated with NR2F1
| Gene Symbol | Gene ID | Gene Info |
|---|---|---|
|
NR2F1
|
ENSG00000175745.14 | NR2F1 |
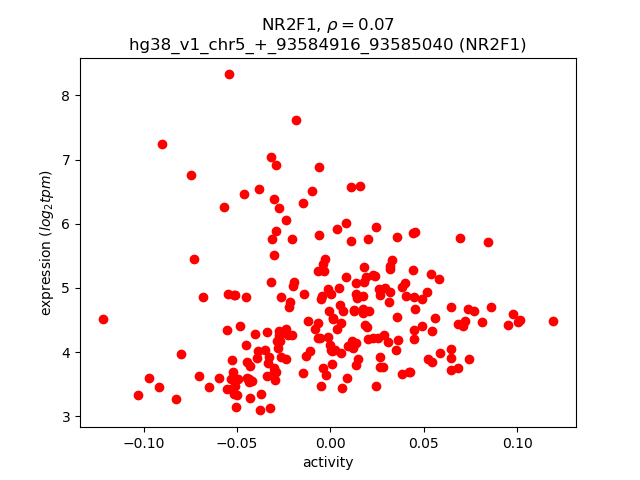
Activity-expression correlation:
| Gene | Promoter | Pearson corr. coef. | P-value | Plot |
|---|---|---|---|---|
| NR2F1 | hg38_v1_chr5_+_93584916_93585040 | 0.07 | 2.7e-01 | Click! |
Activity profile of NR2F1 motif
Sorted Z-values of NR2F1 motif
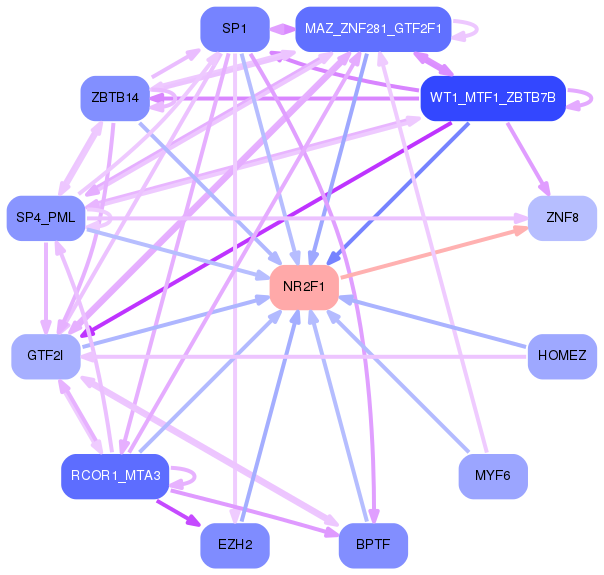
Network of associatons between targets according to the STRING database.

First level regulatory network of NR2F1
Gene Ontology Analysis
Gene overrepresentation in biological process category:
| Log-likelihood per target | Total log-likelihood | Term | Description |
|---|---|---|---|
| 5.3 | 21.2 | GO:2000325 | regulation of ligand-dependent nuclear receptor transcription coactivator activity(GO:2000325) positive regulation of ligand-dependent nuclear receptor transcription coactivator activity(GO:2000327) |
| 4.1 | 16.5 | GO:0032581 | ER-dependent peroxisome organization(GO:0032581) |
| 3.7 | 11.1 | GO:1900226 | positive regulation of oocyte maturation(GO:1900195) negative regulation of NLRP3 inflammasome complex assembly(GO:1900226) positive regulation of proteasomal ubiquitin-dependent protein catabolic process involved in cellular response to hypoxia(GO:2000777) |
| 3.3 | 22.8 | GO:1990822 | basic amino acid transmembrane transport(GO:1990822) |
| 2.9 | 17.2 | GO:0071105 | response to interleukin-11(GO:0071105) |
| 2.8 | 2.8 | GO:0070560 | protein secretion by platelet(GO:0070560) |
| 2.6 | 7.7 | GO:0051941 | regulation of amino acid uptake involved in synaptic transmission(GO:0051941) regulation of glutamate uptake involved in transmission of nerve impulse(GO:0051946) regulation of L-glutamate import(GO:1900920) |
| 2.3 | 7.0 | GO:0035565 | regulation of pronephros size(GO:0035565) |
| 2.1 | 6.4 | GO:0006391 | transcription initiation from mitochondrial promoter(GO:0006391) |
| 2.0 | 14.1 | GO:0010961 | cellular magnesium ion homeostasis(GO:0010961) |
| 2.0 | 6.0 | GO:1903781 | positive regulation of cardiac conduction(GO:1903781) |
| 1.8 | 5.5 | GO:0007525 | somatic muscle development(GO:0007525) |
| 1.7 | 10.5 | GO:0033314 | mitotic DNA replication checkpoint(GO:0033314) |
| 1.7 | 5.1 | GO:0051365 | cellular response to potassium ion starvation(GO:0051365) |
| 1.6 | 4.7 | GO:1903384 | neuron intrinsic apoptotic signaling pathway in response to hydrogen peroxide(GO:0036482) positive regulation of mitochondrial electron transport, NADH to ubiquinone(GO:1902958) regulation of hydrogen peroxide-induced neuron intrinsic apoptotic signaling pathway(GO:1903383) negative regulation of hydrogen peroxide-induced neuron intrinsic apoptotic signaling pathway(GO:1903384) |
| 1.5 | 10.5 | GO:0060770 | negative regulation of epithelial cell proliferation involved in prostate gland development(GO:0060770) |
| 1.5 | 16.4 | GO:0035585 | calcium-mediated signaling using extracellular calcium source(GO:0035585) |
| 1.5 | 5.9 | GO:0035359 | negative regulation of peroxisome proliferator activated receptor signaling pathway(GO:0035359) |
| 1.5 | 8.8 | GO:2000158 | positive regulation of ubiquitin-specific protease activity(GO:2000158) |
| 1.4 | 7.2 | GO:1901162 | primary amino compound biosynthetic process(GO:1901162) |
| 1.4 | 4.3 | GO:0038178 | complement component C5a signaling pathway(GO:0038178) |
| 1.3 | 5.4 | GO:0052251 | induction by symbiont of host defense response(GO:0044416) induction of host immune response by virus(GO:0046730) active induction of host immune response by virus(GO:0046732) modulation by symbiont of host defense response(GO:0052031) induction by organism of defense response of other organism involved in symbiotic interaction(GO:0052251) modulation by organism of defense response of other organism involved in symbiotic interaction(GO:0052255) positive regulation by symbiont of host defense response(GO:0052509) positive regulation by organism of defense response of other organism involved in symbiotic interaction(GO:0052510) modulation by organism of immune response of other organism involved in symbiotic interaction(GO:0052552) modulation by symbiont of host immune response(GO:0052553) modulation by virus of host immune response(GO:0075528) |
| 1.3 | 3.8 | GO:0010133 | proline catabolic process to glutamate(GO:0010133) |
| 1.2 | 7.3 | GO:0032571 | response to vitamin K(GO:0032571) |
| 1.2 | 25.3 | GO:0019371 | cyclooxygenase pathway(GO:0019371) |
| 1.2 | 12.9 | GO:0006657 | CDP-choline pathway(GO:0006657) |
| 1.1 | 3.4 | GO:2000118 | regulation of sodium-dependent phosphate transport(GO:2000118) |
| 1.1 | 9.0 | GO:0001887 | selenium compound metabolic process(GO:0001887) |
| 1.1 | 3.4 | GO:0043465 | fermentation(GO:0006113) regulation of fermentation(GO:0043465) positive regulation of skeletal muscle tissue growth(GO:0048633) |
| 1.1 | 3.4 | GO:0006421 | asparaginyl-tRNA aminoacylation(GO:0006421) |
| 1.1 | 4.3 | GO:0015722 | canalicular bile acid transport(GO:0015722) |
| 1.1 | 20.3 | GO:0033539 | fatty acid beta-oxidation using acyl-CoA dehydrogenase(GO:0033539) |
| 1.0 | 4.0 | GO:0009822 | alkaloid catabolic process(GO:0009822) |
| 1.0 | 16.1 | GO:0090361 | platelet-derived growth factor production(GO:0090360) regulation of platelet-derived growth factor production(GO:0090361) |
| 1.0 | 2.9 | GO:1903015 | regulation of exo-alpha-sialidase activity(GO:1903015) |
| 1.0 | 2.9 | GO:0097156 | fasciculation of motor neuron axon(GO:0097156) |
| 0.9 | 15.6 | GO:0007021 | tubulin complex assembly(GO:0007021) |
| 0.9 | 3.5 | GO:0046485 | ether lipid metabolic process(GO:0046485) |
| 0.9 | 2.6 | GO:2000584 | negative regulation of low-density lipoprotein particle receptor biosynthetic process(GO:0045715) metanephric glomerular epithelium development(GO:0072244) metanephric glomerular visceral epithelial cell differentiation(GO:0072248) metanephric glomerular visceral epithelial cell development(GO:0072249) metanephric glomerular epithelial cell differentiation(GO:0072312) metanephric glomerular epithelial cell development(GO:0072313) regulation of platelet-derived growth factor receptor-alpha signaling pathway(GO:2000583) negative regulation of platelet-derived growth factor receptor-alpha signaling pathway(GO:2000584) |
| 0.9 | 3.4 | GO:0016098 | monoterpenoid metabolic process(GO:0016098) |
| 0.9 | 4.3 | GO:0090131 | mesenchyme migration(GO:0090131) |
| 0.8 | 2.4 | GO:2001045 | closure of optic fissure(GO:0061386) negative regulation of integrin-mediated signaling pathway(GO:2001045) |
| 0.8 | 4.8 | GO:1901668 | regulation of superoxide dismutase activity(GO:1901668) |
| 0.8 | 6.1 | GO:0048386 | positive regulation of retinoic acid receptor signaling pathway(GO:0048386) |
| 0.7 | 3.6 | GO:0015692 | lead ion transport(GO:0015692) |
| 0.7 | 5.8 | GO:0007598 | blood coagulation, extrinsic pathway(GO:0007598) |
| 0.7 | 4.7 | GO:2000852 | corticosterone secretion(GO:0035934) corticotropin secretion(GO:0051458) regulation of corticosterone secretion(GO:2000852) |
| 0.6 | 2.4 | GO:0060327 | cytoplasmic actin-based contraction involved in cell motility(GO:0060327) |
| 0.6 | 1.7 | GO:1904049 | negative regulation of spontaneous neurotransmitter secretion(GO:1904049) |
| 0.6 | 1.7 | GO:0046603 | negative regulation of mitotic centrosome separation(GO:0046603) |
| 0.6 | 3.3 | GO:0052805 | histamine metabolic process(GO:0001692) histidine catabolic process(GO:0006548) imidazole-containing compound catabolic process(GO:0052805) |
| 0.5 | 2.2 | GO:0072717 | traversing start control point of mitotic cell cycle(GO:0007089) transcription factor catabolic process(GO:0036369) cellular response to actinomycin D(GO:0072717) |
| 0.5 | 1.6 | GO:0035963 | cellular response to interleukin-13(GO:0035963) |
| 0.5 | 3.1 | GO:0010731 | protein glutathionylation(GO:0010731) regulation of protein glutathionylation(GO:0010732) negative regulation of protein glutathionylation(GO:0010734) |
| 0.5 | 7.9 | GO:0016102 | diterpenoid biosynthetic process(GO:0016102) |
| 0.5 | 2.8 | GO:0006001 | fructose catabolic process(GO:0006001) fructose catabolic process to hydroxyacetone phosphate and glyceraldehyde-3-phosphate(GO:0061624) |
| 0.5 | 1.8 | GO:1904924 | negative regulation of mitophagy in response to mitochondrial depolarization(GO:1904924) |
| 0.5 | 5.9 | GO:0048312 | intracellular distribution of mitochondria(GO:0048312) |
| 0.4 | 7.9 | GO:0019373 | epoxygenase P450 pathway(GO:0019373) |
| 0.4 | 2.6 | GO:0034196 | acylglycerol transport(GO:0034196) triglyceride transport(GO:0034197) |
| 0.4 | 0.9 | GO:1902358 | sulfate transmembrane transport(GO:1902358) |
| 0.4 | 4.7 | GO:0070257 | positive regulation of mucus secretion(GO:0070257) |
| 0.4 | 2.1 | GO:0019323 | pentose catabolic process(GO:0019323) |
| 0.4 | 4.9 | GO:1900227 | positive regulation of NLRP3 inflammasome complex assembly(GO:1900227) |
| 0.4 | 6.8 | GO:0007196 | adenylate cyclase-inhibiting G-protein coupled glutamate receptor signaling pathway(GO:0007196) |
| 0.4 | 3.2 | GO:0006013 | mannose metabolic process(GO:0006013) |
| 0.4 | 2.0 | GO:1904970 | brush border assembly(GO:1904970) |
| 0.4 | 3.1 | GO:0015747 | urate transport(GO:0015747) |
| 0.4 | 7.2 | GO:1901897 | regulation of relaxation of cardiac muscle(GO:1901897) |
| 0.4 | 11.7 | GO:0045332 | lipid translocation(GO:0034204) phospholipid translocation(GO:0045332) |
| 0.4 | 5.2 | GO:0036158 | outer dynein arm assembly(GO:0036158) |
| 0.4 | 9.2 | GO:0090141 | positive regulation of mitochondrial fission(GO:0090141) |
| 0.4 | 5.3 | GO:0001867 | complement activation, lectin pathway(GO:0001867) |
| 0.3 | 5.1 | GO:0015889 | cobalamin transport(GO:0015889) |
| 0.3 | 2.3 | GO:0098881 | exocytic insertion of neurotransmitter receptor to plasma membrane(GO:0098881) exocytic insertion of neurotransmitter receptor to postsynaptic membrane(GO:0098967) |
| 0.3 | 4.8 | GO:1900025 | negative regulation of substrate adhesion-dependent cell spreading(GO:1900025) |
| 0.3 | 1.5 | GO:0001920 | negative regulation of receptor recycling(GO:0001920) |
| 0.3 | 2.1 | GO:0010757 | negative regulation of plasminogen activation(GO:0010757) |
| 0.3 | 2.7 | GO:0034427 | nuclear-transcribed mRNA catabolic process, exonucleolytic, 3'-5'(GO:0034427) |
| 0.3 | 6.2 | GO:0036150 | phosphatidylserine acyl-chain remodeling(GO:0036150) |
| 0.3 | 4.6 | GO:0061158 | 3'-UTR-mediated mRNA destabilization(GO:0061158) |
| 0.3 | 1.4 | GO:0032489 | regulation of Cdc42 protein signal transduction(GO:0032489) |
| 0.3 | 2.0 | GO:0045964 | response to aluminum ion(GO:0010044) negative regulation of serotonin secretion(GO:0014063) positive regulation of catecholamine metabolic process(GO:0045915) positive regulation of dopamine metabolic process(GO:0045964) |
| 0.3 | 12.3 | GO:0006699 | bile acid biosynthetic process(GO:0006699) |
| 0.3 | 1.7 | GO:2000418 | positive regulation of eosinophil migration(GO:2000418) |
| 0.3 | 1.6 | GO:1904879 | positive regulation of calcium ion transmembrane transport via high voltage-gated calcium channel(GO:1904879) |
| 0.3 | 1.3 | GO:0002442 | serotonin production involved in inflammatory response(GO:0002351) serotonin secretion involved in inflammatory response(GO:0002442) serotonin secretion by platelet(GO:0002554) |
| 0.3 | 4.1 | GO:0016540 | protein autoprocessing(GO:0016540) |
| 0.3 | 4.8 | GO:0006071 | glycerol metabolic process(GO:0006071) |
| 0.3 | 8.5 | GO:0090503 | RNA phosphodiester bond hydrolysis, exonucleolytic(GO:0090503) |
| 0.3 | 1.0 | GO:0003366 | cell-matrix adhesion involved in ameboidal cell migration(GO:0003366) |
| 0.2 | 4.2 | GO:0051798 | positive regulation of hair follicle development(GO:0051798) |
| 0.2 | 3.6 | GO:0030208 | dermatan sulfate biosynthetic process(GO:0030208) |
| 0.2 | 13.8 | GO:0015701 | bicarbonate transport(GO:0015701) |
| 0.2 | 4.0 | GO:0019934 | cGMP-mediated signaling(GO:0019934) |
| 0.2 | 0.7 | GO:0097272 | ammonia homeostasis(GO:0097272) |
| 0.2 | 0.7 | GO:0046110 | purine nucleobase catabolic process(GO:0006145) xanthine metabolic process(GO:0046110) |
| 0.2 | 3.3 | GO:0006600 | creatine metabolic process(GO:0006600) |
| 0.2 | 1.1 | GO:0001957 | intramembranous ossification(GO:0001957) direct ossification(GO:0036072) |
| 0.2 | 3.0 | GO:0070444 | oligodendrocyte progenitor proliferation(GO:0070444) regulation of oligodendrocyte progenitor proliferation(GO:0070445) |
| 0.2 | 2.3 | GO:0050908 | detection of light stimulus involved in visual perception(GO:0050908) detection of light stimulus involved in sensory perception(GO:0050962) |
| 0.2 | 0.6 | GO:0060003 | copper ion export(GO:0060003) |
| 0.2 | 1.2 | GO:0070171 | negative regulation of tooth mineralization(GO:0070171) |
| 0.2 | 0.8 | GO:0034444 | regulation of plasma lipoprotein particle oxidation(GO:0034444) negative regulation of plasma lipoprotein particle oxidation(GO:0034445) |
| 0.2 | 3.1 | GO:1990845 | adaptive thermogenesis(GO:1990845) |
| 0.2 | 1.1 | GO:0022614 | membrane to membrane docking(GO:0022614) |
| 0.2 | 5.5 | GO:0045063 | T-helper 1 cell differentiation(GO:0045063) |
| 0.2 | 2.5 | GO:1903608 | protein localization to cytoplasmic stress granule(GO:1903608) |
| 0.2 | 2.5 | GO:0070389 | chaperone cofactor-dependent protein refolding(GO:0070389) |
| 0.2 | 1.7 | GO:0043950 | positive regulation of cAMP-mediated signaling(GO:0043950) |
| 0.2 | 7.8 | GO:1901998 | toxin transport(GO:1901998) |
| 0.2 | 3.3 | GO:0039702 | viral budding via host ESCRT complex(GO:0039702) |
| 0.2 | 1.1 | GO:0045919 | positive regulation of cytolysis(GO:0045919) |
| 0.2 | 6.4 | GO:0019433 | triglyceride catabolic process(GO:0019433) |
| 0.1 | 0.9 | GO:0015760 | hexose phosphate transport(GO:0015712) glucose-6-phosphate transport(GO:0015760) |
| 0.1 | 5.0 | GO:0035338 | long-chain fatty-acyl-CoA biosynthetic process(GO:0035338) |
| 0.1 | 0.4 | GO:1901253 | negative regulation of intracellular transport of viral material(GO:1901253) |
| 0.1 | 3.6 | GO:0006525 | arginine metabolic process(GO:0006525) |
| 0.1 | 1.1 | GO:0042866 | pyruvate biosynthetic process(GO:0042866) |
| 0.1 | 16.2 | GO:2000257 | regulation of protein activation cascade(GO:2000257) |
| 0.1 | 1.6 | GO:0003351 | epithelial cilium movement(GO:0003351) |
| 0.1 | 1.7 | GO:0021873 | forebrain neuroblast division(GO:0021873) |
| 0.1 | 3.0 | GO:0000042 | protein targeting to Golgi(GO:0000042) |
| 0.1 | 2.2 | GO:0044804 | nucleophagy(GO:0044804) |
| 0.1 | 10.9 | GO:0050911 | detection of chemical stimulus involved in sensory perception of smell(GO:0050911) |
| 0.1 | 8.6 | GO:1902017 | regulation of cilium assembly(GO:1902017) |
| 0.1 | 0.6 | GO:0006543 | glutamine catabolic process(GO:0006543) |
| 0.1 | 1.3 | GO:1901750 | leukotriene D4 metabolic process(GO:1901748) leukotriene D4 biosynthetic process(GO:1901750) |
| 0.1 | 1.5 | GO:0035589 | G-protein coupled purinergic nucleotide receptor signaling pathway(GO:0035589) |
| 0.1 | 1.9 | GO:0045898 | regulation of RNA polymerase II transcriptional preinitiation complex assembly(GO:0045898) |
| 0.1 | 0.6 | GO:0042797 | 5S class rRNA transcription from RNA polymerase III type 1 promoter(GO:0042791) tRNA transcription from RNA polymerase III promoter(GO:0042797) |
| 0.1 | 0.4 | GO:0070305 | response to cGMP(GO:0070305) |
| 0.1 | 1.2 | GO:0090026 | positive regulation of monocyte chemotaxis(GO:0090026) |
| 0.1 | 0.9 | GO:0007039 | protein catabolic process in the vacuole(GO:0007039) |
| 0.1 | 3.9 | GO:0042769 | DNA damage response, detection of DNA damage(GO:0042769) |
| 0.1 | 0.9 | GO:0030210 | heparin metabolic process(GO:0030202) heparin biosynthetic process(GO:0030210) |
| 0.1 | 0.3 | GO:0019376 | galactolipid catabolic process(GO:0019376) |
| 0.1 | 1.5 | GO:0051639 | actin filament network formation(GO:0051639) |
| 0.1 | 1.9 | GO:0030279 | negative regulation of ossification(GO:0030279) |
| 0.1 | 2.6 | GO:0014823 | response to activity(GO:0014823) |
| 0.1 | 4.2 | GO:0086010 | membrane depolarization during action potential(GO:0086010) |
| 0.1 | 1.8 | GO:0043011 | myeloid dendritic cell differentiation(GO:0043011) |
| 0.1 | 0.7 | GO:0015727 | lactate transport(GO:0015727) lactate transmembrane transport(GO:0035873) |
| 0.1 | 2.8 | GO:0035987 | endodermal cell differentiation(GO:0035987) |
| 0.1 | 2.4 | GO:0050690 | regulation of defense response to virus by virus(GO:0050690) |
| 0.0 | 4.2 | GO:0006611 | protein export from nucleus(GO:0006611) |
| 0.0 | 0.9 | GO:0045741 | positive regulation of epidermal growth factor-activated receptor activity(GO:0045741) |
| 0.0 | 6.7 | GO:0030509 | BMP signaling pathway(GO:0030509) |
| 0.0 | 1.3 | GO:0014002 | astrocyte development(GO:0014002) |
| 0.0 | 1.0 | GO:0043097 | pyrimidine-containing compound salvage(GO:0008655) pyrimidine nucleoside salvage(GO:0043097) |
| 0.0 | 0.7 | GO:0033033 | negative regulation of myeloid cell apoptotic process(GO:0033033) |
| 0.0 | 2.0 | GO:0003091 | renal water homeostasis(GO:0003091) |
| 0.0 | 7.2 | GO:0051092 | positive regulation of NF-kappaB transcription factor activity(GO:0051092) |
| 0.0 | 1.5 | GO:0016339 | calcium-dependent cell-cell adhesion via plasma membrane cell adhesion molecules(GO:0016339) |
| 0.0 | 1.3 | GO:1902751 | positive regulation of cell cycle G2/M phase transition(GO:1902751) |
| 0.0 | 4.3 | GO:0030239 | myofibril assembly(GO:0030239) |
| 0.0 | 1.8 | GO:0006958 | complement activation, classical pathway(GO:0006958) |
| 0.0 | 4.8 | GO:0030282 | bone mineralization(GO:0030282) |
| 0.0 | 1.1 | GO:0032012 | regulation of ARF protein signal transduction(GO:0032012) |
| 0.0 | 1.0 | GO:0032620 | interleukin-17 production(GO:0032620) |
| 0.0 | 2.7 | GO:0032411 | positive regulation of transporter activity(GO:0032411) |
| 0.0 | 1.6 | GO:0032755 | positive regulation of interleukin-6 production(GO:0032755) |
| 0.0 | 3.9 | GO:0060996 | dendritic spine development(GO:0060996) |
| 0.0 | 1.1 | GO:1900078 | positive regulation of cellular response to insulin stimulus(GO:1900078) |
| 0.0 | 2.4 | GO:0060349 | bone morphogenesis(GO:0060349) |
| 0.0 | 1.0 | GO:1901385 | regulation of voltage-gated calcium channel activity(GO:1901385) |
| 0.0 | 0.6 | GO:0018027 | peptidyl-lysine dimethylation(GO:0018027) |
| 0.0 | 5.6 | GO:1901796 | regulation of signal transduction by p53 class mediator(GO:1901796) |
| 0.0 | 0.5 | GO:1904294 | positive regulation of ERAD pathway(GO:1904294) |
| 0.0 | 0.4 | GO:0030214 | hyaluronan catabolic process(GO:0030214) |
| 0.0 | 2.1 | GO:0008625 | extrinsic apoptotic signaling pathway via death domain receptors(GO:0008625) |
| 0.0 | 3.2 | GO:0030856 | regulation of epithelial cell differentiation(GO:0030856) |
| 0.0 | 4.0 | GO:0007018 | microtubule-based movement(GO:0007018) |
| 0.0 | 4.9 | GO:0090305 | nucleic acid phosphodiester bond hydrolysis(GO:0090305) |
| 0.0 | 0.2 | GO:0034379 | very-low-density lipoprotein particle assembly(GO:0034379) |
| 0.0 | 1.8 | GO:0034605 | cellular response to heat(GO:0034605) |
| 0.0 | 0.1 | GO:0034723 | DNA replication-dependent nucleosome assembly(GO:0006335) DNA replication-dependent nucleosome organization(GO:0034723) |
| 0.0 | 1.7 | GO:0007229 | integrin-mediated signaling pathway(GO:0007229) |
| 0.0 | 1.3 | GO:0006687 | glycosphingolipid metabolic process(GO:0006687) |
| 0.0 | 0.3 | GO:0060334 | regulation of interferon-gamma-mediated signaling pathway(GO:0060334) |
| 0.0 | 0.1 | GO:0090218 | positive regulation of lipid kinase activity(GO:0090218) |
Gene overrepresentation in cellular component category:
| Log-likelihood per target | Total log-likelihood | Term | Description |
|---|---|---|---|
| 2.8 | 8.5 | GO:0031251 | PAN complex(GO:0031251) |
| 2.1 | 10.5 | GO:0036398 | TCR signalosome(GO:0036398) |
| 1.8 | 21.2 | GO:0030015 | CCR4-NOT core complex(GO:0030015) |
| 1.2 | 11.1 | GO:0072687 | meiotic spindle(GO:0072687) |
| 1.0 | 15.6 | GO:0097512 | cardiac myofibril(GO:0097512) |
| 0.9 | 2.7 | GO:0055087 | Ski complex(GO:0055087) |
| 0.9 | 5.1 | GO:0031232 | extrinsic component of external side of plasma membrane(GO:0031232) |
| 0.8 | 2.3 | GO:0017071 | intracellular cyclic nucleotide activated cation channel complex(GO:0017071) |
| 0.7 | 5.2 | GO:0036157 | outer dynein arm(GO:0036157) |
| 0.7 | 3.6 | GO:0070826 | paraferritin complex(GO:0070826) |
| 0.7 | 7.3 | GO:0033018 | sarcoplasmic reticulum lumen(GO:0033018) |
| 0.7 | 4.8 | GO:1990130 | Iml1 complex(GO:1990130) |
| 0.7 | 20.3 | GO:0031304 | intrinsic component of mitochondrial inner membrane(GO:0031304) integral component of mitochondrial inner membrane(GO:0031305) |
| 0.6 | 3.0 | GO:0072534 | perineuronal net(GO:0072534) |
| 0.6 | 10.8 | GO:0005890 | sodium:potassium-exchanging ATPase complex(GO:0005890) |
| 0.6 | 16.5 | GO:0031231 | integral component of peroxisomal membrane(GO:0005779) intrinsic component of peroxisomal membrane(GO:0031231) |
| 0.6 | 6.9 | GO:0005577 | fibrinogen complex(GO:0005577) |
| 0.6 | 2.3 | GO:0034365 | discoidal high-density lipoprotein particle(GO:0034365) |
| 0.6 | 4.5 | GO:0005742 | mitochondrial outer membrane translocase complex(GO:0005742) |
| 0.5 | 10.6 | GO:1990454 | L-type voltage-gated calcium channel complex(GO:1990454) |
| 0.5 | 2.3 | GO:1990796 | photoreceptor cell terminal bouton(GO:1990796) |
| 0.4 | 1.3 | GO:0070195 | growth hormone receptor complex(GO:0070195) |
| 0.4 | 4.3 | GO:0046581 | intercellular canaliculus(GO:0046581) |
| 0.4 | 4.9 | GO:0097427 | microtubule bundle(GO:0097427) |
| 0.4 | 8.0 | GO:0031089 | platelet dense granule lumen(GO:0031089) |
| 0.4 | 14.8 | GO:0005859 | muscle myosin complex(GO:0005859) |
| 0.4 | 2.5 | GO:0097165 | nuclear stress granule(GO:0097165) |
| 0.4 | 3.3 | GO:0000813 | ESCRT I complex(GO:0000813) |
| 0.4 | 2.2 | GO:0005927 | muscle tendon junction(GO:0005927) |
| 0.4 | 1.1 | GO:0071065 | alpha9-beta1 integrin-vascular cell adhesion molecule-1 complex(GO:0071065) |
| 0.3 | 1.7 | GO:0044326 | dendritic spine neck(GO:0044326) |
| 0.3 | 7.4 | GO:0031095 | spectrin-associated cytoskeleton(GO:0014731) platelet dense tubular network membrane(GO:0031095) |
| 0.3 | 8.6 | GO:0031143 | pseudopodium(GO:0031143) |
| 0.3 | 4.0 | GO:0001673 | male germ cell nucleus(GO:0001673) |
| 0.3 | 1.0 | GO:0034669 | integrin alpha4-beta7 complex(GO:0034669) |
| 0.2 | 6.0 | GO:0034706 | sodium channel complex(GO:0034706) |
| 0.2 | 1.6 | GO:0035686 | sperm fibrous sheath(GO:0035686) |
| 0.2 | 6.3 | GO:0033017 | sarcoplasmic reticulum membrane(GO:0033017) |
| 0.2 | 17.4 | GO:0005791 | rough endoplasmic reticulum(GO:0005791) |
| 0.1 | 5.5 | GO:0030173 | integral component of Golgi membrane(GO:0030173) |
| 0.1 | 1.9 | GO:0034703 | cation channel complex(GO:0034703) |
| 0.1 | 6.4 | GO:0009295 | nucleoid(GO:0009295) mitochondrial nucleoid(GO:0042645) |
| 0.1 | 2.4 | GO:0032433 | filopodium tip(GO:0032433) |
| 0.1 | 1.0 | GO:0001520 | outer dense fiber(GO:0001520) |
| 0.1 | 2.9 | GO:0044295 | axonal growth cone(GO:0044295) |
| 0.1 | 7.1 | GO:0005801 | cis-Golgi network(GO:0005801) |
| 0.1 | 5.6 | GO:0005669 | transcription factor TFIID complex(GO:0005669) |
| 0.1 | 1.8 | GO:0035631 | CD40 receptor complex(GO:0035631) |
| 0.1 | 0.9 | GO:0005744 | mitochondrial inner membrane presequence translocase complex(GO:0005744) |
| 0.1 | 2.5 | GO:0002080 | acrosomal membrane(GO:0002080) |
| 0.1 | 1.0 | GO:0042612 | MHC class I protein complex(GO:0042612) |
| 0.1 | 10.9 | GO:0005796 | Golgi lumen(GO:0005796) |
| 0.1 | 11.2 | GO:0035579 | specific granule membrane(GO:0035579) |
| 0.1 | 0.6 | GO:0000127 | transcription factor TFIIIC complex(GO:0000127) |
| 0.1 | 2.8 | GO:0008305 | integrin complex(GO:0008305) |
| 0.1 | 14.3 | GO:0030426 | growth cone(GO:0030426) |
| 0.1 | 2.8 | GO:0034451 | centriolar satellite(GO:0034451) |
| 0.1 | 29.1 | GO:0016323 | basolateral plasma membrane(GO:0016323) |
| 0.1 | 5.6 | GO:0001725 | stress fiber(GO:0001725) contractile actin filament bundle(GO:0097517) |
| 0.1 | 6.2 | GO:0030672 | synaptic vesicle membrane(GO:0030672) exocytic vesicle membrane(GO:0099501) |
| 0.1 | 6.3 | GO:0008021 | synaptic vesicle(GO:0008021) |
| 0.1 | 2.7 | GO:0031526 | brush border membrane(GO:0031526) |
| 0.1 | 4.9 | GO:0042383 | sarcolemma(GO:0042383) |
| 0.1 | 1.5 | GO:0042101 | T cell receptor complex(GO:0042101) |
| 0.1 | 2.2 | GO:0005903 | brush border(GO:0005903) |
| 0.0 | 5.5 | GO:0030018 | Z disc(GO:0030018) |
| 0.0 | 3.9 | GO:0031093 | platelet alpha granule lumen(GO:0031093) |
| 0.0 | 2.0 | GO:0055038 | recycling endosome membrane(GO:0055038) |
| 0.0 | 6.1 | GO:0016605 | PML body(GO:0016605) |
| 0.0 | 4.6 | GO:0000932 | cytoplasmic mRNA processing body(GO:0000932) |
| 0.0 | 4.3 | GO:0005643 | nuclear pore(GO:0005643) |
| 0.0 | 7.0 | GO:0005741 | mitochondrial outer membrane(GO:0005741) |
| 0.0 | 1.8 | GO:0042571 | immunoglobulin complex, circulating(GO:0042571) |
| 0.0 | 1.7 | GO:0005871 | kinesin complex(GO:0005871) |
| 0.0 | 2.4 | GO:0032588 | trans-Golgi network membrane(GO:0032588) |
| 0.0 | 4.2 | GO:0031225 | anchored component of membrane(GO:0031225) |
| 0.0 | 3.4 | GO:0030176 | integral component of endoplasmic reticulum membrane(GO:0030176) |
| 0.0 | 0.9 | GO:0005891 | voltage-gated calcium channel complex(GO:0005891) |
| 0.0 | 1.0 | GO:0001533 | cornified envelope(GO:0001533) |
| 0.0 | 1.7 | GO:0005581 | collagen trimer(GO:0005581) |
| 0.0 | 33.2 | GO:0005887 | integral component of plasma membrane(GO:0005887) |
| 0.0 | 1.7 | GO:0009897 | external side of plasma membrane(GO:0009897) |
| 0.0 | 0.8 | GO:0005782 | peroxisomal matrix(GO:0005782) microbody lumen(GO:0031907) |
| 0.0 | 2.1 | GO:0016324 | apical plasma membrane(GO:0016324) |
| 0.0 | 0.1 | GO:0098574 | cytoplasmic side of lysosomal membrane(GO:0098574) |
| 0.0 | 15.3 | GO:0005615 | extracellular space(GO:0005615) |
| 0.0 | 1.2 | GO:0005578 | proteinaceous extracellular matrix(GO:0005578) |
Gene overrepresentation in molecular function category:
| Log-likelihood per target | Total log-likelihood | Term | Description |
|---|---|---|---|
| 6.3 | 25.3 | GO:0004667 | prostaglandin-D synthase activity(GO:0004667) |
| 3.7 | 11.1 | GO:0034739 | histone deacetylase activity (H4-K16 specific)(GO:0034739) |
| 2.8 | 19.5 | GO:0048039 | ubiquinone binding(GO:0048039) |
| 2.4 | 14.1 | GO:0031708 | endothelin B receptor binding(GO:0031708) |
| 2.2 | 12.9 | GO:0004305 | ethanolamine kinase activity(GO:0004305) |
| 1.9 | 22.8 | GO:0015174 | basic amino acid transmembrane transporter activity(GO:0015174) |
| 1.7 | 5.1 | GO:0004613 | phosphoenolpyruvate carboxykinase activity(GO:0004611) phosphoenolpyruvate carboxykinase (GTP) activity(GO:0004613) |
| 1.6 | 4.8 | GO:0004144 | diacylglycerol O-acyltransferase activity(GO:0004144) |
| 1.5 | 10.5 | GO:0010997 | anaphase-promoting complex binding(GO:0010997) |
| 1.5 | 5.9 | GO:0035473 | lipase binding(GO:0035473) |
| 1.5 | 8.8 | GO:0035800 | deubiquitinase activator activity(GO:0035800) |
| 1.4 | 4.3 | GO:0004878 | complement component C5a receptor activity(GO:0004878) |
| 1.3 | 5.4 | GO:0005471 | ATP:ADP antiporter activity(GO:0005471) adenine transmembrane transporter activity(GO:0015207) |
| 1.2 | 4.7 | GO:0015056 | corticotrophin-releasing factor receptor activity(GO:0015056) |
| 1.0 | 4.8 | GO:0070051 | fibrinogen binding(GO:0070051) |
| 0.9 | 2.8 | GO:0061609 | fructose-1-phosphate aldolase activity(GO:0061609) |
| 0.9 | 6.2 | GO:0047184 | 1-acylglycerophosphocholine O-acyltransferase activity(GO:0047184) |
| 0.9 | 5.3 | GO:0051373 | FATZ binding(GO:0051373) |
| 0.9 | 6.1 | GO:0005497 | androgen binding(GO:0005497) |
| 0.8 | 10.6 | GO:0086056 | voltage-gated calcium channel activity involved in AV node cell action potential(GO:0086056) |
| 0.8 | 4.9 | GO:0004468 | lysine N-acetyltransferase activity, acting on acetyl phosphate as donor(GO:0004468) |
| 0.8 | 3.1 | GO:0017077 | oxidative phosphorylation uncoupler activity(GO:0017077) |
| 0.8 | 9.0 | GO:0008430 | selenium binding(GO:0008430) |
| 0.7 | 3.6 | GO:0003956 | NAD(P)+-protein-arginine ADP-ribosyltransferase activity(GO:0003956) |
| 0.7 | 3.6 | GO:0015639 | cadmium ion transmembrane transporter activity(GO:0015086) cobalt ion transmembrane transporter activity(GO:0015087) lead ion transmembrane transporter activity(GO:0015094) ferrous iron uptake transmembrane transporter activity(GO:0015639) |
| 0.7 | 2.9 | GO:0004348 | glucosylceramidase activity(GO:0004348) |
| 0.7 | 13.7 | GO:0008510 | sodium:bicarbonate symporter activity(GO:0008510) |
| 0.7 | 6.1 | GO:0043533 | inositol 1,3,4,5 tetrakisphosphate binding(GO:0043533) |
| 0.6 | 21.8 | GO:0008395 | steroid hydroxylase activity(GO:0008395) |
| 0.6 | 2.5 | GO:0001855 | complement component C4b binding(GO:0001855) |
| 0.6 | 1.9 | GO:0052815 | medium-chain acyl-CoA hydrolase activity(GO:0052815) long-chain acyl-CoA hydrolase activity(GO:0052816) |
| 0.6 | 4.2 | GO:0042289 | MHC class II protein binding(GO:0042289) |
| 0.6 | 9.5 | GO:0005149 | interleukin-1 receptor binding(GO:0005149) |
| 0.6 | 7.7 | GO:0005391 | sodium:potassium-exchanging ATPase activity(GO:0005391) steroid hormone binding(GO:1990239) |
| 0.5 | 15.6 | GO:0005212 | structural constituent of eye lens(GO:0005212) |
| 0.5 | 3.5 | GO:0016714 | oxidoreductase activity, acting on paired donors, with incorporation or reduction of molecular oxygen, reduced pteridine as one donor, and incorporation of one atom of oxygen(GO:0016714) |
| 0.5 | 6.3 | GO:0004723 | calcium-dependent protein serine/threonine phosphatase activity(GO:0004723) |
| 0.5 | 7.2 | GO:0016813 | hydrolase activity, acting on carbon-nitrogen (but not peptide) bonds, in linear amidines(GO:0016813) |
| 0.5 | 1.9 | GO:0022850 | serotonin-gated cation channel activity(GO:0022850) |
| 0.5 | 8.5 | GO:0004535 | poly(A)-specific ribonuclease activity(GO:0004535) |
| 0.5 | 2.3 | GO:0005222 | intracellular cAMP activated cation channel activity(GO:0005222) |
| 0.4 | 11.7 | GO:0004012 | phospholipid-translocating ATPase activity(GO:0004012) |
| 0.4 | 4.7 | GO:0055131 | C3HC4-type RING finger domain binding(GO:0055131) |
| 0.4 | 1.7 | GO:0031728 | CCR3 chemokine receptor binding(GO:0031728) |
| 0.4 | 4.9 | GO:0050700 | CARD domain binding(GO:0050700) |
| 0.4 | 5.2 | GO:0045504 | dynein heavy chain binding(GO:0045504) |
| 0.4 | 5.1 | GO:0031419 | cobalamin binding(GO:0031419) |
| 0.4 | 4.0 | GO:0016712 | oxidoreductase activity, acting on paired donors, with incorporation or reduction of molecular oxygen, reduced flavin or flavoprotein as one donor, and incorporation of one atom of oxygen(GO:0016712) |
| 0.4 | 22.1 | GO:0005154 | epidermal growth factor receptor binding(GO:0005154) |
| 0.3 | 3.1 | GO:0015143 | urate transmembrane transporter activity(GO:0015143) salt transmembrane transporter activity(GO:1901702) |
| 0.3 | 1.7 | GO:0048248 | CXCR3 chemokine receptor binding(GO:0048248) |
| 0.3 | 6.2 | GO:0001608 | G-protein coupled nucleotide receptor activity(GO:0001608) G-protein coupled purinergic nucleotide receptor activity(GO:0045028) |
| 0.3 | 1.0 | GO:0009032 | thymidine phosphorylase activity(GO:0009032) pyrimidine-nucleoside phosphorylase activity(GO:0016154) |
| 0.3 | 2.2 | GO:0019788 | NEDD8 transferase activity(GO:0019788) |
| 0.3 | 3.7 | GO:0030280 | structural constituent of epidermis(GO:0030280) |
| 0.3 | 0.9 | GO:0030158 | protein xylosyltransferase activity(GO:0030158) |
| 0.3 | 3.0 | GO:0008131 | primary amine oxidase activity(GO:0008131) |
| 0.3 | 5.5 | GO:0038191 | neuropilin binding(GO:0038191) |
| 0.3 | 2.9 | GO:0042731 | PH domain binding(GO:0042731) |
| 0.3 | 4.2 | GO:0005049 | nuclear export signal receptor activity(GO:0005049) |
| 0.3 | 1.1 | GO:0005111 | type 2 fibroblast growth factor receptor binding(GO:0005111) |
| 0.3 | 2.4 | GO:0035727 | lysophosphatidic acid binding(GO:0035727) |
| 0.3 | 1.1 | GO:0004743 | pyruvate kinase activity(GO:0004743) |
| 0.3 | 4.2 | GO:0016918 | retinal binding(GO:0016918) retinol binding(GO:0019841) |
| 0.3 | 4.4 | GO:0015125 | bile acid transmembrane transporter activity(GO:0015125) |
| 0.2 | 2.0 | GO:0004111 | creatine kinase activity(GO:0004111) |
| 0.2 | 7.1 | GO:0098641 | cadherin binding involved in cell-cell adhesion(GO:0098641) |
| 0.2 | 1.4 | GO:0034191 | apolipoprotein A-I receptor binding(GO:0034191) |
| 0.2 | 2.6 | GO:0033691 | sialic acid binding(GO:0033691) |
| 0.2 | 3.2 | GO:0004559 | alpha-mannosidase activity(GO:0004559) |
| 0.2 | 2.4 | GO:0072542 | protein phosphatase activator activity(GO:0072542) |
| 0.2 | 8.6 | GO:0071889 | 14-3-3 protein binding(GO:0071889) |
| 0.2 | 0.9 | GO:0015526 | hexose phosphate transmembrane transporter activity(GO:0015119) organophosphate:inorganic phosphate antiporter activity(GO:0015315) hexose-phosphate:inorganic phosphate antiporter activity(GO:0015526) glucose 6-phosphate:inorganic phosphate antiporter activity(GO:0061513) |
| 0.2 | 0.6 | GO:0043682 | copper-exporting ATPase activity(GO:0004008) copper-transporting ATPase activity(GO:0043682) |
| 0.2 | 5.0 | GO:0102391 | decanoate--CoA ligase activity(GO:0102391) |
| 0.2 | 1.3 | GO:1904929 | coreceptor activity involved in Wnt signaling pathway, planar cell polarity pathway(GO:1904929) |
| 0.2 | 19.6 | GO:0008307 | structural constituent of muscle(GO:0008307) |
| 0.2 | 4.4 | GO:0030275 | LRR domain binding(GO:0030275) |
| 0.2 | 3.4 | GO:0042813 | Wnt-activated receptor activity(GO:0042813) |
| 0.2 | 4.2 | GO:0015278 | calcium-release channel activity(GO:0015278) ligand-gated calcium channel activity(GO:0099604) |
| 0.2 | 8.7 | GO:0005504 | fatty acid binding(GO:0005504) |
| 0.2 | 6.8 | GO:0008066 | glutamate receptor activity(GO:0008066) |
| 0.1 | 1.3 | GO:0004969 | histamine receptor activity(GO:0004969) |
| 0.1 | 3.4 | GO:0016875 | aminoacyl-tRNA ligase activity(GO:0004812) ligase activity, forming carbon-oxygen bonds(GO:0016875) ligase activity, forming aminoacyl-tRNA and related compounds(GO:0016876) |
| 0.1 | 0.7 | GO:0043546 | molybdopterin cofactor binding(GO:0043546) |
| 0.1 | 3.8 | GO:0071949 | FAD binding(GO:0071949) |
| 0.1 | 7.4 | GO:0030507 | spectrin binding(GO:0030507) |
| 0.1 | 6.4 | GO:0003899 | DNA-directed RNA polymerase activity(GO:0003899) |
| 0.1 | 6.0 | GO:0005227 | calcium activated cation channel activity(GO:0005227) |
| 0.1 | 0.4 | GO:0033906 | hyaluronoglucuronidase activity(GO:0033906) |
| 0.1 | 4.0 | GO:0047555 | 3',5'-cyclic-GMP phosphodiesterase activity(GO:0047555) |
| 0.1 | 1.3 | GO:0004931 | extracellular ATP-gated cation channel activity(GO:0004931) ATP-gated ion channel activity(GO:0035381) |
| 0.1 | 1.0 | GO:0008271 | secondary active sulfate transmembrane transporter activity(GO:0008271) |
| 0.1 | 1.5 | GO:0005068 | transmembrane receptor protein tyrosine kinase adaptor activity(GO:0005068) |
| 0.1 | 3.7 | GO:0016702 | oxidoreductase activity, acting on single donors with incorporation of molecular oxygen, incorporation of two atoms of oxygen(GO:0016702) |
| 0.1 | 0.6 | GO:0016936 | galactoside binding(GO:0016936) |
| 0.1 | 4.9 | GO:0008408 | 3'-5' exonuclease activity(GO:0008408) |
| 0.1 | 2.8 | GO:0043325 | phosphatidylinositol-3,4-bisphosphate binding(GO:0043325) |
| 0.1 | 10.9 | GO:0004984 | olfactory receptor activity(GO:0004984) |
| 0.1 | 1.7 | GO:0008569 | ATP-dependent microtubule motor activity, minus-end-directed(GO:0008569) |
| 0.1 | 0.6 | GO:0004359 | glutaminase activity(GO:0004359) |
| 0.1 | 1.3 | GO:0036374 | glutathione hydrolase activity(GO:0036374) |
| 0.1 | 3.0 | GO:0019198 | transmembrane receptor protein tyrosine phosphatase activity(GO:0005001) transmembrane receptor protein phosphatase activity(GO:0019198) |
| 0.1 | 3.6 | GO:0005540 | hyaluronic acid binding(GO:0005540) |
| 0.1 | 12.2 | GO:0004222 | metalloendopeptidase activity(GO:0004222) |
| 0.1 | 5.8 | GO:0005507 | copper ion binding(GO:0005507) |
| 0.1 | 4.3 | GO:0043531 | ADP binding(GO:0043531) |
| 0.1 | 3.3 | GO:0004864 | protein phosphatase inhibitor activity(GO:0004864) |
| 0.1 | 0.3 | GO:0004906 | interferon-gamma receptor activity(GO:0004906) |
| 0.1 | 9.4 | GO:0004620 | phospholipase activity(GO:0004620) |
| 0.1 | 1.7 | GO:0008157 | protein phosphatase 1 binding(GO:0008157) |
| 0.1 | 1.0 | GO:0032393 | MHC class I receptor activity(GO:0032393) |
| 0.1 | 4.0 | GO:0003777 | microtubule motor activity(GO:0003777) |
| 0.1 | 1.1 | GO:0017034 | Rap guanyl-nucleotide exchange factor activity(GO:0017034) |
| 0.1 | 0.5 | GO:0016167 | glial cell-derived neurotrophic factor receptor activity(GO:0016167) |
| 0.1 | 2.6 | GO:0000146 | microfilament motor activity(GO:0000146) |
| 0.1 | 0.7 | GO:0042301 | phosphate ion binding(GO:0042301) |
| 0.1 | 2.5 | GO:0017091 | AU-rich element binding(GO:0017091) |
| 0.1 | 18.4 | GO:0004252 | serine-type endopeptidase activity(GO:0004252) |
| 0.1 | 0.5 | GO:0004499 | N,N-dimethylaniline monooxygenase activity(GO:0004499) |
| 0.1 | 13.1 | GO:0004386 | helicase activity(GO:0004386) |
| 0.1 | 0.6 | GO:0046974 | histone methyltransferase activity (H3-K9 specific)(GO:0046974) |
| 0.1 | 0.2 | GO:0004772 | sterol O-acyltransferase activity(GO:0004772) cholesterol O-acyltransferase activity(GO:0034736) |
| 0.1 | 7.1 | GO:0003707 | steroid hormone receptor activity(GO:0003707) |
| 0.1 | 3.9 | GO:0017080 | sodium channel regulator activity(GO:0017080) |
| 0.1 | 0.7 | GO:0015129 | lactate transmembrane transporter activity(GO:0015129) |
| 0.1 | 1.8 | GO:0005031 | tumor necrosis factor-activated receptor activity(GO:0005031) death receptor activity(GO:0005035) |
| 0.1 | 18.4 | GO:0008022 | protein C-terminus binding(GO:0008022) |
| 0.1 | 2.1 | GO:0019200 | carbohydrate kinase activity(GO:0019200) |
| 0.0 | 3.3 | GO:0048306 | calcium-dependent protein binding(GO:0048306) |
| 0.0 | 4.7 | GO:0008565 | protein transporter activity(GO:0008565) |
| 0.0 | 0.9 | GO:0004115 | 3',5'-cyclic-AMP phosphodiesterase activity(GO:0004115) |
| 0.0 | 4.6 | GO:0004519 | endonuclease activity(GO:0004519) |
| 0.0 | 1.1 | GO:0005086 | ARF guanyl-nucleotide exchange factor activity(GO:0005086) |
| 0.0 | 1.8 | GO:0034987 | immunoglobulin receptor binding(GO:0034987) |
| 0.0 | 0.7 | GO:0052629 | phosphatidylinositol-3,5-bisphosphate 3-phosphatase activity(GO:0052629) |
| 0.0 | 3.4 | GO:0004867 | serine-type endopeptidase inhibitor activity(GO:0004867) |
| 0.0 | 0.9 | GO:0004181 | metallocarboxypeptidase activity(GO:0004181) |
| 0.0 | 3.3 | GO:0008170 | N-methyltransferase activity(GO:0008170) |
| 0.0 | 0.4 | GO:0008503 | benzodiazepine receptor activity(GO:0008503) GABA-gated chloride ion channel activity(GO:0022851) |
| 0.0 | 7.6 | GO:0030246 | carbohydrate binding(GO:0030246) |
| 0.0 | 1.1 | GO:0030544 | Hsp70 protein binding(GO:0030544) |
| 0.0 | 1.1 | GO:0035035 | histone acetyltransferase binding(GO:0035035) |
| 0.0 | 0.1 | GO:0031726 | CCR1 chemokine receptor binding(GO:0031726) |
| 0.0 | 9.0 | GO:0003713 | transcription coactivator activity(GO:0003713) |
| 0.0 | 1.5 | GO:0004693 | cyclin-dependent protein serine/threonine kinase activity(GO:0004693) |
| 0.0 | 0.4 | GO:0042288 | MHC class I protein binding(GO:0042288) |
| 0.0 | 1.7 | GO:0005319 | lipid transporter activity(GO:0005319) |
| 0.0 | 2.1 | GO:0005179 | hormone activity(GO:0005179) |
| 0.0 | 0.4 | GO:0004190 | aspartic-type endopeptidase activity(GO:0004190) aspartic-type peptidase activity(GO:0070001) |
| 0.0 | 1.3 | GO:0004725 | protein tyrosine phosphatase activity(GO:0004725) |
| 0.0 | 1.2 | GO:0005518 | collagen binding(GO:0005518) |
| 0.0 | 3.9 | GO:0001077 | transcriptional activator activity, RNA polymerase II core promoter proximal region sequence-specific binding(GO:0001077) |
| 0.0 | 1.0 | GO:0001618 | virus receptor activity(GO:0001618) |
Gene overrepresentation in curated gene sets: canonical pathways category:
| Log-likelihood per target | Total log-likelihood | Term | Description |
|---|---|---|---|
| 0.3 | 11.1 | PID HDAC CLASSIII PATHWAY | Signaling events mediated by HDAC Class III |
| 0.2 | 17.4 | PID HNF3B PATHWAY | FOXA2 and FOXA3 transcription factor networks |
| 0.2 | 14.0 | PID ATR PATHWAY | ATR signaling pathway |
| 0.2 | 11.2 | PID HNF3A PATHWAY | FOXA1 transcription factor network |
| 0.1 | 6.3 | ST WNT CA2 CYCLIC GMP PATHWAY | Wnt/Ca2+/cyclic GMP signaling. |
| 0.1 | 2.9 | PID EPHA FWDPATHWAY | EPHA forward signaling |
| 0.1 | 10.6 | PID AR TF PATHWAY | Regulation of Androgen receptor activity |
| 0.1 | 8.7 | PID LKB1 PATHWAY | LKB1 signaling events |
| 0.1 | 6.1 | PID AR NONGENOMIC PATHWAY | Nongenotropic Androgen signaling |
| 0.1 | 2.2 | ST GAQ PATHWAY | G alpha q Pathway |
| 0.1 | 4.3 | PID RHOA PATHWAY | RhoA signaling pathway |
| 0.1 | 6.1 | PID ALPHA SYNUCLEIN PATHWAY | Alpha-synuclein signaling |
| 0.1 | 7.1 | SIG CHEMOTAXIS | Genes related to chemotaxis |
| 0.1 | 6.1 | PID ARF6 PATHWAY | Arf6 signaling events |
| 0.1 | 26.0 | NABA ECM REGULATORS | Genes encoding enzymes and their regulators involved in the remodeling of the extracellular matrix |
| 0.1 | 4.8 | NABA PROTEOGLYCANS | Genes encoding proteoglycans |
| 0.1 | 2.3 | PID RHODOPSIN PATHWAY | Visual signal transduction: Rods |
| 0.1 | 10.0 | PID MYC REPRESS PATHWAY | Validated targets of C-MYC transcriptional repression |
| 0.1 | 3.8 | PID INTEGRIN CS PATHWAY | Integrin family cell surface interactions |
| 0.1 | 1.7 | PID CXCR3 PATHWAY | CXCR3-mediated signaling events |
| 0.1 | 1.1 | PID INTEGRIN5 PATHWAY | Beta5 beta6 beta7 and beta8 integrin cell surface interactions |
| 0.1 | 12.8 | NABA ECM AFFILIATED | Genes encoding proteins affiliated structurally or functionally to extracellular matrix proteins |
| 0.1 | 2.1 | PID LYSOPHOSPHOLIPID PATHWAY | LPA receptor mediated events |
| 0.0 | 2.2 | PID ENDOTHELIN PATHWAY | Endothelins |
| 0.0 | 1.3 | PID WNT SIGNALING PATHWAY | Wnt signaling network |
| 0.0 | 4.2 | PID REG GR PATHWAY | Glucocorticoid receptor regulatory network |
| 0.0 | 1.7 | PID HIF2PATHWAY | HIF-2-alpha transcription factor network |
| 0.0 | 3.7 | PID CMYB PATHWAY | C-MYB transcription factor network |
| 0.0 | 0.9 | PID ERBB NETWORK PATHWAY | ErbB receptor signaling network |
| 0.0 | 3.7 | PID BETA CATENIN NUC PATHWAY | Regulation of nuclear beta catenin signaling and target gene transcription |
| 0.0 | 10.6 | NABA MATRISOME ASSOCIATED | Ensemble of genes encoding ECM-associated proteins including ECM-affilaited proteins, ECM regulators and secreted factors |
| 0.0 | 0.3 | ST INTERFERON GAMMA PATHWAY | Interferon gamma pathway. |
| 0.0 | 2.1 | PID P73PATHWAY | p73 transcription factor network |
| 0.0 | 4.0 | NABA ECM GLYCOPROTEINS | Genes encoding structural ECM glycoproteins |
Gene overrepresentation in curated gene sets: REACTOME pathways category:
| Log-likelihood per target | Total log-likelihood | Term | Description |
|---|---|---|---|
| 0.9 | 10.4 | REACTOME SYNTHESIS OF BILE ACIDS AND BILE SALTS VIA 24 HYDROXYCHOLESTEROL | Genes involved in Synthesis of bile acids and bile salts via 24-hydroxycholesterol |
| 0.9 | 15.4 | REACTOME XENOBIOTICS | Genes involved in Xenobiotics |
| 0.8 | 12.9 | REACTOME SYNTHESIS OF PE | Genes involved in Synthesis of PE |
| 0.5 | 9.7 | REACTOME COMMON PATHWAY | Genes involved in Common Pathway |
| 0.5 | 6.2 | REACTOME SYNTHESIS OF BILE ACIDS AND BILE SALTS VIA 7ALPHA HYDROXYCHOLESTEROL | Genes involved in Synthesis of bile acids and bile salts via 7alpha-hydroxycholesterol |
| 0.5 | 5.7 | REACTOME GAMMA CARBOXYLATION TRANSPORT AND AMINO TERMINAL CLEAVAGE OF PROTEINS | Genes involved in Gamma-carboxylation, transport, and amino-terminal cleavage of proteins |
| 0.5 | 3.3 | REACTOME MEMBRANE BINDING AND TARGETTING OF GAG PROTEINS | Genes involved in Membrane binding and targetting of GAG proteins |
| 0.5 | 22.8 | REACTOME AMINO ACID TRANSPORT ACROSS THE PLASMA MEMBRANE | Genes involved in Amino acid transport across the plasma membrane |
| 0.4 | 10.5 | REACTOME REGULATION OF AMPK ACTIVITY VIA LKB1 | Genes involved in Regulation of AMPK activity via LKB1 |
| 0.4 | 6.2 | REACTOME ACYL CHAIN REMODELLING OF PS | Genes involved in Acyl chain remodelling of PS |
| 0.4 | 19.9 | REACTOME ION TRANSPORT BY P TYPE ATPASES | Genes involved in Ion transport by P-type ATPases |
| 0.4 | 7.2 | REACTOME METABOLISM OF POLYAMINES | Genes involved in Metabolism of polyamines |
| 0.3 | 5.1 | REACTOME ABACAVIR TRANSPORT AND METABOLISM | Genes involved in Abacavir transport and metabolism |
| 0.3 | 6.8 | REACTOME CLASS C 3 METABOTROPIC GLUTAMATE PHEROMONE RECEPTORS | Genes involved in Class C/3 (Metabotropic glutamate/pheromone receptors) |
| 0.3 | 6.2 | REACTOME P2Y RECEPTORS | Genes involved in P2Y receptors |
| 0.3 | 3.9 | REACTOME REGULATION OF THE FANCONI ANEMIA PATHWAY | Genes involved in Regulation of the Fanconi anemia pathway |
| 0.3 | 4.2 | REACTOME NEF MEDIATED DOWNREGULATION OF MHC CLASS I COMPLEX CELL SURFACE EXPRESSION | Genes involved in Nef mediated downregulation of MHC class I complex cell surface expression |
| 0.3 | 6.6 | REACTOME HDL MEDIATED LIPID TRANSPORT | Genes involved in HDL-mediated lipid transport |
| 0.2 | 5.5 | REACTOME OTHER SEMAPHORIN INTERACTIONS | Genes involved in Other semaphorin interactions |
| 0.2 | 8.8 | REACTOME TRAF6 MEDIATED IRF7 ACTIVATION | Genes involved in TRAF6 mediated IRF7 activation |
| 0.2 | 3.4 | REACTOME MITOCHONDRIAL TRNA AMINOACYLATION | Genes involved in Mitochondrial tRNA aminoacylation |
| 0.2 | 5.0 | REACTOME SYNTHESIS OF VERY LONG CHAIN FATTY ACYL COAS | Genes involved in Synthesis of very long-chain fatty acyl-CoAs |
| 0.2 | 2.2 | REACTOME AKT PHOSPHORYLATES TARGETS IN THE CYTOSOL | Genes involved in AKT phosphorylates targets in the cytosol |
| 0.1 | 1.3 | REACTOME ELEVATION OF CYTOSOLIC CA2 LEVELS | Genes involved in Elevation of cytosolic Ca2+ levels |
| 0.1 | 1.6 | REACTOME CREATION OF C4 AND C2 ACTIVATORS | Genes involved in Creation of C4 and C2 activators |
| 0.1 | 13.8 | REACTOME TRANSPORT OF INORGANIC CATIONS ANIONS AND AMINO ACIDS OLIGOPEPTIDES | Genes involved in Transport of inorganic cations/anions and amino acids/oligopeptides |
| 0.1 | 3.6 | REACTOME CS DS DEGRADATION | Genes involved in CS/DS degradation |
| 0.1 | 8.1 | REACTOME REGULATION OF BETA CELL DEVELOPMENT | Genes involved in Regulation of beta-cell development |
| 0.1 | 1.3 | REACTOME THE ACTIVATION OF ARYLSULFATASES | Genes involved in The activation of arylsulfatases |
| 0.1 | 5.4 | REACTOME INTERACTIONS OF VPR WITH HOST CELLULAR PROTEINS | Genes involved in Interactions of Vpr with host cellular proteins |
| 0.1 | 0.7 | REACTOME PURINE CATABOLISM | Genes involved in Purine catabolism |
| 0.1 | 7.6 | REACTOME RNA POL I RNA POL III AND MITOCHONDRIAL TRANSCRIPTION | Genes involved in RNA Polymerase I, RNA Polymerase III, and Mitochondrial Transcription |
| 0.1 | 1.7 | REACTOME CHYLOMICRON MEDIATED LIPID TRANSPORT | Genes involved in Chylomicron-mediated lipid transport |
| 0.1 | 2.2 | REACTOME TRAF6 MEDIATED NFKB ACTIVATION | Genes involved in TRAF6 mediated NF-kB activation |
| 0.1 | 1.3 | REACTOME E2F ENABLED INHIBITION OF PRE REPLICATION COMPLEX FORMATION | Genes involved in E2F-enabled inhibition of pre-replication complex formation |
| 0.1 | 2.4 | REACTOME REGULATION OF INSULIN LIKE GROWTH FACTOR IGF ACTIVITY BY INSULIN LIKE GROWTH FACTOR BINDING PROTEINS IGFBPS | Genes involved in Regulation of Insulin-like Growth Factor (IGF) Activity by Insulin-like Growth Factor Binding Proteins (IGFBPs) |
| 0.1 | 5.6 | REACTOME RNA POL II TRANSCRIPTION PRE INITIATION AND PROMOTER OPENING | Genes involved in RNA Polymerase II Transcription Pre-Initiation And Promoter Opening |
| 0.1 | 19.6 | REACTOME PEPTIDE LIGAND BINDING RECEPTORS | Genes involved in Peptide ligand-binding receptors |
| 0.1 | 2.3 | REACTOME PROTEOLYTIC CLEAVAGE OF SNARE COMPLEX PROTEINS | Genes involved in Proteolytic cleavage of SNARE complex proteins |
| 0.1 | 7.9 | REACTOME OLFACTORY SIGNALING PATHWAY | Genes involved in Olfactory Signaling Pathway |
| 0.1 | 4.0 | REACTOME CGMP EFFECTS | Genes involved in cGMP effects |
| 0.1 | 2.9 | REACTOME GLYCOSPHINGOLIPID METABOLISM | Genes involved in Glycosphingolipid metabolism |
| 0.1 | 1.0 | REACTOME PYRIMIDINE CATABOLISM | Genes involved in Pyrimidine catabolism |
| 0.1 | 4.1 | REACTOME STRIATED MUSCLE CONTRACTION | Genes involved in Striated Muscle Contraction |
| 0.1 | 0.9 | REACTOME BILE SALT AND ORGANIC ANION SLC TRANSPORTERS | Genes involved in Bile salt and organic anion SLC transporters |
| 0.1 | 2.6 | REACTOME TRANSCRIPTIONAL REGULATION OF WHITE ADIPOCYTE DIFFERENTIATION | Genes involved in Transcriptional Regulation of White Adipocyte Differentiation |
| 0.0 | 1.5 | REACTOME G0 AND EARLY G1 | Genes involved in G0 and Early G1 |
| 0.0 | 2.3 | REACTOME LIGAND GATED ION CHANNEL TRANSPORT | Genes involved in Ligand-gated ion channel transport |
| 0.0 | 1.3 | REACTOME PROLACTIN RECEPTOR SIGNALING | Genes involved in Prolactin receptor signaling |
| 0.0 | 1.6 | REACTOME INHIBITION OF INSULIN SECRETION BY ADRENALINE NORADRENALINE | Genes involved in Inhibition of Insulin Secretion by Adrenaline/Noradrenaline |
| 0.0 | 2.5 | REACTOME PHASE1 FUNCTIONALIZATION OF COMPOUNDS | Genes involved in Phase 1 - Functionalization of compounds |
| 0.0 | 3.0 | REACTOME RESPONSE TO ELEVATED PLATELET CYTOSOLIC CA2 | Genes involved in Response to elevated platelet cytosolic Ca2+ |
| 0.0 | 0.9 | REACTOME ACTIVATION OF RAC | Genes involved in Activation of Rac |
| 0.0 | 2.0 | REACTOME REGULATION OF WATER BALANCE BY RENAL AQUAPORINS | Genes involved in Regulation of Water Balance by Renal Aquaporins |
| 0.0 | 1.5 | REACTOME DOWNSTREAM TCR SIGNALING | Genes involved in Downstream TCR signaling |
| 0.0 | 0.6 | REACTOME GLUTAMATE NEUROTRANSMITTER RELEASE CYCLE | Genes involved in Glutamate Neurotransmitter Release Cycle |
| 0.0 | 2.1 | REACTOME IMMUNOREGULATORY INTERACTIONS BETWEEN A LYMPHOID AND A NON LYMPHOID CELL | Genes involved in Immunoregulatory interactions between a Lymphoid and a non-Lymphoid cell |
| 0.0 | 0.3 | REACTOME REGULATION OF IFNG SIGNALING | Genes involved in Regulation of IFNG signaling |
| 0.0 | 5.6 | REACTOME GENERIC TRANSCRIPTION PATHWAY | Genes involved in Generic Transcription Pathway |