Project
GNF SymAtlas + NCI-60 cancer cell lines, human (Su, 2004; Ross, 2000)
Navigation
Downloads
Results for NR3C1
Z-value: 1.93
Motif logo
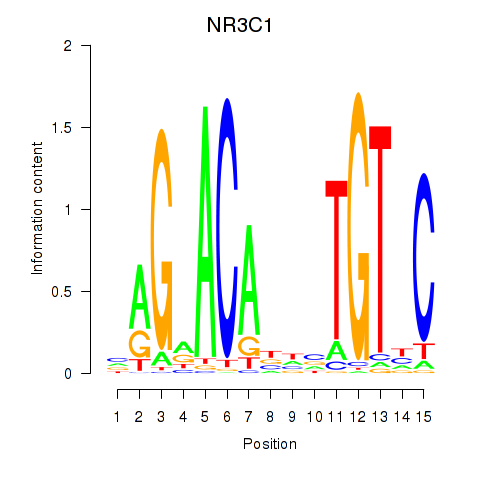
Transcription factors associated with NR3C1
| Gene Symbol | Gene ID | Gene Info |
|---|---|---|
|
NR3C1
|
ENSG00000113580.15 | NR3C1 |
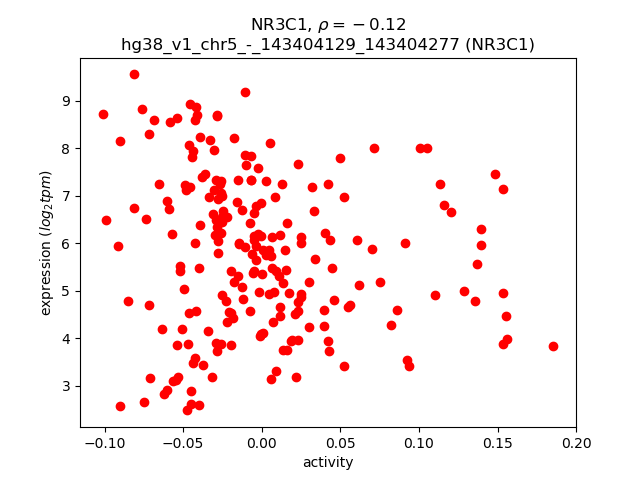
Activity-expression correlation:
| Gene | Promoter | Pearson corr. coef. | P-value | Plot |
|---|---|---|---|---|
| NR3C1 | hg38_v1_chr5_-_143404129_143404277, hg38_v1_chr5_-_143434677_143434713 | -0.12 | 8.6e-02 | Click! |
Activity profile of NR3C1 motif
Sorted Z-values of NR3C1 motif
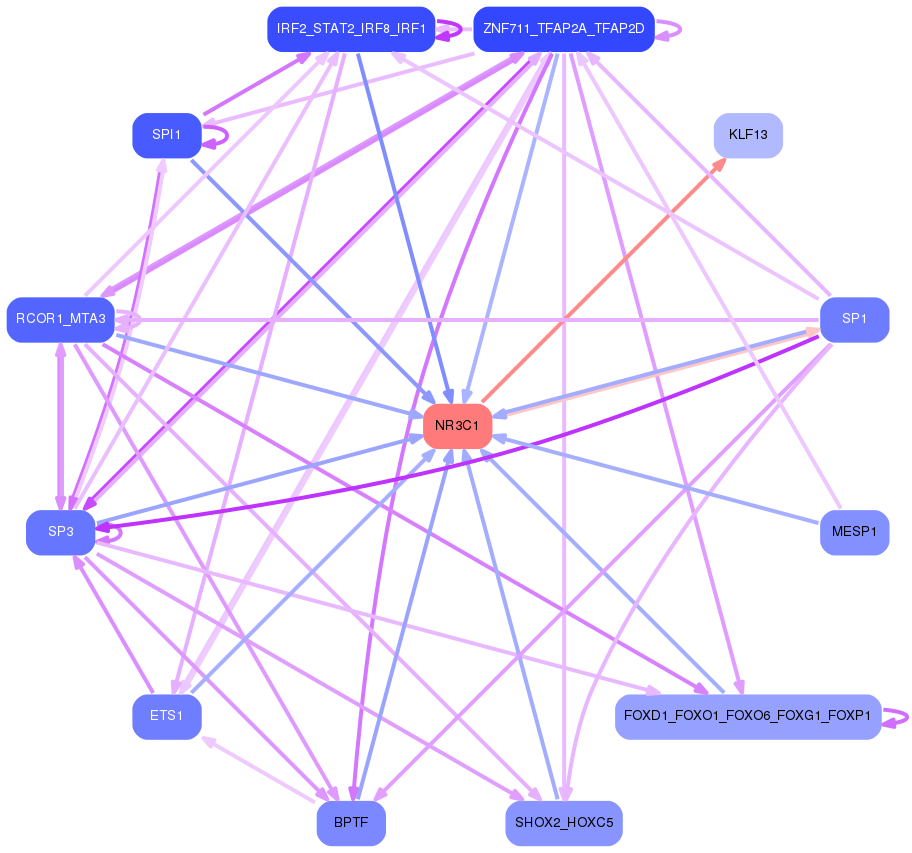
Network of associatons between targets according to the STRING database.

First level regulatory network of NR3C1
Gene Ontology Analysis
Gene overrepresentation in biological process category:
| Log-likelihood per target | Total log-likelihood | Term | Description |
|---|---|---|---|
| 10.4 | 31.1 | GO:0035691 | macrophage migration inhibitory factor signaling pathway(GO:0035691) |
| 7.6 | 22.9 | GO:0001869 | regulation of complement activation, lectin pathway(GO:0001868) negative regulation of complement activation, lectin pathway(GO:0001869) |
| 6.9 | 20.8 | GO:0033364 | mast cell secretory granule organization(GO:0033364) |
| 6.8 | 27.1 | GO:0070434 | positive regulation of nucleotide-binding oligomerization domain containing signaling pathway(GO:0070426) positive regulation of nucleotide-binding oligomerization domain containing 2 signaling pathway(GO:0070434) |
| 6.5 | 58.5 | GO:0060267 | positive regulation of respiratory burst(GO:0060267) |
| 6.1 | 18.3 | GO:0000738 | DNA catabolic process, exonucleolytic(GO:0000738) |
| 5.7 | 17.1 | GO:0060448 | dichotomous subdivision of terminal units involved in lung branching(GO:0060448) |
| 5.7 | 17.0 | GO:0071461 | cellular response to redox state(GO:0071461) |
| 5.0 | 723.9 | GO:0006958 | complement activation, classical pathway(GO:0006958) |
| 4.5 | 13.6 | GO:0002415 | immunoglobulin transcytosis in epithelial cells mediated by polymeric immunoglobulin receptor(GO:0002415) |
| 4.2 | 16.9 | GO:0006542 | glutamine biosynthetic process(GO:0006542) |
| 4.2 | 41.6 | GO:0044800 | fusion of virus membrane with host plasma membrane(GO:0019064) membrane fusion involved in viral entry into host cell(GO:0039663) multi-organism membrane fusion(GO:0044800) |
| 3.5 | 10.4 | GO:0090285 | negative regulation of protein glycosylation in Golgi(GO:0090285) |
| 3.2 | 9.5 | GO:0034769 | basement membrane disassembly(GO:0034769) |
| 3.0 | 23.7 | GO:0001887 | selenium compound metabolic process(GO:0001887) |
| 2.6 | 7.9 | GO:1903015 | regulation of exo-alpha-sialidase activity(GO:1903015) |
| 2.4 | 7.2 | GO:2000412 | positive regulation of tumor necrosis factor (ligand) superfamily member 11 production(GO:2000309) positive regulation of thymocyte migration(GO:2000412) |
| 2.4 | 9.5 | GO:0005986 | sucrose biosynthetic process(GO:0005986) |
| 2.3 | 13.9 | GO:0010731 | protein glutathionylation(GO:0010731) regulation of protein glutathionylation(GO:0010732) negative regulation of protein glutathionylation(GO:0010734) |
| 2.2 | 6.6 | GO:0043012 | regulation of fusion of sperm to egg plasma membrane(GO:0043012) |
| 2.2 | 10.9 | GO:0097167 | circadian regulation of translation(GO:0097167) |
| 2.2 | 15.2 | GO:1904098 | regulation of protein O-linked glycosylation(GO:1904098) positive regulation of protein O-linked glycosylation(GO:1904100) |
| 2.2 | 6.5 | GO:0046967 | cytosol to ER transport(GO:0046967) |
| 1.8 | 3.6 | GO:0034983 | peptidyl-lysine deacetylation(GO:0034983) |
| 1.8 | 15.8 | GO:2000124 | regulation of endocannabinoid signaling pathway(GO:2000124) |
| 1.7 | 13.7 | GO:0006572 | tyrosine catabolic process(GO:0006572) |
| 1.7 | 10.0 | GO:0016554 | cytidine to uridine editing(GO:0016554) |
| 1.7 | 5.0 | GO:0099557 | trans-synaptic signaling by trans-synaptic complex, modulating synaptic transmission(GO:0099557) |
| 1.6 | 19.7 | GO:0045647 | negative regulation of erythrocyte differentiation(GO:0045647) |
| 1.6 | 4.9 | GO:0003245 | cardiac muscle tissue growth involved in heart morphogenesis(GO:0003245) |
| 1.6 | 6.5 | GO:0002540 | arachidonic acid metabolite production involved in inflammatory response(GO:0002538) leukotriene production involved in inflammatory response(GO:0002540) |
| 1.6 | 9.8 | GO:0009753 | response to jasmonic acid(GO:0009753) cellular response to jasmonic acid stimulus(GO:0071395) |
| 1.6 | 16.2 | GO:2001106 | regulation of Rho guanyl-nucleotide exchange factor activity(GO:2001106) |
| 1.6 | 9.7 | GO:0036100 | leukotriene catabolic process(GO:0036100) leukotriene B4 catabolic process(GO:0036101) leukotriene B4 metabolic process(GO:0036102) icosanoid catabolic process(GO:1901523) fatty acid derivative catabolic process(GO:1901569) |
| 1.6 | 19.1 | GO:0006069 | ethanol oxidation(GO:0006069) |
| 1.6 | 6.3 | GO:1902283 | negative regulation of primary amine oxidase activity(GO:1902283) |
| 1.5 | 6.1 | GO:0070940 | dephosphorylation of RNA polymerase II C-terminal domain(GO:0070940) |
| 1.5 | 6.0 | GO:0060734 | regulation of endoplasmic reticulum stress-induced eIF2 alpha phosphorylation(GO:0060734) |
| 1.5 | 4.4 | GO:1904908 | negative regulation of maintenance of sister chromatid cohesion(GO:0034092) negative regulation of maintenance of mitotic sister chromatid cohesion(GO:0034183) maintenance of mitotic sister chromatid cohesion, telomeric(GO:0099403) mitotic sister chromatid cohesion, telomeric(GO:0099404) regulation of maintenance of mitotic sister chromatid cohesion, telomeric(GO:1904907) negative regulation of maintenance of mitotic sister chromatid cohesion, telomeric(GO:1904908) |
| 1.5 | 4.4 | GO:0006421 | asparaginyl-tRNA aminoacylation(GO:0006421) |
| 1.4 | 4.3 | GO:1902948 | regulation of choline O-acetyltransferase activity(GO:1902769) positive regulation of choline O-acetyltransferase activity(GO:1902771) negative regulation of tau-protein kinase activity(GO:1902948) positive regulation of early endosome to recycling endosome transport(GO:1902955) negative regulation of aspartic-type endopeptidase activity involved in amyloid precursor protein catabolic process(GO:1902960) regulation of neurofibrillary tangle assembly(GO:1902996) negative regulation of neurofibrillary tangle assembly(GO:1902997) negative regulation of aspartic-type peptidase activity(GO:1905246) |
| 1.4 | 5.8 | GO:0006049 | UDP-N-acetylglucosamine catabolic process(GO:0006049) |
| 1.4 | 5.7 | GO:0045659 | regulation of neutrophil differentiation(GO:0045658) negative regulation of neutrophil differentiation(GO:0045659) |
| 1.4 | 7.1 | GO:0030035 | microspike assembly(GO:0030035) |
| 1.4 | 5.6 | GO:0035936 | testosterone secretion(GO:0035936) regulation of testosterone secretion(GO:2000843) positive regulation of testosterone secretion(GO:2000845) |
| 1.4 | 4.1 | GO:0090031 | positive regulation of steroid hormone biosynthetic process(GO:0090031) |
| 1.3 | 5.4 | GO:0035790 | platelet-derived growth factor receptor-alpha signaling pathway(GO:0035790) |
| 1.3 | 25.3 | GO:0015671 | oxygen transport(GO:0015671) |
| 1.3 | 4.0 | GO:0042560 | folic acid-containing compound catabolic process(GO:0009397) pteridine-containing compound catabolic process(GO:0042560) |
| 1.3 | 3.9 | GO:1901074 | cellular response to interleukin-13(GO:0035963) regulation of engulfment of apoptotic cell(GO:1901074) lipoxin biosynthetic process(GO:2001301) lipoxin A4 metabolic process(GO:2001302) lipoxin A4 biosynthetic process(GO:2001303) |
| 1.3 | 6.5 | GO:0035900 | response to isolation stress(GO:0035900) |
| 1.3 | 10.2 | GO:0070235 | regulation of activation-induced cell death of T cells(GO:0070235) negative regulation of activation-induced cell death of T cells(GO:0070236) |
| 1.2 | 3.7 | GO:0097535 | lymphoid lineage cell migration(GO:0097534) lymphoid lineage cell migration into thymus(GO:0097535) regulation of positive thymic T cell selection(GO:1902232) |
| 1.2 | 2.4 | GO:0032058 | positive regulation of translational initiation in response to stress(GO:0032058) |
| 1.2 | 9.5 | GO:1900113 | negative regulation of histone H3-K9 trimethylation(GO:1900113) |
| 1.2 | 7.1 | GO:0010936 | negative regulation of macrophage cytokine production(GO:0010936) |
| 1.2 | 17.5 | GO:0048298 | positive regulation of isotype switching to IgA isotypes(GO:0048298) |
| 1.2 | 4.6 | GO:1904640 | response to methionine(GO:1904640) |
| 1.1 | 4.4 | GO:2000313 | fibroblast growth factor receptor signaling pathway involved in neural plate anterior/posterior pattern formation(GO:0060825) regulation of neural crest formation(GO:0090299) negative regulation of neural crest formation(GO:0090301) regulation of fibroblast growth factor receptor signaling pathway involved in neural plate anterior/posterior pattern formation(GO:2000313) negative regulation of fibroblast growth factor receptor signaling pathway involved in neural plate anterior/posterior pattern formation(GO:2000314) |
| 1.1 | 4.2 | GO:2000170 | positive regulation of actin filament-based movement(GO:1903116) positive regulation of peptidyl-cysteine S-nitrosylation(GO:2000170) |
| 1.0 | 6.2 | GO:0035624 | receptor transactivation(GO:0035624) |
| 1.0 | 3.0 | GO:1903336 | negative regulation of vacuolar transport(GO:1903336) |
| 1.0 | 6.1 | GO:0033152 | immunoglobulin V(D)J recombination(GO:0033152) |
| 1.0 | 8.0 | GO:0045779 | negative regulation of bone resorption(GO:0045779) |
| 1.0 | 3.0 | GO:0006842 | tricarboxylic acid transport(GO:0006842) citrate transport(GO:0015746) |
| 1.0 | 3.0 | GO:0038156 | interleukin-5-mediated signaling pathway(GO:0038043) interleukin-3-mediated signaling pathway(GO:0038156) |
| 1.0 | 3.0 | GO:0002101 | tRNA wobble cytosine modification(GO:0002101) |
| 1.0 | 12.8 | GO:0002291 | T cell activation via T cell receptor contact with antigen bound to MHC molecule on antigen presenting cell(GO:0002291) |
| 1.0 | 2.9 | GO:0042377 | menaquinone catabolic process(GO:0042361) vitamin K catabolic process(GO:0042377) |
| 1.0 | 4.8 | GO:0050861 | positive regulation of B cell receptor signaling pathway(GO:0050861) |
| 0.9 | 2.8 | GO:2001183 | negative regulation of interleukin-12 secretion(GO:2001183) |
| 0.9 | 2.7 | GO:1903238 | positive regulation of leukocyte tethering or rolling(GO:1903238) |
| 0.9 | 10.0 | GO:0016127 | cholesterol catabolic process(GO:0006707) sterol catabolic process(GO:0016127) |
| 0.9 | 3.6 | GO:1901594 | detection of temperature stimulus involved in thermoception(GO:0050960) response to capsazepine(GO:1901594) |
| 0.9 | 2.7 | GO:0006683 | galactosylceramide catabolic process(GO:0006683) |
| 0.9 | 3.6 | GO:0019805 | quinolinate biosynthetic process(GO:0019805) |
| 0.9 | 16.9 | GO:0033539 | fatty acid beta-oxidation using acyl-CoA dehydrogenase(GO:0033539) |
| 0.9 | 10.7 | GO:0043587 | tongue morphogenesis(GO:0043587) |
| 0.9 | 8.0 | GO:1903748 | negative regulation of establishment of protein localization to mitochondrion(GO:1903748) |
| 0.9 | 26.3 | GO:0035590 | purinergic nucleotide receptor signaling pathway(GO:0035590) |
| 0.9 | 3.5 | GO:0048865 | stem cell fate commitment(GO:0048865) |
| 0.9 | 6.1 | GO:0045919 | positive regulation of cytolysis(GO:0045919) |
| 0.9 | 3.4 | GO:1903899 | lung goblet cell differentiation(GO:0060480) positive regulation of PERK-mediated unfolded protein response(GO:1903899) |
| 0.9 | 15.3 | GO:0006054 | N-acetylneuraminate metabolic process(GO:0006054) |
| 0.8 | 4.2 | GO:0048096 | chromatin-mediated maintenance of transcription(GO:0048096) |
| 0.8 | 0.8 | GO:0034721 | histone H3-K4 demethylation, trimethyl-H3-K4-specific(GO:0034721) |
| 0.8 | 4.2 | GO:0018352 | protein-pyridoxal-5-phosphate linkage(GO:0018352) |
| 0.8 | 9.0 | GO:0045651 | positive regulation of macrophage differentiation(GO:0045651) |
| 0.8 | 3.2 | GO:0019918 | peptidyl-arginine methylation, to symmetrical-dimethyl arginine(GO:0019918) |
| 0.8 | 8.9 | GO:0006685 | sphingomyelin catabolic process(GO:0006685) |
| 0.8 | 7.2 | GO:0061179 | negative regulation of insulin secretion involved in cellular response to glucose stimulus(GO:0061179) |
| 0.8 | 6.3 | GO:0031666 | positive regulation of lipopolysaccharide-mediated signaling pathway(GO:0031666) |
| 0.8 | 3.9 | GO:0006127 | glycerophosphate shuttle(GO:0006127) |
| 0.8 | 4.5 | GO:0000707 | meiotic DNA recombinase assembly(GO:0000707) |
| 0.7 | 17.9 | GO:0071294 | cellular response to zinc ion(GO:0071294) |
| 0.7 | 13.4 | GO:0019371 | cyclooxygenase pathway(GO:0019371) |
| 0.7 | 2.2 | GO:0002436 | immune complex clearance(GO:0002434) immune complex clearance by monocytes and macrophages(GO:0002436) T cell extravasation(GO:0072683) regulation of immune complex clearance by monocytes and macrophages(GO:0090264) response to cyclosporin A(GO:1905237) positive regulation of apoptotic cell clearance(GO:2000427) |
| 0.7 | 12.4 | GO:0090360 | platelet-derived growth factor production(GO:0090360) regulation of platelet-derived growth factor production(GO:0090361) |
| 0.7 | 13.8 | GO:2001241 | positive regulation of extrinsic apoptotic signaling pathway in absence of ligand(GO:2001241) |
| 0.7 | 2.2 | GO:0005989 | lactose metabolic process(GO:0005988) lactose biosynthetic process(GO:0005989) dehydroascorbic acid transport(GO:0070837) |
| 0.7 | 14.5 | GO:0043485 | endosome to melanosome transport(GO:0035646) endosome to pigment granule transport(GO:0043485) pigment granule maturation(GO:0048757) |
| 0.7 | 9.4 | GO:0060992 | response to fungicide(GO:0060992) |
| 0.7 | 2.1 | GO:0009051 | pentose-phosphate shunt, oxidative branch(GO:0009051) |
| 0.7 | 2.1 | GO:0021558 | trochlear nerve development(GO:0021558) |
| 0.7 | 3.4 | GO:0052203 | modulation by symbiont of host molecular function(GO:0052055) modulation of catalytic activity in other organism involved in symbiotic interaction(GO:0052203) modulation by host of symbiont catalytic activity(GO:0052422) |
| 0.7 | 2.0 | GO:0050760 | negative regulation of thymidylate synthase biosynthetic process(GO:0050760) |
| 0.7 | 103.7 | GO:0002377 | immunoglobulin production(GO:0002377) |
| 0.7 | 4.7 | GO:0071421 | manganese ion transmembrane transport(GO:0071421) |
| 0.7 | 2.0 | GO:0046521 | sphingoid catabolic process(GO:0046521) |
| 0.7 | 2.0 | GO:1903347 | negative regulation of bicellular tight junction assembly(GO:1903347) |
| 0.7 | 2.0 | GO:0002143 | tRNA wobble position uridine thiolation(GO:0002143) |
| 0.7 | 9.9 | GO:0002523 | leukocyte migration involved in inflammatory response(GO:0002523) |
| 0.7 | 1.3 | GO:0035754 | B cell chemotaxis(GO:0035754) |
| 0.7 | 6.5 | GO:0006048 | UDP-N-acetylglucosamine biosynthetic process(GO:0006048) amino sugar biosynthetic process(GO:0046349) |
| 0.6 | 5.8 | GO:0051026 | chiasma assembly(GO:0051026) |
| 0.6 | 13.5 | GO:0032366 | intracellular sterol transport(GO:0032366) intracellular cholesterol transport(GO:0032367) |
| 0.6 | 3.8 | GO:0060084 | synaptic transmission involved in micturition(GO:0060084) |
| 0.6 | 2.5 | GO:0000023 | maltose metabolic process(GO:0000023) |
| 0.6 | 16.9 | GO:0032729 | positive regulation of interferon-gamma production(GO:0032729) |
| 0.6 | 3.7 | GO:0060029 | convergent extension involved in organogenesis(GO:0060029) |
| 0.6 | 3.7 | GO:0033133 | positive regulation of glucokinase activity(GO:0033133) |
| 0.6 | 1.9 | GO:0036166 | phenotypic switching(GO:0036166) regulation of phenotypic switching(GO:1900239) |
| 0.6 | 10.8 | GO:2000291 | regulation of myoblast proliferation(GO:2000291) |
| 0.6 | 7.1 | GO:0048251 | elastic fiber assembly(GO:0048251) |
| 0.6 | 5.3 | GO:0036066 | protein O-linked fucosylation(GO:0036066) |
| 0.6 | 4.7 | GO:0097411 | hypoxia-inducible factor-1alpha signaling pathway(GO:0097411) |
| 0.6 | 4.1 | GO:1903236 | regulation of leukocyte tethering or rolling(GO:1903236) |
| 0.6 | 2.9 | GO:2000773 | negative regulation of cellular senescence(GO:2000773) |
| 0.6 | 4.6 | GO:0002430 | complement receptor mediated signaling pathway(GO:0002430) |
| 0.6 | 5.1 | GO:0017062 | respiratory chain complex III assembly(GO:0017062) mitochondrial respiratory chain complex III assembly(GO:0034551) |
| 0.6 | 5.1 | GO:0086024 | adrenergic receptor signaling pathway involved in positive regulation of heart rate(GO:0086024) |
| 0.6 | 2.3 | GO:0030047 | actin modification(GO:0030047) |
| 0.6 | 4.5 | GO:0017183 | peptidyl-diphthamide metabolic process(GO:0017182) peptidyl-diphthamide biosynthetic process from peptidyl-histidine(GO:0017183) |
| 0.6 | 4.4 | GO:1903960 | negative regulation of anion transmembrane transport(GO:1903960) |
| 0.5 | 2.2 | GO:0071918 | urea transmembrane transport(GO:0071918) |
| 0.5 | 184.0 | GO:0002250 | adaptive immune response(GO:0002250) |
| 0.5 | 0.5 | GO:0006408 | snRNA export from nucleus(GO:0006408) |
| 0.5 | 3.1 | GO:1901029 | negative regulation of mitochondrial outer membrane permeabilization involved in apoptotic signaling pathway(GO:1901029) |
| 0.5 | 9.8 | GO:0038092 | nodal signaling pathway(GO:0038092) |
| 0.5 | 2.0 | GO:0021965 | spinal cord ventral commissure morphogenesis(GO:0021965) |
| 0.5 | 2.0 | GO:0046601 | positive regulation of centrosome duplication(GO:0010825) positive regulation of centriole replication(GO:0046601) |
| 0.5 | 2.0 | GO:2000400 | positive regulation of T cell differentiation in thymus(GO:0033089) positive regulation of thymocyte aggregation(GO:2000400) |
| 0.5 | 2.4 | GO:0039019 | posttranslational protein targeting to membrane(GO:0006620) pronephric nephron development(GO:0039019) |
| 0.5 | 4.6 | GO:0034392 | negative regulation of smooth muscle cell apoptotic process(GO:0034392) |
| 0.5 | 4.1 | GO:0099566 | regulation of postsynaptic cytosolic calcium ion concentration(GO:0099566) |
| 0.5 | 5.5 | GO:0007076 | mitotic chromosome condensation(GO:0007076) |
| 0.5 | 2.3 | GO:0030242 | pexophagy(GO:0030242) |
| 0.5 | 5.9 | GO:0045792 | negative regulation of cell size(GO:0045792) |
| 0.5 | 1.8 | GO:0032910 | B cell receptor transport within lipid bilayer(GO:0032595) B cell receptor transport into membrane raft(GO:0032597) protein transport out of membrane raft(GO:0032599) chemokine receptor transport out of membrane raft(GO:0032600) transforming growth factor beta3 production(GO:0032907) regulation of transforming growth factor beta3 production(GO:0032910) negative regulation of transforming growth factor beta3 production(GO:0032913) chemokine receptor transport within lipid bilayer(GO:0033606) |
| 0.5 | 2.3 | GO:0007341 | penetration of zona pellucida(GO:0007341) |
| 0.4 | 7.9 | GO:0060004 | reflex(GO:0060004) |
| 0.4 | 3.4 | GO:0006477 | protein sulfation(GO:0006477) |
| 0.4 | 3.8 | GO:0035865 | cellular response to potassium ion(GO:0035865) |
| 0.4 | 1.7 | GO:1990086 | lens fiber cell apoptotic process(GO:1990086) |
| 0.4 | 2.1 | GO:0007161 | calcium-independent cell-matrix adhesion(GO:0007161) |
| 0.4 | 8.3 | GO:0016254 | preassembly of GPI anchor in ER membrane(GO:0016254) |
| 0.4 | 2.9 | GO:0015705 | iodide transport(GO:0015705) |
| 0.4 | 11.3 | GO:0009235 | cobalamin metabolic process(GO:0009235) |
| 0.4 | 2.0 | GO:0036072 | intramembranous ossification(GO:0001957) direct ossification(GO:0036072) |
| 0.4 | 3.2 | GO:0070862 | negative regulation of protein exit from endoplasmic reticulum(GO:0070862) negative regulation of retrograde protein transport, ER to cytosol(GO:1904153) |
| 0.4 | 19.2 | GO:0018149 | peptide cross-linking(GO:0018149) |
| 0.4 | 1.6 | GO:0033153 | somatic diversification of T cell receptor genes(GO:0002568) somatic recombination of T cell receptor gene segments(GO:0002681) T cell receptor V(D)J recombination(GO:0033153) |
| 0.4 | 2.7 | GO:0048793 | pronephros development(GO:0048793) |
| 0.4 | 4.7 | GO:0009950 | dorsal/ventral axis specification(GO:0009950) |
| 0.4 | 1.9 | GO:0033132 | negative regulation of glucokinase activity(GO:0033132) negative regulation of hexokinase activity(GO:1903300) |
| 0.4 | 1.5 | GO:0070253 | somatostatin secretion(GO:0070253) |
| 0.4 | 1.5 | GO:0019074 | viral genome packaging(GO:0019072) viral RNA genome packaging(GO:0019074) |
| 0.4 | 9.2 | GO:0035428 | hexose transmembrane transport(GO:0035428) glucose transmembrane transport(GO:1904659) |
| 0.4 | 2.6 | GO:0032000 | positive regulation of fatty acid beta-oxidation(GO:0032000) |
| 0.4 | 5.8 | GO:0050930 | induction of positive chemotaxis(GO:0050930) |
| 0.4 | 4.3 | GO:0071688 | striated muscle myosin thick filament assembly(GO:0071688) |
| 0.4 | 7.2 | GO:0070932 | histone H3 deacetylation(GO:0070932) |
| 0.4 | 2.9 | GO:0060355 | positive regulation of cell adhesion molecule production(GO:0060355) |
| 0.3 | 3.5 | GO:0031053 | primary miRNA processing(GO:0031053) |
| 0.3 | 1.7 | GO:1901725 | regulation of histone deacetylase activity(GO:1901725) |
| 0.3 | 7.8 | GO:0045187 | regulation of circadian sleep/wake cycle, sleep(GO:0045187) |
| 0.3 | 14.6 | GO:0043171 | peptide catabolic process(GO:0043171) |
| 0.3 | 6.6 | GO:0032515 | negative regulation of phosphoprotein phosphatase activity(GO:0032515) |
| 0.3 | 3.6 | GO:0034638 | phosphatidylcholine catabolic process(GO:0034638) |
| 0.3 | 1.3 | GO:0071896 | protein localization to adherens junction(GO:0071896) |
| 0.3 | 1.0 | GO:0018002 | N-terminal peptidyl-serine acetylation(GO:0017198) N-terminal peptidyl-glutamic acid acetylation(GO:0018002) peptidyl-serine acetylation(GO:0030920) |
| 0.3 | 1.9 | GO:0018343 | protein farnesylation(GO:0018343) |
| 0.3 | 22.3 | GO:0006968 | cellular defense response(GO:0006968) |
| 0.3 | 1.2 | GO:0036414 | protein citrullination(GO:0018101) histone citrullination(GO:0036414) |
| 0.3 | 2.5 | GO:0071569 | protein ufmylation(GO:0071569) |
| 0.3 | 1.8 | GO:0046092 | deoxycytidine metabolic process(GO:0046092) |
| 0.3 | 2.1 | GO:0097267 | monoterpenoid metabolic process(GO:0016098) omega-hydroxylase P450 pathway(GO:0097267) |
| 0.3 | 5.4 | GO:0072520 | seminiferous tubule development(GO:0072520) |
| 0.3 | 2.9 | GO:0071318 | cellular response to ATP(GO:0071318) |
| 0.3 | 10.0 | GO:0001945 | lymph vessel development(GO:0001945) |
| 0.3 | 2.1 | GO:0036343 | psychomotor behavior(GO:0036343) motor behavior(GO:0061744) |
| 0.3 | 0.6 | GO:0010645 | regulation of cell communication by chemical coupling(GO:0010645) positive regulation of cell communication by chemical coupling(GO:0010652) |
| 0.3 | 8.5 | GO:0032211 | negative regulation of telomere maintenance via telomerase(GO:0032211) |
| 0.3 | 14.4 | GO:0070206 | protein trimerization(GO:0070206) |
| 0.3 | 0.8 | GO:1904692 | positive regulation of type B pancreatic cell proliferation(GO:1904692) |
| 0.3 | 5.9 | GO:0007597 | blood coagulation, intrinsic pathway(GO:0007597) |
| 0.3 | 6.4 | GO:0042403 | thyroid hormone metabolic process(GO:0042403) |
| 0.3 | 2.5 | GO:0032695 | negative regulation of interleukin-12 production(GO:0032695) |
| 0.3 | 3.8 | GO:0006692 | prostanoid metabolic process(GO:0006692) prostaglandin metabolic process(GO:0006693) |
| 0.3 | 1.1 | GO:0046015 | regulation of transcription by glucose(GO:0046015) |
| 0.3 | 2.3 | GO:0030807 | positive regulation of cyclic nucleotide catabolic process(GO:0030807) positive regulation of cAMP catabolic process(GO:0030822) |
| 0.3 | 4.6 | GO:0060394 | negative regulation of pathway-restricted SMAD protein phosphorylation(GO:0060394) |
| 0.3 | 3.8 | GO:0043586 | tongue development(GO:0043586) |
| 0.3 | 0.5 | GO:0042418 | epinephrine metabolic process(GO:0042414) epinephrine biosynthetic process(GO:0042418) |
| 0.2 | 0.7 | GO:0043461 | proton-transporting ATP synthase complex assembly(GO:0043461) proton-transporting ATP synthase complex biogenesis(GO:0070272) |
| 0.2 | 3.7 | GO:0035563 | positive regulation of chromatin binding(GO:0035563) |
| 0.2 | 0.7 | GO:0043465 | fermentation(GO:0006113) regulation of fermentation(GO:0043465) |
| 0.2 | 1.7 | GO:0023035 | CD40 signaling pathway(GO:0023035) |
| 0.2 | 4.1 | GO:0060044 | negative regulation of cardiac muscle cell proliferation(GO:0060044) |
| 0.2 | 6.5 | GO:0006379 | mRNA cleavage(GO:0006379) |
| 0.2 | 2.5 | GO:0008595 | tripartite regional subdivision(GO:0007351) anterior/posterior axis specification, embryo(GO:0008595) |
| 0.2 | 6.1 | GO:0035066 | positive regulation of histone acetylation(GO:0035066) |
| 0.2 | 1.6 | GO:1902218 | regulation of intrinsic apoptotic signaling pathway in response to osmotic stress(GO:1902218) negative regulation of intrinsic apoptotic signaling pathway in response to osmotic stress(GO:1902219) |
| 0.2 | 1.1 | GO:0031642 | negative regulation of myelination(GO:0031642) |
| 0.2 | 1.8 | GO:0002553 | histamine secretion(GO:0001821) histamine production involved in inflammatory response(GO:0002349) histamine secretion involved in inflammatory response(GO:0002441) histamine secretion by mast cell(GO:0002553) |
| 0.2 | 2.7 | GO:0034196 | acylglycerol transport(GO:0034196) triglyceride transport(GO:0034197) |
| 0.2 | 3.8 | GO:0034389 | lipid particle organization(GO:0034389) |
| 0.2 | 6.1 | GO:0016338 | calcium-independent cell-cell adhesion via plasma membrane cell-adhesion molecules(GO:0016338) |
| 0.2 | 1.1 | GO:0070127 | tRNA aminoacylation for mitochondrial protein translation(GO:0070127) |
| 0.2 | 5.8 | GO:0043968 | histone H2A acetylation(GO:0043968) |
| 0.2 | 5.0 | GO:0006895 | Golgi to endosome transport(GO:0006895) |
| 0.2 | 2.6 | GO:0030277 | maintenance of gastrointestinal epithelium(GO:0030277) |
| 0.2 | 2.1 | GO:1900119 | positive regulation of execution phase of apoptosis(GO:1900119) |
| 0.2 | 1.9 | GO:1904262 | negative regulation of TORC1 signaling(GO:1904262) |
| 0.2 | 1.2 | GO:0030321 | transepithelial chloride transport(GO:0030321) |
| 0.2 | 1.4 | GO:0060039 | pericardium development(GO:0060039) |
| 0.2 | 3.0 | GO:1900745 | positive regulation of p38MAPK cascade(GO:1900745) |
| 0.2 | 8.6 | GO:0044364 | killing of cells of other organism(GO:0031640) disruption of cells of other organism(GO:0044364) |
| 0.2 | 2.8 | GO:0042340 | keratan sulfate catabolic process(GO:0042340) |
| 0.2 | 6.4 | GO:0048025 | negative regulation of mRNA splicing, via spliceosome(GO:0048025) |
| 0.2 | 1.0 | GO:0003070 | age-dependent response to oxidative stress(GO:0001306) age-dependent response to reactive oxygen species(GO:0001315) regulation of systemic arterial blood pressure by acetylcholine(GO:0003068) vasodilation by acetylcholine involved in regulation of systemic arterial blood pressure(GO:0003069) regulation of systemic arterial blood pressure by neurotransmitter(GO:0003070) age-dependent general metabolic decline(GO:0007571) |
| 0.2 | 1.0 | GO:0030259 | lipid glycosylation(GO:0030259) |
| 0.2 | 2.3 | GO:0007320 | insemination(GO:0007320) |
| 0.2 | 3.0 | GO:0060561 | apoptotic process involved in morphogenesis(GO:0060561) |
| 0.2 | 0.9 | GO:0046618 | drug export(GO:0046618) |
| 0.2 | 2.0 | GO:0032836 | glomerular basement membrane development(GO:0032836) collagen-activated tyrosine kinase receptor signaling pathway(GO:0038063) |
| 0.2 | 13.0 | GO:0042475 | odontogenesis of dentin-containing tooth(GO:0042475) |
| 0.2 | 6.4 | GO:0007099 | centriole replication(GO:0007099) |
| 0.2 | 1.0 | GO:1902231 | positive regulation of intrinsic apoptotic signaling pathway in response to DNA damage(GO:1902231) |
| 0.2 | 10.5 | GO:0034113 | heterotypic cell-cell adhesion(GO:0034113) |
| 0.2 | 0.3 | GO:0071233 | cellular response to leucine(GO:0071233) |
| 0.2 | 1.0 | GO:0046952 | ketone body catabolic process(GO:0046952) |
| 0.2 | 1.2 | GO:0015712 | hexose phosphate transport(GO:0015712) glucose-6-phosphate transport(GO:0015760) |
| 0.2 | 1.0 | GO:0060573 | ventral spinal cord interneuron specification(GO:0021521) cell fate specification involved in pattern specification(GO:0060573) |
| 0.2 | 1.0 | GO:0045110 | intermediate filament bundle assembly(GO:0045110) |
| 0.2 | 0.8 | GO:0061469 | regulation of type B pancreatic cell proliferation(GO:0061469) |
| 0.2 | 4.2 | GO:0007202 | activation of phospholipase C activity(GO:0007202) |
| 0.2 | 1.7 | GO:0032793 | positive regulation of CREB transcription factor activity(GO:0032793) |
| 0.2 | 5.3 | GO:0043252 | sodium-independent organic anion transport(GO:0043252) |
| 0.2 | 3.0 | GO:0050855 | regulation of B cell receptor signaling pathway(GO:0050855) |
| 0.2 | 0.6 | GO:0050957 | equilibrioception(GO:0050957) |
| 0.2 | 1.7 | GO:0034219 | carbohydrate transmembrane transport(GO:0034219) |
| 0.2 | 1.7 | GO:0045008 | depyrimidination(GO:0045008) |
| 0.2 | 1.5 | GO:2000398 | regulation of T cell differentiation in thymus(GO:0033081) regulation of thymocyte aggregation(GO:2000398) |
| 0.2 | 7.7 | GO:0001938 | positive regulation of endothelial cell proliferation(GO:0001938) |
| 0.1 | 0.9 | GO:0051552 | flavone metabolic process(GO:0051552) |
| 0.1 | 3.9 | GO:0006309 | apoptotic DNA fragmentation(GO:0006309) |
| 0.1 | 0.9 | GO:0035095 | behavioral response to nicotine(GO:0035095) |
| 0.1 | 5.4 | GO:0035307 | positive regulation of dephosphorylation(GO:0035306) positive regulation of protein dephosphorylation(GO:0035307) |
| 0.1 | 1.9 | GO:0045577 | regulation of B cell differentiation(GO:0045577) |
| 0.1 | 0.8 | GO:1901731 | protein secretion by platelet(GO:0070560) positive regulation of platelet aggregation(GO:1901731) |
| 0.1 | 1.8 | GO:0098914 | membrane repolarization during atrial cardiac muscle cell action potential(GO:0098914) |
| 0.1 | 0.4 | GO:0015742 | alpha-ketoglutarate transport(GO:0015742) |
| 0.1 | 4.2 | GO:0003170 | heart valve development(GO:0003170) |
| 0.1 | 3.7 | GO:0032731 | positive regulation of interleukin-1 beta production(GO:0032731) |
| 0.1 | 3.6 | GO:0032007 | negative regulation of TOR signaling(GO:0032007) |
| 0.1 | 4.3 | GO:0043001 | Golgi to plasma membrane protein transport(GO:0043001) |
| 0.1 | 2.3 | GO:0015812 | gamma-aminobutyric acid transport(GO:0015812) |
| 0.1 | 0.8 | GO:0007000 | nucleolus organization(GO:0007000) |
| 0.1 | 2.2 | GO:0014883 | transition between fast and slow fiber(GO:0014883) |
| 0.1 | 1.7 | GO:0009312 | oligosaccharide biosynthetic process(GO:0009312) |
| 0.1 | 1.0 | GO:0042737 | drug catabolic process(GO:0042737) |
| 0.1 | 0.7 | GO:0008291 | acetylcholine metabolic process(GO:0008291) acetate ester metabolic process(GO:1900619) |
| 0.1 | 2.0 | GO:1904706 | negative regulation of vascular smooth muscle cell proliferation(GO:1904706) |
| 0.1 | 4.6 | GO:0007339 | binding of sperm to zona pellucida(GO:0007339) |
| 0.1 | 2.2 | GO:1902259 | regulation of delayed rectifier potassium channel activity(GO:1902259) |
| 0.1 | 0.6 | GO:0036337 | Fas signaling pathway(GO:0036337) regulation of Fas signaling pathway(GO:1902044) |
| 0.1 | 1.5 | GO:0042354 | fucose catabolic process(GO:0019317) L-fucose metabolic process(GO:0042354) L-fucose catabolic process(GO:0042355) |
| 0.1 | 4.2 | GO:0007257 | activation of JUN kinase activity(GO:0007257) |
| 0.1 | 4.7 | GO:0010107 | potassium ion import(GO:0010107) |
| 0.1 | 2.9 | GO:0001580 | detection of chemical stimulus involved in sensory perception of bitter taste(GO:0001580) |
| 0.1 | 2.8 | GO:0043507 | positive regulation of JUN kinase activity(GO:0043507) |
| 0.1 | 1.9 | GO:0034656 | nucleobase-containing small molecule catabolic process(GO:0034656) |
| 0.1 | 2.4 | GO:0042267 | natural killer cell mediated cytotoxicity(GO:0042267) |
| 0.1 | 0.5 | GO:0070459 | prolactin secretion(GO:0070459) |
| 0.1 | 5.0 | GO:0015701 | bicarbonate transport(GO:0015701) |
| 0.1 | 1.8 | GO:2000811 | negative regulation of anoikis(GO:2000811) |
| 0.1 | 2.2 | GO:0046069 | cGMP catabolic process(GO:0046069) |
| 0.1 | 1.0 | GO:0042104 | positive regulation of activated T cell proliferation(GO:0042104) |
| 0.1 | 0.6 | GO:0008218 | bioluminescence(GO:0008218) |
| 0.1 | 2.6 | GO:1901998 | toxin transport(GO:1901998) |
| 0.1 | 0.9 | GO:0031063 | regulation of histone deacetylation(GO:0031063) |
| 0.1 | 1.9 | GO:0006878 | cellular copper ion homeostasis(GO:0006878) |
| 0.1 | 1.9 | GO:0060644 | mammary gland epithelial cell differentiation(GO:0060644) |
| 0.1 | 0.2 | GO:0097091 | synaptic vesicle clustering(GO:0097091) |
| 0.1 | 4.7 | GO:0010507 | negative regulation of autophagy(GO:0010507) |
| 0.1 | 3.5 | GO:0007223 | Wnt signaling pathway, calcium modulating pathway(GO:0007223) |
| 0.1 | 0.5 | GO:0055059 | asymmetric neuroblast division(GO:0055059) |
| 0.1 | 2.2 | GO:2000001 | regulation of DNA damage checkpoint(GO:2000001) |
| 0.1 | 0.3 | GO:0042441 | eye pigment biosynthetic process(GO:0006726) eye pigment metabolic process(GO:0042441) pigment metabolic process involved in developmental pigmentation(GO:0043324) pigment metabolic process involved in pigmentation(GO:0043474) |
| 0.1 | 0.9 | GO:0006657 | CDP-choline pathway(GO:0006657) |
| 0.1 | 0.8 | GO:0008212 | mineralocorticoid biosynthetic process(GO:0006705) mineralocorticoid metabolic process(GO:0008212) |
| 0.1 | 1.0 | GO:0003376 | sphingosine-1-phosphate signaling pathway(GO:0003376) |
| 0.1 | 2.6 | GO:0045026 | plasma membrane fusion(GO:0045026) |
| 0.1 | 0.9 | GO:1902083 | negative regulation of peptidyl-cysteine S-nitrosylation(GO:1902083) |
| 0.1 | 1.6 | GO:0071711 | basement membrane organization(GO:0071711) |
| 0.1 | 10.2 | GO:0035335 | peptidyl-tyrosine dephosphorylation(GO:0035335) |
| 0.1 | 1.7 | GO:0003016 | respiratory system process(GO:0003016) |
| 0.1 | 0.7 | GO:0032688 | negative regulation of interferon-beta production(GO:0032688) |
| 0.1 | 0.4 | GO:0045725 | positive regulation of glycogen biosynthetic process(GO:0045725) |
| 0.1 | 2.5 | GO:0045453 | bone resorption(GO:0045453) |
| 0.1 | 0.8 | GO:0036500 | ATF6-mediated unfolded protein response(GO:0036500) |
| 0.1 | 0.6 | GO:0036342 | post-anal tail morphogenesis(GO:0036342) |
| 0.1 | 0.5 | GO:0071285 | cellular response to lithium ion(GO:0071285) |
| 0.1 | 8.3 | GO:0007030 | Golgi organization(GO:0007030) |
| 0.1 | 1.1 | GO:2000651 | positive regulation of sodium ion transmembrane transporter activity(GO:2000651) |
| 0.1 | 1.7 | GO:0000132 | establishment of mitotic spindle orientation(GO:0000132) |
| 0.1 | 3.9 | GO:0033275 | muscle filament sliding(GO:0030049) actin-myosin filament sliding(GO:0033275) |
| 0.1 | 3.5 | GO:0045576 | mast cell activation(GO:0045576) |
| 0.1 | 6.1 | GO:0018107 | peptidyl-threonine phosphorylation(GO:0018107) |
| 0.1 | 1.1 | GO:0050482 | arachidonic acid secretion(GO:0050482) arachidonate transport(GO:1903963) |
| 0.1 | 2.1 | GO:0070534 | protein K63-linked ubiquitination(GO:0070534) |
| 0.1 | 5.9 | GO:0006937 | regulation of muscle contraction(GO:0006937) |
| 0.1 | 14.6 | GO:0006869 | lipid transport(GO:0006869) |
| 0.1 | 0.8 | GO:0007258 | JUN phosphorylation(GO:0007258) |
| 0.1 | 4.3 | GO:0043647 | inositol phosphate metabolic process(GO:0043647) |
| 0.1 | 0.5 | GO:0016255 | attachment of GPI anchor to protein(GO:0016255) |
| 0.1 | 0.7 | GO:0021756 | subpallium development(GO:0021544) striatum development(GO:0021756) |
| 0.1 | 2.6 | GO:0042551 | neuron maturation(GO:0042551) |
| 0.1 | 0.7 | GO:0034498 | early endosome to Golgi transport(GO:0034498) |
| 0.1 | 0.9 | GO:0010569 | regulation of double-strand break repair via homologous recombination(GO:0010569) |
| 0.1 | 1.1 | GO:0048873 | homeostasis of number of cells within a tissue(GO:0048873) |
| 0.1 | 1.2 | GO:0048747 | muscle fiber development(GO:0048747) |
| 0.1 | 0.5 | GO:0030238 | male sex determination(GO:0030238) |
| 0.1 | 0.6 | GO:0007250 | activation of NF-kappaB-inducing kinase activity(GO:0007250) |
| 0.1 | 0.5 | GO:0003301 | physiological muscle hypertrophy(GO:0003298) physiological cardiac muscle hypertrophy(GO:0003301) cell growth involved in cardiac muscle cell development(GO:0061049) |
| 0.0 | 0.7 | GO:0036158 | outer dynein arm assembly(GO:0036158) |
| 0.0 | 0.6 | GO:0033540 | fatty acid beta-oxidation using acyl-CoA oxidase(GO:0033540) |
| 0.0 | 4.1 | GO:0060337 | type I interferon signaling pathway(GO:0060337) cellular response to type I interferon(GO:0071357) |
| 0.0 | 1.2 | GO:0035338 | long-chain fatty-acyl-CoA biosynthetic process(GO:0035338) |
| 0.0 | 1.6 | GO:0036075 | endochondral ossification(GO:0001958) replacement ossification(GO:0036075) |
| 0.0 | 0.2 | GO:1904936 | cerebral cortex GABAergic interneuron migration(GO:0021853) cerebral cortex GABAergic interneuron differentiation(GO:0021892) cerebral cortex GABAergic interneuron development(GO:0021894) GABAergic neuron differentiation(GO:0097154) interneuron migration(GO:1904936) |
| 0.0 | 2.1 | GO:2000181 | negative regulation of angiogenesis(GO:0016525) negative regulation of blood vessel morphogenesis(GO:2000181) |
| 0.0 | 3.1 | GO:0044259 | multicellular organismal macromolecule metabolic process(GO:0044259) |
| 0.0 | 2.4 | GO:0006687 | glycosphingolipid metabolic process(GO:0006687) |
| 0.0 | 0.1 | GO:0046104 | thymidine metabolic process(GO:0046104) pyrimidine deoxyribonucleoside metabolic process(GO:0046125) |
| 0.0 | 0.1 | GO:0035610 | protein side chain deglutamylation(GO:0035610) |
| 0.0 | 2.9 | GO:0035108 | appendage morphogenesis(GO:0035107) limb morphogenesis(GO:0035108) |
| 0.0 | 0.3 | GO:0015816 | glycine transport(GO:0015816) |
| 0.0 | 0.9 | GO:0044247 | glucan catabolic process(GO:0009251) cellular polysaccharide catabolic process(GO:0044247) |
| 0.0 | 0.5 | GO:0000188 | inactivation of MAPK activity(GO:0000188) |
| 0.0 | 0.7 | GO:0010862 | positive regulation of pathway-restricted SMAD protein phosphorylation(GO:0010862) |
| 0.0 | 0.5 | GO:2000114 | regulation of establishment of cell polarity(GO:2000114) |
| 0.0 | 1.6 | GO:0010923 | negative regulation of phosphatase activity(GO:0010923) |
| 0.0 | 2.7 | GO:1990823 | response to leukemia inhibitory factor(GO:1990823) cellular response to leukemia inhibitory factor(GO:1990830) |
| 0.0 | 0.2 | GO:0030050 | vesicle transport along actin filament(GO:0030050) |
| 0.0 | 0.7 | GO:0032728 | positive regulation of interferon-beta production(GO:0032728) |
| 0.0 | 0.7 | GO:0048268 | clathrin coat assembly(GO:0048268) |
| 0.0 | 2.5 | GO:0050807 | regulation of synapse organization(GO:0050807) |
| 0.0 | 2.3 | GO:1902476 | chloride transmembrane transport(GO:1902476) |
| 0.0 | 0.3 | GO:0016973 | poly(A)+ mRNA export from nucleus(GO:0016973) |
| 0.0 | 0.5 | GO:0007274 | neuromuscular synaptic transmission(GO:0007274) |
| 0.0 | 0.9 | GO:0046847 | filopodium assembly(GO:0046847) |
| 0.0 | 0.3 | GO:1900273 | positive regulation of long-term synaptic potentiation(GO:1900273) |
| 0.0 | 1.7 | GO:0050796 | regulation of insulin secretion(GO:0050796) |
| 0.0 | 0.5 | GO:0034080 | chromatin remodeling at centromere(GO:0031055) CENP-A containing nucleosome assembly(GO:0034080) CENP-A containing chromatin organization(GO:0061641) |
| 0.0 | 1.4 | GO:0007224 | smoothened signaling pathway(GO:0007224) |
| 0.0 | 0.2 | GO:0006418 | tRNA aminoacylation for protein translation(GO:0006418) |
Gene overrepresentation in cellular component category:
| Log-likelihood per target | Total log-likelihood | Term | Description |
|---|---|---|---|
| 19.5 | 58.5 | GO:0071752 | dimeric IgA immunoglobulin complex(GO:0071750) secretory dimeric IgA immunoglobulin complex(GO:0071752) |
| 8.5 | 34.1 | GO:0005602 | complement component C1 complex(GO:0005602) |
| 7.2 | 357.6 | GO:0042571 | immunoglobulin complex, circulating(GO:0042571) |
| 6.5 | 26.0 | GO:0031838 | haptoglobin-hemoglobin complex(GO:0031838) |
| 3.8 | 22.7 | GO:0034687 | integrin alphaL-beta2 complex(GO:0034687) |
| 2.8 | 31.1 | GO:0035692 | macrophage migration inhibitory factor receptor complex(GO:0035692) |
| 2.5 | 10.0 | GO:0030895 | apolipoprotein B mRNA editing enzyme complex(GO:0030895) |
| 2.4 | 7.2 | GO:0071065 | alpha9-beta1 integrin-vascular cell adhesion molecule-1 complex(GO:0071065) |
| 2.1 | 10.4 | GO:0005797 | Golgi medial cisterna(GO:0005797) |
| 2.0 | 7.8 | GO:1990879 | CST complex(GO:1990879) |
| 1.9 | 17.1 | GO:0097208 | alveolar lamellar body(GO:0097208) |
| 1.8 | 5.4 | GO:0034991 | nuclear meiotic cohesin complex(GO:0034991) |
| 1.8 | 306.7 | GO:0072562 | blood microparticle(GO:0072562) |
| 1.6 | 4.9 | GO:0031933 | telomeric heterochromatin(GO:0031933) |
| 1.5 | 26.1 | GO:0031089 | platelet dense granule lumen(GO:0031089) |
| 1.5 | 10.3 | GO:1990111 | spermatoproteasome complex(GO:1990111) |
| 1.3 | 6.6 | GO:0032807 | DNA-dependent protein kinase-DNA ligase 4 complex(GO:0005958) DNA ligase IV complex(GO:0032807) |
| 1.3 | 6.4 | GO:0042825 | TAP complex(GO:0042825) |
| 1.2 | 5.8 | GO:0005713 | recombination nodule(GO:0005713) |
| 1.0 | 4.1 | GO:0038038 | G-protein coupled receptor homodimeric complex(GO:0038038) |
| 1.0 | 6.0 | GO:0070545 | PeBoW complex(GO:0070545) |
| 1.0 | 9.6 | GO:0061574 | ASAP complex(GO:0061574) |
| 0.9 | 16.9 | GO:0042613 | MHC class II protein complex(GO:0042613) |
| 0.9 | 2.6 | GO:0070701 | mucus layer(GO:0070701) |
| 0.9 | 21.3 | GO:0042588 | zymogen granule(GO:0042588) |
| 0.8 | 4.2 | GO:1902937 | inward rectifier potassium channel complex(GO:1902937) |
| 0.8 | 14.5 | GO:0005890 | sodium:potassium-exchanging ATPase complex(GO:0005890) |
| 0.8 | 7.1 | GO:0071953 | elastic fiber(GO:0071953) |
| 0.8 | 5.4 | GO:0097165 | nuclear stress granule(GO:0097165) |
| 0.8 | 4.5 | GO:0033063 | DNA recombinase mediator complex(GO:0033061) Rad51B-Rad51C-Rad51D-XRCC2 complex(GO:0033063) |
| 0.8 | 2.3 | GO:0043159 | acrosomal matrix(GO:0043159) |
| 0.8 | 5.3 | GO:0036021 | endolysosome lumen(GO:0036021) |
| 0.7 | 2.2 | GO:0008623 | CHRAC(GO:0008623) |
| 0.7 | 3.7 | GO:0033648 | host intracellular organelle(GO:0033647) host intracellular membrane-bounded organelle(GO:0033648) |
| 0.7 | 5.8 | GO:0072487 | MSL complex(GO:0072487) |
| 0.7 | 2.2 | GO:0005745 | m-AAA complex(GO:0005745) |
| 0.7 | 2.7 | GO:0034669 | integrin alpha4-beta7 complex(GO:0034669) |
| 0.7 | 2.0 | GO:1990812 | growth cone filopodium(GO:1990812) |
| 0.7 | 2.0 | GO:0098536 | deuterosome(GO:0098536) |
| 0.6 | 3.9 | GO:0009331 | glycerol-3-phosphate dehydrogenase complex(GO:0009331) |
| 0.6 | 3.2 | GO:1990604 | IRE1-TRAF2-ASK1 complex(GO:1990604) |
| 0.6 | 10.9 | GO:0005641 | nuclear envelope lumen(GO:0005641) |
| 0.6 | 2.8 | GO:0072558 | NLRP1 inflammasome complex(GO:0072558) |
| 0.6 | 26.5 | GO:0001533 | cornified envelope(GO:0001533) |
| 0.6 | 4.5 | GO:0042788 | polysomal ribosome(GO:0042788) |
| 0.6 | 13.4 | GO:0097386 | glial cell projection(GO:0097386) |
| 0.6 | 9.5 | GO:0005721 | pericentric heterochromatin(GO:0005721) |
| 0.5 | 8.7 | GO:0030914 | STAGA complex(GO:0030914) |
| 0.5 | 3.3 | GO:0001939 | female pronucleus(GO:0001939) |
| 0.5 | 3.5 | GO:0036157 | outer dynein arm(GO:0036157) |
| 0.5 | 2.4 | GO:0031205 | endoplasmic reticulum Sec complex(GO:0031205) |
| 0.5 | 1.9 | GO:0005965 | protein farnesyltransferase complex(GO:0005965) |
| 0.4 | 2.2 | GO:0032299 | ribonuclease H2 complex(GO:0032299) |
| 0.4 | 6.5 | GO:0005847 | mRNA cleavage and polyadenylation specificity factor complex(GO:0005847) |
| 0.4 | 3.4 | GO:0045179 | apical cortex(GO:0045179) |
| 0.4 | 7.8 | GO:0036038 | MKS complex(GO:0036038) |
| 0.4 | 1.6 | GO:0005863 | striated muscle myosin thick filament(GO:0005863) |
| 0.4 | 27.1 | GO:0015030 | Cajal body(GO:0015030) |
| 0.4 | 6.1 | GO:0044615 | nuclear pore central transport channel(GO:0044613) nuclear pore nuclear basket(GO:0044615) |
| 0.4 | 2.1 | GO:0035867 | alphav-beta3 integrin-IGF-1-IGF1R complex(GO:0035867) |
| 0.3 | 15.4 | GO:0098636 | protein complex involved in cell adhesion(GO:0098636) |
| 0.3 | 40.7 | GO:0035579 | specific granule membrane(GO:0035579) |
| 0.3 | 17.5 | GO:0005782 | peroxisomal matrix(GO:0005782) microbody lumen(GO:0031907) |
| 0.3 | 1.6 | GO:0005579 | membrane attack complex(GO:0005579) |
| 0.3 | 9.6 | GO:0071011 | precatalytic spliceosome(GO:0071011) |
| 0.3 | 24.2 | GO:1904724 | tertiary granule lumen(GO:1904724) |
| 0.3 | 3.0 | GO:0097443 | sorting endosome(GO:0097443) |
| 0.3 | 2.7 | GO:0001673 | male germ cell nucleus(GO:0001673) |
| 0.3 | 10.2 | GO:0046658 | anchored component of plasma membrane(GO:0046658) |
| 0.3 | 16.9 | GO:0035577 | azurophil granule membrane(GO:0035577) |
| 0.3 | 1.7 | GO:0071797 | LUBAC complex(GO:0071797) |
| 0.3 | 17.1 | GO:0001772 | immunological synapse(GO:0001772) |
| 0.3 | 3.0 | GO:0033588 | Elongator holoenzyme complex(GO:0033588) |
| 0.3 | 2.0 | GO:0005587 | collagen type IV trimer(GO:0005587) |
| 0.3 | 1.3 | GO:0005883 | neurofilament(GO:0005883) |
| 0.2 | 2.2 | GO:0031233 | intrinsic component of external side of plasma membrane(GO:0031233) |
| 0.2 | 1.4 | GO:0005879 | axonemal microtubule(GO:0005879) |
| 0.2 | 1.9 | GO:0061700 | GATOR2 complex(GO:0061700) |
| 0.2 | 3.0 | GO:0005689 | U12-type spliceosomal complex(GO:0005689) |
| 0.2 | 1.1 | GO:0033553 | rDNA heterochromatin(GO:0033553) |
| 0.2 | 8.8 | GO:0000791 | euchromatin(GO:0000791) |
| 0.2 | 3.0 | GO:0097512 | cardiac myofibril(GO:0097512) |
| 0.2 | 15.9 | GO:0005902 | microvillus(GO:0005902) |
| 0.2 | 2.5 | GO:0043020 | NADPH oxidase complex(GO:0043020) |
| 0.2 | 1.3 | GO:0097025 | MPP7-DLG1-LIN7 complex(GO:0097025) |
| 0.2 | 2.4 | GO:0042555 | MCM complex(GO:0042555) |
| 0.2 | 2.8 | GO:0005720 | nuclear heterochromatin(GO:0005720) |
| 0.2 | 3.6 | GO:0032591 | dendritic spine membrane(GO:0032591) |
| 0.2 | 6.6 | GO:0005859 | muscle myosin complex(GO:0005859) |
| 0.2 | 2.8 | GO:0036019 | endolysosome(GO:0036019) |
| 0.2 | 4.7 | GO:0005892 | acetylcholine-gated channel complex(GO:0005892) |
| 0.2 | 1.0 | GO:0032584 | growth cone membrane(GO:0032584) |
| 0.2 | 8.3 | GO:1990391 | DNA repair complex(GO:1990391) |
| 0.2 | 4.8 | GO:0044665 | MLL1/2 complex(GO:0044665) MLL1 complex(GO:0071339) |
| 0.2 | 4.5 | GO:0030140 | trans-Golgi network transport vesicle(GO:0030140) |
| 0.2 | 2.6 | GO:0097225 | sperm midpiece(GO:0097225) |
| 0.2 | 220.2 | GO:0005615 | extracellular space(GO:0005615) |
| 0.1 | 2.7 | GO:0005922 | connexon complex(GO:0005922) |
| 0.1 | 1.0 | GO:0031415 | NatA complex(GO:0031415) |
| 0.1 | 3.8 | GO:0005680 | anaphase-promoting complex(GO:0005680) |
| 0.1 | 2.2 | GO:0005861 | troponin complex(GO:0005861) |
| 0.1 | 7.5 | GO:0008023 | transcription elongation factor complex(GO:0008023) |
| 0.1 | 1.3 | GO:0071203 | WASH complex(GO:0071203) |
| 0.1 | 2.0 | GO:0035631 | CD40 receptor complex(GO:0035631) |
| 0.1 | 2.8 | GO:0005942 | phosphatidylinositol 3-kinase complex(GO:0005942) |
| 0.1 | 6.4 | GO:0031526 | brush border membrane(GO:0031526) |
| 0.1 | 17.9 | GO:0005788 | endoplasmic reticulum lumen(GO:0005788) |
| 0.1 | 0.5 | GO:0042765 | GPI-anchor transamidase complex(GO:0042765) |
| 0.1 | 3.4 | GO:0005581 | collagen trimer(GO:0005581) |
| 0.1 | 4.7 | GO:0031201 | SNARE complex(GO:0031201) |
| 0.1 | 0.4 | GO:0005899 | insulin receptor complex(GO:0005899) |
| 0.1 | 5.6 | GO:0005801 | cis-Golgi network(GO:0005801) |
| 0.1 | 7.1 | GO:0005903 | brush border(GO:0005903) |
| 0.1 | 4.2 | GO:0016235 | aggresome(GO:0016235) |
| 0.1 | 14.9 | GO:0008076 | voltage-gated potassium channel complex(GO:0008076) potassium channel complex(GO:0034705) |
| 0.1 | 4.0 | GO:0016459 | myosin complex(GO:0016459) |
| 0.1 | 2.7 | GO:0097381 | photoreceptor disc membrane(GO:0097381) |
| 0.1 | 1.4 | GO:0000242 | pericentriolar material(GO:0000242) |
| 0.1 | 3.5 | GO:1902555 | endoribonuclease complex(GO:1902555) |
| 0.1 | 2.9 | GO:0045095 | keratin filament(GO:0045095) |
| 0.1 | 1.7 | GO:0031616 | spindle pole centrosome(GO:0031616) |
| 0.1 | 0.3 | GO:0042272 | nuclear RNA export factor complex(GO:0042272) |
| 0.1 | 5.9 | GO:0034707 | chloride channel complex(GO:0034707) |
| 0.1 | 3.2 | GO:0031672 | A band(GO:0031672) |
| 0.1 | 23.9 | GO:0005769 | early endosome(GO:0005769) |
| 0.1 | 0.9 | GO:0000812 | Swr1 complex(GO:0000812) |
| 0.1 | 4.1 | GO:0001750 | photoreceptor outer segment(GO:0001750) |
| 0.1 | 4.0 | GO:0005891 | voltage-gated calcium channel complex(GO:0005891) |
| 0.1 | 0.3 | GO:0034448 | EGO complex(GO:0034448) Gtr1-Gtr2 GTPase complex(GO:1990131) |
| 0.1 | 0.6 | GO:0030870 | Mre11 complex(GO:0030870) |
| 0.1 | 2.3 | GO:0005905 | clathrin-coated pit(GO:0005905) |
| 0.1 | 1.3 | GO:0045334 | clathrin-coated endocytic vesicle(GO:0045334) |
| 0.0 | 9.1 | GO:0001726 | ruffle(GO:0001726) |
| 0.0 | 0.8 | GO:0031094 | platelet dense tubular network(GO:0031094) platelet dense tubular network membrane(GO:0031095) |
| 0.0 | 0.3 | GO:0033162 | melanosome membrane(GO:0033162) chitosome(GO:0045009) |
| 0.0 | 7.6 | GO:0043235 | receptor complex(GO:0043235) |
| 0.0 | 1.3 | GO:0005604 | basement membrane(GO:0005604) |
| 0.0 | 0.9 | GO:0060170 | ciliary membrane(GO:0060170) |
| 0.0 | 0.3 | GO:0070652 | HAUS complex(GO:0070652) |
| 0.0 | 3.4 | GO:0001650 | fibrillar center(GO:0001650) |
| 0.0 | 2.7 | GO:0009897 | external side of plasma membrane(GO:0009897) |
| 0.0 | 1.6 | GO:0043204 | perikaryon(GO:0043204) |
| 0.0 | 0.4 | GO:0034704 | calcium channel complex(GO:0034704) |
Gene overrepresentation in molecular function category:
| Log-likelihood per target | Total log-likelihood | Term | Description |
|---|---|---|---|
| 6.9 | 416.1 | GO:0034987 | immunoglobulin receptor binding(GO:0034987) |
| 6.1 | 18.3 | GO:0008859 | exoribonuclease II activity(GO:0008859) |
| 4.5 | 27.1 | GO:0055131 | C3HC4-type RING finger domain binding(GO:0055131) |
| 4.4 | 31.1 | GO:0042289 | MHC class II protein binding(GO:0042289) |
| 4.2 | 16.9 | GO:0016211 | glutamate-ammonia ligase activity(GO:0004356) ammonia ligase activity(GO:0016211) acid-ammonia (or amide) ligase activity(GO:0016880) |
| 4.1 | 12.4 | GO:0098519 | nucleotide phosphatase activity, acting on free nucleotides(GO:0098519) |
| 3.8 | 19.2 | GO:0047374 | methylumbelliferyl-acetate deacetylase activity(GO:0047374) |
| 3.7 | 36.7 | GO:0032027 | myosin light chain binding(GO:0032027) |
| 3.2 | 22.7 | GO:0030369 | ICAM-3 receptor activity(GO:0030369) |
| 3.2 | 9.7 | GO:0051377 | mannose-ethanolamine phosphotransferase activity(GO:0051377) |
| 3.1 | 562.6 | GO:0003823 | antigen binding(GO:0003823) |
| 3.1 | 15.3 | GO:0003835 | beta-galactoside alpha-2,6-sialyltransferase activity(GO:0003835) |
| 2.7 | 13.6 | GO:0019763 | immunoglobulin receptor activity(GO:0019763) |
| 2.7 | 10.7 | GO:0004667 | prostaglandin-D synthase activity(GO:0004667) |
| 2.4 | 7.3 | GO:0008410 | CoA-transferase activity(GO:0008410) |
| 2.4 | 7.2 | GO:0061629 | RNA polymerase II sequence-specific DNA binding transcription factor binding(GO:0061629) |
| 2.4 | 19.1 | GO:0004024 | alcohol dehydrogenase activity, zinc-dependent(GO:0004024) |
| 2.4 | 9.5 | GO:0042132 | fructose 1,6-bisphosphate 1-phosphatase activity(GO:0042132) |
| 2.2 | 11.0 | GO:0004920 | interleukin-10 receptor activity(GO:0004920) |
| 2.2 | 6.5 | GO:0004051 | arachidonate 5-lipoxygenase activity(GO:0004051) |
| 2.2 | 6.5 | GO:0036134 | thromboxane-A synthase activity(GO:0004796) 12-hydroxyheptadecatrienoic acid synthase activity(GO:0036134) |
| 2.2 | 15.2 | GO:0004169 | dolichyl-phosphate-mannose-protein mannosyltransferase activity(GO:0004169) |
| 2.1 | 17.0 | GO:0005094 | Rho GDP-dissociation inhibitor activity(GO:0005094) |
| 2.1 | 6.2 | GO:0052871 | tocopherol omega-hydroxylase activity(GO:0052870) alpha-tocopherol omega-hydroxylase activity(GO:0052871) 20-hydroxy-leukotriene B4 omega oxidase activity(GO:0097258) 20-aldehyde-leukotriene B4 20-monooxygenase activity(GO:0097259) |
| 2.0 | 22.4 | GO:0035381 | extracellular ATP-gated cation channel activity(GO:0004931) ATP-gated ion channel activity(GO:0035381) |
| 2.0 | 23.7 | GO:0008430 | selenium binding(GO:0008430) |
| 2.0 | 9.8 | GO:0047086 | phenanthrene 9,10-monooxygenase activity(GO:0018636) ketosteroid monooxygenase activity(GO:0047086) trans-1,2-dihydrobenzene-1,2-diol dehydrogenase activity(GO:0047115) |
| 1.8 | 7.2 | GO:0017077 | oxidative phosphorylation uncoupler activity(GO:0017077) |
| 1.7 | 16.9 | GO:0003997 | acyl-CoA oxidase activity(GO:0003997) |
| 1.7 | 25.3 | GO:0005344 | oxygen transporter activity(GO:0005344) |
| 1.6 | 6.3 | GO:0052594 | tryptamine:oxygen oxidoreductase (deaminating) activity(GO:0052593) aminoacetone:oxygen oxidoreductase(deaminating) activity(GO:0052594) aliphatic-amine oxidase activity(GO:0052595) phenethylamine:oxygen oxidoreductase (deaminating) activity(GO:0052596) |
| 1.5 | 22.2 | GO:0032393 | MHC class I receptor activity(GO:0032393) |
| 1.4 | 5.8 | GO:0003827 | alpha-1,3-mannosylglycoprotein 2-beta-N-acetylglucosaminyltransferase activity(GO:0003827) |
| 1.4 | 5.7 | GO:0016314 | phosphatidylinositol-3,4,5-trisphosphate 3-phosphatase activity(GO:0016314) |
| 1.4 | 5.7 | GO:0070095 | fructose-6-phosphate binding(GO:0070095) |
| 1.3 | 4.0 | GO:0030272 | 5-formyltetrahydrofolate cyclo-ligase activity(GO:0030272) |
| 1.3 | 3.9 | GO:0047977 | hepoxilin-epoxide hydrolase activity(GO:0047977) |
| 1.3 | 3.8 | GO:0047783 | steroid 11-beta-monooxygenase activity(GO:0004507) corticosterone 18-monooxygenase activity(GO:0047783) |
| 1.2 | 17.8 | GO:0047372 | acylglycerol lipase activity(GO:0047372) |
| 1.2 | 3.5 | GO:0050051 | leukotriene-B4 20-monooxygenase activity(GO:0050051) |
| 1.2 | 3.5 | GO:0004613 | phosphoenolpyruvate carboxykinase activity(GO:0004611) phosphoenolpyruvate carboxykinase (GTP) activity(GO:0004613) |
| 1.2 | 4.6 | GO:0005124 | N-formyl peptide receptor activity(GO:0004982) scavenger receptor binding(GO:0005124) |
| 1.1 | 10.2 | GO:0043426 | MRF binding(GO:0043426) |
| 1.1 | 2.3 | GO:0004040 | amidase activity(GO:0004040) |
| 1.1 | 1.1 | GO:0015433 | peptide antigen-transporting ATPase activity(GO:0015433) |
| 1.1 | 5.5 | GO:0004694 | eukaryotic translation initiation factor 2alpha kinase activity(GO:0004694) |
| 1.1 | 3.2 | GO:0035241 | protein-arginine omega-N monomethyltransferase activity(GO:0035241) |
| 1.0 | 3.1 | GO:0005017 | platelet-derived growth factor-activated receptor activity(GO:0005017) |
| 1.0 | 9.4 | GO:0046974 | histone methyltransferase activity (H3-K9 specific)(GO:0046974) |
| 1.0 | 6.1 | GO:0008420 | CTD phosphatase activity(GO:0008420) |
| 1.0 | 3.0 | GO:0017153 | citrate transmembrane transporter activity(GO:0015137) tricarboxylic acid transmembrane transporter activity(GO:0015142) sodium:dicarboxylate symporter activity(GO:0017153) |
| 1.0 | 3.0 | GO:0004914 | interleukin-3 receptor activity(GO:0004912) interleukin-5 receptor activity(GO:0004914) |
| 1.0 | 8.9 | GO:0004767 | sphingomyelin phosphodiesterase activity(GO:0004767) |
| 1.0 | 2.9 | GO:0015616 | DNA translocase activity(GO:0015616) |
| 0.9 | 6.6 | GO:0015252 | hydrogen ion channel activity(GO:0015252) |
| 0.9 | 3.8 | GO:0022850 | serotonin-gated cation channel activity(GO:0022850) |
| 0.9 | 5.6 | GO:0031735 | CCR10 chemokine receptor binding(GO:0031735) |
| 0.9 | 2.7 | GO:0004336 | galactosylceramidase activity(GO:0004336) |
| 0.9 | 12.4 | GO:0055056 | D-glucose transmembrane transporter activity(GO:0055056) |
| 0.9 | 2.6 | GO:0031731 | CCR6 chemokine receptor binding(GO:0031731) |
| 0.9 | 6.0 | GO:0008440 | inositol-1,4,5-trisphosphate 3-kinase activity(GO:0008440) |
| 0.8 | 2.5 | GO:0004339 | glucan 1,4-alpha-glucosidase activity(GO:0004339) |
| 0.8 | 4.8 | GO:0004699 | calcium-independent protein kinase C activity(GO:0004699) |
| 0.8 | 4.0 | GO:0004447 | iodide peroxidase activity(GO:0004447) |
| 0.8 | 4.7 | GO:0004740 | pyruvate dehydrogenase (acetyl-transferring) kinase activity(GO:0004740) |
| 0.8 | 3.9 | GO:0016901 | glycerol-3-phosphate dehydrogenase activity(GO:0004368) oxidoreductase activity, acting on the CH-OH group of donors, quinone or similar compound as acceptor(GO:0016901) |
| 0.8 | 3.8 | GO:0004999 | vasoactive intestinal polypeptide receptor activity(GO:0004999) |
| 0.8 | 6.1 | GO:0003910 | DNA ligase (ATP) activity(GO:0003910) |
| 0.7 | 3.0 | GO:0004348 | glucosylceramidase activity(GO:0004348) |
| 0.7 | 2.2 | GO:0031727 | CCR2 chemokine receptor binding(GO:0031727) |
| 0.7 | 3.6 | GO:0097603 | temperature-gated ion channel activity(GO:0097603) |
| 0.7 | 2.9 | GO:0015111 | iodide transmembrane transporter activity(GO:0015111) |
| 0.7 | 2.0 | GO:0008384 | IkappaB kinase activity(GO:0008384) |
| 0.7 | 2.0 | GO:0005042 | netrin receptor activity(GO:0005042) |
| 0.6 | 1.9 | GO:0047631 | ADP-ribose diphosphatase activity(GO:0047631) |
| 0.6 | 4.5 | GO:0008271 | secondary active sulfate transmembrane transporter activity(GO:0008271) |
| 0.6 | 8.2 | GO:0004726 | non-membrane spanning protein tyrosine phosphatase activity(GO:0004726) |
| 0.6 | 4.4 | GO:0004499 | N,N-dimethylaniline monooxygenase activity(GO:0004499) |
| 0.6 | 5.0 | GO:0008046 | axon guidance receptor activity(GO:0008046) |
| 0.6 | 8.0 | GO:0000774 | adenyl-nucleotide exchange factor activity(GO:0000774) |
| 0.6 | 2.4 | GO:0060230 | lipoprotein lipase activator activity(GO:0060230) |
| 0.6 | 3.0 | GO:0016427 | tRNA (cytosine) methyltransferase activity(GO:0016427) |
| 0.6 | 3.5 | GO:0032296 | ribonuclease III activity(GO:0004525) double-stranded RNA-specific ribonuclease activity(GO:0032296) |
| 0.6 | 10.3 | GO:0032454 | histone demethylase activity (H3-K9 specific)(GO:0032454) |
| 0.6 | 1.7 | GO:0008534 | oxidized purine nucleobase lesion DNA N-glycosylase activity(GO:0008534) |
| 0.6 | 12.7 | GO:0017136 | NAD-dependent histone deacetylase activity(GO:0017136) |
| 0.5 | 2.2 | GO:0015204 | urea transmembrane transporter activity(GO:0015204) |
| 0.5 | 1.1 | GO:0004771 | sterol esterase activity(GO:0004771) |
| 0.5 | 2.1 | GO:0017057 | 6-phosphogluconolactonase activity(GO:0017057) |
| 0.5 | 12.7 | GO:0070006 | metalloaminopeptidase activity(GO:0070006) |
| 0.5 | 3.4 | GO:0001517 | N-acetylglucosamine 6-O-sulfotransferase activity(GO:0001517) |
| 0.5 | 3.4 | GO:0005324 | long-chain fatty acid transporter activity(GO:0005324) |
| 0.5 | 1.4 | GO:0031862 | prostanoid receptor binding(GO:0031862) |
| 0.5 | 1.9 | GO:0004660 | protein farnesyltransferase activity(GO:0004660) |
| 0.5 | 1.9 | GO:0001855 | complement component C4b binding(GO:0001855) |
| 0.5 | 8.8 | GO:0042609 | CD4 receptor binding(GO:0042609) |
| 0.5 | 2.8 | GO:0004563 | beta-N-acetylhexosaminidase activity(GO:0004563) |
| 0.5 | 4.1 | GO:0099583 | neurotransmitter receptor activity involved in regulation of postsynaptic cytosolic calcium ion concentration(GO:0099583) |
| 0.5 | 8.3 | GO:0004089 | carbonate dehydratase activity(GO:0004089) |
| 0.5 | 3.7 | GO:0046965 | retinoid X receptor binding(GO:0046965) |
| 0.5 | 6.3 | GO:0005078 | MAP-kinase scaffold activity(GO:0005078) |
| 0.4 | 2.1 | GO:0034875 | oxidoreductase activity, acting on CH or CH2 groups, quinone or similar compound as acceptor(GO:0033695) caffeine oxidase activity(GO:0034875) |
| 0.4 | 5.4 | GO:0019957 | C-C chemokine binding(GO:0019957) |
| 0.4 | 5.3 | GO:0030306 | ADP-ribosylation factor binding(GO:0030306) |
| 0.4 | 1.6 | GO:0016520 | growth hormone-releasing hormone receptor activity(GO:0016520) |
| 0.4 | 7.7 | GO:0016849 | phosphorus-oxygen lyase activity(GO:0016849) |
| 0.4 | 5.5 | GO:0031419 | cobalamin binding(GO:0031419) |
| 0.4 | 3.1 | GO:0003988 | acetyl-CoA C-acyltransferase activity(GO:0003988) |
| 0.4 | 18.8 | GO:0005164 | tumor necrosis factor receptor binding(GO:0005164) |
| 0.4 | 4.9 | GO:0070700 | BMP receptor binding(GO:0070700) |
| 0.4 | 6.0 | GO:0038036 | sphingosine-1-phosphate receptor activity(GO:0038036) |
| 0.4 | 4.5 | GO:0003996 | acyl-CoA ligase activity(GO:0003996) |
| 0.4 | 2.5 | GO:0019826 | oxygen sensor activity(GO:0019826) |
| 0.4 | 82.0 | GO:0004252 | serine-type endopeptidase activity(GO:0004252) |
| 0.3 | 9.8 | GO:0003950 | NAD+ ADP-ribosyltransferase activity(GO:0003950) |
| 0.3 | 1.0 | GO:0061752 | telomeric repeat-containing RNA binding(GO:0061752) |
| 0.3 | 4.5 | GO:0008097 | 5S rRNA binding(GO:0008097) |
| 0.3 | 1.0 | GO:1990190 | peptide-glutamate-N-acetyltransferase activity(GO:1990190) |
| 0.3 | 1.9 | GO:0070728 | leucine binding(GO:0070728) |
| 0.3 | 8.1 | GO:0005251 | delayed rectifier potassium channel activity(GO:0005251) |
| 0.3 | 1.2 | GO:0004668 | protein-arginine deiminase activity(GO:0004668) |
| 0.3 | 2.4 | GO:0046703 | natural killer cell lectin-like receptor binding(GO:0046703) |
| 0.3 | 4.2 | GO:0016846 | carbon-sulfur lyase activity(GO:0016846) |
| 0.3 | 4.7 | GO:0017151 | DEAD/H-box RNA helicase binding(GO:0017151) |
| 0.3 | 1.2 | GO:0015315 | hexose phosphate transmembrane transporter activity(GO:0015119) organophosphate:inorganic phosphate antiporter activity(GO:0015315) hexose-phosphate:inorganic phosphate antiporter activity(GO:0015526) glucose 6-phosphate:inorganic phosphate antiporter activity(GO:0061513) |
| 0.3 | 1.2 | GO:0017159 | pantetheine hydrolase activity(GO:0017159) |
| 0.3 | 1.4 | GO:0039706 | co-receptor binding(GO:0039706) |
| 0.3 | 5.8 | GO:0050786 | RAGE receptor binding(GO:0050786) |
| 0.3 | 7.1 | GO:0016702 | oxidoreductase activity, acting on single donors with incorporation of molecular oxygen, incorporation of two atoms of oxygen(GO:0016702) |
| 0.3 | 2.8 | GO:0035005 | 1-phosphatidylinositol-4-phosphate 3-kinase activity(GO:0035005) |
| 0.3 | 1.7 | GO:0017040 | ceramidase activity(GO:0017040) |
| 0.3 | 2.7 | GO:0051011 | microtubule minus-end binding(GO:0051011) |
| 0.3 | 1.6 | GO:0005143 | interleukin-12 receptor binding(GO:0005143) |
| 0.3 | 4.5 | GO:0000400 | four-way junction DNA binding(GO:0000400) |
| 0.3 | 2.1 | GO:0005534 | galactose binding(GO:0005534) |
| 0.3 | 22.1 | GO:0004869 | cysteine-type endopeptidase inhibitor activity(GO:0004869) |
| 0.3 | 1.8 | GO:0004137 | deoxycytidine kinase activity(GO:0004137) thymidine kinase activity(GO:0004797) |
| 0.3 | 4.6 | GO:0016018 | cyclosporin A binding(GO:0016018) |
| 0.3 | 1.5 | GO:0017060 | 3-galactosyl-N-acetylglucosaminide 4-alpha-L-fucosyltransferase activity(GO:0017060) |
| 0.2 | 0.7 | GO:0033265 | choline binding(GO:0033265) |
| 0.2 | 5.7 | GO:0016876 | aminoacyl-tRNA ligase activity(GO:0004812) ligase activity, forming carbon-oxygen bonds(GO:0016875) ligase activity, forming aminoacyl-tRNA and related compounds(GO:0016876) |
| 0.2 | 3.5 | GO:0045504 | dynein heavy chain binding(GO:0045504) |
| 0.2 | 1.9 | GO:0015185 | gamma-aminobutyric acid:sodium symporter activity(GO:0005332) gamma-aminobutyric acid transmembrane transporter activity(GO:0015185) |
| 0.2 | 1.4 | GO:0001849 | complement component C1q binding(GO:0001849) |
| 0.2 | 5.9 | GO:0004602 | glutathione peroxidase activity(GO:0004602) |
| 0.2 | 9.6 | GO:0033558 | histone deacetylase activity(GO:0004407) protein deacetylase activity(GO:0033558) |
| 0.2 | 0.9 | GO:0015307 | drug:proton antiporter activity(GO:0015307) |
| 0.2 | 22.4 | GO:0004867 | serine-type endopeptidase inhibitor activity(GO:0004867) |
| 0.2 | 3.0 | GO:0001730 | 2'-5'-oligoadenylate synthetase activity(GO:0001730) |
| 0.2 | 21.5 | GO:0008080 | N-acetyltransferase activity(GO:0008080) |
| 0.2 | 5.8 | GO:0030983 | mismatched DNA binding(GO:0030983) |
| 0.2 | 0.9 | GO:0031728 | CCR3 chemokine receptor binding(GO:0031728) |
| 0.2 | 5.7 | GO:0050750 | low-density lipoprotein particle receptor binding(GO:0050750) |
| 0.2 | 1.9 | GO:0043533 | inositol 1,3,4,5 tetrakisphosphate binding(GO:0043533) |
| 0.2 | 3.9 | GO:0016502 | purinergic nucleotide receptor activity(GO:0001614) nucleotide receptor activity(GO:0016502) |
| 0.2 | 21.9 | GO:0005518 | collagen binding(GO:0005518) |
| 0.2 | 6.1 | GO:0017056 | structural constituent of nuclear pore(GO:0017056) |
| 0.2 | 2.2 | GO:0004523 | RNA-DNA hybrid ribonuclease activity(GO:0004523) |
| 0.2 | 4.3 | GO:0097493 | structural molecule activity conferring elasticity(GO:0097493) |
| 0.2 | 0.6 | GO:0055077 | gap junction hemi-channel activity(GO:0055077) |
| 0.2 | 3.6 | GO:0015467 | G-protein activated inward rectifier potassium channel activity(GO:0015467) |
| 0.2 | 3.4 | GO:0002162 | dystroglycan binding(GO:0002162) |
| 0.2 | 2.5 | GO:0097371 | MDM2/MDM4 family protein binding(GO:0097371) |
| 0.2 | 0.9 | GO:0004105 | choline-phosphate cytidylyltransferase activity(GO:0004105) |
| 0.2 | 15.8 | GO:0004712 | protein serine/threonine/tyrosine kinase activity(GO:0004712) |
| 0.2 | 0.6 | GO:0004165 | dodecenoyl-CoA delta-isomerase activity(GO:0004165) |
| 0.2 | 2.4 | GO:0051787 | misfolded protein binding(GO:0051787) |
| 0.2 | 2.2 | GO:0004118 | cGMP-stimulated cyclic-nucleotide phosphodiesterase activity(GO:0004118) |
| 0.2 | 1.8 | GO:0016286 | small conductance calcium-activated potassium channel activity(GO:0016286) |
| 0.2 | 5.1 | GO:0031698 | beta-2 adrenergic receptor binding(GO:0031698) |
| 0.2 | 0.9 | GO:0001135 | transcription factor activity, RNA polymerase II transcription factor recruiting(GO:0001135) |
| 0.2 | 2.3 | GO:0045159 | myosin II binding(GO:0045159) |
| 0.2 | 2.1 | GO:0005243 | gap junction channel activity(GO:0005243) |
| 0.2 | 11.7 | GO:0070888 | E-box binding(GO:0070888) |
| 0.2 | 3.6 | GO:0030169 | low-density lipoprotein particle binding(GO:0030169) |
| 0.2 | 5.3 | GO:0015347 | sodium-independent organic anion transmembrane transporter activity(GO:0015347) |
| 0.2 | 2.0 | GO:0048156 | tau protein binding(GO:0048156) |
| 0.2 | 3.5 | GO:0047555 | 3',5'-cyclic-GMP phosphodiesterase activity(GO:0047555) |
| 0.2 | 17.5 | GO:0005254 | chloride channel activity(GO:0005254) |
| 0.2 | 2.0 | GO:0001871 | pattern binding(GO:0001871) polysaccharide binding(GO:0030247) |
| 0.2 | 1.1 | GO:0043812 | phosphatidylinositol-4-phosphate phosphatase activity(GO:0043812) |
| 0.2 | 5.8 | GO:0050699 | WW domain binding(GO:0050699) |
| 0.2 | 4.2 | GO:0050998 | nitric-oxide synthase binding(GO:0050998) |
| 0.2 | 3.8 | GO:0001965 | G-protein alpha-subunit binding(GO:0001965) |
| 0.2 | 3.7 | GO:0042813 | Wnt-activated receptor activity(GO:0042813) |
| 0.2 | 6.1 | GO:0008188 | neuropeptide receptor activity(GO:0008188) |
| 0.2 | 2.0 | GO:0016783 | sulfurtransferase activity(GO:0016783) |
| 0.2 | 0.9 | GO:0015057 | thrombin receptor activity(GO:0015057) |
| 0.1 | 1.6 | GO:0017034 | Rap guanyl-nucleotide exchange factor activity(GO:0017034) |
| 0.1 | 0.7 | GO:0047273 | galactosylgalactosylglucosylceramide beta-D-acetylgalactosaminyltransferase activity(GO:0047273) |
| 0.1 | 0.4 | GO:0015140 | malate transmembrane transporter activity(GO:0015140) |
| 0.1 | 4.7 | GO:0005086 | ARF guanyl-nucleotide exchange factor activity(GO:0005086) |
| 0.1 | 1.1 | GO:0008158 | hedgehog receptor activity(GO:0008158) |
| 0.1 | 0.5 | GO:0008508 | bile acid:sodium symporter activity(GO:0008508) |
| 0.1 | 8.0 | GO:0004180 | carboxypeptidase activity(GO:0004180) |
| 0.1 | 1.7 | GO:0008140 | cAMP response element binding protein binding(GO:0008140) |
| 0.1 | 17.8 | GO:0005178 | integrin binding(GO:0005178) |
| 0.1 | 3.0 | GO:0008093 | cytoskeletal adaptor activity(GO:0008093) |
| 0.1 | 1.9 | GO:0043425 | bHLH transcription factor binding(GO:0043425) |
| 0.1 | 1.8 | GO:0004000 | adenosine deaminase activity(GO:0004000) |
| 0.1 | 0.5 | GO:0003923 | GPI-anchor transamidase activity(GO:0003923) |
| 0.1 | 1.9 | GO:0031957 | very long-chain fatty acid-CoA ligase activity(GO:0031957) |
| 0.1 | 0.8 | GO:0005499 | vitamin D binding(GO:0005499) |
| 0.1 | 1.7 | GO:0031701 | angiotensin receptor binding(GO:0031701) type 1 angiotensin receptor binding(GO:0031702) |
| 0.1 | 2.6 | GO:0008656 | cysteine-type endopeptidase activator activity involved in apoptotic process(GO:0008656) |
| 0.1 | 1.2 | GO:0016413 | O-acetyltransferase activity(GO:0016413) |
| 0.1 | 11.6 | GO:0042626 | ATPase activity, coupled to transmembrane movement of substances(GO:0042626) |
| 0.1 | 1.0 | GO:0004784 | superoxide dismutase activity(GO:0004784) oxidoreductase activity, acting on superoxide radicals as acceptor(GO:0016721) |
| 0.1 | 0.9 | GO:0019869 | chloride channel inhibitor activity(GO:0019869) |
| 0.1 | 2.7 | GO:0008395 | steroid hydroxylase activity(GO:0008395) |
| 0.1 | 1.9 | GO:0008349 | MAP kinase kinase kinase kinase activity(GO:0008349) |
| 0.1 | 3.9 | GO:0004520 | endodeoxyribonuclease activity(GO:0004520) |
| 0.1 | 1.0 | GO:0031995 | insulin-like growth factor II binding(GO:0031995) |
| 0.1 | 2.4 | GO:0005504 | fatty acid binding(GO:0005504) |
| 0.1 | 2.5 | GO:0005212 | structural constituent of eye lens(GO:0005212) |
| 0.1 | 0.6 | GO:0001591 | dopamine neurotransmitter receptor activity, coupled via Gi/Go(GO:0001591) |
| 0.1 | 7.1 | GO:0098811 | transcriptional activator activity, RNA polymerase II transcription factor binding(GO:0001190) transcriptional repressor activity, RNA polymerase II activating transcription factor binding(GO:0098811) |
| 0.1 | 1.5 | GO:0019215 | intermediate filament binding(GO:0019215) |
| 0.1 | 8.0 | GO:0019838 | growth factor binding(GO:0019838) |
| 0.1 | 2.5 | GO:0001637 | G-protein coupled chemoattractant receptor activity(GO:0001637) chemokine receptor activity(GO:0004950) |
| 0.1 | 28.8 | GO:0001077 | transcriptional activator activity, RNA polymerase II core promoter proximal region sequence-specific binding(GO:0001077) |
| 0.1 | 1.2 | GO:0015645 | long-chain fatty acid-CoA ligase activity(GO:0004467) fatty acid ligase activity(GO:0015645) |
| 0.1 | 1.8 | GO:0000978 | RNA polymerase II core promoter proximal region sequence-specific DNA binding(GO:0000978) |
| 0.1 | 1.9 | GO:0015248 | sterol transporter activity(GO:0015248) |
| 0.1 | 18.8 | GO:0001227 | transcriptional repressor activity, RNA polymerase II transcription regulatory region sequence-specific binding(GO:0001227) |
| 0.1 | 3.2 | GO:0061631 | ubiquitin conjugating enzyme activity(GO:0061631) |
| 0.1 | 5.5 | GO:0004714 | transmembrane receptor protein tyrosine kinase activity(GO:0004714) |
| 0.1 | 3.1 | GO:0043022 | ribosome binding(GO:0043022) |
| 0.1 | 0.8 | GO:0004065 | arylsulfatase activity(GO:0004065) |
| 0.1 | 52.9 | GO:0003700 | nucleic acid binding transcription factor activity(GO:0001071) transcription factor activity, sequence-specific DNA binding(GO:0003700) |
| 0.1 | 0.5 | GO:0015643 | toxic substance binding(GO:0015643) |
| 0.1 | 0.4 | GO:0070679 | inositol 1,4,5 trisphosphate binding(GO:0070679) |
| 0.1 | 1.8 | GO:0050840 | extracellular matrix binding(GO:0050840) |
| 0.1 | 0.5 | GO:0072542 | protein phosphatase activator activity(GO:0072542) |
| 0.0 | 2.7 | GO:0001085 | RNA polymerase II transcription factor binding(GO:0001085) |
| 0.0 | 0.5 | GO:0005242 | inward rectifier potassium channel activity(GO:0005242) |
| 0.0 | 0.1 | GO:0050510 | N-acetylgalactosaminyl-proteoglycan 3-beta-glucuronosyltransferase activity(GO:0050510) |
| 0.0 | 3.3 | GO:0005249 | voltage-gated potassium channel activity(GO:0005249) |
| 0.0 | 0.8 | GO:1990841 | promoter-specific chromatin binding(GO:1990841) |
| 0.0 | 5.1 | GO:0017048 | Rho GTPase binding(GO:0017048) |
| 0.0 | 2.3 | GO:0030507 | spectrin binding(GO:0030507) |
| 0.0 | 3.1 | GO:0001618 | virus receptor activity(GO:0001618) |
| 0.0 | 0.9 | GO:0042166 | acetylcholine-gated cation channel activity(GO:0022848) acetylcholine binding(GO:0042166) |
| 0.0 | 0.1 | GO:0004146 | dihydrofolate reductase activity(GO:0004146) |
| 0.0 | 1.6 | GO:0016836 | hydro-lyase activity(GO:0016836) |
| 0.0 | 1.1 | GO:0004623 | phospholipase A2 activity(GO:0004623) |
| 0.0 | 3.1 | GO:0019905 | syntaxin binding(GO:0019905) |
| 0.0 | 0.2 | GO:0030020 | extracellular matrix structural constituent conferring tensile strength(GO:0030020) |
| 0.0 | 0.9 | GO:0030374 | ligand-dependent nuclear receptor transcription coactivator activity(GO:0030374) |
| 0.0 | 0.3 | GO:0004697 | protein kinase C activity(GO:0004697) |
| 0.0 | 0.9 | GO:0042826 | histone deacetylase binding(GO:0042826) |
| 0.0 | 2.4 | GO:0005089 | Rho guanyl-nucleotide exchange factor activity(GO:0005089) |
| 0.0 | 0.3 | GO:0004062 | aryl sulfotransferase activity(GO:0004062) |
| 0.0 | 0.7 | GO:1901476 | carbohydrate transmembrane transporter activity(GO:0015144) carbohydrate transporter activity(GO:1901476) |
| 0.0 | 0.7 | GO:0030276 | clathrin binding(GO:0030276) |
| 0.0 | 1.3 | GO:0008013 | beta-catenin binding(GO:0008013) |
| 0.0 | 0.1 | GO:0070492 | oligosaccharide binding(GO:0070492) |
| 0.0 | 0.7 | GO:0005548 | phospholipid transporter activity(GO:0005548) |
| 0.0 | 0.3 | GO:0070300 | phosphatidic acid binding(GO:0070300) |
| 0.0 | 1.7 | GO:0004725 | protein tyrosine phosphatase activity(GO:0004725) |
| 0.0 | 0.3 | GO:0005328 | neurotransmitter:sodium symporter activity(GO:0005328) |
| 0.0 | 0.2 | GO:0005484 | SNAP receptor activity(GO:0005484) |
| 0.0 | 0.4 | GO:0042169 | SH2 domain binding(GO:0042169) |
| 0.0 | 0.3 | GO:0070001 | aspartic-type endopeptidase activity(GO:0004190) aspartic-type peptidase activity(GO:0070001) |
Gene overrepresentation in curated gene sets: canonical pathways category:
| Log-likelihood per target | Total log-likelihood | Term | Description |
|---|---|---|---|
| 1.0 | 51.3 | PID INTEGRIN2 PATHWAY | Beta2 integrin cell surface interactions |
| 0.7 | 35.3 | PID S1P S1P3 PATHWAY | S1P3 pathway |
| 0.6 | 12.8 | SA PROGRAMMED CELL DEATH | Programmed cell death, or apoptosis, eliminates damaged or unneeded cells. |
| 0.3 | 6.5 | PID CIRCADIAN PATHWAY | Circadian rhythm pathway |
| 0.3 | 3.7 | PID TCR RAS PATHWAY | Ras signaling in the CD4+ TCR pathway |
| 0.3 | 3.0 | PID IL5 PATHWAY | IL5-mediated signaling events |
| 0.3 | 87.3 | NABA ECM REGULATORS | Genes encoding enzymes and their regulators involved in the remodeling of the extracellular matrix |
| 0.3 | 5.5 | PID P38 MKK3 6PATHWAY | p38 MAPK signaling pathway |
| 0.3 | 14.5 | NABA PROTEOGLYCANS | Genes encoding proteoglycans |
| 0.3 | 1.4 | ST TYPE I INTERFERON PATHWAY | Type I Interferon (alpha/beta IFN) Pathway |
| 0.3 | 5.7 | PID HDAC CLASSIII PATHWAY | Signaling events mediated by HDAC Class III |
| 0.3 | 4.7 | PID AR NONGENOMIC PATHWAY | Nongenotropic Androgen signaling |
| 0.3 | 3.0 | ST INTERFERON GAMMA PATHWAY | Interferon gamma pathway. |
| 0.2 | 16.8 | PID HEDGEHOG GLI PATHWAY | Hedgehog signaling events mediated by Gli proteins |
| 0.2 | 5.4 | PID EPHRINB REV PATHWAY | Ephrin B reverse signaling |
| 0.2 | 2.3 | ST G ALPHA S PATHWAY | G alpha s Pathway |
| 0.2 | 2.0 | PID S1P S1P1 PATHWAY | S1P1 pathway |
| 0.2 | 21.1 | PID IL4 2PATHWAY | IL4-mediated signaling events |
| 0.2 | 37.6 | NABA ECM AFFILIATED | Genes encoding proteins affiliated structurally or functionally to extracellular matrix proteins |
| 0.2 | 5.1 | PID DNA PK PATHWAY | DNA-PK pathway in nonhomologous end joining |
| 0.2 | 17.3 | PID RHOA REG PATHWAY | Regulation of RhoA activity |
| 0.2 | 5.1 | PID PDGFRA PATHWAY | PDGFR-alpha signaling pathway |
| 0.2 | 4.6 | PID UPA UPAR PATHWAY | Urokinase-type plasminogen activator (uPA) and uPAR-mediated signaling |
| 0.2 | 3.3 | PID IL12 STAT4 PATHWAY | IL12 signaling mediated by STAT4 |
| 0.2 | 25.3 | PID SMAD2 3NUCLEAR PATHWAY | Regulation of nuclear SMAD2/3 signaling |
| 0.2 | 2.7 | PID LYMPH ANGIOGENESIS PATHWAY | VEGFR3 signaling in lymphatic endothelium |
| 0.2 | 7.2 | PID HDAC CLASSII PATHWAY | Signaling events mediated by HDAC Class II |
| 0.2 | 1.9 | SIG IL4RECEPTOR IN B LYPHOCYTES | Genes related to IL4 rceptor signaling in B lymphocytes |
| 0.2 | 7.9 | PID FCER1 PATHWAY | Fc-epsilon receptor I signaling in mast cells |
| 0.2 | 1.7 | SA REG CASCADE OF CYCLIN EXPR | Expression of cyclins regulates progression through the cell cycle by activating cyclin-dependent kinases. |
| 0.2 | 13.5 | PID CMYB PATHWAY | C-MYB transcription factor network |
| 0.1 | 6.4 | PID GLYPICAN 1PATHWAY | Glypican 1 network |
| 0.1 | 2.1 | PID CD8 TCR DOWNSTREAM PATHWAY | Downstream signaling in naïve CD8+ T cells |
| 0.1 | 2.0 | PID NFKAPPAB ATYPICAL PATHWAY | Atypical NF-kappaB pathway |
| 0.1 | 4.2 | PID MTOR 4PATHWAY | mTOR signaling pathway |
| 0.1 | 4.6 | ST ADRENERGIC | Adrenergic Pathway |
| 0.1 | 1.7 | ST PAC1 RECEPTOR PATHWAY | PAC1 Receptor Pathway |
| 0.1 | 2.4 | PID HIF1A PATHWAY | Hypoxic and oxygen homeostasis regulation of HIF-1-alpha |
| 0.1 | 7.0 | PID IL12 2PATHWAY | IL12-mediated signaling events |
| 0.1 | 3.5 | ST WNT CA2 CYCLIC GMP PATHWAY | Wnt/Ca2+/cyclic GMP signaling. |
| 0.1 | 2.6 | PID ANTHRAX PATHWAY | Cellular roles of Anthrax toxin |
| 0.1 | 1.9 | PID IL2 1PATHWAY | IL2-mediated signaling events |
| 0.1 | 2.9 | PID ERB GENOMIC PATHWAY | Validated nuclear estrogen receptor beta network |
| 0.1 | 4.8 | PID ENDOTHELIN PATHWAY | Endothelins |
| 0.1 | 3.8 | PID IL1 PATHWAY | IL1-mediated signaling events |
| 0.1 | 7.1 | PID CERAMIDE PATHWAY | Ceramide signaling pathway |
| 0.1 | 3.7 | PID INTEGRIN3 PATHWAY | Beta3 integrin cell surface interactions |
| 0.1 | 2.8 | ST DIFFERENTIATION PATHWAY IN PC12 CELLS | Differentiation Pathway in PC12 Cells; this is a specific case of PAC1 Receptor Pathway. |
| 0.1 | 3.0 | PID MAPK TRK PATHWAY | Trk receptor signaling mediated by the MAPK pathway |
| 0.1 | 10.2 | WNT SIGNALING | Genes related to Wnt-mediated signal transduction |
| 0.1 | 2.0 | PID NETRIN PATHWAY | Netrin-mediated signaling events |
| 0.1 | 6.2 | PID MYC REPRESS PATHWAY | Validated targets of C-MYC transcriptional repression |
| 0.1 | 1.0 | PID FOXO PATHWAY | FoxO family signaling |
| 0.1 | 19.7 | NABA SECRETED FACTORS | Genes encoding secreted soluble factors |
| 0.1 | 1.8 | PID REG GR PATHWAY | Glucocorticoid receptor regulatory network |
| 0.1 | 1.7 | PID P38 ALPHA BETA DOWNSTREAM PATHWAY | Signaling mediated by p38-alpha and p38-beta |
| 0.1 | 0.4 | ST PHOSPHOINOSITIDE 3 KINASE PATHWAY | PI3K Pathway |
| 0.1 | 9.9 | NABA ECM GLYCOPROTEINS | Genes encoding structural ECM glycoproteins |
| 0.0 | 1.8 | PID AP1 PATHWAY | AP-1 transcription factor network |
| 0.0 | 1.6 | PID AURORA A PATHWAY | Aurora A signaling |
| 0.0 | 1.6 | PID DELTA NP63 PATHWAY | Validated transcriptional targets of deltaNp63 isoforms |
| 0.0 | 1.6 | NABA COLLAGENS | Genes encoding collagen proteins |
| 0.0 | 0.4 | SIG INSULIN RECEPTOR PATHWAY IN CARDIAC MYOCYTES | Genes related to the insulin receptor pathway |
| 0.0 | 0.5 | ST WNT BETA CATENIN PATHWAY | Wnt/beta-catenin Pathway |
| 0.0 | 2.2 | PID MYC ACTIV PATHWAY | Validated targets of C-MYC transcriptional activation |
| 0.0 | 0.5 | PID TELOMERASE PATHWAY | Regulation of Telomerase |
Gene overrepresentation in curated gene sets: REACTOME pathways category:
| Log-likelihood per target | Total log-likelihood | Term | Description |
|---|---|---|---|
| 6.3 | 38.1 | REACTOME BINDING AND ENTRY OF HIV VIRION | Genes involved in Binding and entry of HIV virion |
| 2.8 | 30.8 | REACTOME CREATION OF C4 AND C2 ACTIVATORS | Genes involved in Creation of C4 and C2 activators |
| 2.0 | 10.0 | REACTOME MRNA PROCESSING | Genes involved in mRNA Processing |
| 1.9 | 19.1 | REACTOME ETHANOL OXIDATION | Genes involved in Ethanol oxidation |
| 1.1 | 13.0 | REACTOME DIGESTION OF DIETARY CARBOHYDRATE | Genes involved in Digestion of dietary carbohydrate |
| 1.1 | 26.0 | REACTOME INTRINSIC PATHWAY | Genes involved in Intrinsic Pathway |
| 1.0 | 6.1 | REACTOME ABORTIVE ELONGATION OF HIV1 TRANSCRIPT IN THE ABSENCE OF TAT | Genes involved in Abortive elongation of HIV-1 transcript in the absence of Tat |
| 0.9 | 21.6 | REACTOME ABCA TRANSPORTERS IN LIPID HOMEOSTASIS | Genes involved in ABCA transporters in lipid homeostasis |
| 0.9 | 12.3 | REACTOME TRAFFICKING AND PROCESSING OF ENDOSOMAL TLR | Genes involved in Trafficking and processing of endosomal TLR |
| 0.8 | 16.9 | REACTOME TRANSLOCATION OF ZAP 70 TO IMMUNOLOGICAL SYNAPSE | Genes involved in Translocation of ZAP-70 to Immunological synapse |
| 0.8 | 11.4 | REACTOME NEF MEDIATED DOWNREGULATION OF MHC CLASS I COMPLEX CELL SURFACE EXPRESSION | Genes involved in Nef mediated downregulation of MHC class I complex cell surface expression |
| 0.6 | 1.9 | REACTOME REGULATION OF GLUCOKINASE BY GLUCOKINASE REGULATORY PROTEIN | Genes involved in Regulation of Glucokinase by Glucokinase Regulatory Protein |
| 0.6 | 14.8 | REACTOME TERMINATION OF O GLYCAN BIOSYNTHESIS | Genes involved in Termination of O-glycan biosynthesis |
| 0.6 | 10.3 | REACTOME ALPHA LINOLENIC ACID ALA METABOLISM | Genes involved in alpha-linolenic acid (ALA) metabolism |
| 0.6 | 2.4 | REACTOME ER PHAGOSOME PATHWAY | Genes involved in ER-Phagosome pathway |
| 0.5 | 8.3 | REACTOME REVERSIBLE HYDRATION OF CARBON DIOXIDE | Genes involved in Reversible Hydration of Carbon Dioxide |
| 0.5 | 3.6 | REACTOME TRYPTOPHAN CATABOLISM | Genes involved in Tryptophan catabolism |
| 0.5 | 43.9 | REACTOME IMMUNOREGULATORY INTERACTIONS BETWEEN A LYMPHOID AND A NON LYMPHOID CELL | Genes involved in Immunoregulatory interactions between a Lymphoid and a non-Lymphoid cell |
| 0.5 | 20.6 | REACTOME EFFECTS OF PIP2 HYDROLYSIS | Genes involved in Effects of PIP2 hydrolysis |
| 0.5 | 7.4 | REACTOME MITOCHONDRIAL TRNA AMINOACYLATION | Genes involved in Mitochondrial tRNA aminoacylation |
| 0.4 | 26.4 | REACTOME CYTOCHROME P450 ARRANGED BY SUBSTRATE TYPE | Genes involved in Cytochrome P450 - arranged by substrate type |
| 0.4 | 6.5 | REACTOME SYNTHESIS OF SUBSTRATES IN N GLYCAN BIOSYTHESIS | Genes involved in Synthesis of substrates in N-glycan biosythesis |
| 0.4 | 6.6 | REACTOME INTEGRATION OF PROVIRUS | Genes involved in Integration of provirus |
| 0.4 | 3.5 | REACTOME MICRORNA MIRNA BIOGENESIS | Genes involved in MicroRNA (miRNA) Biogenesis |
| 0.4 | 10.6 | REACTOME AMINO ACID SYNTHESIS AND INTERCONVERSION TRANSAMINATION | Genes involved in Amino acid synthesis and interconversion (transamination) |
| 0.4 | 8.3 | REACTOME SYNTHESIS OF GLYCOSYLPHOSPHATIDYLINOSITOL GPI | Genes involved in Synthesis of glycosylphosphatidylinositol (GPI) |
| 0.3 | 6.6 | REACTOME PEROXISOMAL LIPID METABOLISM | Genes involved in Peroxisomal lipid metabolism |
| 0.3 | 15.9 | REACTOME BMAL1 CLOCK NPAS2 ACTIVATES CIRCADIAN EXPRESSION | Genes involved in BMAL1:CLOCK/NPAS2 Activates Circadian Expression |
| 0.3 | 2.4 | REACTOME ROLE OF SECOND MESSENGERS IN NETRIN1 SIGNALING | Genes involved in Role of second messengers in netrin-1 signaling |
| 0.3 | 6.3 | REACTOME CHYLOMICRON MEDIATED LIPID TRANSPORT | Genes involved in Chylomicron-mediated lipid transport |
| 0.3 | 4.7 | REACTOME REGULATION OF PYRUVATE DEHYDROGENASE PDH COMPLEX | Genes involved in Regulation of pyruvate dehydrogenase (PDH) complex |
| 0.3 | 2.6 | REACTOME BETA DEFENSINS | Genes involved in Beta defensins |
| 0.3 | 16.7 | REACTOME GLUCONEOGENESIS | Genes involved in Gluconeogenesis |
| 0.3 | 7.8 | REACTOME RIP MEDIATED NFKB ACTIVATION VIA DAI | Genes involved in RIP-mediated NFkB activation via DAI |
| 0.2 | 2.2 | REACTOME ANTIGEN PRESENTATION FOLDING ASSEMBLY AND PEPTIDE LOADING OF CLASS I MHC | Genes involved in Antigen Presentation: Folding, assembly and peptide loading of class I MHC |
| 0.2 | 4.7 | REACTOME PRESYNAPTIC NICOTINIC ACETYLCHOLINE RECEPTORS | Genes involved in Presynaptic nicotinic acetylcholine receptors |
| 0.2 | 4.5 | REACTOME AMINE DERIVED HORMONES | Genes involved in Amine-derived hormones |
| 0.2 | 3.4 | REACTOME PHASE1 FUNCTIONALIZATION OF COMPOUNDS | Genes involved in Phase 1 - Functionalization of compounds |
| 0.2 | 10.9 | REACTOME GLYCOSPHINGOLIPID METABOLISM | Genes involved in Glycosphingolipid metabolism |
| 0.2 | 4.1 | REACTOME CLASS C 3 METABOTROPIC GLUTAMATE PHEROMONE RECEPTORS | Genes involved in Class C/3 (Metabotropic glutamate/pheromone receptors) |
| 0.2 | 3.9 | REACTOME P2Y RECEPTORS | Genes involved in P2Y receptors |
| 0.2 | 11.4 | REACTOME VOLTAGE GATED POTASSIUM CHANNELS | Genes involved in Voltage gated Potassium channels |
| 0.2 | 3.6 | REACTOME GABA RECEPTOR ACTIVATION | Genes involved in GABA receptor activation |
| 0.2 | 3.1 | REACTOME COMMON PATHWAY | Genes involved in Common Pathway |
| 0.2 | 9.8 | REACTOME SMAD2 SMAD3 SMAD4 HETEROTRIMER REGULATES TRANSCRIPTION | Genes involved in SMAD2/SMAD3:SMAD4 heterotrimer regulates transcription |
| 0.2 | 3.9 | REACTOME SYNTHESIS OF PIPS AT THE GOLGI MEMBRANE | Genes involved in Synthesis of PIPs at the Golgi membrane |
| 0.2 | 1.3 | REACTOME SYNTHESIS OF BILE ACIDS AND BILE SALTS | Genes involved in Synthesis of bile acids and bile salts |
| 0.2 | 20.4 | REACTOME RESPONSE TO ELEVATED PLATELET CYTOSOLIC CA2 | Genes involved in Response to elevated platelet cytosolic Ca2+ |
| 0.2 | 4.9 | REACTOME SYNTHESIS OF PA | Genes involved in Synthesis of PA |
| 0.2 | 6.8 | REACTOME DARPP 32 EVENTS | Genes involved in DARPP-32 events |
| 0.2 | 6.1 | REACTOME TIGHT JUNCTION INTERACTIONS | Genes involved in Tight junction interactions |
| 0.1 | 2.7 | REACTOME GAP JUNCTION ASSEMBLY | Genes involved in Gap junction assembly |
| 0.1 | 8.8 | REACTOME STRIATED MUSCLE CONTRACTION | Genes involved in Striated Muscle Contraction |
| 0.1 | 3.3 | REACTOME CD28 DEPENDENT VAV1 PATHWAY | Genes involved in CD28 dependent Vav1 pathway |
| 0.1 | 13.8 | REACTOME INTERFERON ALPHA BETA SIGNALING | Genes involved in Interferon alpha/beta signaling |
| 0.1 | 5.2 | REACTOME AMINE COMPOUND SLC TRANSPORTERS | Genes involved in Amine compound SLC transporters |
| 0.1 | 0.8 | REACTOME ACTIVATION OF CHAPERONES BY ATF6 ALPHA | Genes involved in Activation of Chaperones by ATF6-alpha |
| 0.1 | 2.1 | REACTOME BILE SALT AND ORGANIC ANION SLC TRANSPORTERS | Genes involved in Bile salt and organic anion SLC transporters |
| 0.1 | 10.8 | REACTOME INTEGRIN CELL SURFACE INTERACTIONS | Genes involved in Integrin cell surface interactions |
| 0.1 | 6.8 | REACTOME NUCLEAR SIGNALING BY ERBB4 | Genes involved in Nuclear signaling by ERBB4 |
| 0.1 | 5.6 | REACTOME CGMP EFFECTS | Genes involved in cGMP effects |
| 0.1 | 3.6 | REACTOME DEGRADATION OF THE EXTRACELLULAR MATRIX | Genes involved in Degradation of the extracellular matrix |
| 0.1 | 2.2 | REACTOME CIRCADIAN CLOCK | Genes involved in Circadian Clock |
| 0.1 | 2.6 | REACTOME SIGNALING BY NODAL | Genes involved in Signaling by NODAL |
| 0.1 | 4.2 | REACTOME AMYLOIDS | Genes involved in Amyloids |
| 0.1 | 2.3 | REACTOME PROTEOLYTIC CLEAVAGE OF SNARE COMPLEX PROTEINS | Genes involved in Proteolytic cleavage of SNARE complex proteins |
| 0.1 | 3.3 | REACTOME PERK REGULATED GENE EXPRESSION | Genes involved in PERK regulated gene expression |
| 0.1 | 2.4 | REACTOME OXYGEN DEPENDENT PROLINE HYDROXYLATION OF HYPOXIA INDUCIBLE FACTOR ALPHA | Genes involved in Oxygen-dependent Proline Hydroxylation of Hypoxia-inducible Factor Alpha |
| 0.1 | 10.8 | REACTOME TOLL RECEPTOR CASCADES | Genes involved in Toll Receptor Cascades |
| 0.1 | 4.7 | REACTOME NOTCH1 INTRACELLULAR DOMAIN REGULATES TRANSCRIPTION | Genes involved in NOTCH1 Intracellular Domain Regulates Transcription |
| 0.1 | 1.7 | REACTOME BASE FREE SUGAR PHOSPHATE REMOVAL VIA THE SINGLE NUCLEOTIDE REPLACEMENT PATHWAY | Genes involved in Base-free sugar-phosphate removal via the single-nucleotide replacement pathway |
| 0.1 | 4.0 | REACTOME CHEMOKINE RECEPTORS BIND CHEMOKINES | Genes involved in Chemokine receptors bind chemokines |
| 0.1 | 23.8 | REACTOME GENERIC TRANSCRIPTION PATHWAY | Genes involved in Generic Transcription Pathway |
| 0.1 | 9.1 | REACTOME PEPTIDE LIGAND BINDING RECEPTORS | Genes involved in Peptide ligand-binding receptors |
| 0.1 | 2.0 | REACTOME SPHINGOLIPID DE NOVO BIOSYNTHESIS | Genes involved in Sphingolipid de novo biosynthesis |
| 0.1 | 0.8 | REACTOME RNA POL I TRANSCRIPTION TERMINATION | Genes involved in RNA Polymerase I Transcription Termination |
| 0.1 | 1.8 | REACTOME POTASSIUM CHANNELS | Genes involved in Potassium Channels |
| 0.1 | 1.2 | REACTOME FACILITATIVE NA INDEPENDENT GLUCOSE TRANSPORTERS | Genes involved in Facilitative Na+-independent glucose transporters |
| 0.1 | 0.5 | REACTOME POST TRANSLATIONAL MODIFICATION SYNTHESIS OF GPI ANCHORED PROTEINS | Genes involved in Post-translational modification: synthesis of GPI-anchored proteins |
| 0.1 | 0.5 | REACTOME RECYCLING OF BILE ACIDS AND SALTS | Genes involved in Recycling of bile acids and salts |
| 0.1 | 0.9 | REACTOME ORGANIC CATION ANION ZWITTERION TRANSPORT | Genes involved in Organic cation/anion/zwitterion transport |
| 0.1 | 1.0 | REACTOME REGULATION OF INSULIN LIKE GROWTH FACTOR IGF ACTIVITY BY INSULIN LIKE GROWTH FACTOR BINDING PROTEINS IGFBPS | Genes involved in Regulation of Insulin-like Growth Factor (IGF) Activity by Insulin-like Growth Factor Binding Proteins (IGFBPs) |
| 0.0 | 1.0 | REACTOME APOPTOTIC CLEAVAGE OF CELL ADHESION PROTEINS | Genes involved in Apoptotic cleavage of cell adhesion proteins |
| 0.0 | 1.3 | REACTOME IL RECEPTOR SHC SIGNALING | Genes involved in Interleukin receptor SHC signaling |
| 0.0 | 1.2 | REACTOME SYNTHESIS OF VERY LONG CHAIN FATTY ACYL COAS | Genes involved in Synthesis of very long-chain fatty acyl-CoAs |
| 0.0 | 1.4 | REACTOME APOPTOTIC CLEAVAGE OF CELLULAR PROTEINS | Genes involved in Apoptotic cleavage of cellular proteins |
| 0.0 | 0.8 | REACTOME INFLAMMASOMES | Genes involved in Inflammasomes |
| 0.0 | 1.5 | REACTOME INTERFERON GAMMA SIGNALING | Genes involved in Interferon gamma signaling |
| 0.0 | 0.5 | REACTOME METABOLISM OF NON CODING RNA | Genes involved in Metabolism of non-coding RNA |
| 0.0 | 0.9 | REACTOME TRANSCRIPTIONAL REGULATION OF WHITE ADIPOCYTE DIFFERENTIATION | Genes involved in Transcriptional Regulation of White Adipocyte Differentiation |
| 0.0 | 0.4 | REACTOME ANTIGEN ACTIVATES B CELL RECEPTOR LEADING TO GENERATION OF SECOND MESSENGERS | Genes involved in Antigen Activates B Cell Receptor Leading to Generation of Second Messengers |
| 0.0 | 0.6 | REACTOME SULFUR AMINO ACID METABOLISM | Genes involved in Sulfur amino acid metabolism |
| 0.0 | 1.6 | REACTOME SIGNALING BY PDGF | Genes involved in Signaling by PDGF |
| 0.0 | 1.4 | REACTOME FACTORS INVOLVED IN MEGAKARYOCYTE DEVELOPMENT AND PLATELET PRODUCTION | Genes involved in Factors involved in megakaryocyte development and platelet production |
| 0.0 | 0.4 | REACTOME MUSCLE CONTRACTION | Genes involved in Muscle contraction |
| 0.0 | 0.3 | REACTOME CYTOSOLIC SULFONATION OF SMALL MOLECULES | Genes involved in Cytosolic sulfonation of small molecules |
| 0.0 | 0.1 | REACTOME ABACAVIR TRANSPORT AND METABOLISM | Genes involved in Abacavir transport and metabolism |
| 0.0 | 0.2 | REACTOME DOPAMINE NEUROTRANSMITTER RELEASE CYCLE | Genes involved in Dopamine Neurotransmitter Release Cycle |