Project
GNF SymAtlas + NCI-60 cancer cell lines, human (Su, 2004; Ross, 2000)
Navigation
Downloads
Results for PAX6
Z-value: 0.72
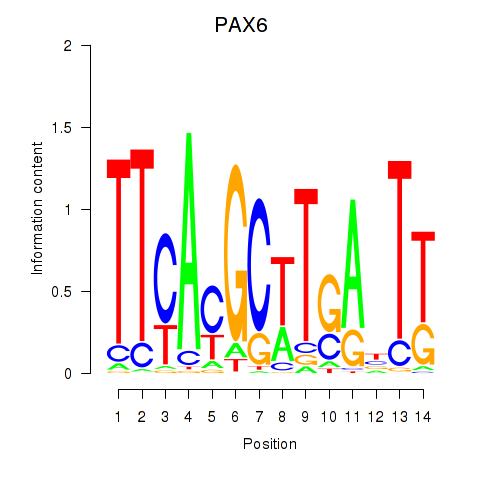
Motif logo
Transcription factors associated with PAX6
| Gene Symbol | Gene ID | Gene Info |
|---|---|---|
|
PAX6
|
ENSG00000007372.24 | PAX6 |
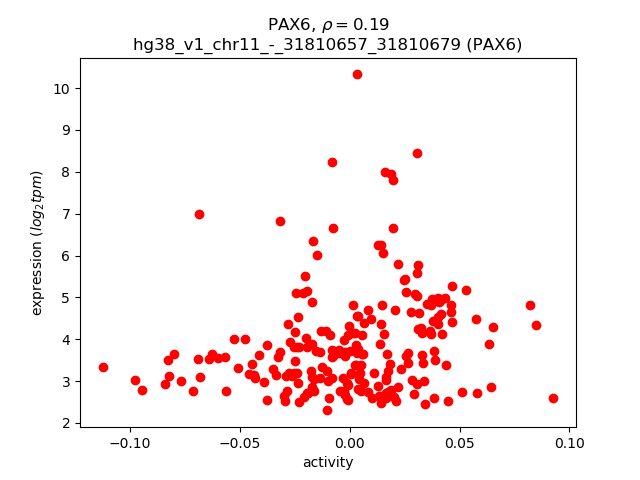
Activity-expression correlation:
| Gene | Promoter | Pearson corr. coef. | P-value | Plot |
|---|---|---|---|---|
| PAX6 | hg38_v1_chr11_-_31810657_31810679, hg38_v1_chr11_-_31811140_31811149, hg38_v1_chr11_-_31817904_31817924, hg38_v1_chr11_-_31805795_31805857, hg38_v1_chr11_-_31811034_31811057, hg38_v1_chr11_-_31812171_31812342 | 0.19 | 4.8e-03 | Click! |
Activity profile of PAX6 motif
Sorted Z-values of PAX6 motif
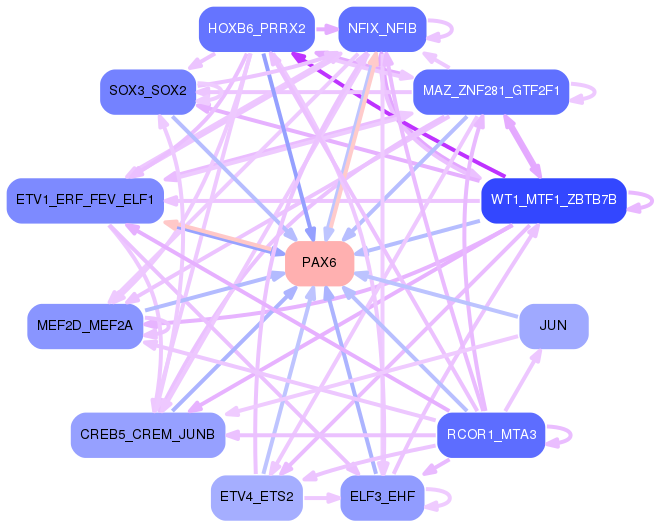
Network of associatons between targets according to the STRING database.

First level regulatory network of PAX6
Gene Ontology Analysis
Gene overrepresentation in biological process category:
| Log-likelihood per target | Total log-likelihood | Term | Description |
|---|---|---|---|
| 9.5 | 28.6 | GO:0070650 | endoplasmic reticulum polarization(GO:0061163) actin filament bundle retrograde transport(GO:0061573) actin filament bundle distribution(GO:0070650) |
| 3.8 | 15.2 | GO:0070981 | L-asparagine biosynthetic process(GO:0070981) L-asparagine metabolic process(GO:0070982) |
| 1.7 | 8.5 | GO:1900063 | regulation of peroxisome organization(GO:1900063) |
| 1.5 | 10.3 | GO:0031914 | negative regulation of synaptic plasticity(GO:0031914) |
| 1.2 | 12.2 | GO:0036309 | protein localization to M-band(GO:0036309) protein localization to T-tubule(GO:0036371) |
| 1.2 | 4.7 | GO:0018231 | peptidyl-L-cysteine S-palmitoylation(GO:0018230) peptidyl-S-diacylglycerol-L-cysteine biosynthetic process from peptidyl-cysteine(GO:0018231) |
| 1.1 | 6.7 | GO:0097052 | L-kynurenine metabolic process(GO:0097052) |
| 1.0 | 3.1 | GO:2000097 | regulation of smooth muscle cell-matrix adhesion(GO:2000097) |
| 1.0 | 15.2 | GO:1903760 | regulation of voltage-gated potassium channel activity involved in ventricular cardiac muscle cell action potential repolarization(GO:1903760) |
| 1.0 | 13.4 | GO:0070050 | neuron cellular homeostasis(GO:0070050) |
| 0.9 | 6.1 | GO:1901509 | regulation of endothelial tube morphogenesis(GO:1901509) |
| 0.8 | 5.1 | GO:0097338 | response to clozapine(GO:0097338) |
| 0.8 | 2.3 | GO:0036388 | pre-replicative complex assembly involved in nuclear cell cycle DNA replication(GO:0006267) pre-replicative complex assembly(GO:0036388) pre-replicative complex assembly involved in cell cycle DNA replication(GO:1902299) |
| 0.7 | 3.7 | GO:2001181 | positive regulation of interleukin-10 secretion(GO:2001181) |
| 0.6 | 3.9 | GO:0070560 | protein secretion by platelet(GO:0070560) |
| 0.6 | 1.7 | GO:0070901 | mitochondrial tRNA methylation(GO:0070901) |
| 0.5 | 6.5 | GO:0051612 | negative regulation of neurotransmitter uptake(GO:0051581) regulation of serotonin uptake(GO:0051611) negative regulation of serotonin uptake(GO:0051612) |
| 0.5 | 5.1 | GO:0071787 | endoplasmic reticulum tubular network assembly(GO:0071787) |
| 0.4 | 1.5 | GO:0071802 | negative regulation of podosome assembly(GO:0071802) |
| 0.4 | 2.9 | GO:0061002 | negative regulation of dendritic spine morphogenesis(GO:0061002) |
| 0.4 | 2.5 | GO:0099550 | trans-synaptic signalling, modulating synaptic transmission(GO:0099550) |
| 0.3 | 1.0 | GO:0000350 | generation of catalytic spliceosome for second transesterification step(GO:0000350) |
| 0.3 | 11.7 | GO:0008045 | motor neuron axon guidance(GO:0008045) |
| 0.3 | 3.8 | GO:2001288 | positive regulation of caveolin-mediated endocytosis(GO:2001288) |
| 0.3 | 1.9 | GO:1903232 | melanosome assembly(GO:1903232) |
| 0.3 | 2.1 | GO:0010724 | regulation of definitive erythrocyte differentiation(GO:0010724) |
| 0.3 | 2.2 | GO:0035524 | proline transmembrane transport(GO:0035524) |
| 0.3 | 1.3 | GO:0090362 | positive regulation of platelet-derived growth factor production(GO:0090362) |
| 0.2 | 1.2 | GO:0043126 | regulation of 1-phosphatidylinositol 4-kinase activity(GO:0043126) positive regulation of 1-phosphatidylinositol 4-kinase activity(GO:0043128) |
| 0.2 | 0.7 | GO:0043974 | histone H3-K27 acetylation(GO:0043974) regulation of histone H3-K27 acetylation(GO:1901674) |
| 0.2 | 4.6 | GO:1904776 | regulation of protein localization to cell cortex(GO:1904776) positive regulation of protein localization to cell cortex(GO:1904778) |
| 0.2 | 1.3 | GO:0006348 | chromatin silencing at telomere(GO:0006348) |
| 0.2 | 1.5 | GO:1990592 | protein polyufmylation(GO:1990564) protein K69-linked ufmylation(GO:1990592) |
| 0.2 | 0.6 | GO:0034402 | recruitment of 3'-end processing factors to RNA polymerase II holoenzyme complex(GO:0034402) |
| 0.2 | 1.4 | GO:1902741 | interferon-alpha secretion(GO:0072642) regulation of interferon-alpha secretion(GO:1902739) positive regulation of interferon-alpha secretion(GO:1902741) |
| 0.2 | 2.9 | GO:0006983 | ER overload response(GO:0006983) |
| 0.2 | 13.3 | GO:2000649 | regulation of sodium ion transmembrane transporter activity(GO:2000649) |
| 0.2 | 2.3 | GO:0000972 | transcription-dependent tethering of RNA polymerase II gene DNA at nuclear periphery(GO:0000972) |
| 0.1 | 1.2 | GO:0050859 | negative regulation of B cell receptor signaling pathway(GO:0050859) |
| 0.1 | 1.0 | GO:0007195 | adenylate cyclase-inhibiting dopamine receptor signaling pathway(GO:0007195) |
| 0.1 | 10.6 | GO:0070125 | mitochondrial translational elongation(GO:0070125) |
| 0.1 | 1.2 | GO:0045039 | protein import into mitochondrial inner membrane(GO:0045039) |
| 0.1 | 1.0 | GO:1902715 | positive regulation of interferon-gamma secretion(GO:1902715) |
| 0.1 | 2.2 | GO:0070208 | protein heterotrimerization(GO:0070208) |
| 0.1 | 4.4 | GO:0006622 | protein targeting to lysosome(GO:0006622) |
| 0.1 | 1.1 | GO:2000786 | positive regulation of autophagosome assembly(GO:2000786) |
| 0.1 | 3.1 | GO:0051084 | 'de novo' posttranslational protein folding(GO:0051084) |
| 0.1 | 1.3 | GO:0048172 | regulation of short-term neuronal synaptic plasticity(GO:0048172) |
| 0.1 | 2.3 | GO:0048934 | peripheral nervous system neuron differentiation(GO:0048934) peripheral nervous system neuron development(GO:0048935) |
| 0.1 | 0.8 | GO:0099566 | regulation of postsynaptic cytosolic calcium ion concentration(GO:0099566) |
| 0.1 | 1.3 | GO:0007258 | JUN phosphorylation(GO:0007258) |
| 0.1 | 2.8 | GO:0021952 | central nervous system projection neuron axonogenesis(GO:0021952) |
| 0.1 | 1.2 | GO:0035457 | cellular response to interferon-alpha(GO:0035457) |
| 0.1 | 0.2 | GO:1904058 | positive regulation of sensory perception of pain(GO:1904058) |
| 0.1 | 1.4 | GO:0006048 | UDP-N-acetylglucosamine biosynthetic process(GO:0006048) |
| 0.1 | 2.5 | GO:0032438 | melanosome organization(GO:0032438) |
| 0.1 | 2.5 | GO:1901685 | glutathione derivative metabolic process(GO:1901685) glutathione derivative biosynthetic process(GO:1901687) |
| 0.1 | 0.5 | GO:0007023 | post-chaperonin tubulin folding pathway(GO:0007023) |
| 0.1 | 2.3 | GO:0006359 | regulation of transcription from RNA polymerase III promoter(GO:0006359) |
| 0.1 | 1.4 | GO:0052695 | cellular glucuronidation(GO:0052695) |
| 0.1 | 1.0 | GO:0070986 | left/right axis specification(GO:0070986) |
| 0.1 | 5.7 | GO:0061178 | regulation of insulin secretion involved in cellular response to glucose stimulus(GO:0061178) |
| 0.1 | 0.4 | GO:0010961 | cellular magnesium ion homeostasis(GO:0010961) |
| 0.1 | 0.4 | GO:0006489 | dolichyl diphosphate biosynthetic process(GO:0006489) dolichyl diphosphate metabolic process(GO:0046465) |
| 0.1 | 2.6 | GO:0006376 | mRNA splice site selection(GO:0006376) |
| 0.1 | 2.4 | GO:1901661 | quinone metabolic process(GO:1901661) |
| 0.1 | 1.6 | GO:0044849 | estrous cycle(GO:0044849) |
| 0.1 | 1.1 | GO:0006123 | mitochondrial electron transport, cytochrome c to oxygen(GO:0006123) |
| 0.1 | 0.2 | GO:0034773 | histone H4-K20 trimethylation(GO:0034773) |
| 0.1 | 1.0 | GO:0060670 | branching involved in labyrinthine layer morphogenesis(GO:0060670) |
| 0.1 | 0.6 | GO:0019885 | antigen processing and presentation of endogenous peptide antigen via MHC class I(GO:0019885) |
| 0.0 | 0.2 | GO:0071287 | cellular response to manganese ion(GO:0071287) |
| 0.0 | 1.2 | GO:0048025 | negative regulation of mRNA splicing, via spliceosome(GO:0048025) |
| 0.0 | 0.5 | GO:0042354 | fucose catabolic process(GO:0019317) L-fucose metabolic process(GO:0042354) L-fucose catabolic process(GO:0042355) |
| 0.0 | 2.4 | GO:0006120 | mitochondrial electron transport, NADH to ubiquinone(GO:0006120) |
| 0.0 | 2.7 | GO:0032465 | regulation of cytokinesis(GO:0032465) |
| 0.0 | 1.0 | GO:0071157 | negative regulation of cell cycle arrest(GO:0071157) |
| 0.0 | 0.2 | GO:0097105 | presynaptic membrane assembly(GO:0097105) |
| 0.0 | 6.3 | GO:0030307 | positive regulation of cell growth(GO:0030307) |
| 0.0 | 0.8 | GO:0006312 | mitotic recombination(GO:0006312) |
| 0.0 | 0.3 | GO:0002863 | positive regulation of inflammatory response to antigenic stimulus(GO:0002863) |
| 0.0 | 0.8 | GO:0016338 | calcium-independent cell-cell adhesion via plasma membrane cell-adhesion molecules(GO:0016338) |
| 0.0 | 0.2 | GO:0003185 | primary heart field specification(GO:0003138) sinoatrial valve development(GO:0003172) sinoatrial valve morphogenesis(GO:0003185) |
| 0.0 | 0.2 | GO:1902414 | protein localization to cell junction(GO:1902414) |
| 0.0 | 3.4 | GO:0003073 | regulation of systemic arterial blood pressure(GO:0003073) |
| 0.0 | 12.6 | GO:0043687 | post-translational protein modification(GO:0043687) |
| 0.0 | 0.5 | GO:0045109 | intermediate filament organization(GO:0045109) |
| 0.0 | 3.8 | GO:0007156 | homophilic cell adhesion via plasma membrane adhesion molecules(GO:0007156) |
| 0.0 | 1.2 | GO:0001824 | blastocyst development(GO:0001824) |
| 0.0 | 5.7 | GO:0043523 | regulation of neuron apoptotic process(GO:0043523) |
| 0.0 | 1.6 | GO:0006892 | post-Golgi vesicle-mediated transport(GO:0006892) |
| 0.0 | 0.8 | GO:0051965 | positive regulation of synapse assembly(GO:0051965) |
| 0.0 | 0.6 | GO:0019985 | translesion synthesis(GO:0019985) |
| 0.0 | 0.5 | GO:0032007 | negative regulation of TOR signaling(GO:0032007) |
| 0.0 | 0.7 | GO:2001244 | positive regulation of intrinsic apoptotic signaling pathway(GO:2001244) |
| 0.0 | 2.5 | GO:0060828 | regulation of canonical Wnt signaling pathway(GO:0060828) |
Gene overrepresentation in cellular component category:
| Log-likelihood per target | Total log-likelihood | Term | Description |
|---|---|---|---|
| 2.1 | 10.3 | GO:0016533 | cyclin-dependent protein kinase 5 holoenzyme complex(GO:0016533) |
| 1.1 | 28.6 | GO:0044295 | axonal growth cone(GO:0044295) |
| 1.0 | 3.0 | GO:0031515 | tRNA (m1A) methyltransferase complex(GO:0031515) |
| 0.9 | 11.7 | GO:0035253 | ciliary rootlet(GO:0035253) |
| 0.9 | 19.0 | GO:0035748 | myelin sheath abaxonal region(GO:0035748) |
| 0.8 | 4.7 | GO:0002178 | palmitoyltransferase complex(GO:0002178) |
| 0.8 | 2.3 | GO:0005656 | nuclear pre-replicative complex(GO:0005656) pre-replicative complex(GO:0036387) |
| 0.6 | 2.5 | GO:0000308 | cytoplasmic cyclin-dependent protein kinase holoenzyme complex(GO:0000308) |
| 0.4 | 1.9 | GO:0031905 | early endosome lumen(GO:0031905) |
| 0.3 | 4.6 | GO:0030130 | clathrin coat of trans-Golgi network vesicle(GO:0030130) |
| 0.3 | 4.6 | GO:0008091 | spectrin(GO:0008091) |
| 0.3 | 10.6 | GO:0000315 | organellar large ribosomal subunit(GO:0000315) mitochondrial large ribosomal subunit(GO:0005762) |
| 0.2 | 3.9 | GO:0014731 | spectrin-associated cytoskeleton(GO:0014731) |
| 0.2 | 5.1 | GO:0005952 | cAMP-dependent protein kinase complex(GO:0005952) |
| 0.2 | 12.2 | GO:0043034 | costamere(GO:0043034) |
| 0.2 | 5.1 | GO:0071782 | endoplasmic reticulum tubular network(GO:0071782) |
| 0.2 | 0.8 | GO:0044308 | axonal spine(GO:0044308) |
| 0.1 | 1.0 | GO:0070436 | Grb2-EGFR complex(GO:0070436) |
| 0.1 | 2.3 | GO:0031080 | nuclear pore outer ring(GO:0031080) |
| 0.1 | 1.2 | GO:0042719 | mitochondrial intermembrane space protein transporter complex(GO:0042719) |
| 0.1 | 8.5 | GO:0032592 | integral component of mitochondrial membrane(GO:0032592) |
| 0.1 | 2.2 | GO:0016281 | eukaryotic translation initiation factor 4F complex(GO:0016281) |
| 0.1 | 3.8 | GO:0005640 | nuclear outer membrane(GO:0005640) |
| 0.1 | 2.5 | GO:0032585 | multivesicular body membrane(GO:0032585) |
| 0.1 | 1.4 | GO:0008385 | IkappaB kinase complex(GO:0008385) |
| 0.1 | 1.3 | GO:0019773 | proteasome core complex, alpha-subunit complex(GO:0019773) |
| 0.1 | 1.1 | GO:0005751 | mitochondrial respiratory chain complex IV(GO:0005751) |
| 0.1 | 3.8 | GO:0005771 | multivesicular body(GO:0005771) |
| 0.1 | 11.8 | GO:0044306 | neuron projection terminus(GO:0044306) |
| 0.1 | 1.3 | GO:0071004 | U2-type prespliceosome(GO:0071004) |
| 0.1 | 1.0 | GO:0005684 | U2-type spliceosomal complex(GO:0005684) |
| 0.1 | 0.6 | GO:0016593 | Cdc73/Paf1 complex(GO:0016593) |
| 0.1 | 2.7 | GO:0002102 | podosome(GO:0002102) |
| 0.1 | 0.4 | GO:0042406 | extrinsic component of endoplasmic reticulum membrane(GO:0042406) |
| 0.0 | 1.9 | GO:0016592 | mediator complex(GO:0016592) |
| 0.0 | 16.4 | GO:0005788 | endoplasmic reticulum lumen(GO:0005788) |
| 0.0 | 2.4 | GO:0045271 | mitochondrial respiratory chain complex I(GO:0005747) NADH dehydrogenase complex(GO:0030964) respiratory chain complex I(GO:0045271) |
| 0.0 | 0.2 | GO:0009368 | endopeptidase Clp complex(GO:0009368) |
| 0.0 | 2.9 | GO:0000502 | proteasome complex(GO:0000502) |
| 0.0 | 0.4 | GO:0044300 | cerebellar mossy fiber(GO:0044300) |
| 0.0 | 3.6 | GO:0016363 | nuclear matrix(GO:0016363) |
| 0.0 | 1.9 | GO:0032588 | trans-Golgi network membrane(GO:0032588) |
| 0.0 | 3.1 | GO:0022626 | cytosolic ribosome(GO:0022626) |
| 0.0 | 2.6 | GO:0030176 | integral component of endoplasmic reticulum membrane(GO:0030176) |
| 0.0 | 5.0 | GO:0005938 | cell cortex(GO:0005938) |
| 0.0 | 1.0 | GO:0099501 | synaptic vesicle membrane(GO:0030672) exocytic vesicle membrane(GO:0099501) |
| 0.0 | 0.7 | GO:0001772 | immunological synapse(GO:0001772) |
| 0.0 | 1.1 | GO:0005776 | autophagosome(GO:0005776) |
| 0.0 | 1.7 | GO:0005923 | bicellular tight junction(GO:0005923) |
| 0.0 | 1.4 | GO:0031901 | early endosome membrane(GO:0031901) |
Gene overrepresentation in molecular function category:
| Log-likelihood per target | Total log-likelihood | Term | Description |
|---|---|---|---|
| 3.4 | 10.3 | GO:0030549 | acetylcholine receptor activator activity(GO:0030549) |
| 3.0 | 15.2 | GO:0004066 | asparagine synthase (glutamine-hydrolyzing) activity(GO:0004066) |
| 2.2 | 6.7 | GO:0047315 | kynurenine-glyoxylate transaminase activity(GO:0047315) |
| 1.0 | 3.0 | GO:0016429 | tRNA (adenine-N1-)-methyltransferase activity(GO:0016429) |
| 0.8 | 15.2 | GO:0097016 | L27 domain binding(GO:0097016) |
| 0.6 | 2.5 | GO:0048403 | brain-derived neurotrophic factor binding(GO:0048403) |
| 0.6 | 1.9 | GO:0035651 | AP-1 adaptor complex binding(GO:0035650) AP-3 adaptor complex binding(GO:0035651) |
| 0.6 | 3.5 | GO:0003960 | NADPH:quinone reductase activity(GO:0003960) |
| 0.5 | 2.0 | GO:0050211 | procollagen galactosyltransferase activity(GO:0050211) |
| 0.5 | 33.2 | GO:0019894 | kinesin binding(GO:0019894) |
| 0.5 | 9.4 | GO:0019706 | protein-cysteine S-palmitoyltransferase activity(GO:0019706) protein-cysteine S-acyltransferase activity(GO:0019707) |
| 0.5 | 1.4 | GO:0008384 | IkappaB kinase activity(GO:0008384) |
| 0.5 | 4.6 | GO:0042731 | PH domain binding(GO:0042731) |
| 0.4 | 2.2 | GO:0005298 | proline:sodium symporter activity(GO:0005298) |
| 0.4 | 11.7 | GO:0008574 | ATP-dependent microtubule motor activity, plus-end-directed(GO:0008574) |
| 0.4 | 1.1 | GO:0016309 | 1-phosphatidylinositol-5-phosphate 4-kinase activity(GO:0016309) |
| 0.3 | 1.4 | GO:0004360 | glutamine-fructose-6-phosphate transaminase (isomerizing) activity(GO:0004360) |
| 0.3 | 5.1 | GO:0004691 | cAMP-dependent protein kinase activity(GO:0004691) |
| 0.3 | 0.8 | GO:0015616 | DNA translocase activity(GO:0015616) |
| 0.3 | 1.4 | GO:0051998 | carboxyl-O-methyltransferase activity(GO:0010340) protein carboxyl O-methyltransferase activity(GO:0051998) |
| 0.3 | 14.5 | GO:0030507 | spectrin binding(GO:0030507) |
| 0.2 | 16.0 | GO:0017080 | sodium channel regulator activity(GO:0017080) |
| 0.2 | 2.9 | GO:1990247 | N6-methyladenosine-containing RNA binding(GO:1990247) |
| 0.2 | 6.1 | GO:0044548 | S100 protein binding(GO:0044548) |
| 0.2 | 4.4 | GO:0005545 | 1-phosphatidylinositol binding(GO:0005545) |
| 0.2 | 4.7 | GO:0043560 | insulin receptor substrate binding(GO:0043560) |
| 0.2 | 4.3 | GO:0004806 | triglyceride lipase activity(GO:0004806) |
| 0.2 | 0.7 | GO:0042015 | interleukin-20 binding(GO:0042015) |
| 0.1 | 4.6 | GO:0043014 | alpha-tubulin binding(GO:0043014) |
| 0.1 | 6.3 | GO:0046966 | thyroid hormone receptor binding(GO:0046966) |
| 0.1 | 0.4 | GO:0004060 | arylamine N-acetyltransferase activity(GO:0004060) |
| 0.1 | 1.0 | GO:0001591 | dopamine neurotransmitter receptor activity, coupled via Gi/Go(GO:0001591) |
| 0.1 | 2.3 | GO:0003688 | DNA replication origin binding(GO:0003688) |
| 0.1 | 1.9 | GO:0030898 | actin-dependent ATPase activity(GO:0030898) |
| 0.1 | 0.9 | GO:0034711 | inhibin binding(GO:0034711) |
| 0.1 | 1.3 | GO:0004705 | JUN kinase activity(GO:0004705) SAP kinase activity(GO:0016909) |
| 0.1 | 0.8 | GO:0004971 | AMPA glutamate receptor activity(GO:0004971) |
| 0.1 | 0.5 | GO:0017060 | 3-galactosyl-N-acetylglucosaminide 4-alpha-L-fucosyltransferase activity(GO:0017060) |
| 0.1 | 2.7 | GO:0070064 | proline-rich region binding(GO:0070064) |
| 0.1 | 1.1 | GO:0034483 | heparan sulfate sulfotransferase activity(GO:0034483) |
| 0.1 | 1.2 | GO:1990459 | transferrin receptor binding(GO:1990459) |
| 0.1 | 0.4 | GO:0031708 | endothelin B receptor binding(GO:0031708) |
| 0.1 | 1.2 | GO:0010181 | FMN binding(GO:0010181) |
| 0.1 | 0.7 | GO:0001135 | transcription factor activity, RNA polymerase II transcription factor recruiting(GO:0001135) |
| 0.1 | 1.3 | GO:0010485 | H4 histone acetyltransferase activity(GO:0010485) |
| 0.1 | 2.5 | GO:0030332 | cyclin binding(GO:0030332) |
| 0.1 | 2.5 | GO:0004364 | glutathione transferase activity(GO:0004364) |
| 0.0 | 10.6 | GO:0003735 | structural constituent of ribosome(GO:0003735) |
| 0.0 | 1.5 | GO:0030676 | Rac guanyl-nucleotide exchange factor activity(GO:0030676) |
| 0.0 | 2.4 | GO:0050136 | NADH dehydrogenase (ubiquinone) activity(GO:0008137) NADH dehydrogenase (quinone) activity(GO:0050136) |
| 0.0 | 3.7 | GO:0005089 | Rho guanyl-nucleotide exchange factor activity(GO:0005089) |
| 0.0 | 1.3 | GO:0070003 | threonine-type endopeptidase activity(GO:0004298) threonine-type peptidase activity(GO:0070003) |
| 0.0 | 2.6 | GO:0015485 | cholesterol binding(GO:0015485) |
| 0.0 | 1.2 | GO:0017056 | structural constituent of nuclear pore(GO:0017056) |
| 0.0 | 1.1 | GO:0016676 | cytochrome-c oxidase activity(GO:0004129) heme-copper terminal oxidase activity(GO:0015002) oxidoreductase activity, acting on a heme group of donors(GO:0016675) oxidoreductase activity, acting on a heme group of donors, oxygen as acceptor(GO:0016676) |
| 0.0 | 1.9 | GO:0003899 | DNA-directed RNA polymerase activity(GO:0003899) |
| 0.0 | 1.4 | GO:0015020 | glucuronosyltransferase activity(GO:0015020) |
| 0.0 | 2.2 | GO:0003743 | translation initiation factor activity(GO:0003743) |
| 0.0 | 2.6 | GO:0005070 | SH3/SH2 adaptor activity(GO:0005070) |
| 0.0 | 0.6 | GO:0070006 | metalloaminopeptidase activity(GO:0070006) |
| 0.0 | 0.6 | GO:0000993 | RNA polymerase II core binding(GO:0000993) |
| 0.0 | 0.4 | GO:0004659 | prenyltransferase activity(GO:0004659) |
| 0.0 | 9.7 | GO:0019787 | ubiquitin-like protein transferase activity(GO:0019787) |
| 0.0 | 2.9 | GO:0005262 | calcium channel activity(GO:0005262) |
| 0.0 | 15.5 | GO:0005509 | calcium ion binding(GO:0005509) |
| 0.0 | 2.0 | GO:0004222 | metalloendopeptidase activity(GO:0004222) |
| 0.0 | 1.7 | GO:0051087 | chaperone binding(GO:0051087) |
| 0.0 | 0.2 | GO:0031435 | mitogen-activated protein kinase kinase kinase binding(GO:0031435) |
| 0.0 | 4.7 | GO:0031625 | ubiquitin protein ligase binding(GO:0031625) |
| 0.0 | 0.2 | GO:0042043 | neurexin family protein binding(GO:0042043) |
| 0.0 | 1.0 | GO:0019213 | deacetylase activity(GO:0019213) |
| 0.0 | 0.2 | GO:0003680 | AT DNA binding(GO:0003680) |
| 0.0 | 0.3 | GO:0031492 | nucleosomal DNA binding(GO:0031492) |
| 0.0 | 0.2 | GO:0017166 | vinculin binding(GO:0017166) |
| 0.0 | 5.8 | GO:0004674 | protein serine/threonine kinase activity(GO:0004674) |
Gene overrepresentation in curated gene sets: canonical pathways category:
| Log-likelihood per target | Total log-likelihood | Term | Description |
|---|---|---|---|
| 0.2 | 10.3 | PID EPHA FWDPATHWAY | EPHA forward signaling |
| 0.2 | 15.2 | PID ECADHERIN NASCENT AJ PATHWAY | E-cadherin signaling in the nascent adherens junction |
| 0.2 | 18.2 | PID P75 NTR PATHWAY | p75(NTR)-mediated signaling |
| 0.1 | 11.0 | PID TRKR PATHWAY | Neurotrophic factor-mediated Trk receptor signaling |
| 0.1 | 6.1 | PID FGF PATHWAY | FGF signaling pathway |
| 0.1 | 4.4 | PID TGFBR PATHWAY | TGF-beta receptor signaling |
| 0.1 | 2.3 | PID P38 MK2 PATHWAY | p38 signaling mediated by MAPKAP kinases |
| 0.0 | 2.6 | PID INTEGRIN A4B1 PATHWAY | Alpha4 beta1 integrin signaling events |
| 0.0 | 1.5 | PID REELIN PATHWAY | Reelin signaling pathway |
| 0.0 | 2.7 | PID TELOMERASE PATHWAY | Regulation of Telomerase |
| 0.0 | 1.9 | PID DELTA NP63 PATHWAY | Validated transcriptional targets of deltaNp63 isoforms |
| 0.0 | 4.6 | NABA ECM GLYCOPROTEINS | Genes encoding structural ECM glycoproteins |
| 0.0 | 0.8 | PID EPHB FWD PATHWAY | EPHB forward signaling |
| 0.0 | 0.7 | PID FRA PATHWAY | Validated transcriptional targets of AP1 family members Fra1 and Fra2 |
| 0.0 | 1.3 | PID ERA GENOMIC PATHWAY | Validated nuclear estrogen receptor alpha network |
Gene overrepresentation in curated gene sets: REACTOME pathways category:
| Log-likelihood per target | Total log-likelihood | Term | Description |
|---|---|---|---|
| 0.6 | 19.9 | REACTOME IONOTROPIC ACTIVITY OF KAINATE RECEPTORS | Genes involved in Ionotropic activity of Kainate Receptors |
| 0.5 | 15.2 | REACTOME AMINO ACID SYNTHESIS AND INTERCONVERSION TRANSAMINATION | Genes involved in Amino acid synthesis and interconversion (transamination) |
| 0.4 | 10.3 | REACTOME CRMPS IN SEMA3A SIGNALING | Genes involved in CRMPs in Sema3A signaling |
| 0.3 | 6.1 | REACTOME FGFR4 LIGAND BINDING AND ACTIVATION | Genes involved in FGFR4 ligand binding and activation |
| 0.2 | 2.3 | REACTOME CDC6 ASSOCIATION WITH THE ORC ORIGIN COMPLEX | Genes involved in CDC6 association with the ORC:origin complex |
| 0.2 | 3.7 | REACTOME TGF BETA RECEPTOR SIGNALING IN EMT EPITHELIAL TO MESENCHYMAL TRANSITION | Genes involved in TGF-beta receptor signaling in EMT (epithelial to mesenchymal transition) |
| 0.2 | 5.1 | REACTOME PKA MEDIATED PHOSPHORYLATION OF CREB | Genes involved in PKA-mediated phosphorylation of CREB |
| 0.2 | 1.4 | REACTOME IRAK1 RECRUITS IKK COMPLEX | Genes involved in IRAK1 recruits IKK complex |
| 0.1 | 4.4 | REACTOME SIGNALING BY BMP | Genes involved in Signaling by BMP |
| 0.1 | 2.2 | REACTOME NA CL DEPENDENT NEUROTRANSMITTER TRANSPORTERS | Genes involved in Na+/Cl- dependent neurotransmitter transporters |
| 0.1 | 2.5 | REACTOME GLUTATHIONE CONJUGATION | Genes involved in Glutathione conjugation |
| 0.1 | 1.3 | REACTOME CD28 DEPENDENT VAV1 PATHWAY | Genes involved in CD28 dependent Vav1 pathway |
| 0.1 | 4.4 | REACTOME RESPONSE TO ELEVATED PLATELET CYTOSOLIC CA2 | Genes involved in Response to elevated platelet cytosolic Ca2+ |
| 0.1 | 6.7 | REACTOME P75 NTR RECEPTOR MEDIATED SIGNALLING | Genes involved in p75 NTR receptor-mediated signalling |
| 0.1 | 1.3 | REACTOME JNK C JUN KINASES PHOSPHORYLATION AND ACTIVATION MEDIATED BY ACTIVATED HUMAN TAK1 | Genes involved in JNK (c-Jun kinases) phosphorylation and activation mediated by activated human TAK1 |
| 0.0 | 3.5 | REACTOME RESPIRATORY ELECTRON TRANSPORT | Genes involved in Respiratory electron transport |
| 0.0 | 1.1 | REACTOME HS GAG BIOSYNTHESIS | Genes involved in HS-GAG biosynthesis |
| 0.0 | 0.8 | REACTOME TRAFFICKING OF GLUR2 CONTAINING AMPA RECEPTORS | Genes involved in Trafficking of GluR2-containing AMPA receptors |
| 0.0 | 0.4 | REACTOME ACTIVATED NOTCH1 TRANSMITS SIGNAL TO THE NUCLEUS | Genes involved in Activated NOTCH1 Transmits Signal to the Nucleus |
| 0.0 | 1.2 | REACTOME MRNA 3 END PROCESSING | Genes involved in mRNA 3'-end processing |
| 0.0 | 0.8 | REACTOME TIGHT JUNCTION INTERACTIONS | Genes involved in Tight junction interactions |
| 0.0 | 2.3 | REACTOME ANTIVIRAL MECHANISM BY IFN STIMULATED GENES | Genes involved in Antiviral mechanism by IFN-stimulated genes |
| 0.0 | 1.2 | REACTOME MITOCHONDRIAL PROTEIN IMPORT | Genes involved in Mitochondrial Protein Import |
| 0.0 | 0.8 | REACTOME DEGRADATION OF THE EXTRACELLULAR MATRIX | Genes involved in Degradation of the extracellular matrix |
| 0.0 | 1.3 | REACTOME CDK MEDIATED PHOSPHORYLATION AND REMOVAL OF CDC6 | Genes involved in CDK-mediated phosphorylation and removal of Cdc6 |
| 0.0 | 1.5 | REACTOME INTERFERON ALPHA BETA SIGNALING | Genes involved in Interferon alpha/beta signaling |
| 0.0 | 0.5 | REACTOME POST CHAPERONIN TUBULIN FOLDING PATHWAY | Genes involved in Post-chaperonin tubulin folding pathway |
| 0.0 | 1.4 | REACTOME NGF SIGNALLING VIA TRKA FROM THE PLASMA MEMBRANE | Genes involved in NGF signalling via TRKA from the plasma membrane |
| 0.0 | 0.4 | REACTOME RNA POL III TRANSCRIPTION TERMINATION | Genes involved in RNA Polymerase III Transcription Termination |
| 0.0 | 1.5 | REACTOME SIGNALING BY PDGF | Genes involved in Signaling by PDGF |
| 0.0 | 1.9 | REACTOME ANTIGEN PROCESSING UBIQUITINATION PROTEASOME DEGRADATION | Genes involved in Antigen processing: Ubiquitination & Proteasome degradation |