Project
GNF SymAtlas + NCI-60 cancer cell lines, human (Su, 2004; Ross, 2000)
Navigation
Downloads
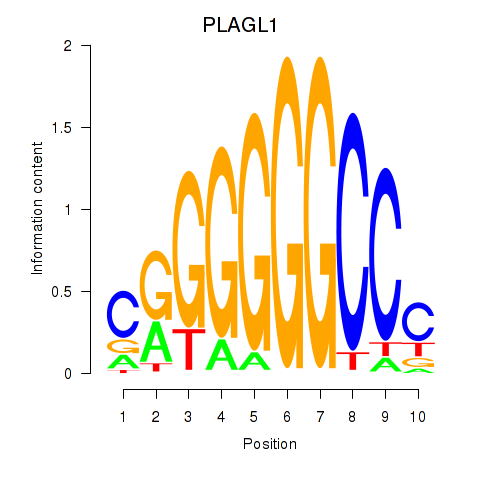
Results for PLAGL1
Z-value: 2.46
Motif logo
Transcription factors associated with PLAGL1
| Gene Symbol | Gene ID | Gene Info |
|---|---|---|
|
PLAGL1
|
ENSG00000118495.20 | PLAGL1 |
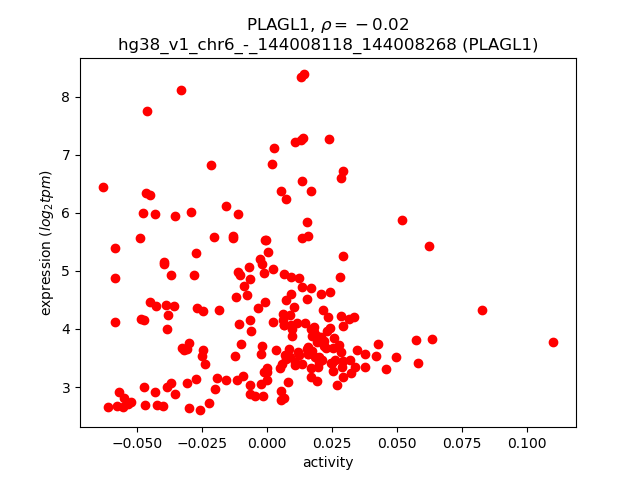
Activity-expression correlation:
| Gene | Promoter | Pearson corr. coef. | P-value | Plot |
|---|---|---|---|---|
| PLAGL1 | hg38_v1_chr6_-_144008118_144008268 | -0.02 | 7.3e-01 | Click! |
Activity profile of PLAGL1 motif
Sorted Z-values of PLAGL1 motif
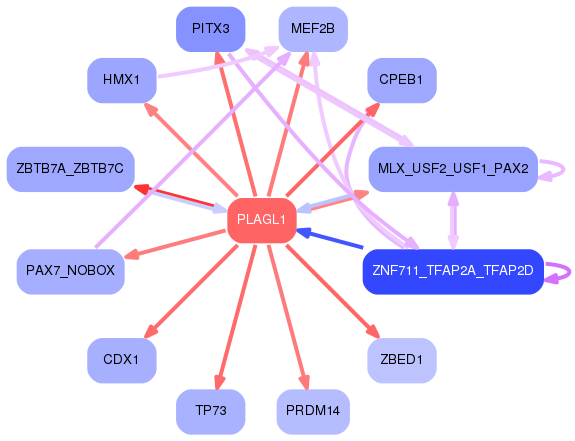
Network of associatons between targets according to the STRING database.

First level regulatory network of PLAGL1
Gene Ontology Analysis
Gene overrepresentation in biological process category:
| Log-likelihood per target | Total log-likelihood | Term | Description |
|---|---|---|---|
| 15.2 | 60.8 | GO:0010900 | negative regulation of phosphatidylcholine catabolic process(GO:0010900) |
| 14.3 | 42.9 | GO:0072365 | regulation of cellular ketone metabolic process by negative regulation of transcription from RNA polymerase II promoter(GO:0072365) |
| 13.4 | 40.3 | GO:0010133 | proline catabolic process to glutamate(GO:0010133) |
| 11.8 | 11.8 | GO:0060022 | hard palate development(GO:0060022) |
| 11.5 | 34.5 | GO:1900226 | negative regulation of NLRP3 inflammasome complex assembly(GO:1900226) |
| 11.1 | 66.8 | GO:0033274 | response to vitamin B2(GO:0033274) heterochromatin maintenance(GO:0070829) |
| 10.7 | 42.9 | GO:0006542 | glutamine biosynthetic process(GO:0006542) |
| 10.6 | 31.8 | GO:0002416 | IgG immunoglobulin transcytosis in epithelial cells mediated by FcRn immunoglobulin receptor(GO:0002416) |
| 10.6 | 52.8 | GO:0090272 | negative regulation of fibroblast growth factor production(GO:0090272) |
| 10.4 | 31.3 | GO:0014813 | skeletal muscle satellite cell commitment(GO:0014813) |
| 10.3 | 10.3 | GO:0045342 | MHC class II biosynthetic process(GO:0045342) regulation of MHC class II biosynthetic process(GO:0045346) negative regulation of MHC class II biosynthetic process(GO:0045347) |
| 10.3 | 30.9 | GO:0071139 | resolution of recombination intermediates(GO:0071139) resolution of mitotic recombination intermediates(GO:0071140) |
| 9.6 | 19.2 | GO:1902361 | mitochondrial pyruvate transport(GO:0006850) mitochondrial pyruvate transmembrane transport(GO:1902361) |
| 8.4 | 59.0 | GO:0034587 | piRNA metabolic process(GO:0034587) |
| 8.4 | 67.4 | GO:0046061 | dATP catabolic process(GO:0046061) |
| 8.2 | 74.2 | GO:1901552 | positive regulation of endothelial cell development(GO:1901552) positive regulation of establishment of endothelial barrier(GO:1903142) |
| 8.2 | 32.9 | GO:0070940 | dephosphorylation of RNA polymerase II C-terminal domain(GO:0070940) |
| 8.1 | 24.4 | GO:0001869 | regulation of complement activation, lectin pathway(GO:0001868) negative regulation of complement activation, lectin pathway(GO:0001869) |
| 7.6 | 22.9 | GO:0061760 | antifungal innate immune response(GO:0061760) |
| 7.5 | 45.2 | GO:0010732 | protein glutathionylation(GO:0010731) regulation of protein glutathionylation(GO:0010732) negative regulation of protein glutathionylation(GO:0010734) |
| 7.5 | 37.4 | GO:1904565 | response to 1-oleoyl-sn-glycerol 3-phosphate(GO:1904565) cellular response to 1-oleoyl-sn-glycerol 3-phosphate(GO:1904566) |
| 7.5 | 14.9 | GO:0060160 | negative regulation of dopamine receptor signaling pathway(GO:0060160) |
| 7.5 | 29.9 | GO:0015670 | carbon dioxide transport(GO:0015670) |
| 7.4 | 22.2 | GO:0036146 | cellular response to mycotoxin(GO:0036146) |
| 7.2 | 29.0 | GO:0019086 | late viral transcription(GO:0019086) |
| 7.2 | 50.6 | GO:0070560 | protein secretion by platelet(GO:0070560) |
| 7.0 | 42.1 | GO:0014807 | regulation of somitogenesis(GO:0014807) |
| 6.9 | 55.4 | GO:0007506 | gonadal mesoderm development(GO:0007506) |
| 6.9 | 27.6 | GO:0035627 | ceramide transport(GO:0035627) |
| 6.8 | 34.2 | GO:1902847 | regulation of neuronal signal transduction(GO:1902847) positive regulation of neurofibrillary tangle assembly(GO:1902998) |
| 6.8 | 34.2 | GO:0005985 | sucrose metabolic process(GO:0005985) |
| 6.8 | 47.3 | GO:0070127 | tRNA aminoacylation for mitochondrial protein translation(GO:0070127) |
| 6.7 | 20.1 | GO:0042560 | folic acid-containing compound catabolic process(GO:0009397) pteridine-containing compound catabolic process(GO:0042560) |
| 6.6 | 39.6 | GO:0035469 | determination of pancreatic left/right asymmetry(GO:0035469) |
| 6.4 | 19.2 | GO:0043012 | regulation of fusion of sperm to egg plasma membrane(GO:0043012) |
| 6.4 | 31.8 | GO:1901628 | positive regulation of postsynaptic membrane organization(GO:1901628) |
| 6.4 | 25.5 | GO:0033159 | negative regulation of protein import into nucleus, translocation(GO:0033159) |
| 6.4 | 19.1 | GO:1902490 | regulation of sperm capacitation(GO:1902490) |
| 6.3 | 25.3 | GO:0019074 | viral genome packaging(GO:0019072) viral RNA genome packaging(GO:0019074) |
| 6.3 | 69.3 | GO:2000427 | positive regulation of apoptotic cell clearance(GO:2000427) |
| 6.2 | 118.3 | GO:0006646 | phosphatidylethanolamine biosynthetic process(GO:0006646) |
| 6.2 | 18.6 | GO:0071848 | regulation of fever generation by regulation of prostaglandin secretion(GO:0071810) positive regulation of fever generation by positive regulation of prostaglandin secretion(GO:0071812) positive regulation of ERK1 and ERK2 cascade via TNFSF11-mediated signaling(GO:0071848) regulation of fever generation by prostaglandin secretion(GO:0100009) |
| 6.2 | 24.6 | GO:1901339 | regulation of store-operated calcium channel activity(GO:1901339) |
| 6.1 | 24.4 | GO:1902530 | regulation of protein linear polyubiquitination(GO:1902528) positive regulation of protein linear polyubiquitination(GO:1902530) |
| 6.1 | 18.3 | GO:1904933 | regulation of cell proliferation in midbrain(GO:1904933) |
| 6.0 | 18.1 | GO:0009447 | putrescine catabolic process(GO:0009447) |
| 6.0 | 60.2 | GO:0097647 | calcitonin family receptor signaling pathway(GO:0097646) amylin receptor signaling pathway(GO:0097647) |
| 6.0 | 18.0 | GO:0014873 | response to muscle activity involved in regulation of muscle adaptation(GO:0014873) |
| 6.0 | 23.9 | GO:0021966 | corticospinal neuron axon guidance(GO:0021966) |
| 6.0 | 6.0 | GO:1904502 | regulation of lipophagy(GO:1904502) positive regulation of lipophagy(GO:1904504) |
| 5.9 | 29.6 | GO:0006041 | glucosamine metabolic process(GO:0006041) |
| 5.9 | 29.5 | GO:0001555 | oocyte growth(GO:0001555) |
| 5.9 | 17.6 | GO:1903892 | negative regulation of ATF6-mediated unfolded protein response(GO:1903892) |
| 5.9 | 17.6 | GO:0018094 | protein polyglycylation(GO:0018094) |
| 5.7 | 11.5 | GO:0002438 | acute inflammatory response to antigenic stimulus(GO:0002438) |
| 5.7 | 56.8 | GO:0001766 | membrane raft polarization(GO:0001766) membrane raft distribution(GO:0031580) |
| 5.7 | 17.0 | GO:0035720 | intraciliary anterograde transport(GO:0035720) |
| 5.6 | 16.8 | GO:1990918 | meiotic DNA double-strand break processing(GO:0000706) double-strand break repair involved in meiotic recombination(GO:1990918) |
| 5.6 | 27.9 | GO:0061364 | apoptotic process involved in luteolysis(GO:0061364) |
| 5.6 | 39.0 | GO:0017196 | N-terminal peptidyl-methionine acetylation(GO:0017196) |
| 5.6 | 44.4 | GO:2000467 | positive regulation of glycogen (starch) synthase activity(GO:2000467) |
| 5.5 | 16.6 | GO:1901899 | positive regulation of relaxation of cardiac muscle(GO:1901899) |
| 5.4 | 5.4 | GO:0036151 | phosphatidylcholine acyl-chain remodeling(GO:0036151) |
| 5.4 | 21.6 | GO:0032972 | regulation of muscle filament sliding speed(GO:0032972) |
| 5.4 | 37.7 | GO:0060770 | negative regulation of epithelial cell proliferation involved in prostate gland development(GO:0060770) |
| 5.4 | 10.8 | GO:0097623 | potassium ion export(GO:0071435) potassium ion export across plasma membrane(GO:0097623) |
| 5.4 | 21.5 | GO:0035633 | maintenance of blood-brain barrier(GO:0035633) |
| 5.4 | 26.8 | GO:0060718 | chorionic trophoblast cell differentiation(GO:0060718) |
| 5.3 | 21.3 | GO:2000569 | T-helper 2 cell activation(GO:0035712) regulation of T-helper 2 cell activation(GO:2000569) positive regulation of T-helper 2 cell activation(GO:2000570) |
| 5.3 | 31.8 | GO:0048318 | axial mesoderm development(GO:0048318) |
| 5.3 | 10.6 | GO:2000195 | negative regulation of female gonad development(GO:2000195) |
| 5.3 | 31.7 | GO:0030644 | cellular chloride ion homeostasis(GO:0030644) |
| 5.3 | 15.8 | GO:0009720 | detection of hormone stimulus(GO:0009720) |
| 5.2 | 20.9 | GO:0099558 | maintenance of synapse structure(GO:0099558) |
| 5.2 | 15.6 | GO:0045360 | regulation of interleukin-1 biosynthetic process(GO:0045360) positive regulation of interleukin-1 biosynthetic process(GO:0045362) interleukin-1 beta biosynthetic process(GO:0050720) |
| 5.2 | 15.5 | GO:0030886 | negative regulation of myeloid dendritic cell activation(GO:0030886) |
| 5.1 | 15.4 | GO:0035691 | macrophage migration inhibitory factor signaling pathway(GO:0035691) |
| 5.1 | 15.2 | GO:0030241 | skeletal muscle myosin thick filament assembly(GO:0030241) |
| 5.1 | 5.1 | GO:0071868 | cellular response to monoamine stimulus(GO:0071868) cellular response to catecholamine stimulus(GO:0071870) |
| 5.0 | 14.9 | GO:0032811 | negative regulation of epinephrine secretion(GO:0032811) |
| 4.9 | 83.9 | GO:0090360 | platelet-derived growth factor production(GO:0090360) regulation of platelet-derived growth factor production(GO:0090361) |
| 4.8 | 24.2 | GO:0045409 | negative regulation of interleukin-6 biosynthetic process(GO:0045409) |
| 4.8 | 4.8 | GO:0075071 | autophagy of host cells involved in interaction with symbiont(GO:0075044) autophagy involved in symbiotic interaction(GO:0075071) |
| 4.8 | 4.8 | GO:0023021 | termination of signal transduction(GO:0023021) |
| 4.8 | 4.8 | GO:0060385 | axonogenesis involved in innervation(GO:0060385) |
| 4.7 | 18.9 | GO:0010157 | response to chlorate(GO:0010157) |
| 4.7 | 18.9 | GO:1903631 | regulation of calcium-dependent ATPase activity(GO:1903610) negative regulation of calcium-dependent ATPase activity(GO:1903611) regulation of dUTP diphosphatase activity(GO:1903627) positive regulation of dUTP diphosphatase activity(GO:1903629) negative regulation of aminoacyl-tRNA ligase activity(GO:1903631) regulation of leucine-tRNA ligase activity(GO:1903633) negative regulation of leucine-tRNA ligase activity(GO:1903634) |
| 4.7 | 23.6 | GO:0032525 | somite rostral/caudal axis specification(GO:0032525) |
| 4.7 | 165.4 | GO:0045187 | regulation of circadian sleep/wake cycle, sleep(GO:0045187) |
| 4.7 | 14.1 | GO:1904430 | negative regulation of t-circle formation(GO:1904430) |
| 4.6 | 18.5 | GO:0072134 | nephrogenic mesenchyme morphogenesis(GO:0072134) |
| 4.6 | 23.1 | GO:0002904 | positive regulation of B cell apoptotic process(GO:0002904) |
| 4.6 | 18.4 | GO:0051866 | general adaptation syndrome(GO:0051866) |
| 4.5 | 86.2 | GO:0015671 | gas transport(GO:0015669) oxygen transport(GO:0015671) |
| 4.5 | 63.3 | GO:0043117 | positive regulation of vascular permeability(GO:0043117) |
| 4.5 | 13.5 | GO:0031959 | mineralocorticoid receptor signaling pathway(GO:0031959) |
| 4.5 | 13.5 | GO:0097032 | respiratory chain complex II assembly(GO:0034552) mitochondrial respiratory chain complex II assembly(GO:0034553) mitochondrial respiratory chain complex II biogenesis(GO:0097032) |
| 4.5 | 13.5 | GO:0072237 | metanephric proximal tubule development(GO:0072237) |
| 4.4 | 26.6 | GO:0032383 | regulation of intracellular lipid transport(GO:0032377) regulation of intracellular sterol transport(GO:0032380) regulation of intracellular cholesterol transport(GO:0032383) |
| 4.4 | 13.2 | GO:0086047 | membrane depolarization during Purkinje myocyte cell action potential(GO:0086047) |
| 4.4 | 13.2 | GO:0033861 | negative regulation of NAD(P)H oxidase activity(GO:0033861) |
| 4.4 | 21.8 | GO:2001181 | positive regulation of interleukin-10 secretion(GO:2001181) |
| 4.3 | 26.1 | GO:0051138 | positive regulation of NK T cell differentiation(GO:0051138) |
| 4.3 | 26.0 | GO:0006287 | base-excision repair, gap-filling(GO:0006287) |
| 4.3 | 4.3 | GO:0031335 | regulation of sulfur amino acid metabolic process(GO:0031335) regulation of homocysteine metabolic process(GO:0050666) |
| 4.3 | 26.0 | GO:0021523 | somatic motor neuron differentiation(GO:0021523) |
| 4.3 | 17.1 | GO:0009137 | purine nucleoside diphosphate catabolic process(GO:0009137) purine ribonucleoside diphosphate catabolic process(GO:0009181) |
| 4.3 | 34.2 | GO:0060267 | positive regulation of respiratory burst(GO:0060267) |
| 4.3 | 12.8 | GO:0070105 | positive regulation of interleukin-6-mediated signaling pathway(GO:0070105) |
| 4.3 | 34.1 | GO:0046604 | positive regulation of mitotic centrosome separation(GO:0046604) |
| 4.3 | 46.8 | GO:0043152 | induction of bacterial agglutination(GO:0043152) |
| 4.2 | 12.7 | GO:0061698 | protein demalonylation(GO:0036046) peptidyl-lysine demalonylation(GO:0036047) protein desuccinylation(GO:0036048) peptidyl-lysine desuccinylation(GO:0036049) protein deglutarylation(GO:0061698) peptidyl-lysine deglutarylation(GO:0061699) |
| 4.2 | 46.5 | GO:0036155 | acylglycerol acyl-chain remodeling(GO:0036155) |
| 4.2 | 16.9 | GO:0007089 | traversing start control point of mitotic cell cycle(GO:0007089) |
| 4.2 | 12.6 | GO:0019075 | virus maturation(GO:0019075) |
| 4.2 | 16.8 | GO:2000297 | negative regulation of synapse maturation(GO:2000297) |
| 4.2 | 8.4 | GO:0070945 | neutrophil mediated killing of gram-negative bacterium(GO:0070945) |
| 4.2 | 25.0 | GO:0014827 | intestine smooth muscle contraction(GO:0014827) |
| 4.1 | 12.4 | GO:0038193 | thromboxane A2 signaling pathway(GO:0038193) |
| 4.1 | 4.1 | GO:0072014 | proximal tubule development(GO:0072014) |
| 4.1 | 24.6 | GO:1900736 | regulation of phospholipase C-activating G-protein coupled receptor signaling pathway(GO:1900736) |
| 4.1 | 24.5 | GO:0071105 | response to interleukin-11(GO:0071105) |
| 4.0 | 4.0 | GO:0035801 | adrenal cortex development(GO:0035801) adrenal cortex formation(GO:0035802) |
| 4.0 | 20.0 | GO:0072262 | metanephric glomerular mesangial cell proliferation involved in metanephros development(GO:0072262) |
| 4.0 | 15.9 | GO:0006669 | sphinganine-1-phosphate biosynthetic process(GO:0006669) |
| 4.0 | 8.0 | GO:0048341 | paraxial mesoderm formation(GO:0048341) |
| 4.0 | 35.9 | GO:0006346 | methylation-dependent chromatin silencing(GO:0006346) |
| 4.0 | 4.0 | GO:2000463 | positive regulation of excitatory postsynaptic potential(GO:2000463) |
| 4.0 | 15.9 | GO:0030821 | negative regulation of cyclic nucleotide catabolic process(GO:0030806) negative regulation of cAMP catabolic process(GO:0030821) |
| 4.0 | 11.9 | GO:0001300 | chronological cell aging(GO:0001300) |
| 3.9 | 3.9 | GO:0038003 | opioid receptor signaling pathway(GO:0038003) |
| 3.9 | 78.8 | GO:0018345 | protein palmitoylation(GO:0018345) |
| 3.9 | 11.8 | GO:1902595 | regulation of DNA replication origin binding(GO:1902595) |
| 3.9 | 15.6 | GO:0071110 | protein biotinylation(GO:0009305) histone biotinylation(GO:0071110) |
| 3.9 | 27.1 | GO:1902075 | cellular response to salt(GO:1902075) |
| 3.9 | 42.4 | GO:0048251 | elastic fiber assembly(GO:0048251) |
| 3.8 | 19.2 | GO:0010814 | substance P catabolic process(GO:0010814) calcitonin catabolic process(GO:0010816) endothelin maturation(GO:0034959) |
| 3.8 | 7.7 | GO:0046208 | spermine catabolic process(GO:0046208) |
| 3.8 | 23.0 | GO:0000189 | MAPK import into nucleus(GO:0000189) |
| 3.8 | 7.7 | GO:0019470 | 4-hydroxyproline catabolic process(GO:0019470) |
| 3.8 | 11.5 | GO:0070625 | zymogen granule exocytosis(GO:0070625) |
| 3.8 | 64.6 | GO:0030854 | positive regulation of granulocyte differentiation(GO:0030854) |
| 3.8 | 3.8 | GO:1903939 | regulation of TORC2 signaling(GO:1903939) |
| 3.8 | 34.0 | GO:1902856 | negative regulation of nonmotile primary cilium assembly(GO:1902856) |
| 3.8 | 3.8 | GO:2000860 | positive regulation of mineralocorticoid secretion(GO:2000857) positive regulation of aldosterone secretion(GO:2000860) |
| 3.7 | 29.9 | GO:0006384 | transcription initiation from RNA polymerase III promoter(GO:0006384) |
| 3.7 | 3.7 | GO:0046642 | negative regulation of alpha-beta T cell proliferation(GO:0046642) |
| 3.7 | 3.7 | GO:1903588 | negative regulation of blood vessel endothelial cell proliferation involved in sprouting angiogenesis(GO:1903588) |
| 3.7 | 3.7 | GO:2000848 | positive regulation of corticosteroid hormone secretion(GO:2000848) |
| 3.7 | 22.2 | GO:0010936 | negative regulation of macrophage cytokine production(GO:0010936) |
| 3.7 | 3.7 | GO:0001794 | type IIa hypersensitivity(GO:0001794) regulation of type IIa hypersensitivity(GO:0001796) type II hypersensitivity(GO:0002445) regulation of type II hypersensitivity(GO:0002892) |
| 3.7 | 7.4 | GO:0071284 | cellular response to lead ion(GO:0071284) |
| 3.7 | 33.1 | GO:0033578 | protein glycosylation in Golgi(GO:0033578) |
| 3.7 | 18.3 | GO:0051415 | interphase microtubule nucleation by interphase microtubule organizing center(GO:0051415) microtubule nucleation by microtubule organizing center(GO:0051418) |
| 3.7 | 7.3 | GO:0031937 | positive regulation of chromatin silencing(GO:0031937) |
| 3.6 | 7.3 | GO:1901624 | negative regulation of lymphocyte chemotaxis(GO:1901624) |
| 3.6 | 18.1 | GO:0002792 | negative regulation of peptide secretion(GO:0002792) negative regulation of peptide hormone secretion(GO:0090278) |
| 3.6 | 14.4 | GO:0021759 | globus pallidus development(GO:0021759) |
| 3.6 | 14.4 | GO:1904450 | negative regulation of gamma-aminobutyric acid secretion(GO:0014053) aspartate secretion(GO:0061528) regulation of aspartate secretion(GO:1904448) positive regulation of aspartate secretion(GO:1904450) |
| 3.6 | 21.5 | GO:0035063 | nuclear speck organization(GO:0035063) |
| 3.6 | 3.6 | GO:0008355 | olfactory learning(GO:0008355) |
| 3.5 | 31.8 | GO:0097012 | cellular response to granulocyte macrophage colony-stimulating factor stimulus(GO:0097011) response to granulocyte macrophage colony-stimulating factor(GO:0097012) |
| 3.5 | 14.1 | GO:0097676 | histone H3-K36 dimethylation(GO:0097676) |
| 3.5 | 21.2 | GO:0035617 | stress granule disassembly(GO:0035617) |
| 3.5 | 10.5 | GO:0071529 | cementum mineralization(GO:0071529) |
| 3.5 | 17.5 | GO:0002118 | aggressive behavior(GO:0002118) |
| 3.5 | 21.0 | GO:2000418 | positive regulation of eosinophil migration(GO:2000418) |
| 3.5 | 24.5 | GO:0090210 | regulation of establishment of blood-brain barrier(GO:0090210) |
| 3.5 | 13.9 | GO:0033693 | neurofilament bundle assembly(GO:0033693) |
| 3.5 | 17.3 | GO:0038169 | somatostatin receptor signaling pathway(GO:0038169) somatostatin signaling pathway(GO:0038170) |
| 3.5 | 17.3 | GO:0033603 | positive regulation of dopamine secretion(GO:0033603) |
| 3.5 | 34.6 | GO:0043249 | erythrocyte maturation(GO:0043249) |
| 3.4 | 34.5 | GO:1901538 | DNA methylation involved in embryo development(GO:0043045) changes to DNA methylation involved in embryo development(GO:1901538) |
| 3.4 | 13.7 | GO:0035284 | rhombomere 5 development(GO:0021571) central nervous system segmentation(GO:0035283) brain segmentation(GO:0035284) |
| 3.4 | 6.9 | GO:1902746 | regulation of lens fiber cell differentiation(GO:1902746) |
| 3.4 | 10.3 | GO:0061590 | calcium activated phospholipid scrambling(GO:0061588) calcium activated phosphatidylcholine scrambling(GO:0061590) calcium activated galactosylceramide scrambling(GO:0061591) |
| 3.4 | 27.4 | GO:0086036 | regulation of cardiac muscle cell membrane potential(GO:0086036) |
| 3.4 | 6.9 | GO:2001166 | regulation of histone H2B ubiquitination(GO:2001166) positive regulation of histone H2B ubiquitination(GO:2001168) |
| 3.4 | 6.8 | GO:1905073 | occluding junction disassembly(GO:1905071) regulation of occluding junction disassembly(GO:1905073) positive regulation of occluding junction disassembly(GO:1905075) |
| 3.4 | 44.3 | GO:0033617 | mitochondrial respiratory chain complex IV assembly(GO:0033617) |
| 3.4 | 3.4 | GO:0034146 | toll-like receptor 5 signaling pathway(GO:0034146) |
| 3.4 | 13.6 | GO:1900454 | positive regulation of long term synaptic depression(GO:1900454) |
| 3.4 | 16.9 | GO:0015793 | glycerol transport(GO:0015793) |
| 3.4 | 10.1 | GO:0071494 | cellular response to UV-C(GO:0071494) |
| 3.4 | 13.4 | GO:1990502 | dense core granule maturation(GO:1990502) |
| 3.4 | 33.5 | GO:2000766 | negative regulation of cytoplasmic translation(GO:2000766) |
| 3.3 | 10.0 | GO:0016322 | neuron remodeling(GO:0016322) |
| 3.3 | 60.2 | GO:0051823 | regulation of synapse structural plasticity(GO:0051823) |
| 3.3 | 10.0 | GO:0003011 | involuntary skeletal muscle contraction(GO:0003011) |
| 3.3 | 13.3 | GO:1900169 | regulation of glucocorticoid mediated signaling pathway(GO:1900169) |
| 3.3 | 9.9 | GO:0070077 | peptidyl-lysine hydroxylation to 5-hydroxy-L-lysine(GO:0018395) histone arginine demethylation(GO:0070077) histone H3-R2 demethylation(GO:0070078) histone H4-R3 demethylation(GO:0070079) |
| 3.3 | 3.3 | GO:1900104 | hyaluranon cable assembly(GO:0036118) regulation of hyaluranon cable assembly(GO:1900104) positive regulation of hyaluranon cable assembly(GO:1900106) |
| 3.3 | 6.6 | GO:0060528 | secretory columnal luminar epithelial cell differentiation involved in prostate glandular acinus development(GO:0060528) |
| 3.3 | 39.6 | GO:1990118 | sodium ion import across plasma membrane(GO:0098719) sodium ion import into cell(GO:1990118) |
| 3.3 | 6.6 | GO:0044828 | negative regulation by host of viral genome replication(GO:0044828) |
| 3.3 | 13.1 | GO:0021965 | spinal cord ventral commissure morphogenesis(GO:0021965) |
| 3.3 | 3.3 | GO:1902232 | regulation of positive thymic T cell selection(GO:1902232) |
| 3.3 | 39.1 | GO:0048712 | negative regulation of astrocyte differentiation(GO:0048712) |
| 3.3 | 13.0 | GO:0071418 | cellular response to amine stimulus(GO:0071418) |
| 3.2 | 9.7 | GO:0060152 | peroxisome localization(GO:0060151) microtubule-based peroxisome localization(GO:0060152) |
| 3.2 | 9.7 | GO:0002625 | regulation of T cell antigen processing and presentation(GO:0002625) |
| 3.2 | 9.7 | GO:1904899 | regulation of hepatic stellate cell proliferation(GO:1904897) positive regulation of hepatic stellate cell proliferation(GO:1904899) hepatic stellate cell proliferation(GO:1990922) |
| 3.2 | 3.2 | GO:0036022 | limb joint morphogenesis(GO:0036022) embryonic skeletal limb joint morphogenesis(GO:0036023) |
| 3.2 | 6.4 | GO:0016999 | antibiotic metabolic process(GO:0016999) |
| 3.2 | 9.6 | GO:0036166 | phenotypic switching(GO:0036166) regulation of phenotypic switching(GO:1900239) |
| 3.2 | 12.8 | GO:0002357 | defense response to tumor cell(GO:0002357) |
| 3.2 | 9.5 | GO:0006531 | aspartate metabolic process(GO:0006531) |
| 3.2 | 15.8 | GO:2000346 | negative regulation of hepatocyte proliferation(GO:2000346) |
| 3.2 | 22.1 | GO:0060684 | epithelial-mesenchymal cell signaling(GO:0060684) |
| 3.1 | 18.8 | GO:0001826 | inner cell mass cell differentiation(GO:0001826) |
| 3.1 | 6.3 | GO:0042574 | retinal metabolic process(GO:0042574) |
| 3.1 | 18.7 | GO:0032097 | positive regulation of response to food(GO:0032097) positive regulation of appetite(GO:0032100) |
| 3.1 | 9.3 | GO:0046271 | phenylpropanoid catabolic process(GO:0046271) |
| 3.1 | 18.6 | GO:0046092 | deoxycytidine metabolic process(GO:0046092) |
| 3.1 | 12.4 | GO:0030950 | establishment or maintenance of actin cytoskeleton polarity(GO:0030950) |
| 3.1 | 3.1 | GO:1901165 | positive regulation of trophoblast cell migration(GO:1901165) |
| 3.1 | 27.9 | GO:0090037 | positive regulation of protein kinase C signaling(GO:0090037) |
| 3.1 | 15.4 | GO:0008063 | Toll signaling pathway(GO:0008063) |
| 3.1 | 86.0 | GO:0032011 | ARF protein signal transduction(GO:0032011) |
| 3.1 | 3.1 | GO:0060374 | mast cell differentiation(GO:0060374) |
| 3.1 | 12.2 | GO:0019355 | nicotinamide nucleotide biosynthetic process from aspartate(GO:0019355) 'de novo' NAD biosynthetic process(GO:0034627) 'de novo' NAD biosynthetic process from aspartate(GO:0034628) |
| 3.1 | 9.2 | GO:0003358 | noradrenergic neuron development(GO:0003358) |
| 3.1 | 9.2 | GO:0045906 | negative regulation of vasoconstriction(GO:0045906) |
| 3.0 | 24.3 | GO:0015747 | urate transport(GO:0015747) |
| 3.0 | 3.0 | GO:1904996 | positive regulation of leukocyte adhesion to vascular endothelial cell(GO:1904996) |
| 3.0 | 9.1 | GO:0014887 | muscle hypertrophy in response to stress(GO:0003299) cardiac muscle adaptation(GO:0014887) cardiac muscle hypertrophy in response to stress(GO:0014898) |
| 3.0 | 9.1 | GO:0070846 | misfolded protein transport(GO:0070843) polyubiquitinated protein transport(GO:0070844) polyubiquitinated misfolded protein transport(GO:0070845) Hsp90 deacetylation(GO:0070846) |
| 3.0 | 6.0 | GO:1902174 | positive regulation of keratinocyte apoptotic process(GO:1902174) |
| 3.0 | 51.2 | GO:2001135 | regulation of endocytic recycling(GO:2001135) |
| 3.0 | 3.0 | GO:2000777 | positive regulation of proteasomal ubiquitin-dependent protein catabolic process involved in cellular response to hypoxia(GO:2000777) |
| 3.0 | 3.0 | GO:0090091 | positive regulation of extracellular matrix disassembly(GO:0090091) |
| 3.0 | 17.9 | GO:0006651 | diacylglycerol biosynthetic process(GO:0006651) |
| 3.0 | 89.6 | GO:0045494 | photoreceptor cell maintenance(GO:0045494) |
| 3.0 | 6.0 | GO:2000410 | tolerance induction dependent upon immune response(GO:0002461) regulation of thymocyte migration(GO:2000410) |
| 3.0 | 9.0 | GO:0048073 | regulation of eye pigmentation(GO:0048073) |
| 3.0 | 6.0 | GO:1900186 | negative regulation of clathrin-mediated endocytosis(GO:1900186) |
| 3.0 | 47.6 | GO:0007130 | synaptonemal complex assembly(GO:0007130) |
| 3.0 | 14.9 | GO:0030259 | lipid glycosylation(GO:0030259) |
| 2.9 | 8.8 | GO:0042137 | sequestering of neurotransmitter(GO:0042137) |
| 2.9 | 2.9 | GO:0044333 | Wnt signaling pathway involved in digestive tract morphogenesis(GO:0044333) |
| 2.9 | 5.9 | GO:1903116 | positive regulation of actin filament-based movement(GO:1903116) |
| 2.9 | 190.0 | GO:0006910 | phagocytosis, recognition(GO:0006910) |
| 2.9 | 8.8 | GO:0050760 | negative regulation of thymidylate synthase biosynthetic process(GO:0050760) |
| 2.9 | 26.3 | GO:1904779 | regulation of protein localization to centrosome(GO:1904779) |
| 2.9 | 17.3 | GO:0071313 | cellular response to caffeine(GO:0071313) |
| 2.9 | 5.8 | GO:0005989 | lactose metabolic process(GO:0005988) lactose biosynthetic process(GO:0005989) |
| 2.9 | 37.4 | GO:2001199 | negative regulation of dendritic cell differentiation(GO:2001199) |
| 2.9 | 11.5 | GO:0097411 | hypoxia-inducible factor-1alpha signaling pathway(GO:0097411) |
| 2.9 | 54.4 | GO:0060044 | negative regulation of cardiac muscle cell proliferation(GO:0060044) |
| 2.9 | 34.3 | GO:1900112 | regulation of histone H3-K9 trimethylation(GO:1900112) |
| 2.9 | 8.6 | GO:1900220 | semaphorin-plexin signaling pathway involved in bone trabecula morphogenesis(GO:1900220) |
| 2.9 | 119.9 | GO:0048791 | calcium ion-regulated exocytosis of neurotransmitter(GO:0048791) |
| 2.8 | 8.5 | GO:1902303 | negative regulation of potassium ion export(GO:1902303) |
| 2.8 | 2.8 | GO:0010739 | positive regulation of protein kinase A signaling(GO:0010739) |
| 2.8 | 17.0 | GO:2001023 | regulation of response to drug(GO:2001023) |
| 2.8 | 25.5 | GO:0042904 | 9-cis-retinoic acid biosynthetic process(GO:0042904) 9-cis-retinoic acid metabolic process(GO:0042905) |
| 2.8 | 2.8 | GO:0014063 | negative regulation of serotonin secretion(GO:0014063) |
| 2.8 | 14.0 | GO:2000676 | positive regulation of type B pancreatic cell apoptotic process(GO:2000676) |
| 2.8 | 14.0 | GO:0016560 | protein import into peroxisome matrix, docking(GO:0016560) |
| 2.8 | 2.8 | GO:2000182 | regulation of progesterone biosynthetic process(GO:2000182) |
| 2.8 | 83.7 | GO:0097503 | sialylation(GO:0097503) |
| 2.8 | 8.3 | GO:0002913 | positive regulation of T cell anergy(GO:0002669) positive regulation of lymphocyte anergy(GO:0002913) |
| 2.8 | 11.0 | GO:0098735 | positive regulation of the force of heart contraction(GO:0098735) |
| 2.8 | 11.0 | GO:1902018 | negative regulation of cilium assembly(GO:1902018) |
| 2.7 | 16.2 | GO:0090245 | axis elongation involved in somitogenesis(GO:0090245) |
| 2.7 | 37.5 | GO:0003351 | epithelial cilium movement(GO:0003351) |
| 2.7 | 16.0 | GO:0051918 | negative regulation of fibrinolysis(GO:0051918) |
| 2.7 | 128.2 | GO:0007214 | gamma-aminobutyric acid signaling pathway(GO:0007214) |
| 2.7 | 5.3 | GO:0048104 | establishment of body hair or bristle planar orientation(GO:0048104) establishment of body hair planar orientation(GO:0048105) |
| 2.7 | 13.3 | GO:1903238 | positive regulation of leukocyte tethering or rolling(GO:1903238) |
| 2.7 | 2.7 | GO:0010002 | cardioblast differentiation(GO:0010002) |
| 2.7 | 2.7 | GO:0002590 | regulation of antigen processing and presentation of peptide antigen via MHC class I(GO:0002589) negative regulation of antigen processing and presentation of peptide antigen via MHC class I(GO:0002590) |
| 2.7 | 77.0 | GO:0035428 | hexose transmembrane transport(GO:0035428) glucose transmembrane transport(GO:1904659) |
| 2.7 | 5.3 | GO:0032849 | positive regulation of cellular pH reduction(GO:0032849) |
| 2.7 | 8.0 | GO:0016256 | N-glycan processing to lysosome(GO:0016256) |
| 2.6 | 5.3 | GO:0002884 | negative regulation of hypersensitivity(GO:0002884) |
| 2.6 | 7.9 | GO:0044565 | dendritic cell proliferation(GO:0044565) |
| 2.6 | 13.1 | GO:0014050 | negative regulation of glutamate secretion(GO:0014050) |
| 2.6 | 2.6 | GO:0043589 | skin morphogenesis(GO:0043589) |
| 2.6 | 18.4 | GO:0048680 | positive regulation of axon regeneration(GO:0048680) |
| 2.6 | 28.9 | GO:0030322 | stabilization of membrane potential(GO:0030322) |
| 2.6 | 26.2 | GO:0036066 | protein O-linked fucosylation(GO:0036066) |
| 2.6 | 7.8 | GO:0070278 | extracellular matrix constituent secretion(GO:0070278) |
| 2.6 | 2.6 | GO:0032416 | negative regulation of sodium:proton antiporter activity(GO:0032416) |
| 2.6 | 2.6 | GO:0014744 | positive regulation of cardiac muscle adaptation(GO:0010615) positive regulation of muscle adaptation(GO:0014744) positive regulation of cardiac muscle hypertrophy in response to stress(GO:1903244) |
| 2.6 | 7.8 | GO:0006114 | glycerol biosynthetic process(GO:0006114) |
| 2.6 | 10.4 | GO:0060454 | positive regulation of gastric acid secretion(GO:0060454) |
| 2.6 | 10.4 | GO:2000773 | negative regulation of cellular senescence(GO:2000773) |
| 2.6 | 7.7 | GO:2000661 | positive regulation of interleukin-1-mediated signaling pathway(GO:2000661) |
| 2.6 | 12.9 | GO:0033504 | floor plate development(GO:0033504) |
| 2.6 | 5.1 | GO:0090238 | positive regulation of arachidonic acid secretion(GO:0090238) |
| 2.6 | 5.1 | GO:0045626 | negative regulation of T-helper 1 cell differentiation(GO:0045626) |
| 2.6 | 7.7 | GO:0070317 | negative regulation of G0 to G1 transition(GO:0070317) |
| 2.5 | 2.5 | GO:1901491 | negative regulation of lymphangiogenesis(GO:1901491) |
| 2.5 | 25.4 | GO:0001955 | blood vessel maturation(GO:0001955) |
| 2.5 | 7.6 | GO:0070407 | oxidation-dependent protein catabolic process(GO:0070407) |
| 2.5 | 7.6 | GO:0033364 | mast cell secretory granule organization(GO:0033364) |
| 2.5 | 12.6 | GO:0034124 | regulation of MyD88-dependent toll-like receptor signaling pathway(GO:0034124) |
| 2.5 | 7.6 | GO:0006864 | pyrimidine nucleotide transport(GO:0006864) mitochondrial pyrimidine nucleotide import(GO:1990519) |
| 2.5 | 15.1 | GO:0045023 | G0 to G1 transition(GO:0045023) |
| 2.5 | 2.5 | GO:0003218 | cardiac left ventricle formation(GO:0003218) |
| 2.5 | 7.5 | GO:0019557 | histidine catabolic process to glutamate and formamide(GO:0019556) histidine catabolic process to glutamate and formate(GO:0019557) formamide metabolic process(GO:0043606) |
| 2.5 | 10.0 | GO:0050902 | leukocyte adhesive activation(GO:0050902) |
| 2.5 | 5.0 | GO:2000118 | regulation of sodium-dependent phosphate transport(GO:2000118) |
| 2.5 | 22.5 | GO:0070166 | enamel mineralization(GO:0070166) |
| 2.5 | 7.5 | GO:0002540 | arachidonic acid metabolite production involved in inflammatory response(GO:0002538) leukotriene production involved in inflammatory response(GO:0002540) |
| 2.5 | 7.5 | GO:0002645 | positive regulation of tolerance induction(GO:0002645) |
| 2.5 | 14.9 | GO:0006543 | glutamine catabolic process(GO:0006543) |
| 2.5 | 7.4 | GO:0051365 | cellular response to potassium ion starvation(GO:0051365) |
| 2.5 | 7.4 | GO:0060081 | membrane hyperpolarization(GO:0060081) |
| 2.5 | 7.4 | GO:0060024 | rhythmic synaptic transmission(GO:0060024) |
| 2.5 | 39.5 | GO:0070208 | protein heterotrimerization(GO:0070208) |
| 2.5 | 14.8 | GO:1903960 | negative regulation of anion transmembrane transport(GO:1903960) |
| 2.5 | 34.4 | GO:0060219 | camera-type eye photoreceptor cell differentiation(GO:0060219) |
| 2.5 | 7.4 | GO:0099526 | presynaptic signal transduction(GO:0098928) presynapse to nucleus signaling pathway(GO:0099526) |
| 2.4 | 17.1 | GO:1904100 | regulation of protein O-linked glycosylation(GO:1904098) positive regulation of protein O-linked glycosylation(GO:1904100) |
| 2.4 | 7.3 | GO:1903984 | positive regulation of TRAIL-activated apoptotic signaling pathway(GO:1903984) |
| 2.4 | 9.7 | GO:0033152 | immunoglobulin V(D)J recombination(GO:0033152) |
| 2.4 | 31.7 | GO:0090168 | Golgi reassembly(GO:0090168) |
| 2.4 | 7.3 | GO:0048250 | mitochondrial iron ion transport(GO:0048250) |
| 2.4 | 29.1 | GO:1901386 | negative regulation of voltage-gated calcium channel activity(GO:1901386) |
| 2.4 | 12.1 | GO:0061762 | CAMKK-AMPK signaling cascade(GO:0061762) |
| 2.4 | 12.1 | GO:0046618 | drug export(GO:0046618) |
| 2.4 | 2.4 | GO:1902837 | amino acid import into cell(GO:1902837) |
| 2.4 | 43.4 | GO:0048490 | anterograde synaptic vesicle transport(GO:0048490) synaptic vesicle cytoskeletal transport(GO:0099514) synaptic vesicle transport along microtubule(GO:0099517) |
| 2.4 | 7.2 | GO:1990168 | protein K33-linked deubiquitination(GO:1990168) |
| 2.4 | 33.6 | GO:0018027 | peptidyl-lysine dimethylation(GO:0018027) |
| 2.4 | 4.8 | GO:0046110 | xanthine metabolic process(GO:0046110) |
| 2.4 | 7.2 | GO:0038156 | interleukin-3-mediated signaling pathway(GO:0038156) |
| 2.4 | 7.2 | GO:0051410 | detoxification of nitrogen compound(GO:0051410) cellular detoxification of nitrogen compound(GO:0070458) |
| 2.4 | 9.5 | GO:0071233 | cellular response to leucine(GO:0071233) |
| 2.4 | 2.4 | GO:0061092 | regulation of phospholipid translocation(GO:0061091) positive regulation of phospholipid translocation(GO:0061092) |
| 2.4 | 7.1 | GO:0036414 | protein citrullination(GO:0018101) histone citrullination(GO:0036414) |
| 2.4 | 14.2 | GO:0051121 | hepoxilin metabolic process(GO:0051121) hepoxilin biosynthetic process(GO:0051122) |
| 2.4 | 2.4 | GO:0031000 | response to caffeine(GO:0031000) |
| 2.4 | 7.1 | GO:0034085 | establishment of sister chromatid cohesion(GO:0034085) cohesin loading(GO:0071921) regulation of cohesin loading(GO:0071922) |
| 2.4 | 2.4 | GO:0045763 | negative regulation of cellular amino acid metabolic process(GO:0045763) |
| 2.4 | 7.1 | GO:1900245 | positive regulation of MDA-5 signaling pathway(GO:1900245) |
| 2.4 | 7.1 | GO:1901097 | negative regulation of autophagosome maturation(GO:1901097) |
| 2.4 | 16.5 | GO:0003190 | atrioventricular valve formation(GO:0003190) |
| 2.3 | 9.4 | GO:0060010 | Sertoli cell fate commitment(GO:0060010) |
| 2.3 | 9.4 | GO:0045671 | negative regulation of osteoclast differentiation(GO:0045671) |
| 2.3 | 30.4 | GO:0086046 | membrane depolarization during SA node cell action potential(GO:0086046) |
| 2.3 | 23.3 | GO:0046548 | retinal rod cell development(GO:0046548) |
| 2.3 | 4.7 | GO:0046337 | phosphatidylethanolamine metabolic process(GO:0046337) |
| 2.3 | 4.6 | GO:0036515 | serotonergic neuron axon guidance(GO:0036515) |
| 2.3 | 4.6 | GO:0060314 | regulation of ryanodine-sensitive calcium-release channel activity(GO:0060314) |
| 2.3 | 34.7 | GO:0003323 | type B pancreatic cell development(GO:0003323) |
| 2.3 | 4.6 | GO:0071907 | determination of digestive tract left/right asymmetry(GO:0071907) |
| 2.3 | 6.9 | GO:0016185 | synaptic vesicle budding from presynaptic endocytic zone membrane(GO:0016185) |
| 2.3 | 6.9 | GO:0021913 | regulation of transcription from RNA polymerase II promoter involved in ventral spinal cord interneuron specification(GO:0021913) |
| 2.3 | 11.4 | GO:0032902 | nerve growth factor production(GO:0032902) |
| 2.3 | 18.3 | GO:1900748 | positive regulation of vascular endothelial growth factor signaling pathway(GO:1900748) |
| 2.3 | 4.6 | GO:1904640 | response to methionine(GO:1904640) |
| 2.3 | 4.6 | GO:2000584 | regulation of platelet-derived growth factor receptor-alpha signaling pathway(GO:2000583) negative regulation of platelet-derived growth factor receptor-alpha signaling pathway(GO:2000584) |
| 2.3 | 4.6 | GO:0021779 | spinal cord oligodendrocyte cell differentiation(GO:0021529) spinal cord oligodendrocyte cell fate specification(GO:0021530) oligodendrocyte cell fate specification(GO:0021778) oligodendrocyte cell fate commitment(GO:0021779) glial cell fate specification(GO:0021780) |
| 2.3 | 22.8 | GO:0097113 | AMPA glutamate receptor clustering(GO:0097113) glutamate receptor clustering(GO:0097688) |
| 2.3 | 6.8 | GO:0072011 | glomerular endothelium development(GO:0072011) |
| 2.3 | 15.9 | GO:0034983 | peptidyl-lysine deacetylation(GO:0034983) |
| 2.3 | 11.3 | GO:0051481 | negative regulation of cytosolic calcium ion concentration(GO:0051481) |
| 2.3 | 11.3 | GO:0030309 | poly-N-acetyllactosamine metabolic process(GO:0030309) poly-N-acetyllactosamine biosynthetic process(GO:0030311) |
| 2.3 | 11.3 | GO:0090131 | mesenchyme migration(GO:0090131) |
| 2.3 | 9.0 | GO:0010836 | negative regulation of protein ADP-ribosylation(GO:0010836) |
| 2.3 | 9.0 | GO:0010430 | fatty acid omega-oxidation(GO:0010430) |
| 2.2 | 15.7 | GO:0014859 | negative regulation of skeletal muscle cell proliferation(GO:0014859) negative regulation of skeletal muscle satellite cell proliferation(GO:1902723) |
| 2.2 | 13.5 | GO:0030860 | regulation of polarized epithelial cell differentiation(GO:0030860) |
| 2.2 | 11.2 | GO:0007217 | tachykinin receptor signaling pathway(GO:0007217) |
| 2.2 | 13.4 | GO:0035524 | proline transmembrane transport(GO:0035524) |
| 2.2 | 8.9 | GO:2000370 | positive regulation of clathrin-mediated endocytosis(GO:2000370) |
| 2.2 | 4.4 | GO:1902949 | positive regulation of tau-protein kinase activity(GO:1902949) |
| 2.2 | 19.9 | GO:0048671 | negative regulation of collateral sprouting(GO:0048671) |
| 2.2 | 8.8 | GO:0051611 | negative regulation of neurotransmitter uptake(GO:0051581) serotonin uptake(GO:0051610) regulation of serotonin uptake(GO:0051611) negative regulation of serotonin uptake(GO:0051612) |
| 2.2 | 19.9 | GO:0007135 | meiosis II(GO:0007135) |
| 2.2 | 19.9 | GO:1900747 | negative regulation of vascular endothelial growth factor signaling pathway(GO:1900747) |
| 2.2 | 8.8 | GO:0009233 | menaquinone metabolic process(GO:0009233) |
| 2.2 | 4.4 | GO:0010735 | positive regulation of transcription via serum response element binding(GO:0010735) |
| 2.2 | 11.0 | GO:0015688 | iron chelate transport(GO:0015688) siderophore transport(GO:0015891) |
| 2.2 | 4.4 | GO:0071350 | interleukin-15-mediated signaling pathway(GO:0035723) cellular response to interleukin-15(GO:0071350) |
| 2.2 | 8.7 | GO:0071673 | positive regulation of smooth muscle cell chemotaxis(GO:0071673) |
| 2.2 | 24.0 | GO:0042758 | long-chain fatty acid catabolic process(GO:0042758) |
| 2.2 | 6.5 | GO:0048631 | regulation of skeletal muscle tissue growth(GO:0048631) |
| 2.2 | 2.2 | GO:0002314 | germinal center B cell differentiation(GO:0002314) |
| 2.2 | 4.3 | GO:0060040 | retinal bipolar neuron differentiation(GO:0060040) |
| 2.2 | 2.2 | GO:1903348 | positive regulation of bicellular tight junction assembly(GO:1903348) |
| 2.1 | 4.3 | GO:0030242 | pexophagy(GO:0030242) |
| 2.1 | 2.1 | GO:0021798 | forebrain dorsal/ventral pattern formation(GO:0021798) |
| 2.1 | 6.4 | GO:1901731 | positive regulation of platelet aggregation(GO:1901731) |
| 2.1 | 6.4 | GO:0072675 | multinuclear osteoclast differentiation(GO:0072674) osteoclast fusion(GO:0072675) |
| 2.1 | 17.0 | GO:0050882 | voluntary musculoskeletal movement(GO:0050882) |
| 2.1 | 4.3 | GO:0021540 | corpus callosum morphogenesis(GO:0021540) |
| 2.1 | 6.4 | GO:0090344 | negative regulation of cell aging(GO:0090344) |
| 2.1 | 12.7 | GO:0021936 | regulation of cerebellar granule cell precursor proliferation(GO:0021936) |
| 2.1 | 6.3 | GO:0006566 | threonine metabolic process(GO:0006566) |
| 2.1 | 12.7 | GO:0035672 | oligopeptide transmembrane transport(GO:0035672) |
| 2.1 | 21.1 | GO:0097091 | synaptic vesicle clustering(GO:0097091) |
| 2.1 | 20.9 | GO:2000781 | positive regulation of double-strand break repair(GO:2000781) |
| 2.1 | 14.6 | GO:0071447 | cellular response to hydroperoxide(GO:0071447) |
| 2.1 | 14.6 | GO:0051533 | positive regulation of NFAT protein import into nucleus(GO:0051533) |
| 2.1 | 12.4 | GO:0060167 | regulation of adenosine receptor signaling pathway(GO:0060167) positive regulation of adenosine receptor signaling pathway(GO:0060168) |
| 2.1 | 6.2 | GO:0006683 | galactosylceramide catabolic process(GO:0006683) |
| 2.1 | 16.5 | GO:0061709 | reticulophagy(GO:0061709) |
| 2.1 | 6.2 | GO:0090038 | negative regulation of protein kinase C signaling(GO:0090038) |
| 2.1 | 2.1 | GO:1901078 | negative regulation of relaxation of muscle(GO:1901078) |
| 2.1 | 57.6 | GO:0045746 | negative regulation of Notch signaling pathway(GO:0045746) |
| 2.1 | 2.1 | GO:0033602 | negative regulation of dopamine secretion(GO:0033602) |
| 2.0 | 6.1 | GO:0070055 | mRNA splicing via endonucleolytic cleavage and ligation involved in unfolded protein response(GO:0030969) mRNA splicing, via endonucleolytic cleavage and ligation(GO:0070054) mRNA endonucleolytic cleavage involved in unfolded protein response(GO:0070055) |
| 2.0 | 4.1 | GO:0086048 | membrane depolarization during bundle of His cell action potential(GO:0086048) |
| 2.0 | 8.2 | GO:2000667 | positive regulation of interleukin-5 secretion(GO:2000664) positive regulation of interleukin-13 secretion(GO:2000667) |
| 2.0 | 12.2 | GO:0001661 | conditioned taste aversion(GO:0001661) |
| 2.0 | 14.3 | GO:0045007 | depurination(GO:0045007) |
| 2.0 | 30.5 | GO:0060856 | establishment of blood-brain barrier(GO:0060856) |
| 2.0 | 8.1 | GO:0031999 | negative regulation of fatty acid beta-oxidation(GO:0031999) |
| 2.0 | 38.5 | GO:0006488 | dolichol-linked oligosaccharide biosynthetic process(GO:0006488) |
| 2.0 | 28.1 | GO:0002523 | leukocyte migration involved in inflammatory response(GO:0002523) |
| 2.0 | 12.0 | GO:0007207 | phospholipase C-activating G-protein coupled acetylcholine receptor signaling pathway(GO:0007207) |
| 2.0 | 12.0 | GO:0042711 | maternal behavior(GO:0042711) parental behavior(GO:0060746) |
| 2.0 | 8.0 | GO:0014724 | regulation of twitch skeletal muscle contraction(GO:0014724) |
| 2.0 | 2.0 | GO:0019532 | oxalate transport(GO:0019532) |
| 2.0 | 2.0 | GO:2000381 | negative regulation of mesoderm development(GO:2000381) |
| 2.0 | 25.9 | GO:0070445 | oligodendrocyte progenitor proliferation(GO:0070444) regulation of oligodendrocyte progenitor proliferation(GO:0070445) |
| 2.0 | 5.9 | GO:1990108 | protein linear deubiquitination(GO:1990108) |
| 2.0 | 7.9 | GO:0002328 | pro-B cell differentiation(GO:0002328) |
| 2.0 | 2.0 | GO:0060581 | ventral spinal cord interneuron specification(GO:0021521) cell fate specification involved in pattern specification(GO:0060573) ventral spinal cord interneuron fate commitment(GO:0060579) cell fate commitment involved in pattern specification(GO:0060581) |
| 2.0 | 17.8 | GO:0006568 | tryptophan metabolic process(GO:0006568) |
| 2.0 | 23.6 | GO:0032688 | negative regulation of interferon-beta production(GO:0032688) |
| 2.0 | 5.9 | GO:0071918 | urea transmembrane transport(GO:0071918) |
| 2.0 | 7.8 | GO:0046968 | peptide antigen transport(GO:0046968) |
| 2.0 | 9.8 | GO:0043552 | positive regulation of phosphatidylinositol 3-kinase activity(GO:0043552) |
| 1.9 | 9.7 | GO:0050861 | positive regulation of B cell receptor signaling pathway(GO:0050861) |
| 1.9 | 46.7 | GO:0010882 | regulation of cardiac muscle contraction by calcium ion signaling(GO:0010882) |
| 1.9 | 7.8 | GO:0032286 | central nervous system myelin maintenance(GO:0032286) |
| 1.9 | 7.8 | GO:0032494 | response to peptidoglycan(GO:0032494) |
| 1.9 | 3.9 | GO:0035634 | response to stilbenoid(GO:0035634) |
| 1.9 | 17.3 | GO:0000101 | sulfur amino acid transport(GO:0000101) |
| 1.9 | 9.6 | GO:0097029 | mature conventional dendritic cell differentiation(GO:0097029) |
| 1.9 | 15.3 | GO:0070164 | negative regulation of adiponectin secretion(GO:0070164) |
| 1.9 | 3.8 | GO:0035565 | regulation of pronephros size(GO:0035565) |
| 1.9 | 38.2 | GO:0006853 | carnitine shuttle(GO:0006853) |
| 1.9 | 3.8 | GO:0002361 | CD4-positive, CD25-positive, alpha-beta regulatory T cell differentiation(GO:0002361) |
| 1.9 | 7.6 | GO:0060214 | endocardium formation(GO:0060214) |
| 1.9 | 5.7 | GO:0002384 | hepatic immune response(GO:0002384) |
| 1.9 | 9.5 | GO:0048302 | regulation of isotype switching to IgG isotypes(GO:0048302) |
| 1.9 | 1.9 | GO:1902512 | positive regulation of apoptotic DNA fragmentation(GO:1902512) |
| 1.9 | 11.3 | GO:1900153 | regulation of nuclear-transcribed mRNA catabolic process, deadenylation-dependent decay(GO:1900151) positive regulation of nuclear-transcribed mRNA catabolic process, deadenylation-dependent decay(GO:1900153) |
| 1.9 | 32.0 | GO:0072488 | ammonium transmembrane transport(GO:0072488) |
| 1.9 | 5.6 | GO:0060672 | epithelial cell differentiation involved in embryonic placenta development(GO:0060671) epithelial cell morphogenesis involved in placental branching(GO:0060672) |
| 1.9 | 5.6 | GO:0031117 | positive regulation of microtubule depolymerization(GO:0031117) |
| 1.9 | 1.9 | GO:0010807 | regulation of synaptic vesicle priming(GO:0010807) |
| 1.9 | 20.6 | GO:0046958 | nonassociative learning(GO:0046958) |
| 1.9 | 5.6 | GO:0030578 | PML body organization(GO:0030578) |
| 1.9 | 13.1 | GO:0035609 | C-terminal protein deglutamylation(GO:0035609) |
| 1.9 | 9.4 | GO:0060800 | regulation of cell differentiation involved in embryonic placenta development(GO:0060800) |
| 1.9 | 7.5 | GO:0002074 | extraocular skeletal muscle development(GO:0002074) |
| 1.9 | 9.4 | GO:0046512 | diol biosynthetic process(GO:0034312) sphingosine biosynthetic process(GO:0046512) sphingoid biosynthetic process(GO:0046520) |
| 1.9 | 1.9 | GO:0021957 | corticospinal tract morphogenesis(GO:0021957) |
| 1.8 | 1.8 | GO:0035963 | cellular response to interleukin-13(GO:0035963) |
| 1.8 | 12.8 | GO:0015705 | iodide transport(GO:0015705) |
| 1.8 | 23.7 | GO:0006600 | creatine metabolic process(GO:0006600) |
| 1.8 | 1.8 | GO:0048630 | skeletal muscle tissue growth(GO:0048630) |
| 1.8 | 3.6 | GO:1904924 | negative regulation of mitophagy in response to mitochondrial depolarization(GO:1904924) |
| 1.8 | 10.9 | GO:0002024 | diet induced thermogenesis(GO:0002024) |
| 1.8 | 34.4 | GO:1902083 | negative regulation of peptidyl-cysteine S-nitrosylation(GO:1902083) |
| 1.8 | 9.0 | GO:0048243 | norepinephrine secretion(GO:0048243) |
| 1.8 | 16.2 | GO:0015693 | magnesium ion transport(GO:0015693) |
| 1.8 | 5.4 | GO:2000466 | negative regulation of glycogen (starch) synthase activity(GO:2000466) regulation of renal water transport(GO:2001151) positive regulation of renal water transport(GO:2001153) |
| 1.8 | 1.8 | GO:0048850 | hypophysis morphogenesis(GO:0048850) diencephalon morphogenesis(GO:0048852) |
| 1.8 | 5.4 | GO:1903028 | positive regulation of opsonization(GO:1903028) |
| 1.8 | 89.5 | GO:0015701 | bicarbonate transport(GO:0015701) |
| 1.8 | 7.1 | GO:0030823 | regulation of cGMP metabolic process(GO:0030823) |
| 1.8 | 19.7 | GO:0032074 | negative regulation of nuclease activity(GO:0032074) |
| 1.8 | 16.1 | GO:0002175 | protein localization to paranode region of axon(GO:0002175) |
| 1.8 | 7.1 | GO:0038161 | prolactin signaling pathway(GO:0038161) |
| 1.8 | 3.6 | GO:0001983 | regulation of systemic arterial blood pressure by carotid sinus baroreceptor feedback(GO:0001978) baroreceptor response to increased systemic arterial blood pressure(GO:0001983) |
| 1.8 | 7.1 | GO:0009822 | alkaloid catabolic process(GO:0009822) |
| 1.8 | 5.3 | GO:0034769 | basement membrane disassembly(GO:0034769) |
| 1.8 | 26.4 | GO:1901897 | regulation of relaxation of cardiac muscle(GO:1901897) |
| 1.8 | 5.3 | GO:0060061 | Spemann organizer formation(GO:0060061) |
| 1.7 | 5.2 | GO:0014848 | urinary bladder smooth muscle contraction(GO:0014832) urinary tract smooth muscle contraction(GO:0014848) |
| 1.7 | 3.5 | GO:0003256 | regulation of transcription from RNA polymerase II promoter involved in myocardial precursor cell differentiation(GO:0003256) |
| 1.7 | 5.2 | GO:0010166 | wax biosynthetic process(GO:0010025) wax metabolic process(GO:0010166) |
| 1.7 | 3.5 | GO:0023041 | neuronal signal transduction(GO:0023041) |
| 1.7 | 3.5 | GO:0002215 | defense response to nematode(GO:0002215) |
| 1.7 | 5.2 | GO:0060988 | lipid tube assembly(GO:0060988) |
| 1.7 | 22.5 | GO:0006751 | glutathione catabolic process(GO:0006751) leukotriene D4 metabolic process(GO:1901748) leukotriene D4 biosynthetic process(GO:1901750) |
| 1.7 | 32.8 | GO:0060716 | labyrinthine layer blood vessel development(GO:0060716) |
| 1.7 | 5.2 | GO:0010793 | regulation of mRNA export from nucleus(GO:0010793) |
| 1.7 | 3.4 | GO:2000192 | negative regulation of fatty acid transport(GO:2000192) |
| 1.7 | 17.2 | GO:0048625 | myoblast fate commitment(GO:0048625) |
| 1.7 | 36.1 | GO:0036152 | phosphatidylethanolamine acyl-chain remodeling(GO:0036152) |
| 1.7 | 1.7 | GO:0051877 | pigment granule aggregation in cell center(GO:0051877) |
| 1.7 | 5.1 | GO:1902630 | regulation of membrane hyperpolarization(GO:1902630) |
| 1.7 | 1.7 | GO:0035360 | positive regulation of peroxisome proliferator activated receptor signaling pathway(GO:0035360) |
| 1.7 | 13.6 | GO:1902902 | negative regulation of autophagosome assembly(GO:1902902) |
| 1.7 | 5.1 | GO:0009386 | translational attenuation(GO:0009386) |
| 1.7 | 5.1 | GO:0090675 | intermicrovillar adhesion(GO:0090675) |
| 1.7 | 15.2 | GO:0098535 | de novo centriole assembly(GO:0098535) |
| 1.7 | 11.8 | GO:0060453 | regulation of gastric acid secretion(GO:0060453) |
| 1.7 | 1.7 | GO:0007412 | axon target recognition(GO:0007412) |
| 1.7 | 13.4 | GO:0035865 | cellular response to potassium ion(GO:0035865) |
| 1.7 | 5.0 | GO:1990637 | response to prolactin(GO:1990637) |
| 1.7 | 5.0 | GO:1904529 | regulation of actin filament binding(GO:1904529) regulation of actin binding(GO:1904616) |
| 1.7 | 8.3 | GO:0051029 | rRNA transport(GO:0051029) |
| 1.7 | 5.0 | GO:1901053 | sarcosine metabolic process(GO:1901052) sarcosine catabolic process(GO:1901053) |
| 1.7 | 13.3 | GO:0060124 | positive regulation of growth hormone secretion(GO:0060124) |
| 1.7 | 5.0 | GO:0045212 | negative regulation of synaptic transmission, cholinergic(GO:0032223) neurotransmitter receptor biosynthetic process(GO:0045212) |
| 1.7 | 23.3 | GO:0048172 | regulation of short-term neuronal synaptic plasticity(GO:0048172) |
| 1.7 | 26.6 | GO:2000251 | positive regulation of actin cytoskeleton reorganization(GO:2000251) |
| 1.6 | 3.3 | GO:0001994 | norepinephrine-epinephrine vasoconstriction involved in regulation of systemic arterial blood pressure(GO:0001994) |
| 1.6 | 4.9 | GO:0036072 | intramembranous ossification(GO:0001957) direct ossification(GO:0036072) |
| 1.6 | 3.3 | GO:1902722 | positive regulation of prolactin secretion(GO:1902722) |
| 1.6 | 1.6 | GO:0021707 | cerebellar granular layer formation(GO:0021684) cerebellar granule cell differentiation(GO:0021707) |
| 1.6 | 11.4 | GO:0006102 | isocitrate metabolic process(GO:0006102) |
| 1.6 | 4.9 | GO:0019482 | beta-alanine metabolic process(GO:0019482) |
| 1.6 | 4.8 | GO:0051414 | response to cortisol(GO:0051414) |
| 1.6 | 19.3 | GO:0032957 | inositol trisphosphate metabolic process(GO:0032957) |
| 1.6 | 6.4 | GO:1903860 | negative regulation of dendrite extension(GO:1903860) regulation of neuron remodeling(GO:1904799) negative regulation of neuron remodeling(GO:1904800) negative regulation of branching morphogenesis of a nerve(GO:2000173) |
| 1.6 | 35.3 | GO:0006895 | Golgi to endosome transport(GO:0006895) |
| 1.6 | 1.6 | GO:0044240 | multicellular organism lipid catabolic process(GO:0044240) |
| 1.6 | 3.2 | GO:0072520 | seminiferous tubule development(GO:0072520) |
| 1.6 | 4.8 | GO:0002740 | negative regulation of cytokine secretion involved in immune response(GO:0002740) |
| 1.6 | 17.6 | GO:0010919 | regulation of inositol phosphate biosynthetic process(GO:0010919) |
| 1.6 | 17.6 | GO:0030210 | heparin metabolic process(GO:0030202) heparin biosynthetic process(GO:0030210) |
| 1.6 | 20.7 | GO:0031642 | negative regulation of myelination(GO:0031642) |
| 1.6 | 9.6 | GO:0060370 | susceptibility to T cell mediated cytotoxicity(GO:0060370) |
| 1.6 | 31.8 | GO:0034204 | lipid translocation(GO:0034204) phospholipid translocation(GO:0045332) |
| 1.6 | 4.7 | GO:0007440 | foregut morphogenesis(GO:0007440) embryonic foregut morphogenesis(GO:0048617) |
| 1.6 | 6.3 | GO:0050966 | detection of mechanical stimulus involved in sensory perception of pain(GO:0050966) |
| 1.6 | 11.0 | GO:0060033 | anatomical structure regression(GO:0060033) |
| 1.6 | 26.8 | GO:0030205 | dermatan sulfate metabolic process(GO:0030205) |
| 1.6 | 4.7 | GO:0071380 | cellular response to prostaglandin E stimulus(GO:0071380) |
| 1.6 | 9.4 | GO:0001569 | patterning of blood vessels(GO:0001569) |
| 1.6 | 6.3 | GO:0034445 | regulation of plasma lipoprotein particle oxidation(GO:0034444) negative regulation of plasma lipoprotein particle oxidation(GO:0034445) |
| 1.6 | 9.4 | GO:0010533 | regulation of activation of Janus kinase activity(GO:0010533) |
| 1.6 | 14.0 | GO:0010875 | positive regulation of cholesterol efflux(GO:0010875) |
| 1.6 | 6.2 | GO:0021615 | glossopharyngeal nerve morphogenesis(GO:0021615) |
| 1.6 | 9.3 | GO:0006707 | cholesterol catabolic process(GO:0006707) sterol catabolic process(GO:0016127) |
| 1.5 | 4.6 | GO:0007341 | penetration of zona pellucida(GO:0007341) |
| 1.5 | 32.4 | GO:0006884 | cell volume homeostasis(GO:0006884) |
| 1.5 | 10.8 | GO:2001300 | lipoxin metabolic process(GO:2001300) |
| 1.5 | 7.7 | GO:0007198 | adenylate cyclase-inhibiting serotonin receptor signaling pathway(GO:0007198) |
| 1.5 | 3.1 | GO:1904580 | regulation of intracellular mRNA localization(GO:1904580) positive regulation of intracellular mRNA localization(GO:1904582) |
| 1.5 | 3.0 | GO:0070245 | positive regulation of thymocyte apoptotic process(GO:0070245) |
| 1.5 | 22.8 | GO:0051969 | regulation of transmission of nerve impulse(GO:0051969) |
| 1.5 | 6.1 | GO:0061366 | behavioral response to chemical pain(GO:0061366) behavioral response to formalin induced pain(GO:0061368) |
| 1.5 | 4.5 | GO:0002414 | immunoglobulin transcytosis in epithelial cells(GO:0002414) |
| 1.5 | 6.0 | GO:0002925 | positive regulation of humoral immune response mediated by circulating immunoglobulin(GO:0002925) |
| 1.5 | 9.0 | GO:0071873 | response to norepinephrine(GO:0071873) cellular response to norepinephrine stimulus(GO:0071874) |
| 1.5 | 34.5 | GO:1902259 | regulation of delayed rectifier potassium channel activity(GO:1902259) |
| 1.5 | 7.5 | GO:0051725 | protein de-ADP-ribosylation(GO:0051725) |
| 1.5 | 4.5 | GO:0072137 | condensed mesenchymal cell proliferation(GO:0072137) |
| 1.5 | 4.5 | GO:1902283 | negative regulation of primary amine oxidase activity(GO:1902283) |
| 1.5 | 22.3 | GO:0010991 | negative regulation of SMAD protein complex assembly(GO:0010991) |
| 1.5 | 20.8 | GO:0044110 | growth involved in symbiotic interaction(GO:0044110) growth of symbiont involved in interaction with host(GO:0044116) |
| 1.5 | 14.9 | GO:0061430 | bone trabecula formation(GO:0060346) bone trabecula morphogenesis(GO:0061430) |
| 1.5 | 1.5 | GO:0060019 | radial glial cell differentiation(GO:0060019) |
| 1.5 | 10.4 | GO:0048070 | regulation of developmental pigmentation(GO:0048070) |
| 1.5 | 3.0 | GO:0003228 | atrial cardiac muscle tissue development(GO:0003228) atrial cardiac muscle tissue morphogenesis(GO:0055009) |
| 1.5 | 7.4 | GO:1902613 | regulation of anti-Mullerian hormone signaling pathway(GO:1902612) negative regulation of anti-Mullerian hormone signaling pathway(GO:1902613) anti-Mullerian hormone signaling pathway(GO:1990262) |
| 1.5 | 5.9 | GO:0086021 | SA node cell to atrial cardiac muscle cell communication by electrical coupling(GO:0086021) AV node cell to bundle of His cell communication by electrical coupling(GO:0086053) |
| 1.5 | 3.0 | GO:0071504 | response to heparin(GO:0071503) cellular response to heparin(GO:0071504) |
| 1.5 | 2.9 | GO:0021834 | embryonic olfactory bulb interneuron precursor migration(GO:0021831) chemorepulsion involved in embryonic olfactory bulb interneuron precursor migration(GO:0021834) |
| 1.5 | 4.4 | GO:1903006 | regulation of protein K63-linked deubiquitination(GO:1903004) positive regulation of protein K63-linked deubiquitination(GO:1903006) |
| 1.5 | 13.1 | GO:0000730 | DNA recombinase assembly(GO:0000730) double-strand break repair via synthesis-dependent strand annealing(GO:0045003) |
| 1.5 | 17.5 | GO:0038092 | nodal signaling pathway(GO:0038092) |
| 1.5 | 13.1 | GO:0032482 | Rab protein signal transduction(GO:0032482) |
| 1.4 | 5.8 | GO:0046689 | response to mercury ion(GO:0046689) |
| 1.4 | 23.1 | GO:0034497 | protein localization to pre-autophagosomal structure(GO:0034497) |
| 1.4 | 4.3 | GO:1904338 | regulation of dopaminergic neuron differentiation(GO:1904338) |
| 1.4 | 5.7 | GO:0034154 | toll-like receptor 7 signaling pathway(GO:0034154) |
| 1.4 | 4.3 | GO:0051344 | negative regulation of cyclic-nucleotide phosphodiesterase activity(GO:0051344) |
| 1.4 | 1.4 | GO:1990641 | response to iron ion starvation(GO:1990641) |
| 1.4 | 11.4 | GO:0021636 | trigeminal nerve morphogenesis(GO:0021636) trigeminal nerve structural organization(GO:0021637) semaphorin-plexin signaling pathway involved in axon guidance(GO:1902287) |
| 1.4 | 11.4 | GO:0070995 | NADPH oxidation(GO:0070995) |
| 1.4 | 2.9 | GO:0030885 | regulation of myeloid dendritic cell activation(GO:0030885) |
| 1.4 | 2.8 | GO:1900194 | negative regulation of oocyte maturation(GO:1900194) |
| 1.4 | 4.3 | GO:1902498 | regulation of protein autoubiquitination(GO:1902498) |
| 1.4 | 2.8 | GO:2000124 | regulation of endocannabinoid signaling pathway(GO:2000124) |
| 1.4 | 1.4 | GO:0010587 | miRNA catabolic process(GO:0010587) |
| 1.4 | 11.3 | GO:2000348 | regulation of CD40 signaling pathway(GO:2000348) |
| 1.4 | 5.6 | GO:0034287 | detection of carbohydrate stimulus(GO:0009730) detection of hexose stimulus(GO:0009732) detection of monosaccharide stimulus(GO:0034287) detection of glucose(GO:0051594) |
| 1.4 | 4.2 | GO:0060448 | dichotomous subdivision of terminal units involved in lung branching(GO:0060448) |
| 1.4 | 2.8 | GO:0045925 | positive regulation of female receptivity(GO:0045925) |
| 1.4 | 4.2 | GO:0019732 | antifungal humoral response(GO:0019732) |
| 1.4 | 7.0 | GO:0035582 | sequestering of BMP in extracellular matrix(GO:0035582) |
| 1.4 | 9.8 | GO:0060272 | embryonic skeletal joint morphogenesis(GO:0060272) |
| 1.4 | 1.4 | GO:0060423 | foregut regionalization(GO:0060423) lung field specification(GO:0060424) lung induction(GO:0060492) regulation of branching involved in lung morphogenesis(GO:0061046) positive regulation of branching involved in lung morphogenesis(GO:0061047) |
| 1.4 | 5.6 | GO:0032308 | regulation of prostaglandin secretion(GO:0032306) positive regulation of prostaglandin secretion(GO:0032308) |
| 1.4 | 1.4 | GO:0060137 | maternal process involved in parturition(GO:0060137) |
| 1.4 | 1.4 | GO:0032971 | regulation of muscle filament sliding(GO:0032971) |
| 1.4 | 2.8 | GO:0001842 | neural fold formation(GO:0001842) |
| 1.4 | 2.8 | GO:2000170 | positive regulation of peptidyl-cysteine S-nitrosylation(GO:2000170) |
| 1.4 | 8.3 | GO:0061624 | fructose catabolic process(GO:0006001) fructose catabolic process to hydroxyacetone phosphate and glyceraldehyde-3-phosphate(GO:0061624) |
| 1.4 | 9.7 | GO:0032534 | regulation of microvillus assembly(GO:0032534) |
| 1.4 | 17.9 | GO:0007258 | JUN phosphorylation(GO:0007258) |
| 1.4 | 2.7 | GO:2001202 | interaction with other organism via secreted substance involved in symbiotic interaction(GO:0052047) negative regulation of transforming growth factor-beta secretion(GO:2001202) |
| 1.4 | 13.7 | GO:0050901 | leukocyte tethering or rolling(GO:0050901) |
| 1.4 | 5.5 | GO:0070131 | positive regulation of mitochondrial translation(GO:0070131) |
| 1.4 | 12.3 | GO:1904262 | negative regulation of TORC1 signaling(GO:1904262) |
| 1.4 | 2.7 | GO:0035990 | tendon cell differentiation(GO:0035990) tendon formation(GO:0035992) |
| 1.4 | 13.6 | GO:0015874 | norepinephrine transport(GO:0015874) |
| 1.4 | 4.1 | GO:0042231 | interleukin-13 biosynthetic process(GO:0042231) |
| 1.4 | 5.4 | GO:0021888 | hypothalamus gonadotrophin-releasing hormone neuron differentiation(GO:0021886) hypothalamus gonadotrophin-releasing hormone neuron development(GO:0021888) |
| 1.3 | 20.2 | GO:0021854 | hypothalamus development(GO:0021854) |
| 1.3 | 10.8 | GO:0010716 | negative regulation of extracellular matrix disassembly(GO:0010716) |
| 1.3 | 17.4 | GO:0010668 | ectodermal cell differentiation(GO:0010668) |
| 1.3 | 6.6 | GO:0060670 | branching involved in labyrinthine layer morphogenesis(GO:0060670) |
| 1.3 | 15.9 | GO:0009299 | mRNA transcription(GO:0009299) |
| 1.3 | 11.9 | GO:0002031 | G-protein coupled receptor internalization(GO:0002031) |
| 1.3 | 2.7 | GO:1902809 | skeletal muscle fiber differentiation(GO:0098528) regulation of skeletal muscle fiber differentiation(GO:1902809) |
| 1.3 | 1.3 | GO:0097338 | response to clozapine(GO:0097338) |
| 1.3 | 4.0 | GO:0015847 | putrescine transport(GO:0015847) |
| 1.3 | 3.9 | GO:0051940 | regulation of dopamine uptake involved in synaptic transmission(GO:0051584) regulation of catecholamine uptake involved in synaptic transmission(GO:0051940) |
| 1.3 | 3.9 | GO:0002725 | negative regulation of T cell cytokine production(GO:0002725) |
| 1.3 | 5.3 | GO:0045987 | positive regulation of smooth muscle contraction(GO:0045987) |
| 1.3 | 3.9 | GO:0045897 | positive regulation of transcription during mitosis(GO:0045897) |
| 1.3 | 2.6 | GO:1902285 | semaphorin-plexin signaling pathway involved in neuron projection guidance(GO:1902285) |
| 1.3 | 3.9 | GO:0097156 | fasciculation of motor neuron axon(GO:0097156) |
| 1.3 | 10.3 | GO:0006686 | sphingomyelin biosynthetic process(GO:0006686) |
| 1.3 | 5.2 | GO:0045647 | negative regulation of erythrocyte differentiation(GO:0045647) |
| 1.3 | 5.2 | GO:0006710 | androgen catabolic process(GO:0006710) |
| 1.3 | 11.6 | GO:0019317 | fucose catabolic process(GO:0019317) L-fucose metabolic process(GO:0042354) L-fucose catabolic process(GO:0042355) |
| 1.3 | 5.1 | GO:0060050 | positive regulation of protein glycosylation(GO:0060050) |
| 1.3 | 2.6 | GO:0002408 | myeloid dendritic cell chemotaxis(GO:0002408) |
| 1.3 | 5.1 | GO:0033089 | positive regulation of T cell differentiation in thymus(GO:0033089) positive regulation of thymocyte aggregation(GO:2000400) |
| 1.3 | 3.8 | GO:0043321 | regulation of natural killer cell degranulation(GO:0043321) positive regulation of natural killer cell degranulation(GO:0043323) |
| 1.3 | 5.1 | GO:0031630 | regulation of synaptic vesicle fusion to presynaptic membrane(GO:0031630) |
| 1.3 | 6.4 | GO:2000382 | positive regulation of mesoderm development(GO:2000382) |
| 1.3 | 3.8 | GO:1990785 | response to water-immersion restraint stress(GO:1990785) |
| 1.3 | 2.5 | GO:0048557 | embryonic digestive tract morphogenesis(GO:0048557) |
| 1.3 | 3.8 | GO:0072023 | thick ascending limb development(GO:0072023) metanephric thick ascending limb development(GO:0072233) |
| 1.3 | 2.5 | GO:0036269 | swimming behavior(GO:0036269) |
| 1.3 | 1.3 | GO:0070662 | mast cell proliferation(GO:0070662) |
| 1.3 | 16.3 | GO:0051194 | positive regulation of cofactor metabolic process(GO:0051194) positive regulation of coenzyme metabolic process(GO:0051197) |
| 1.2 | 26.2 | GO:0007413 | axonal fasciculation(GO:0007413) |
| 1.2 | 8.7 | GO:0035235 | ionotropic glutamate receptor signaling pathway(GO:0035235) |
| 1.2 | 8.7 | GO:0018026 | peptidyl-lysine monomethylation(GO:0018026) |
| 1.2 | 2.5 | GO:0060125 | negative regulation of growth hormone secretion(GO:0060125) |
| 1.2 | 48.2 | GO:0007223 | Wnt signaling pathway, calcium modulating pathway(GO:0007223) |
| 1.2 | 2.5 | GO:0042631 | cellular response to water deprivation(GO:0042631) |
| 1.2 | 43.0 | GO:0019228 | neuronal action potential(GO:0019228) |
| 1.2 | 4.9 | GO:0060708 | spongiotrophoblast differentiation(GO:0060708) |
| 1.2 | 6.1 | GO:0015959 | diadenosine polyphosphate metabolic process(GO:0015959) diadenosine polyphosphate catabolic process(GO:0015961) diphosphoinositol polyphosphate metabolic process(GO:0071543) diadenosine pentaphosphate metabolic process(GO:1901906) diadenosine pentaphosphate catabolic process(GO:1901907) diadenosine hexaphosphate metabolic process(GO:1901908) diadenosine hexaphosphate catabolic process(GO:1901909) adenosine 5'-(hexahydrogen pentaphosphate) metabolic process(GO:1901910) adenosine 5'-(hexahydrogen pentaphosphate) catabolic process(GO:1901911) |
| 1.2 | 3.7 | GO:0055089 | fatty acid homeostasis(GO:0055089) |
| 1.2 | 49.9 | GO:0009214 | cyclic nucleotide catabolic process(GO:0009214) |
| 1.2 | 2.4 | GO:0033564 | anterior/posterior axon guidance(GO:0033564) |
| 1.2 | 2.4 | GO:1903691 | positive regulation of wound healing, spreading of epidermal cells(GO:1903691) |
| 1.2 | 6.1 | GO:0031069 | hair follicle morphogenesis(GO:0031069) |
| 1.2 | 7.3 | GO:0007512 | adult heart development(GO:0007512) |
| 1.2 | 4.8 | GO:2000342 | negative regulation of chemokine (C-X-C motif) ligand 2 production(GO:2000342) |
| 1.2 | 8.5 | GO:0042373 | vitamin K metabolic process(GO:0042373) |
| 1.2 | 6.0 | GO:0002710 | negative regulation of T cell mediated immunity(GO:0002710) |
| 1.2 | 15.7 | GO:0035988 | chondrocyte proliferation(GO:0035988) |
| 1.2 | 21.7 | GO:0048642 | negative regulation of skeletal muscle tissue development(GO:0048642) |
| 1.2 | 9.6 | GO:0035115 | embryonic forelimb morphogenesis(GO:0035115) |
| 1.2 | 2.4 | GO:0023035 | CD40 signaling pathway(GO:0023035) |
| 1.2 | 3.6 | GO:0051935 | amino acid neurotransmitter reuptake(GO:0051933) glutamate reuptake(GO:0051935) |
| 1.2 | 6.0 | GO:0070673 | response to interleukin-18(GO:0070673) |
| 1.2 | 4.8 | GO:0033133 | positive regulation of glucokinase activity(GO:0033133) |
| 1.2 | 35.8 | GO:0006182 | cGMP biosynthetic process(GO:0006182) |
| 1.2 | 11.9 | GO:0048820 | hair follicle maturation(GO:0048820) |
| 1.2 | 10.6 | GO:0038145 | macrophage colony-stimulating factor signaling pathway(GO:0038145) |
| 1.2 | 13.0 | GO:2000291 | regulation of myoblast proliferation(GO:2000291) |
| 1.2 | 5.9 | GO:0044375 | regulation of peroxisome size(GO:0044375) |
| 1.2 | 7.1 | GO:0061737 | leukotriene signaling pathway(GO:0061737) |
| 1.2 | 3.5 | GO:0099566 | regulation of postsynaptic cytosolic calcium ion concentration(GO:0099566) |
| 1.2 | 3.5 | GO:0098707 | ferrous iron import into cell(GO:0097460) ferrous iron import across plasma membrane(GO:0098707) |
| 1.2 | 17.5 | GO:0019226 | transmission of nerve impulse(GO:0019226) |
| 1.2 | 2.3 | GO:0001946 | lymphangiogenesis(GO:0001946) |
| 1.2 | 1.2 | GO:0060080 | inhibitory postsynaptic potential(GO:0060080) |
| 1.2 | 12.8 | GO:0000733 | DNA strand renaturation(GO:0000733) |
| 1.2 | 11.6 | GO:0042417 | dopamine metabolic process(GO:0042417) |
| 1.2 | 5.8 | GO:0016554 | cytidine to uridine editing(GO:0016554) |
| 1.2 | 9.2 | GO:0070050 | neuron cellular homeostasis(GO:0070050) |
| 1.1 | 4.6 | GO:2000049 | positive regulation of cell-cell adhesion mediated by cadherin(GO:2000049) |
| 1.1 | 11.4 | GO:0021942 | radial glia guided migration of Purkinje cell(GO:0021942) |
| 1.1 | 12.5 | GO:0070544 | histone H3-K36 demethylation(GO:0070544) |
| 1.1 | 2.3 | GO:0003219 | cardiac right ventricle formation(GO:0003219) |
| 1.1 | 5.7 | GO:0045656 | negative regulation of monocyte differentiation(GO:0045656) |
| 1.1 | 2.3 | GO:0035624 | receptor transactivation(GO:0035624) |
| 1.1 | 7.9 | GO:0001867 | complement activation, lectin pathway(GO:0001867) |
| 1.1 | 2.2 | GO:0036378 | calcitriol biosynthetic process from calciol(GO:0036378) |
| 1.1 | 5.6 | GO:0030917 | midbrain-hindbrain boundary development(GO:0030917) |
| 1.1 | 1.1 | GO:2000510 | positive regulation of dendritic cell chemotaxis(GO:2000510) |
| 1.1 | 12.3 | GO:2001197 | regulation of basement membrane assembly involved in embryonic body morphogenesis(GO:1904259) positive regulation of basement membrane assembly involved in embryonic body morphogenesis(GO:1904261) basement membrane assembly involved in embryonic body morphogenesis(GO:2001197) |
| 1.1 | 3.3 | GO:1990086 | lens fiber cell apoptotic process(GO:1990086) |
| 1.1 | 15.5 | GO:0007202 | activation of phospholipase C activity(GO:0007202) |
| 1.1 | 4.4 | GO:0015732 | prostaglandin transport(GO:0015732) |
| 1.1 | 5.5 | GO:1905225 | response to thyrotropin-releasing hormone(GO:1905225) |
| 1.1 | 6.6 | GO:1990440 | positive regulation of transcription from RNA polymerase II promoter in response to endoplasmic reticulum stress(GO:1990440) |
| 1.1 | 4.4 | GO:1903232 | melanosome assembly(GO:1903232) |
| 1.1 | 2.2 | GO:0014005 | microglia differentiation(GO:0014004) microglia development(GO:0014005) |
| 1.1 | 2.2 | GO:1900227 | positive regulation of NLRP3 inflammasome complex assembly(GO:1900227) |
| 1.1 | 6.6 | GO:0045475 | locomotor rhythm(GO:0045475) |
| 1.1 | 3.3 | GO:0070092 | glucagon secretion(GO:0070091) regulation of glucagon secretion(GO:0070092) |
| 1.1 | 17.4 | GO:0006590 | thyroid hormone generation(GO:0006590) |
| 1.1 | 4.3 | GO:0048861 | leukemia inhibitory factor signaling pathway(GO:0048861) |
| 1.1 | 4.3 | GO:0060414 | aorta smooth muscle tissue morphogenesis(GO:0060414) |
| 1.1 | 5.4 | GO:0055059 | asymmetric neuroblast division(GO:0055059) |
| 1.1 | 8.6 | GO:0050974 | detection of mechanical stimulus involved in sensory perception(GO:0050974) |
| 1.1 | 2.2 | GO:0043551 | regulation of phosphatidylinositol 3-kinase activity(GO:0043551) |
| 1.1 | 2.1 | GO:0001757 | somite specification(GO:0001757) |
| 1.1 | 2.1 | GO:0042418 | epinephrine metabolic process(GO:0042414) epinephrine biosynthetic process(GO:0042418) |
| 1.1 | 9.6 | GO:0042755 | eating behavior(GO:0042755) |
| 1.1 | 6.4 | GO:2000194 | regulation of female gonad development(GO:2000194) |
| 1.1 | 3.2 | GO:1903774 | positive regulation of viral budding via host ESCRT complex(GO:1903774) |
| 1.1 | 1.1 | GO:0038162 | erythropoietin-mediated signaling pathway(GO:0038162) |
| 1.1 | 7.4 | GO:0048312 | intracellular distribution of mitochondria(GO:0048312) |
| 1.1 | 2.1 | GO:0044340 | canonical Wnt signaling pathway involved in regulation of cell proliferation(GO:0044340) |
| 1.0 | 7.3 | GO:1900274 | regulation of phospholipase C activity(GO:1900274) |
| 1.0 | 13.6 | GO:1901223 | negative regulation of NIK/NF-kappaB signaling(GO:1901223) |
| 1.0 | 2.1 | GO:0098758 | response to interleukin-8(GO:0098758) cellular response to interleukin-8(GO:0098759) |
| 1.0 | 4.2 | GO:0051599 | response to hydrostatic pressure(GO:0051599) |
| 1.0 | 2.1 | GO:0034311 | sphingosine metabolic process(GO:0006670) diol metabolic process(GO:0034311) |
| 1.0 | 25.7 | GO:0035082 | axoneme assembly(GO:0035082) |
| 1.0 | 4.1 | GO:2000501 | regulation of natural killer cell chemotaxis(GO:2000501) positive regulation of natural killer cell chemotaxis(GO:2000503) |
| 1.0 | 3.1 | GO:1900383 | regulation of synaptic plasticity by receptor localization to synapse(GO:1900383) |
| 1.0 | 14.3 | GO:0030517 | negative regulation of axon extension(GO:0030517) |
| 1.0 | 2.0 | GO:0003357 | noradrenergic neuron differentiation(GO:0003357) soft palate development(GO:0060023) |
| 1.0 | 4.1 | GO:0007221 | positive regulation of transcription of Notch receptor target(GO:0007221) |
| 1.0 | 4.1 | GO:0048485 | sympathetic nervous system development(GO:0048485) |
| 1.0 | 7.1 | GO:0090527 | actin filament reorganization(GO:0090527) |
| 1.0 | 4.1 | GO:0032848 | negative regulation of cellular pH reduction(GO:0032848) CD8-positive, alpha-beta T cell lineage commitment(GO:0043375) negative regulation of retinal cell programmed cell death(GO:0046671) |
| 1.0 | 4.1 | GO:0060591 | chondroblast differentiation(GO:0060591) |
| 1.0 | 3.0 | GO:0006701 | progesterone biosynthetic process(GO:0006701) |
| 1.0 | 5.1 | GO:0048619 | embryonic hindgut morphogenesis(GO:0048619) |
| 1.0 | 4.0 | GO:0003215 | cardiac right ventricle morphogenesis(GO:0003215) |
| 1.0 | 7.0 | GO:0098914 | membrane repolarization during atrial cardiac muscle cell action potential(GO:0098914) |
| 1.0 | 11.0 | GO:0007141 | male meiosis I(GO:0007141) |
| 1.0 | 8.9 | GO:0071285 | cellular response to lithium ion(GO:0071285) |
| 1.0 | 5.9 | GO:0045741 | positive regulation of epidermal growth factor-activated receptor activity(GO:0045741) |
| 1.0 | 5.0 | GO:0061146 | mucosal-associated lymphoid tissue development(GO:0048537) Peyer's patch development(GO:0048541) Peyer's patch morphogenesis(GO:0061146) |
| 1.0 | 3.9 | GO:0002644 | negative regulation of tolerance induction(GO:0002644) |
| 1.0 | 2.9 | GO:0050957 | equilibrioception(GO:0050957) |
| 1.0 | 4.9 | GO:0014894 | response to muscle inactivity involved in regulation of muscle adaptation(GO:0014877) response to denervation involved in regulation of muscle adaptation(GO:0014894) |
| 1.0 | 3.9 | GO:1901836 | regulation of transcription of nuclear large rRNA transcript from RNA polymerase I promoter(GO:1901836) |
| 1.0 | 5.8 | GO:0060384 | innervation(GO:0060384) |
| 1.0 | 2.9 | GO:0072103 | glomerulus vasculature morphogenesis(GO:0072103) glomerular capillary formation(GO:0072104) |
| 1.0 | 33.0 | GO:0090311 | regulation of protein deacetylation(GO:0090311) |
| 1.0 | 1.9 | GO:1904327 | protein localization to cytosolic proteasome complex(GO:1904327) protein localization to cytosolic proteasome complex involved in ERAD pathway(GO:1904379) |
| 1.0 | 2.9 | GO:0060068 | vagina development(GO:0060068) |
| 1.0 | 6.8 | GO:0006729 | tetrahydrobiopterin biosynthetic process(GO:0006729) tetrahydrobiopterin metabolic process(GO:0046146) |
| 1.0 | 17.4 | GO:0006068 | ethanol catabolic process(GO:0006068) |
| 1.0 | 4.8 | GO:0072602 | interleukin-4 secretion(GO:0072602) |
| 1.0 | 27.8 | GO:0072378 | blood coagulation, fibrin clot formation(GO:0072378) |
| 1.0 | 5.7 | GO:0006540 | glutamate decarboxylation to succinate(GO:0006540) |
| 1.0 | 1.9 | GO:0072248 | metanephric glomerular epithelium development(GO:0072244) metanephric glomerular visceral epithelial cell differentiation(GO:0072248) metanephric glomerular visceral epithelial cell development(GO:0072249) metanephric glomerular epithelial cell differentiation(GO:0072312) metanephric glomerular epithelial cell development(GO:0072313) |
| 1.0 | 4.8 | GO:0006432 | phenylalanyl-tRNA aminoacylation(GO:0006432) |
| 0.9 | 4.7 | GO:1904674 | positive regulation of somatic stem cell population maintenance(GO:1904674) |
| 0.9 | 18.9 | GO:0046597 | negative regulation of viral entry into host cell(GO:0046597) |
| 0.9 | 8.5 | GO:0045879 | negative regulation of smoothened signaling pathway(GO:0045879) |
| 0.9 | 4.7 | GO:0033085 | negative regulation of T cell differentiation in thymus(GO:0033085) negative regulation of thymocyte aggregation(GO:2000399) |
| 0.9 | 6.6 | GO:2000660 | negative regulation of interleukin-1-mediated signaling pathway(GO:2000660) |
| 0.9 | 6.5 | GO:0008535 | respiratory chain complex IV assembly(GO:0008535) |
| 0.9 | 4.7 | GO:0051902 | negative regulation of mitochondrial depolarization(GO:0051902) |
| 0.9 | 6.5 | GO:1903903 | regulation of establishment of T cell polarity(GO:1903903) |
| 0.9 | 2.8 | GO:0018125 | peptidyl-cysteine methylation(GO:0018125) |
| 0.9 | 1.9 | GO:0042636 | negative regulation of hair cycle(GO:0042636) |
| 0.9 | 11.1 | GO:0015012 | heparan sulfate proteoglycan biosynthetic process(GO:0015012) |
| 0.9 | 18.5 | GO:0035590 | purinergic nucleotide receptor signaling pathway(GO:0035590) |
| 0.9 | 1.8 | GO:0009912 | auditory receptor cell fate commitment(GO:0009912) inner ear receptor cell fate commitment(GO:0060120) |
| 0.9 | 8.3 | GO:0006957 | complement activation, alternative pathway(GO:0006957) |
| 0.9 | 16.6 | GO:0021904 | dorsal/ventral neural tube patterning(GO:0021904) |
| 0.9 | 7.4 | GO:0010761 | fibroblast migration(GO:0010761) |
| 0.9 | 0.9 | GO:0070827 | chromatin maintenance(GO:0070827) |
| 0.9 | 1.8 | GO:0035356 | cellular triglyceride homeostasis(GO:0035356) |
| 0.9 | 5.5 | GO:0002760 | positive regulation of antimicrobial peptide production(GO:0002225) positive regulation of antimicrobial humoral response(GO:0002760) regulation of antimicrobial peptide production(GO:0002784) regulation of antibacterial peptide production(GO:0002786) positive regulation of antibacterial peptide production(GO:0002803) |
| 0.9 | 0.9 | GO:1901889 | negative regulation of cell junction assembly(GO:1901889) |
| 0.9 | 3.6 | GO:0071688 | striated muscle myosin thick filament assembly(GO:0071688) |
| 0.9 | 0.9 | GO:0009826 | unidimensional cell growth(GO:0009826) |
| 0.9 | 4.5 | GO:0072553 | terminal button organization(GO:0072553) |
| 0.9 | 1.8 | GO:1902004 | positive regulation of beta-amyloid formation(GO:1902004) |
| 0.9 | 11.8 | GO:0015889 | cobalamin transport(GO:0015889) |
| 0.9 | 9.9 | GO:0097107 | postsynaptic density organization(GO:0097106) postsynaptic density assembly(GO:0097107) gephyrin clustering involved in postsynaptic density assembly(GO:0097116) |
| 0.9 | 2.7 | GO:0045663 | positive regulation of myoblast differentiation(GO:0045663) |
| 0.9 | 1.8 | GO:0060620 | regulation of cholesterol import(GO:0060620) negative regulation of cholesterol import(GO:0060621) regulation of sterol import(GO:2000909) negative regulation of sterol import(GO:2000910) |
| 0.9 | 18.8 | GO:2001275 | positive regulation of glucose import in response to insulin stimulus(GO:2001275) |
| 0.9 | 5.4 | GO:1901660 | calcium ion export(GO:1901660) |
| 0.9 | 6.2 | GO:0043046 | DNA methylation involved in gamete generation(GO:0043046) |
| 0.9 | 3.5 | GO:0048742 | regulation of skeletal muscle fiber development(GO:0048742) |
| 0.9 | 14.1 | GO:0010569 | regulation of double-strand break repair via homologous recombination(GO:0010569) |
| 0.9 | 0.9 | GO:0009957 | epidermal cell fate specification(GO:0009957) |
| 0.9 | 2.6 | GO:0032495 | response to muramyl dipeptide(GO:0032495) |
| 0.9 | 1.7 | GO:0001975 | response to amphetamine(GO:0001975) |
| 0.9 | 0.9 | GO:1903300 | negative regulation of glucokinase activity(GO:0033132) negative regulation of hexokinase activity(GO:1903300) |
| 0.9 | 5.2 | GO:0042539 | hypotonic salinity response(GO:0042539) cellular hypotonic salinity response(GO:0071477) |
| 0.9 | 13.9 | GO:0006706 | steroid catabolic process(GO:0006706) |
| 0.9 | 3.5 | GO:0002677 | negative regulation of chronic inflammatory response(GO:0002677) negative regulation of chronic inflammatory response to non-antigenic stimulus(GO:0002881) |
| 0.9 | 13.0 | GO:0019373 | epoxygenase P450 pathway(GO:0019373) |
| 0.9 | 0.9 | GO:0048496 | maintenance of organ identity(GO:0048496) |
| 0.9 | 5.2 | GO:0014051 | gamma-aminobutyric acid secretion(GO:0014051) |
| 0.9 | 3.4 | GO:0034334 | adherens junction maintenance(GO:0034334) |
| 0.9 | 1.7 | GO:0046068 | cGMP metabolic process(GO:0046068) |
| 0.9 | 6.0 | GO:0006685 | sphingomyelin catabolic process(GO:0006685) |
| 0.9 | 3.4 | GO:0071802 | negative regulation of podosome assembly(GO:0071802) |
| 0.9 | 0.9 | GO:0097272 | ammonia homeostasis(GO:0097272) |
| 0.9 | 13.6 | GO:0030514 | negative regulation of BMP signaling pathway(GO:0030514) |
| 0.8 | 6.8 | GO:0090051 | negative regulation of cell migration involved in sprouting angiogenesis(GO:0090051) |
| 0.8 | 2.5 | GO:0030187 | melatonin metabolic process(GO:0030186) melatonin biosynthetic process(GO:0030187) |
| 0.8 | 12.6 | GO:0016576 | histone dephosphorylation(GO:0016576) |
| 0.8 | 15.9 | GO:0048753 | pigment granule organization(GO:0048753) |
| 0.8 | 6.7 | GO:0002726 | positive regulation of T cell cytokine production(GO:0002726) |
| 0.8 | 3.3 | GO:0051697 | protein delipidation(GO:0051697) |
| 0.8 | 10.0 | GO:0042136 | neurotransmitter biosynthetic process(GO:0042136) |
| 0.8 | 7.5 | GO:0034380 | high-density lipoprotein particle assembly(GO:0034380) |
| 0.8 | 4.1 | GO:1903025 | regulation of RNA polymerase II regulatory region sequence-specific DNA binding(GO:1903025) |
| 0.8 | 2.5 | GO:0045955 | negative regulation of calcium ion-dependent exocytosis(GO:0045955) |
| 0.8 | 5.8 | GO:0006776 | vitamin A metabolic process(GO:0006776) |
| 0.8 | 4.1 | GO:0035909 | aorta morphogenesis(GO:0035909) |
| 0.8 | 8.9 | GO:0009312 | oligosaccharide biosynthetic process(GO:0009312) |
| 0.8 | 1.6 | GO:0035641 | locomotory exploration behavior(GO:0035641) |
| 0.8 | 2.4 | GO:0009134 | nucleoside diphosphate catabolic process(GO:0009134) |
| 0.8 | 1.6 | GO:0033210 | leptin-mediated signaling pathway(GO:0033210) |
| 0.8 | 5.6 | GO:0009950 | dorsal/ventral axis specification(GO:0009950) |
| 0.8 | 5.6 | GO:0001672 | regulation of chromatin assembly or disassembly(GO:0001672) |
| 0.8 | 2.4 | GO:0050893 | sensory processing(GO:0050893) |
| 0.8 | 6.4 | GO:0017182 | peptidyl-diphthamide metabolic process(GO:0017182) peptidyl-diphthamide biosynthetic process from peptidyl-histidine(GO:0017183) |
| 0.8 | 0.8 | GO:2000389 | regulation of neutrophil extravasation(GO:2000389) |
| 0.8 | 43.9 | GO:1902476 | chloride transmembrane transport(GO:1902476) |
| 0.8 | 1.6 | GO:0090080 | positive regulation of MAPKKK cascade by fibroblast growth factor receptor signaling pathway(GO:0090080) |
| 0.8 | 4.0 | GO:0034384 | high-density lipoprotein particle clearance(GO:0034384) |
| 0.8 | 3.1 | GO:0034371 | chylomicron remodeling(GO:0034371) |
| 0.8 | 5.5 | GO:0006833 | water transport(GO:0006833) |
| 0.8 | 4.7 | GO:0071243 | cellular response to arsenic-containing substance(GO:0071243) |
| 0.8 | 1.6 | GO:0060830 | ciliary receptor clustering involved in smoothened signaling pathway(GO:0060830) |
| 0.8 | 7.0 | GO:0006972 | hyperosmotic response(GO:0006972) |
| 0.8 | 3.9 | GO:0021894 | cerebral cortex GABAergic interneuron differentiation(GO:0021892) cerebral cortex GABAergic interneuron development(GO:0021894) |
| 0.8 | 2.3 | GO:0032455 | nerve growth factor processing(GO:0032455) |
| 0.8 | 13.8 | GO:0098868 | bone growth(GO:0098868) |
| 0.8 | 35.2 | GO:0045600 | positive regulation of fat cell differentiation(GO:0045600) |
| 0.8 | 10.0 | GO:0044342 | type B pancreatic cell proliferation(GO:0044342) |
| 0.8 | 5.3 | GO:0048096 | chromatin-mediated maintenance of transcription(GO:0048096) |
| 0.8 | 3.8 | GO:1901862 | negative regulation of striated muscle tissue development(GO:0045843) negative regulation of muscle tissue development(GO:1901862) |
| 0.8 | 9.9 | GO:0006516 | glycoprotein catabolic process(GO:0006516) |
| 0.8 | 9.9 | GO:0048665 | neuron fate specification(GO:0048665) |
| 0.8 | 3.0 | GO:0006741 | NADP biosynthetic process(GO:0006741) |
| 0.8 | 3.0 | GO:0001820 | serotonin secretion(GO:0001820) |
| 0.7 | 59.2 | GO:0006958 | complement activation, classical pathway(GO:0006958) |
| 0.7 | 1.5 | GO:0002579 | positive regulation of antigen processing and presentation(GO:0002579) |
| 0.7 | 7.5 | GO:0060037 | pharyngeal system development(GO:0060037) |
| 0.7 | 9.0 | GO:0060956 | cardiac endothelial cell differentiation(GO:0003348) endocardial cell differentiation(GO:0060956) |
| 0.7 | 4.4 | GO:0051958 | methotrexate transport(GO:0051958) reduced folate transmembrane transport(GO:0098838) |
| 0.7 | 3.7 | GO:0072017 | distal tubule development(GO:0072017) |
| 0.7 | 3.7 | GO:0007398 | ectoderm development(GO:0007398) |
| 0.7 | 1.5 | GO:0034226 | lysine transport(GO:0015819) lysine import(GO:0034226) L-lysine import(GO:0061461) L-lysine transport(GO:1902022) L-lysine import into cell(GO:1903410) |
| 0.7 | 1.5 | GO:0046015 | regulation of transcription by glucose(GO:0046015) |
| 0.7 | 9.5 | GO:0070207 | protein homotrimerization(GO:0070207) |
| 0.7 | 2.2 | GO:2001204 | regulation of osteoclast development(GO:2001204) |
| 0.7 | 2.2 | GO:0061107 | seminal vesicle development(GO:0061107) |
| 0.7 | 4.3 | GO:0015886 | heme transport(GO:0015886) |
| 0.7 | 3.6 | GO:0031987 | locomotion involved in locomotory behavior(GO:0031987) |
| 0.7 | 0.7 | GO:0051531 | NFAT protein import into nucleus(GO:0051531) |
| 0.7 | 2.1 | GO:0015860 | purine nucleoside transmembrane transport(GO:0015860) |
| 0.7 | 6.4 | GO:0043374 | CD8-positive, alpha-beta T cell differentiation(GO:0043374) |
| 0.7 | 8.5 | GO:0045662 | negative regulation of myoblast differentiation(GO:0045662) |
| 0.7 | 11.3 | GO:0042340 | keratan sulfate catabolic process(GO:0042340) |
| 0.7 | 15.5 | GO:0039703 | viral RNA genome replication(GO:0039694) RNA replication(GO:0039703) |
| 0.7 | 20.3 | GO:0048268 | clathrin coat assembly(GO:0048268) |
| 0.7 | 11.2 | GO:0007196 | adenylate cyclase-inhibiting G-protein coupled glutamate receptor signaling pathway(GO:0007196) |
| 0.7 | 4.9 | GO:0070932 | histone H3 deacetylation(GO:0070932) |
| 0.7 | 6.9 | GO:0033235 | positive regulation of protein sumoylation(GO:0033235) |
| 0.7 | 38.8 | GO:0006501 | C-terminal protein lipidation(GO:0006501) |
| 0.7 | 2.1 | GO:0003366 | cell-matrix adhesion involved in ameboidal cell migration(GO:0003366) |
| 0.7 | 1.4 | GO:0090034 | regulation of chaperone-mediated protein complex assembly(GO:0090034) positive regulation of chaperone-mediated protein complex assembly(GO:0090035) |
| 0.7 | 8.3 | GO:0050650 | chondroitin sulfate proteoglycan biosynthetic process(GO:0050650) |
| 0.7 | 6.9 | GO:0032463 | negative regulation of protein homooligomerization(GO:0032463) |
| 0.7 | 3.4 | GO:0006127 | glycerophosphate shuttle(GO:0006127) |
| 0.7 | 2.1 | GO:0031627 | telomeric loop formation(GO:0031627) |
| 0.7 | 2.7 | GO:0047484 | regulation of response to osmotic stress(GO:0047484) |
| 0.7 | 0.7 | GO:0060474 | positive regulation of sperm motility involved in capacitation(GO:0060474) |
| 0.7 | 3.4 | GO:0007619 | courtship behavior(GO:0007619) negative regulation of female receptivity(GO:0007621) female courtship behavior(GO:0008050) |
| 0.7 | 6.1 | GO:0006975 | DNA damage induced protein phosphorylation(GO:0006975) |
| 0.7 | 2.0 | GO:0002158 | osteoclast proliferation(GO:0002158) |
| 0.7 | 1.4 | GO:1905064 | negative regulation of vascular smooth muscle cell differentiation(GO:1905064) |
| 0.7 | 17.6 | GO:0046473 | phosphatidic acid metabolic process(GO:0046473) |
| 0.7 | 6.1 | GO:0035855 | megakaryocyte development(GO:0035855) |
| 0.7 | 4.7 | GO:0051898 | negative regulation of protein kinase B signaling(GO:0051898) |
| 0.7 | 1.3 | GO:1900228 | biofilm formation(GO:0042710) single-species biofilm formation(GO:0044010) single-species biofilm formation in or on host organism(GO:0044407) regulation of single-species biofilm formation(GO:1900190) negative regulation of single-species biofilm formation(GO:1900191) regulation of single-species biofilm formation in or on host organism(GO:1900228) negative regulation of single-species biofilm formation in or on host organism(GO:1900229) |
| 0.7 | 1.3 | GO:0097211 | response to gonadotropin-releasing hormone(GO:0097210) cellular response to gonadotropin-releasing hormone(GO:0097211) |
| 0.7 | 4.0 | GO:0007042 | lysosomal lumen acidification(GO:0007042) |
| 0.7 | 11.3 | GO:0001825 | blastocyst formation(GO:0001825) |
| 0.7 | 15.9 | GO:0016338 | calcium-independent cell-cell adhesion via plasma membrane cell-adhesion molecules(GO:0016338) |
| 0.7 | 9.9 | GO:1902373 | negative regulation of mRNA catabolic process(GO:1902373) |
| 0.7 | 2.0 | GO:0097152 | mesenchymal cell apoptotic process(GO:0097152) |
| 0.7 | 2.0 | GO:0045903 | positive regulation of translational fidelity(GO:0045903) |
| 0.7 | 2.0 | GO:0071361 | cellular response to ethanol(GO:0071361) |
| 0.7 | 34.9 | GO:0006968 | cellular defense response(GO:0006968) |
| 0.7 | 1.3 | GO:0060155 | platelet dense granule organization(GO:0060155) |
| 0.7 | 2.0 | GO:0038163 | thrombopoietin-mediated signaling pathway(GO:0038163) |
| 0.7 | 7.8 | GO:0055003 | cardiac myofibril assembly(GO:0055003) |
| 0.7 | 5.9 | GO:0050771 | negative regulation of axonogenesis(GO:0050771) |
| 0.7 | 4.6 | GO:0005513 | detection of calcium ion(GO:0005513) |
| 0.7 | 2.6 | GO:1904381 | Golgi apparatus mannose trimming(GO:1904381) |
| 0.6 | 29.9 | GO:0050853 | B cell receptor signaling pathway(GO:0050853) |
| 0.6 | 24.6 | GO:0010811 | positive regulation of cell-substrate adhesion(GO:0010811) |
| 0.6 | 9.7 | GO:0070306 | lens fiber cell differentiation(GO:0070306) |
| 0.6 | 5.2 | GO:0097094 | craniofacial suture morphogenesis(GO:0097094) |
| 0.6 | 0.6 | GO:0010760 | negative regulation of macrophage chemotaxis(GO:0010760) |
| 0.6 | 3.2 | GO:0030070 | insulin processing(GO:0030070) |
| 0.6 | 1.9 | GO:0035934 | corticosterone secretion(GO:0035934) regulation of corticosterone secretion(GO:2000852) |
| 0.6 | 2.5 | GO:0032929 | negative regulation of superoxide anion generation(GO:0032929) |
| 0.6 | 1.9 | GO:0007635 | chemosensory behavior(GO:0007635) |
| 0.6 | 2.5 | GO:1990403 | embryonic brain development(GO:1990403) |
| 0.6 | 3.8 | GO:0015695 | organic cation transport(GO:0015695) |
| 0.6 | 18.1 | GO:0043268 | positive regulation of potassium ion transport(GO:0043268) |
| 0.6 | 3.1 | GO:0030851 | granulocyte differentiation(GO:0030851) |
| 0.6 | 13.7 | GO:0008214 | protein demethylation(GO:0006482) protein dealkylation(GO:0008214) |
| 0.6 | 3.1 | GO:0033058 | directional locomotion(GO:0033058) |
| 0.6 | 4.3 | GO:0030539 | male genitalia development(GO:0030539) |
| 0.6 | 1.2 | GO:0035811 | negative regulation of urine volume(GO:0035811) |
| 0.6 | 3.7 | GO:0010623 | programmed cell death involved in cell development(GO:0010623) |
| 0.6 | 51.2 | GO:0090630 | activation of GTPase activity(GO:0090630) |
| 0.6 | 6.7 | GO:0007193 | adenylate cyclase-inhibiting G-protein coupled receptor signaling pathway(GO:0007193) |
| 0.6 | 7.3 | GO:0016191 | synaptic vesicle uncoating(GO:0016191) |
| 0.6 | 1.8 | GO:0032713 | negative regulation of interleukin-4 production(GO:0032713) |
| 0.6 | 8.4 | GO:0014850 | response to muscle activity(GO:0014850) |
| 0.6 | 2.4 | GO:0044557 | relaxation of smooth muscle(GO:0044557) |
| 0.6 | 20.4 | GO:0071377 | cellular response to glucagon stimulus(GO:0071377) |
| 0.6 | 3.6 | GO:0044341 | sodium-dependent phosphate transport(GO:0044341) |
| 0.6 | 2.4 | GO:0061668 | mitochondrial ribosome assembly(GO:0061668) mitochondrial large ribosomal subunit assembly(GO:1902775) |
| 0.6 | 11.9 | GO:1904778 | regulation of protein localization to cell cortex(GO:1904776) positive regulation of protein localization to cell cortex(GO:1904778) |
| 0.6 | 14.3 | GO:0031018 | endocrine pancreas development(GO:0031018) |
| 0.6 | 3.0 | GO:0046167 | glycerol-3-phosphate biosynthetic process(GO:0046167) |
| 0.6 | 7.1 | GO:0042940 | D-amino acid transport(GO:0042940) |
| 0.6 | 1.2 | GO:0035136 | forelimb morphogenesis(GO:0035136) |
| 0.6 | 2.9 | GO:2000672 | negative regulation of motor neuron apoptotic process(GO:2000672) |
| 0.6 | 25.5 | GO:0030574 | collagen catabolic process(GO:0030574) |
| 0.6 | 2.9 | GO:0010935 | regulation of macrophage cytokine production(GO:0010935) |
| 0.6 | 6.2 | GO:0007140 | male meiosis(GO:0007140) |
| 0.6 | 1.7 | GO:0033211 | adiponectin-activated signaling pathway(GO:0033211) |
| 0.6 | 5.6 | GO:0043011 | myeloid dendritic cell differentiation(GO:0043011) |
| 0.6 | 1.1 | GO:0001964 | startle response(GO:0001964) |
| 0.6 | 1.7 | GO:0060052 | neurofilament cytoskeleton organization(GO:0060052) |
| 0.6 | 0.6 | GO:0051683 | establishment of Golgi localization(GO:0051683) |
| 0.5 | 5.5 | GO:0019372 | lipoxygenase pathway(GO:0019372) |
| 0.5 | 14.2 | GO:0007528 | neuromuscular junction development(GO:0007528) |
| 0.5 | 3.3 | GO:0007256 | activation of JNKK activity(GO:0007256) |
| 0.5 | 7.1 | GO:0051703 | social behavior(GO:0035176) intraspecies interaction between organisms(GO:0051703) |
| 0.5 | 1.6 | GO:0052330 | induction of programmed cell death(GO:0012502) positive regulation of apoptotic process in other organism(GO:0044533) positive regulation by symbiont of host programmed cell death(GO:0052042) positive regulation by organism of programmed cell death in other organism involved in symbiotic interaction(GO:0052330) positive regulation by organism of apoptotic process in other organism involved in symbiotic interaction(GO:0052501) |
| 0.5 | 2.2 | GO:0071257 | cellular response to electrical stimulus(GO:0071257) |
| 0.5 | 1.6 | GO:0030238 | male sex determination(GO:0030238) |
| 0.5 | 10.8 | GO:0050912 | detection of chemical stimulus involved in sensory perception of taste(GO:0050912) |
| 0.5 | 4.8 | GO:1901387 | positive regulation of voltage-gated calcium channel activity(GO:1901387) |
| 0.5 | 2.1 | GO:0045657 | positive regulation of monocyte differentiation(GO:0045657) |
| 0.5 | 1.1 | GO:0016024 | CDP-diacylglycerol biosynthetic process(GO:0016024) |
| 0.5 | 1.6 | GO:0045348 | positive regulation of MHC class II biosynthetic process(GO:0045348) |
| 0.5 | 4.2 | GO:0009642 | response to light intensity(GO:0009642) |
| 0.5 | 1.1 | GO:0050747 | positive regulation of lipoprotein metabolic process(GO:0050747) |
| 0.5 | 7.3 | GO:1904714 | regulation of chaperone-mediated autophagy(GO:1904714) |
| 0.5 | 2.1 | GO:0042796 | snRNA transcription from RNA polymerase III promoter(GO:0042796) |
| 0.5 | 4.2 | GO:0034058 | endosomal vesicle fusion(GO:0034058) |
| 0.5 | 4.2 | GO:0071493 | cellular response to UV-B(GO:0071493) |
| 0.5 | 7.8 | GO:0043113 | receptor clustering(GO:0043113) |
| 0.5 | 4.2 | GO:2000505 | regulation of energy homeostasis(GO:2000505) |
| 0.5 | 4.1 | GO:0021533 | cell differentiation in hindbrain(GO:0021533) |
| 0.5 | 6.7 | GO:0035249 | synaptic transmission, glutamatergic(GO:0035249) |
| 0.5 | 2.6 | GO:0051567 | histone H3-K9 methylation(GO:0051567) |
| 0.5 | 1.0 | GO:0007525 | somatic muscle development(GO:0007525) |
| 0.5 | 0.5 | GO:0014734 | skeletal muscle hypertrophy(GO:0014734) |
| 0.5 | 6.1 | GO:0019852 | L-ascorbic acid metabolic process(GO:0019852) |
| 0.5 | 7.6 | GO:0014029 | neural crest formation(GO:0014029) |
| 0.5 | 1.5 | GO:0098937 | dendritic transport(GO:0098935) anterograde dendritic transport(GO:0098937) |
| 0.5 | 1.5 | GO:0010874 | regulation of cholesterol efflux(GO:0010874) |
| 0.5 | 2.0 | GO:1900452 | regulation of long term synaptic depression(GO:1900452) |
| 0.5 | 3.5 | GO:2000096 | positive regulation of Wnt signaling pathway, planar cell polarity pathway(GO:2000096) |
| 0.5 | 3.0 | GO:0042756 | drinking behavior(GO:0042756) |
| 0.5 | 9.4 | GO:0045747 | positive regulation of Notch signaling pathway(GO:0045747) |
| 0.5 | 2.0 | GO:0046952 | ketone body catabolic process(GO:0046952) |
| 0.5 | 2.4 | GO:0016139 | glycoside catabolic process(GO:0016139) |
| 0.5 | 6.4 | GO:0016558 | protein import into peroxisome matrix(GO:0016558) |
| 0.5 | 0.5 | GO:0032058 | positive regulation of translational initiation in response to stress(GO:0032058) |
| 0.5 | 4.3 | GO:0048003 | antigen processing and presentation of lipid antigen via MHC class Ib(GO:0048003) antigen processing and presentation, exogenous lipid antigen via MHC class Ib(GO:0048007) |
| 0.5 | 1.9 | GO:0032754 | positive regulation of interleukin-5 production(GO:0032754) |
| 0.5 | 1.4 | GO:0042412 | taurine biosynthetic process(GO:0042412) |
| 0.5 | 3.8 | GO:0090036 | regulation of protein kinase C signaling(GO:0090036) |
| 0.5 | 2.8 | GO:0003197 | endocardial cushion development(GO:0003197) |
| 0.5 | 5.6 | GO:0003170 | heart valve development(GO:0003170) |
| 0.5 | 2.8 | GO:0010216 | maintenance of DNA methylation(GO:0010216) histone H2B conserved C-terminal lysine deubiquitination(GO:0035616) |
| 0.5 | 2.8 | GO:0061088 | regulation of sequestering of zinc ion(GO:0061088) |
| 0.5 | 6.1 | GO:0031293 | membrane protein intracellular domain proteolysis(GO:0031293) |
| 0.5 | 1.9 | GO:0006691 | leukotriene metabolic process(GO:0006691) |
| 0.5 | 2.8 | GO:0030575 | nuclear body organization(GO:0030575) |
| 0.5 | 1.4 | GO:0007320 | insemination(GO:0007320) |
| 0.5 | 2.3 | GO:0050774 | negative regulation of dendrite morphogenesis(GO:0050774) |
| 0.5 | 1.4 | GO:0042819 | pyridoxine metabolic process(GO:0008614) pyridoxine biosynthetic process(GO:0008615) vitamin B6 biosynthetic process(GO:0042819) |
| 0.4 | 1.3 | GO:0035871 | protein K11-linked deubiquitination(GO:0035871) |
| 0.4 | 2.2 | GO:0033147 | negative regulation of intracellular estrogen receptor signaling pathway(GO:0033147) |
| 0.4 | 3.1 | GO:0009128 | purine nucleoside monophosphate catabolic process(GO:0009128) |
| 0.4 | 10.4 | GO:0030279 | negative regulation of ossification(GO:0030279) |
| 0.4 | 6.4 | GO:0014032 | neural crest cell development(GO:0014032) |
| 0.4 | 0.9 | GO:0060373 | regulation of ventricular cardiac muscle cell membrane depolarization(GO:0060373) |
| 0.4 | 8.9 | GO:1901186 | positive regulation of ERBB signaling pathway(GO:1901186) |
| 0.4 | 3.8 | GO:0060976 | coronary vasculature development(GO:0060976) |
| 0.4 | 14.7 | GO:0071277 | cellular response to calcium ion(GO:0071277) |
| 0.4 | 12.2 | GO:0010107 | potassium ion import(GO:0010107) |
| 0.4 | 2.1 | GO:0015812 | gamma-aminobutyric acid transport(GO:0015812) |
| 0.4 | 0.4 | GO:0021562 | vestibulocochlear nerve development(GO:0021562) |
| 0.4 | 2.8 | GO:0035095 | behavioral response to nicotine(GO:0035095) |
| 0.4 | 3.2 | GO:0070528 | protein kinase C signaling(GO:0070528) |
| 0.4 | 1.6 | GO:0051694 | pointed-end actin filament capping(GO:0051694) |
| 0.4 | 13.3 | GO:0042472 | inner ear morphogenesis(GO:0042472) |
| 0.4 | 1.6 | GO:0044804 | nucleophagy(GO:0044804) |
| 0.4 | 1.6 | GO:2001013 | epithelial cell proliferation involved in renal tubule morphogenesis(GO:2001013) |
| 0.4 | 0.8 | GO:0002577 | regulation of antigen processing and presentation(GO:0002577) |
| 0.4 | 1.6 | GO:2000158 | positive regulation of ubiquitin-specific protease activity(GO:2000158) |
| 0.4 | 2.8 | GO:0072338 | creatinine metabolic process(GO:0046449) cellular lactam metabolic process(GO:0072338) |
| 0.4 | 3.2 | GO:0006013 | mannose metabolic process(GO:0006013) |
| 0.4 | 3.6 | GO:0048298 | positive regulation of isotype switching to IgA isotypes(GO:0048298) |
| 0.4 | 2.7 | GO:0035457 | cellular response to interferon-alpha(GO:0035457) |
| 0.4 | 2.3 | GO:0002291 | T cell activation via T cell receptor contact with antigen bound to MHC molecule on antigen presenting cell(GO:0002291) |
| 0.4 | 2.7 | GO:0046320 | regulation of fatty acid oxidation(GO:0046320) |
| 0.4 | 1.9 | GO:0001865 | NK T cell differentiation(GO:0001865) |
| 0.4 | 2.3 | GO:0071421 | manganese ion transmembrane transport(GO:0071421) |
| 0.4 | 0.8 | GO:0042441 | eye pigment biosynthetic process(GO:0006726) eye pigment metabolic process(GO:0042441) pigment metabolic process involved in developmental pigmentation(GO:0043324) pigment metabolic process involved in pigmentation(GO:0043474) |
| 0.4 | 0.8 | GO:0006258 | UDP-glucose catabolic process(GO:0006258) |
| 0.4 | 0.7 | GO:1902358 | sulfate transmembrane transport(GO:1902358) |
| 0.4 | 1.5 | GO:2000050 | regulation of non-canonical Wnt signaling pathway(GO:2000050) positive regulation of non-canonical Wnt signaling pathway(GO:2000052) |
| 0.4 | 2.9 | GO:0015871 | choline transport(GO:0015871) |
| 0.4 | 3.6 | GO:0038065 | collagen-activated signaling pathway(GO:0038065) |
| 0.4 | 3.6 | GO:0086010 | membrane depolarization during action potential(GO:0086010) |
| 0.4 | 2.5 | GO:0098703 | calcium ion import across plasma membrane(GO:0098703) calcium ion import into cell(GO:1990035) |
| 0.4 | 1.1 | GO:0008343 | adult feeding behavior(GO:0008343) |
| 0.4 | 1.8 | GO:0042448 | progesterone metabolic process(GO:0042448) |
| 0.4 | 2.5 | GO:0043950 | positive regulation of cAMP-mediated signaling(GO:0043950) |
| 0.4 | 1.8 | GO:0060736 | prostate gland growth(GO:0060736) |
| 0.4 | 1.1 | GO:0090074 | negative regulation of protein homodimerization activity(GO:0090074) |
| 0.4 | 2.8 | GO:0019262 | N-acetylneuraminate catabolic process(GO:0019262) |
| 0.4 | 6.0 | GO:0007158 | neuron cell-cell adhesion(GO:0007158) |
| 0.3 | 1.0 | GO:0038031 | non-canonical Wnt signaling pathway via JNK cascade(GO:0038031) |
| 0.3 | 0.7 | GO:0060268 | negative regulation of respiratory burst(GO:0060268) |
| 0.3 | 3.7 | GO:1900449 | regulation of glutamate receptor signaling pathway(GO:1900449) |
| 0.3 | 0.7 | GO:0090594 | wound healing involved in inflammatory response(GO:0002246) muscle hyperplasia(GO:0014900) inflammatory response to wounding(GO:0090594) |
| 0.3 | 4.1 | GO:0050927 | positive regulation of positive chemotaxis(GO:0050927) |
| 0.3 | 2.0 | GO:0035562 | negative regulation of chromatin binding(GO:0035562) |
| 0.3 | 0.7 | GO:0060017 | parathyroid gland development(GO:0060017) |
| 0.3 | 0.7 | GO:0044351 | macropinocytosis(GO:0044351) |
| 0.3 | 2.0 | GO:0006689 | ganglioside catabolic process(GO:0006689) |
| 0.3 | 3.0 | GO:0050982 | detection of mechanical stimulus(GO:0050982) |
| 0.3 | 3.7 | GO:0042572 | retinol metabolic process(GO:0042572) |
| 0.3 | 4.3 | GO:0006449 | regulation of translational termination(GO:0006449) |
| 0.3 | 0.3 | GO:0061110 | dense core granule biogenesis(GO:0061110) regulation of dense core granule biogenesis(GO:2000705) |
| 0.3 | 1.6 | GO:0014067 | negative regulation of phosphatidylinositol 3-kinase signaling(GO:0014067) |
| 0.3 | 1.6 | GO:0006772 | thiamine metabolic process(GO:0006772) |
| 0.3 | 4.2 | GO:0018298 | protein-chromophore linkage(GO:0018298) |
| 0.3 | 1.0 | GO:0061536 | glycine secretion(GO:0061536) glycine secretion, neurotransmission(GO:0061537) |
| 0.3 | 12.6 | GO:1904837 | beta-catenin-TCF complex assembly(GO:1904837) |
| 0.3 | 0.3 | GO:0006004 | fucose metabolic process(GO:0006004) |
| 0.3 | 0.3 | GO:0036342 | post-anal tail morphogenesis(GO:0036342) |
| 0.3 | 1.6 | GO:0010831 | positive regulation of myotube differentiation(GO:0010831) positive regulation of myoblast fusion(GO:1901741) |
| 0.3 | 3.5 | GO:0042407 | cristae formation(GO:0042407) |
| 0.3 | 9.2 | GO:0007368 | determination of left/right symmetry(GO:0007368) |
| 0.3 | 9.1 | GO:1901343 | negative regulation of vasculature development(GO:1901343) |
| 0.3 | 11.0 | GO:0007218 | neuropeptide signaling pathway(GO:0007218) |
| 0.3 | 1.6 | GO:0034505 | tooth mineralization(GO:0034505) |
| 0.3 | 1.5 | GO:0010226 | response to lithium ion(GO:0010226) |
| 0.3 | 3.4 | GO:0006032 | chitin metabolic process(GO:0006030) chitin catabolic process(GO:0006032) glucosamine-containing compound catabolic process(GO:1901072) |
| 0.3 | 2.4 | GO:0035878 | nail development(GO:0035878) |
| 0.3 | 2.8 | GO:0051895 | negative regulation of focal adhesion assembly(GO:0051895) |
| 0.3 | 0.3 | GO:0019376 | galactolipid catabolic process(GO:0019376) |
| 0.3 | 7.8 | GO:0007274 | neuromuscular synaptic transmission(GO:0007274) |
| 0.3 | 1.5 | GO:1990845 | adaptive thermogenesis(GO:1990845) |
| 0.3 | 1.5 | GO:0038180 | nerve growth factor signaling pathway(GO:0038180) |
| 0.3 | 0.9 | GO:1902310 | positive regulation of peptidyl-serine dephosphorylation(GO:1902310) |
| 0.3 | 4.6 | GO:1903859 | regulation of dendrite extension(GO:1903859) |
| 0.3 | 0.9 | GO:0034378 | chylomicron assembly(GO:0034378) |
| 0.3 | 4.2 | GO:0010603 | regulation of cytoplasmic mRNA processing body assembly(GO:0010603) |
| 0.3 | 1.1 | GO:0060445 | branching involved in salivary gland morphogenesis(GO:0060445) |
| 0.3 | 9.0 | GO:0018149 | peptide cross-linking(GO:0018149) |
| 0.3 | 0.8 | GO:0070120 | ciliary neurotrophic factor-mediated signaling pathway(GO:0070120) |
| 0.3 | 1.7 | GO:1990822 | basic amino acid transmembrane transport(GO:1990822) |
| 0.3 | 2.5 | GO:0061154 | endothelial tube morphogenesis(GO:0061154) |
| 0.3 | 15.6 | GO:0018022 | peptidyl-lysine methylation(GO:0018022) |
| 0.3 | 6.8 | GO:0007257 | activation of JUN kinase activity(GO:0007257) |
| 0.3 | 0.8 | GO:0060766 | negative regulation of androgen receptor signaling pathway(GO:0060766) |
| 0.3 | 3.0 | GO:0009065 | glutamine family amino acid catabolic process(GO:0009065) |
| 0.3 | 3.5 | GO:0070072 | proton-transporting V-type ATPase complex assembly(GO:0070070) vacuolar proton-transporting V-type ATPase complex assembly(GO:0070072) |
| 0.3 | 0.5 | GO:0035754 | B cell chemotaxis(GO:0035754) |
| 0.3 | 1.0 | GO:0097237 | cellular response to toxic substance(GO:0097237) |
| 0.3 | 1.3 | GO:0014911 | positive regulation of smooth muscle cell migration(GO:0014911) |
| 0.2 | 0.2 | GO:0042249 | establishment of planar polarity of embryonic epithelium(GO:0042249) |
| 0.2 | 0.5 | GO:0002933 | lipid hydroxylation(GO:0002933) |
| 0.2 | 0.5 | GO:0045602 | negative regulation of endothelial cell differentiation(GO:0045602) |
| 0.2 | 0.7 | GO:0071440 | regulation of histone H3-K14 acetylation(GO:0071440) |
| 0.2 | 0.9 | GO:0098957 | anterograde axonal transport of mitochondrion(GO:0098957) |
| 0.2 | 3.2 | GO:0042133 | neurotransmitter metabolic process(GO:0042133) |
| 0.2 | 3.8 | GO:0032456 | endocytic recycling(GO:0032456) |
| 0.2 | 2.2 | GO:0006108 | malate metabolic process(GO:0006108) |
| 0.2 | 2.2 | GO:0008045 | motor neuron axon guidance(GO:0008045) |
| 0.2 | 2.0 | GO:0032094 | response to food(GO:0032094) |
| 0.2 | 8.4 | GO:0035773 | insulin secretion involved in cellular response to glucose stimulus(GO:0035773) |
| 0.2 | 0.6 | GO:0042090 | interleukin-12 biosynthetic process(GO:0042090) regulation of interleukin-12 biosynthetic process(GO:0045075) |
| 0.2 | 2.1 | GO:0072539 | T-helper 17 cell differentiation(GO:0072539) |
| 0.2 | 0.8 | GO:0006617 | SRP-dependent cotranslational protein targeting to membrane, signal sequence recognition(GO:0006617) |
| 0.2 | 2.4 | GO:0060008 | Sertoli cell differentiation(GO:0060008) |
| 0.2 | 2.4 | GO:0006688 | glycosphingolipid biosynthetic process(GO:0006688) |
| 0.2 | 5.9 | GO:0046545 | development of primary female sexual characteristics(GO:0046545) |
| 0.2 | 5.2 | GO:0043984 | histone H4-K16 acetylation(GO:0043984) |
| 0.2 | 1.6 | GO:0010944 | negative regulation of transcription by competitive promoter binding(GO:0010944) |
| 0.2 | 1.2 | GO:0046640 | regulation of alpha-beta T cell proliferation(GO:0046640) |
| 0.2 | 2.2 | GO:0035435 | phosphate ion transmembrane transport(GO:0035435) |
| 0.2 | 1.8 | GO:0045717 | negative regulation of fatty acid biosynthetic process(GO:0045717) |
| 0.2 | 0.6 | GO:0044320 | cellular response to leptin stimulus(GO:0044320) |
| 0.2 | 6.6 | GO:0006687 | glycosphingolipid metabolic process(GO:0006687) |
| 0.2 | 4.6 | GO:0042475 | odontogenesis of dentin-containing tooth(GO:0042475) |
| 0.2 | 2.5 | GO:0032024 | positive regulation of insulin secretion(GO:0032024) |
| 0.2 | 6.1 | GO:0034067 | protein localization to Golgi apparatus(GO:0034067) |
| 0.2 | 6.3 | GO:0001578 | microtubule bundle formation(GO:0001578) |
| 0.2 | 92.6 | GO:0043547 | positive regulation of GTPase activity(GO:0043547) |
| 0.2 | 0.4 | GO:0015824 | proline transport(GO:0015824) |
| 0.2 | 1.3 | GO:0070296 | sarcoplasmic reticulum calcium ion transport(GO:0070296) |
| 0.2 | 1.6 | GO:0030252 | growth hormone secretion(GO:0030252) |
| 0.2 | 0.4 | GO:1903378 | positive regulation of oxidative stress-induced neuron death(GO:1903223) positive regulation of oxidative stress-induced neuron intrinsic apoptotic signaling pathway(GO:1903378) |
| 0.2 | 0.5 | GO:1901994 | meiotic cell cycle phase transition(GO:0044771) regulation of meiotic cell cycle phase transition(GO:1901993) negative regulation of meiotic cell cycle phase transition(GO:1901994) |
| 0.2 | 0.2 | GO:0019918 | peptidyl-arginine methylation, to symmetrical-dimethyl arginine(GO:0019918) |
| 0.2 | 2.2 | GO:0030277 | maintenance of gastrointestinal epithelium(GO:0030277) |
| 0.2 | 0.5 | GO:0006705 | mineralocorticoid biosynthetic process(GO:0006705) mineralocorticoid metabolic process(GO:0008212) |
| 0.2 | 0.3 | GO:0010894 | negative regulation of steroid biosynthetic process(GO:0010894) |
| 0.2 | 0.6 | GO:0045065 | cytotoxic T cell differentiation(GO:0045065) |
| 0.1 | 0.7 | GO:0055091 | phospholipid homeostasis(GO:0055091) |
| 0.1 | 1.0 | GO:0006572 | tyrosine catabolic process(GO:0006572) |
| 0.1 | 1.0 | GO:0002430 | complement receptor mediated signaling pathway(GO:0002430) |
| 0.1 | 0.9 | GO:0060330 | regulation of response to interferon-gamma(GO:0060330) |
| 0.1 | 1.7 | GO:0010762 | regulation of fibroblast migration(GO:0010762) |
| 0.1 | 0.8 | GO:0032324 | Mo-molybdopterin cofactor biosynthetic process(GO:0006777) Mo-molybdopterin cofactor metabolic process(GO:0019720) molybdopterin cofactor biosynthetic process(GO:0032324) molybdopterin cofactor metabolic process(GO:0043545) prosthetic group metabolic process(GO:0051189) |
| 0.1 | 1.9 | GO:0046710 | GDP metabolic process(GO:0046710) |
| 0.1 | 6.1 | GO:0010923 | negative regulation of phosphatase activity(GO:0010923) |
| 0.1 | 0.6 | GO:0010182 | carbohydrate mediated signaling(GO:0009756) hexose mediated signaling(GO:0009757) sugar mediated signaling pathway(GO:0010182) glucose mediated signaling pathway(GO:0010255) regulation of glucose mediated signaling pathway(GO:1902659) |
| 0.1 | 0.7 | GO:0008218 | bioluminescence(GO:0008218) |
| 0.1 | 0.2 | GO:0009256 | 10-formyltetrahydrofolate metabolic process(GO:0009256) |
| 0.1 | 1.8 | GO:0097435 | fibril organization(GO:0097435) |
| 0.1 | 0.3 | GO:0060748 | tertiary branching involved in mammary gland duct morphogenesis(GO:0060748) |
| 0.1 | 2.6 | GO:0006024 | aminoglycan biosynthetic process(GO:0006023) glycosaminoglycan biosynthetic process(GO:0006024) |
| 0.1 | 1.4 | GO:0007340 | acrosome reaction(GO:0007340) |
| 0.1 | 0.6 | GO:0010842 | retina layer formation(GO:0010842) |
| 0.1 | 0.2 | GO:0038165 | oncostatin-M-mediated signaling pathway(GO:0038165) |
| 0.1 | 0.3 | GO:0060215 | primitive hemopoiesis(GO:0060215) |
| 0.1 | 0.5 | GO:0032287 | peripheral nervous system myelin maintenance(GO:0032287) |
| 0.1 | 1.0 | GO:0002115 | store-operated calcium entry(GO:0002115) |
| 0.1 | 0.3 | GO:0034088 | maintenance of sister chromatid cohesion(GO:0034086) maintenance of mitotic sister chromatid cohesion(GO:0034088) |
| 0.1 | 0.6 | GO:0006703 | estrogen biosynthetic process(GO:0006703) |
| 0.1 | 0.5 | GO:0044872 | lipoprotein transport(GO:0042953) lipoprotein localization(GO:0044872) |
| 0.1 | 0.1 | GO:0010726 | positive regulation of hydrogen peroxide metabolic process(GO:0010726) |
| 0.1 | 0.5 | GO:0016082 | synaptic vesicle priming(GO:0016082) |
| 0.1 | 0.4 | GO:0018401 | peptidyl-proline hydroxylation to 4-hydroxy-L-proline(GO:0018401) |
| 0.1 | 0.7 | GO:0033139 | regulation of peptidyl-serine phosphorylation of STAT protein(GO:0033139) |
| 0.1 | 0.2 | GO:0021796 | cerebral cortex regionalization(GO:0021796) |
| 0.1 | 0.3 | GO:0031022 | nuclear migration along microfilament(GO:0031022) |
| 0.0 | 0.0 | GO:0060897 | neural plate regionalization(GO:0060897) |
| 0.0 | 0.6 | GO:0031670 | cellular response to nutrient(GO:0031670) |
| 0.0 | 0.0 | GO:0046519 | sphingoid metabolic process(GO:0046519) |
| 0.0 | 0.1 | GO:1901099 | negative regulation of signal transduction in absence of ligand(GO:1901099) negative regulation of extrinsic apoptotic signaling pathway in absence of ligand(GO:2001240) |
| 0.0 | 0.4 | GO:0003334 | keratinocyte development(GO:0003334) |
| 0.0 | 0.3 | GO:0035493 | SNARE complex assembly(GO:0035493) |
| 0.0 | 0.3 | GO:0003373 | dynamin polymerization involved in membrane fission(GO:0003373) dynamin polymerization involved in mitochondrial fission(GO:0003374) |
| 0.0 | 0.7 | GO:0007585 | respiratory gaseous exchange(GO:0007585) |
| 0.0 | 0.1 | GO:0006535 | cysteine biosynthetic process from serine(GO:0006535) |
| 0.0 | 0.1 | GO:1903830 | magnesium ion transmembrane transport(GO:1903830) |
| 0.0 | 0.1 | GO:0042738 | exogenous drug catabolic process(GO:0042738) |
| 0.0 | 0.1 | GO:0007000 | nucleolus organization(GO:0007000) |
| 0.0 | 0.0 | GO:0006565 | L-serine catabolic process(GO:0006565) |
| 0.0 | 1.4 | GO:0050907 | detection of chemical stimulus involved in sensory perception(GO:0050907) |
Gene overrepresentation in cellular component category:
| Log-likelihood per target | Total log-likelihood | Term | Description |
|---|---|---|---|
| 14.8 | 59.4 | GO:0031838 | haptoglobin-hemoglobin complex(GO:0031838) |
| 8.8 | 8.8 | GO:0019034 | viral replication complex(GO:0019034) |
| 8.6 | 25.9 | GO:0044609 | DBIRD complex(GO:0044609) |
| 8.5 | 25.6 | GO:0097229 | sperm end piece(GO:0097229) |
| 8.3 | 66.6 | GO:1903439 | calcitonin family receptor complex(GO:1903439) amylin receptor complex(GO:1903440) |
| 7.8 | 69.9 | GO:0071953 | elastic fiber(GO:0071953) |
| 7.3 | 43.7 | GO:1990584 | cardiac Troponin complex(GO:1990584) |
| 7.1 | 21.4 | GO:0070701 | mucus layer(GO:0070701) |
| 6.9 | 20.8 | GO:0032437 | cuticular plate(GO:0032437) |
| 6.6 | 26.5 | GO:0034365 | discoidal high-density lipoprotein particle(GO:0034365) |
| 6.4 | 19.2 | GO:0036398 | TCR signalosome(GO:0036398) |
| 6.2 | 43.1 | GO:0030893 | meiotic cohesin complex(GO:0030893) |
| 6.1 | 6.1 | GO:0034681 | integrin alpha11-beta1 complex(GO:0034681) |
| 5.7 | 193.2 | GO:0032809 | neuronal cell body membrane(GO:0032809) cell body membrane(GO:0044298) |
| 5.6 | 11.1 | GO:0097208 | alveolar lamellar body(GO:0097208) |
| 5.4 | 16.2 | GO:0090571 | RNA polymerase II transcription repressor complex(GO:0090571) |
| 5.1 | 15.3 | GO:0097058 | CRLF-CLCF1 complex(GO:0097058) |
| 5.0 | 15.0 | GO:0071750 | dimeric IgA immunoglobulin complex(GO:0071750) secretory dimeric IgA immunoglobulin complex(GO:0071752) |
| 5.0 | 34.8 | GO:1990130 | Iml1 complex(GO:1990130) |
| 4.9 | 9.9 | GO:0016342 | catenin complex(GO:0016342) |
| 4.9 | 39.5 | GO:0033655 | host cell cytoplasm(GO:0030430) host cell cytoplasm part(GO:0033655) |
| 4.9 | 44.4 | GO:0000137 | Golgi cis cisterna(GO:0000137) |
| 4.6 | 23.2 | GO:0001652 | granular component(GO:0001652) |
| 4.6 | 41.1 | GO:0001520 | outer dense fiber(GO:0001520) |
| 4.5 | 31.7 | GO:1990745 | EARP complex(GO:1990745) |
| 4.5 | 112.2 | GO:0014731 | spectrin-associated cytoskeleton(GO:0014731) |
| 4.4 | 17.6 | GO:0008275 | gamma-tubulin small complex(GO:0008275) |
| 4.4 | 8.7 | GO:0071546 | pi-body(GO:0071546) |
| 4.3 | 12.8 | GO:0000333 | telomerase catalytic core complex(GO:0000333) |
| 4.3 | 12.8 | GO:1990597 | AIP1-IRE1 complex(GO:1990597) |
| 4.3 | 38.3 | GO:0033391 | chromatoid body(GO:0033391) |
| 4.1 | 20.5 | GO:0034688 | integrin alphaM-beta2 complex(GO:0034688) |
| 4.1 | 45.0 | GO:0033010 | paranodal junction(GO:0033010) |
| 4.0 | 11.9 | GO:0031085 | BLOC-3 complex(GO:0031085) |
| 4.0 | 11.9 | GO:0072563 | endothelial microparticle(GO:0072563) |
| 3.9 | 15.6 | GO:0005602 | complement component C1 complex(GO:0005602) |
| 3.9 | 62.1 | GO:0005890 | sodium:potassium-exchanging ATPase complex(GO:0005890) |
| 3.8 | 19.2 | GO:0031302 | intrinsic component of endosome membrane(GO:0031302) |
| 3.8 | 15.1 | GO:0070044 | synaptobrevin 2-SNAP-25-syntaxin-1a complex(GO:0070044) |
| 3.8 | 64.0 | GO:0042627 | chylomicron(GO:0042627) |
| 3.7 | 14.9 | GO:0032777 | Piccolo NuA4 histone acetyltransferase complex(GO:0032777) |
| 3.7 | 18.6 | GO:0008622 | epsilon DNA polymerase complex(GO:0008622) |
| 3.7 | 11.1 | GO:0098536 | deuterosome(GO:0098536) |
| 3.7 | 14.7 | GO:0033596 | TSC1-TSC2 complex(GO:0033596) |
| 3.6 | 180.3 | GO:0042571 | immunoglobulin complex, circulating(GO:0042571) |
| 3.6 | 14.4 | GO:0032144 | 4-aminobutyrate transaminase complex(GO:0032144) |
| 3.6 | 43.1 | GO:0016013 | syntrophin complex(GO:0016013) |
| 3.5 | 17.7 | GO:0032444 | activin responsive factor complex(GO:0032444) |
| 3.5 | 31.7 | GO:0090576 | RNA polymerase III transcription factor complex(GO:0090576) |
| 3.5 | 10.5 | GO:0065010 | extracellular membrane-bounded organelle(GO:0065010) |
| 3.4 | 34.2 | GO:0043190 | ATP-binding cassette (ABC) transporter complex(GO:0043190) |
| 3.4 | 13.4 | GO:0038039 | G-protein coupled receptor heterodimeric complex(GO:0038039) |
| 3.3 | 20.0 | GO:0033269 | internode region of axon(GO:0033269) |
| 3.3 | 19.8 | GO:0001940 | male pronucleus(GO:0001940) |
| 3.3 | 9.9 | GO:0043293 | apoptosome(GO:0043293) |
| 3.3 | 9.8 | GO:0030061 | mitochondrial crista(GO:0030061) |
| 3.2 | 6.3 | GO:0001939 | female pronucleus(GO:0001939) |
| 3.1 | 3.1 | GO:0060200 | clathrin-sculpted acetylcholine transport vesicle(GO:0060200) clathrin-sculpted acetylcholine transport vesicle membrane(GO:0060201) |
| 3.1 | 6.1 | GO:0030132 | clathrin coat of coated pit(GO:0030132) |
| 3.0 | 57.8 | GO:0042613 | MHC class II protein complex(GO:0042613) |
| 3.0 | 21.0 | GO:0032280 | symmetric synapse(GO:0032280) |
| 3.0 | 15.0 | GO:0005947 | mitochondrial alpha-ketoglutarate dehydrogenase complex(GO:0005947) |
| 3.0 | 3.0 | GO:0001741 | XY body(GO:0001741) |
| 2.9 | 38.1 | GO:0098647 | collagen type VI trimer(GO:0005589) collagen beaded filament(GO:0098647) |
| 2.9 | 26.2 | GO:0032010 | phagolysosome(GO:0032010) |
| 2.9 | 14.5 | GO:0036128 | CatSper complex(GO:0036128) |
| 2.9 | 14.5 | GO:0045160 | myosin I complex(GO:0045160) |
| 2.9 | 37.6 | GO:0034366 | spherical high-density lipoprotein particle(GO:0034366) |
| 2.9 | 17.4 | GO:0060203 | clathrin-sculpted glutamate transport vesicle(GO:0060199) clathrin-sculpted glutamate transport vesicle membrane(GO:0060203) |
| 2.9 | 14.4 | GO:1902937 | inward rectifier potassium channel complex(GO:1902937) |
| 2.9 | 22.8 | GO:0005593 | FACIT collagen trimer(GO:0005593) |
| 2.8 | 17.0 | GO:1990769 | proximal neuron projection(GO:1990769) |
| 2.8 | 39.0 | GO:0030123 | AP-3 adaptor complex(GO:0030123) |
| 2.8 | 8.3 | GO:0017071 | intracellular cyclic nucleotide activated cation channel complex(GO:0017071) |
| 2.7 | 13.6 | GO:0071439 | clathrin complex(GO:0071439) |
| 2.7 | 10.9 | GO:0097123 | cyclin A1-CDK2 complex(GO:0097123) |
| 2.7 | 32.3 | GO:0099634 | postsynaptic specialization membrane(GO:0099634) |
| 2.6 | 23.6 | GO:0044294 | dendritic growth cone(GO:0044294) |
| 2.6 | 39.2 | GO:0008074 | guanylate cyclase complex, soluble(GO:0008074) |
| 2.5 | 28.0 | GO:0043203 | axon hillock(GO:0043203) |
| 2.5 | 7.6 | GO:0034455 | t-UTP complex(GO:0034455) |
| 2.5 | 15.1 | GO:0044214 | spanning component of plasma membrane(GO:0044214) spanning component of membrane(GO:0089717) |
| 2.5 | 42.5 | GO:0032591 | dendritic spine membrane(GO:0032591) |
| 2.5 | 7.4 | GO:0099569 | cytoskeleton of presynaptic active zone(GO:0048788) presynaptic active zone cytoplasmic component(GO:0098831) presynaptic cytoskeleton(GO:0099569) |
| 2.5 | 4.9 | GO:0030669 | clathrin-coated endocytic vesicle membrane(GO:0030669) |
| 2.4 | 12.2 | GO:0072534 | perineuronal net(GO:0072534) |
| 2.4 | 34.1 | GO:0032045 | guanyl-nucleotide exchange factor complex(GO:0032045) |
| 2.4 | 29.2 | GO:0097512 | cardiac myofibril(GO:0097512) |
| 2.4 | 7.1 | GO:0031251 | PAN complex(GO:0031251) |
| 2.3 | 4.7 | GO:1990604 | IRE1-TRAF2-ASK1 complex(GO:1990604) |
| 2.3 | 4.6 | GO:0030314 | junctional membrane complex(GO:0030314) |
| 2.3 | 55.0 | GO:0005791 | rough endoplasmic reticulum(GO:0005791) |
| 2.3 | 11.3 | GO:1990031 | pinceau fiber(GO:1990031) |
| 2.3 | 11.3 | GO:0032449 | CBM complex(GO:0032449) |
| 2.2 | 18.0 | GO:0035976 | AP1 complex(GO:0035976) |
| 2.2 | 6.7 | GO:0005760 | gamma DNA polymerase complex(GO:0005760) |
| 2.2 | 19.8 | GO:0000813 | ESCRT I complex(GO:0000813) |
| 2.2 | 22.0 | GO:0005614 | interstitial matrix(GO:0005614) |
| 2.2 | 55.1 | GO:0001518 | voltage-gated sodium channel complex(GO:0001518) |
| 2.2 | 4.3 | GO:0044304 | main axon(GO:0044304) |
| 2.2 | 4.3 | GO:0030137 | COPI-coated vesicle(GO:0030137) |
| 2.1 | 10.6 | GO:0032807 | DNA ligase IV complex(GO:0032807) |
| 2.1 | 10.5 | GO:0019814 | immunoglobulin complex(GO:0019814) |
| 2.1 | 10.4 | GO:0072558 | NLRP1 inflammasome complex(GO:0072558) |
| 2.1 | 82.7 | GO:0005859 | muscle myosin complex(GO:0005859) |
| 2.1 | 10.3 | GO:0000138 | Golgi trans cisterna(GO:0000138) |
| 2.0 | 4.0 | GO:0044308 | axonal spine(GO:0044308) |
| 2.0 | 24.1 | GO:0097427 | microtubule bundle(GO:0097427) |
| 2.0 | 8.0 | GO:0070695 | FHF complex(GO:0070695) |
| 2.0 | 15.9 | GO:0000322 | storage vacuole(GO:0000322) |
| 2.0 | 19.6 | GO:0043194 | axon initial segment(GO:0043194) |
| 2.0 | 5.9 | GO:0005745 | m-AAA complex(GO:0005745) |
| 1.9 | 17.1 | GO:0070652 | HAUS complex(GO:0070652) |
| 1.9 | 13.2 | GO:0036157 | outer dynein arm(GO:0036157) |
| 1.9 | 24.4 | GO:0005833 | hemoglobin complex(GO:0005833) |
| 1.9 | 33.3 | GO:1990454 | L-type voltage-gated calcium channel complex(GO:1990454) |
| 1.8 | 7.3 | GO:1990851 | Wnt-Frizzled-LRP5/6 complex(GO:1990851) |
| 1.8 | 29.2 | GO:0035102 | PRC1 complex(GO:0035102) |
| 1.8 | 9.0 | GO:0031462 | Cul2-RING ubiquitin ligase complex(GO:0031462) |
| 1.8 | 5.4 | GO:0034751 | aryl hydrocarbon receptor complex(GO:0034751) |
| 1.8 | 14.3 | GO:0097425 | smooth endoplasmic reticulum membrane(GO:0030868) smooth endoplasmic reticulum part(GO:0097425) |
| 1.8 | 12.3 | GO:0030991 | intraciliary transport particle A(GO:0030991) |
| 1.7 | 5.2 | GO:0032589 | neuron projection membrane(GO:0032589) |
| 1.7 | 18.9 | GO:0070776 | H3 histone acetyltransferase complex(GO:0070775) MOZ/MORF histone acetyltransferase complex(GO:0070776) |
| 1.7 | 11.9 | GO:0042406 | extrinsic component of endoplasmic reticulum membrane(GO:0042406) |
| 1.7 | 13.4 | GO:0072487 | MSL complex(GO:0072487) |
| 1.7 | 11.7 | GO:0002116 | semaphorin receptor complex(GO:0002116) |
| 1.6 | 6.6 | GO:0002945 | cyclin K-CDK13 complex(GO:0002945) |
| 1.6 | 6.6 | GO:1990879 | CST complex(GO:1990879) |
| 1.6 | 113.7 | GO:0005581 | collagen trimer(GO:0005581) |
| 1.6 | 4.8 | GO:0034657 | GID complex(GO:0034657) |
| 1.6 | 7.9 | GO:0043527 | tRNA methyltransferase complex(GO:0043527) |
| 1.6 | 78.4 | GO:0033017 | sarcoplasmic reticulum membrane(GO:0033017) |
| 1.6 | 17.2 | GO:0031045 | dense core granule(GO:0031045) |
| 1.6 | 9.3 | GO:0005945 | 6-phosphofructokinase complex(GO:0005945) |
| 1.6 | 23.3 | GO:0031235 | intrinsic component of the cytoplasmic side of the plasma membrane(GO:0031235) |
| 1.6 | 21.7 | GO:0097440 | apical dendrite(GO:0097440) |
| 1.6 | 7.8 | GO:0070847 | core mediator complex(GO:0070847) |
| 1.5 | 6.2 | GO:0016328 | lateral plasma membrane(GO:0016328) |
| 1.5 | 12.3 | GO:0097433 | dense body(GO:0097433) |
| 1.5 | 4.6 | GO:0030312 | external encapsulating structure(GO:0030312) |
| 1.5 | 10.6 | GO:0032021 | NELF complex(GO:0032021) |
| 1.5 | 46.6 | GO:0016327 | apicolateral plasma membrane(GO:0016327) |
| 1.5 | 12.0 | GO:0032593 | insulin-responsive compartment(GO:0032593) |
| 1.5 | 22.4 | GO:0030478 | actin cap(GO:0030478) |
| 1.5 | 111.7 | GO:0099501 | synaptic vesicle membrane(GO:0030672) exocytic vesicle membrane(GO:0099501) |
| 1.4 | 4.3 | GO:0071062 | alphav-beta3 integrin-vitronectin complex(GO:0071062) |
| 1.4 | 4.3 | GO:0031933 | telomeric heterochromatin(GO:0031933) |
| 1.4 | 12.7 | GO:1990761 | growth cone lamellipodium(GO:1990761) |
| 1.4 | 8.5 | GO:1990682 | CSF1-CSF1R complex(GO:1990682) |
| 1.4 | 2.8 | GO:1990393 | 3M complex(GO:1990393) |
| 1.4 | 22.4 | GO:0097225 | sperm midpiece(GO:0097225) |
| 1.4 | 26.5 | GO:0036038 | MKS complex(GO:0036038) |
| 1.4 | 8.3 | GO:0033553 | rDNA heterochromatin(GO:0033553) |
| 1.4 | 12.3 | GO:0045180 | basal cortex(GO:0045180) |
| 1.3 | 32.3 | GO:0031093 | platelet alpha granule lumen(GO:0031093) |
| 1.3 | 7.9 | GO:0033063 | DNA recombinase mediator complex(GO:0033061) Rad51B-Rad51C-Rad51D-XRCC2 complex(GO:0033063) |
| 1.3 | 6.5 | GO:0044224 | juxtaparanode region of axon(GO:0044224) |
| 1.3 | 96.1 | GO:0005930 | axoneme(GO:0005930) ciliary plasm(GO:0097014) |
| 1.3 | 10.3 | GO:0030891 | VCB complex(GO:0030891) |
| 1.3 | 42.6 | GO:0016592 | mediator complex(GO:0016592) |
| 1.3 | 5.1 | GO:0035363 | histone locus body(GO:0035363) |
| 1.3 | 57.7 | GO:0005891 | voltage-gated calcium channel complex(GO:0005891) |
| 1.3 | 2.5 | GO:0097025 | MPP7-DLG1-LIN7 complex(GO:0097025) |
| 1.3 | 7.6 | GO:0032391 | photoreceptor connecting cilium(GO:0032391) |
| 1.3 | 22.8 | GO:0097386 | glial cell projection(GO:0097386) |
| 1.3 | 41.7 | GO:0001917 | photoreceptor inner segment(GO:0001917) |
| 1.3 | 12.6 | GO:0046581 | intercellular canaliculus(GO:0046581) |
| 1.3 | 8.8 | GO:0070436 | Grb2-EGFR complex(GO:0070436) |
| 1.2 | 6.2 | GO:0005896 | interleukin-6 receptor complex(GO:0005896) |
| 1.2 | 12.4 | GO:0005964 | phosphorylase kinase complex(GO:0005964) |
| 1.2 | 14.7 | GO:0036454 | insulin-like growth factor binding protein complex(GO:0016942) growth factor complex(GO:0036454) |
| 1.2 | 3.7 | GO:0098843 | postsynaptic endocytic zone(GO:0098843) |
| 1.2 | 4.9 | GO:0042583 | chromaffin granule(GO:0042583) |
| 1.2 | 6.1 | GO:0097539 | ciliary transition fiber(GO:0097539) |
| 1.2 | 17.0 | GO:0005883 | neurofilament(GO:0005883) |
| 1.2 | 6.0 | GO:0032299 | ribonuclease H2 complex(GO:0032299) |
| 1.2 | 7.2 | GO:0043196 | varicosity(GO:0043196) |
| 1.2 | 39.9 | GO:0009925 | basal plasma membrane(GO:0009925) |
| 1.2 | 3.5 | GO:0070931 | Golgi-associated vesicle lumen(GO:0070931) |
| 1.2 | 27.9 | GO:0097381 | photoreceptor disc membrane(GO:0097381) |
| 1.2 | 32.2 | GO:0031231 | integral component of peroxisomal membrane(GO:0005779) intrinsic component of peroxisomal membrane(GO:0031231) |
| 1.1 | 17.2 | GO:0005901 | caveola(GO:0005901) |
| 1.1 | 2.3 | GO:0034687 | integrin alphaL-beta2 complex(GO:0034687) |
| 1.1 | 1.1 | GO:0030128 | clathrin coat of endocytic vesicle(GO:0030128) |
| 1.1 | 4.5 | GO:0000818 | nuclear MIS12/MIND complex(GO:0000818) |
| 1.1 | 13.4 | GO:0042622 | photoreceptor outer segment membrane(GO:0042622) |
| 1.1 | 68.1 | GO:0031463 | Cul3-RING ubiquitin ligase complex(GO:0031463) |
| 1.1 | 4.4 | GO:0044305 | calyx of Held(GO:0044305) |
| 1.1 | 6.6 | GO:0042788 | polysomal ribosome(GO:0042788) |
| 1.1 | 5.4 | GO:0071458 | integral component of cytoplasmic side of endoplasmic reticulum membrane(GO:0071458) |
| 1.1 | 23.8 | GO:1990124 | messenger ribonucleoprotein complex(GO:1990124) |
| 1.1 | 51.7 | GO:0016235 | aggresome(GO:0016235) |
| 1.1 | 4.3 | GO:0097129 | cyclin D2-CDK4 complex(GO:0097129) |
| 1.1 | 12.8 | GO:0030126 | COPI vesicle coat(GO:0030126) |
| 1.1 | 20.0 | GO:0030877 | beta-catenin destruction complex(GO:0030877) |
| 1.0 | 8.4 | GO:0008024 | cyclin/CDK positive transcription elongation factor complex(GO:0008024) |
| 1.0 | 25.1 | GO:0005942 | phosphatidylinositol 3-kinase complex(GO:0005942) |
| 1.0 | 5.1 | GO:0097165 | nuclear stress granule(GO:0097165) |
| 1.0 | 3.0 | GO:0009328 | phenylalanine-tRNA ligase complex(GO:0009328) |
| 1.0 | 114.7 | GO:0034705 | voltage-gated potassium channel complex(GO:0008076) potassium channel complex(GO:0034705) |
| 1.0 | 16.2 | GO:0034045 | pre-autophagosomal structure membrane(GO:0034045) |
| 1.0 | 10.0 | GO:0043083 | synaptic cleft(GO:0043083) |
| 1.0 | 4.0 | GO:0045298 | tubulin complex(GO:0045298) |
| 1.0 | 15.8 | GO:0031082 | BLOC complex(GO:0031082) |
| 1.0 | 5.9 | GO:0009331 | glycerol-3-phosphate dehydrogenase complex(GO:0009331) |
| 0.9 | 2.8 | GO:0032009 | early phagosome(GO:0032009) |
| 0.9 | 30.2 | GO:1902710 | GABA receptor complex(GO:1902710) |
| 0.9 | 8.5 | GO:0097197 | tetraspanin-enriched microdomain(GO:0097197) |
| 0.9 | 17.7 | GO:0001931 | uropod(GO:0001931) cell trailing edge(GO:0031254) |
| 0.9 | 128.7 | GO:0072562 | blood microparticle(GO:0072562) |
| 0.9 | 35.1 | GO:0034707 | chloride channel complex(GO:0034707) |
| 0.9 | 97.0 | GO:0005796 | Golgi lumen(GO:0005796) |
| 0.9 | 1.8 | GO:0042599 | lamellar body(GO:0042599) |
| 0.9 | 15.9 | GO:0005922 | connexon complex(GO:0005922) |
| 0.9 | 3.5 | GO:0002080 | acrosomal membrane(GO:0002080) |
| 0.9 | 3.5 | GO:0033270 | paranode region of axon(GO:0033270) |
| 0.9 | 21.4 | GO:0043235 | receptor complex(GO:0043235) |
| 0.9 | 10.2 | GO:0035869 | ciliary transition zone(GO:0035869) |
| 0.8 | 53.0 | GO:0005834 | heterotrimeric G-protein complex(GO:0005834) |
| 0.8 | 1.7 | GO:0016939 | kinesin II complex(GO:0016939) |
| 0.8 | 3.3 | GO:0097513 | myosin II filament(GO:0097513) |
| 0.8 | 9.1 | GO:0000786 | nucleosome(GO:0000786) |
| 0.8 | 1.7 | GO:0098984 | neuron to neuron synapse(GO:0098984) |
| 0.8 | 1.6 | GO:0035189 | Rb-E2F complex(GO:0035189) |
| 0.8 | 9.8 | GO:0097486 | multivesicular body lumen(GO:0097486) |
| 0.8 | 2.4 | GO:0071148 | TEAD-1-YAP complex(GO:0071148) |
| 0.8 | 3.2 | GO:0090665 | dystrophin-associated glycoprotein complex(GO:0016010) glycoprotein complex(GO:0090665) |
| 0.8 | 5.5 | GO:0097209 | epidermal lamellar body(GO:0097209) |
| 0.8 | 2.4 | GO:0044327 | dendritic spine head(GO:0044327) |
| 0.8 | 3.1 | GO:0036020 | endolysosome membrane(GO:0036020) |
| 0.8 | 20.0 | GO:0042101 | T cell receptor complex(GO:0042101) |
| 0.8 | 0.8 | GO:0061689 | tricellular tight junction(GO:0061689) |
| 0.8 | 4.6 | GO:0060091 | kinocilium(GO:0060091) |
| 0.8 | 2.3 | GO:0097443 | sorting endosome(GO:0097443) |
| 0.8 | 3.8 | GO:0034362 | low-density lipoprotein particle(GO:0034362) |
| 0.7 | 5.2 | GO:0071664 | beta-catenin-TCF7L2 complex(GO:0070369) catenin-TCF7L2 complex(GO:0071664) |
| 0.7 | 30.2 | GO:0048786 | presynaptic active zone(GO:0048786) |
| 0.7 | 37.2 | GO:0043198 | dendritic shaft(GO:0043198) |
| 0.7 | 21.6 | GO:0044322 | endoplasmic reticulum quality control compartment(GO:0044322) |
| 0.7 | 2.2 | GO:0097180 | protein C inhibitor-TMPRSS7 complex(GO:0036024) protein C inhibitor-TMPRSS11E complex(GO:0036025) protein C inhibitor-PLAT complex(GO:0036026) protein C inhibitor-PLAU complex(GO:0036027) protein C inhibitor-thrombin complex(GO:0036028) protein C inhibitor-KLK3 complex(GO:0036029) protein C inhibitor-plasma kallikrein complex(GO:0036030) protease inhibitor complex(GO:0097179) serine protease inhibitor complex(GO:0097180) protein C inhibitor-coagulation factor V complex(GO:0097181) protein C inhibitor-coagulation factor Xa complex(GO:0097182) protein C inhibitor-coagulation factor XI complex(GO:0097183) |
| 0.7 | 1.4 | GO:0045179 | apical cortex(GO:0045179) |
| 0.7 | 2.8 | GO:0034669 | integrin alpha4-beta7 complex(GO:0034669) |
| 0.7 | 3.5 | GO:0071141 | SMAD protein complex(GO:0071141) |
| 0.7 | 13.6 | GO:0009897 | external side of plasma membrane(GO:0009897) |
| 0.7 | 14.8 | GO:0008305 | integrin complex(GO:0008305) |
| 0.6 | 2.6 | GO:0042629 | mast cell granule(GO:0042629) |
| 0.6 | 7.6 | GO:1990712 | HFE-transferrin receptor complex(GO:1990712) |
| 0.6 | 3.7 | GO:0097013 | phagocytic vesicle lumen(GO:0097013) |
| 0.6 | 1.8 | GO:0031258 | lamellipodium membrane(GO:0031258) |
| 0.6 | 6.0 | GO:0016461 | unconventional myosin complex(GO:0016461) |
| 0.6 | 6.6 | GO:0044666 | MLL3/4 complex(GO:0044666) |
| 0.6 | 3.6 | GO:0030665 | clathrin-coated vesicle membrane(GO:0030665) |
| 0.6 | 0.6 | GO:0002081 | outer acrosomal membrane(GO:0002081) |
| 0.6 | 20.7 | GO:0001772 | immunological synapse(GO:0001772) |
| 0.6 | 2.3 | GO:0032059 | bleb(GO:0032059) |
| 0.6 | 2.9 | GO:0032302 | MutSbeta complex(GO:0032302) |
| 0.6 | 1.1 | GO:0031906 | late endosome lumen(GO:0031906) |
| 0.5 | 12.0 | GO:0030673 | axolemma(GO:0030673) |
| 0.5 | 1.1 | GO:0098576 | lumenal side of membrane(GO:0098576) |
| 0.5 | 23.2 | GO:0001533 | cornified envelope(GO:0001533) |
| 0.5 | 2.1 | GO:0005968 | Rab-protein geranylgeranyltransferase complex(GO:0005968) |
| 0.5 | 9.5 | GO:0031594 | neuromuscular junction(GO:0031594) |
| 0.5 | 7.9 | GO:0005652 | nuclear lamina(GO:0005652) |
| 0.5 | 3.1 | GO:0045252 | dihydrolipoyl dehydrogenase complex(GO:0045240) oxoglutarate dehydrogenase complex(GO:0045252) |
| 0.5 | 2.5 | GO:0071008 | U2-type post-mRNA release spliceosomal complex(GO:0071008) |
| 0.5 | 3.0 | GO:0034706 | sodium channel complex(GO:0034706) |
| 0.5 | 14.6 | GO:0005892 | acetylcholine-gated channel complex(GO:0005892) |
| 0.5 | 1.5 | GO:0034464 | BBSome(GO:0034464) |
| 0.5 | 8.7 | GO:0005902 | microvillus(GO:0005902) |
| 0.5 | 29.8 | GO:0005811 | lipid particle(GO:0005811) |
| 0.5 | 21.3 | GO:0005801 | cis-Golgi network(GO:0005801) |
| 0.5 | 2.8 | GO:0002177 | manchette(GO:0002177) |
| 0.5 | 1.8 | GO:0000801 | central element(GO:0000801) |
| 0.4 | 1.3 | GO:0017146 | NMDA selective glutamate receptor complex(GO:0017146) |
| 0.4 | 21.7 | GO:0008023 | transcription elongation factor complex(GO:0008023) |
| 0.4 | 5.2 | GO:0016602 | CCAAT-binding factor complex(GO:0016602) |
| 0.4 | 79.1 | GO:0098793 | presynapse(GO:0098793) |
| 0.4 | 28.5 | GO:0005814 | centriole(GO:0005814) |
| 0.4 | 1.3 | GO:0035749 | myelin sheath adaxonal region(GO:0035749) |
| 0.4 | 1.7 | GO:0016460 | myosin II complex(GO:0016460) |
| 0.4 | 6.2 | GO:0000145 | exocyst(GO:0000145) |
| 0.4 | 2.4 | GO:0090533 | cation-transporting ATPase complex(GO:0090533) |
| 0.4 | 10.6 | GO:0071565 | nBAF complex(GO:0071565) |
| 0.4 | 3.1 | GO:0070187 | telosome(GO:0070187) |
| 0.4 | 50.9 | GO:0043025 | neuronal cell body(GO:0043025) |
| 0.4 | 14.9 | GO:0030119 | AP-type membrane coat adaptor complex(GO:0030119) |
| 0.4 | 0.7 | GO:0000923 | equatorial microtubule organizing center(GO:0000923) |
| 0.4 | 2.9 | GO:0097504 | Gemini of coiled bodies(GO:0097504) |
| 0.4 | 25.0 | GO:0042734 | presynaptic membrane(GO:0042734) |
| 0.4 | 98.4 | GO:0005578 | proteinaceous extracellular matrix(GO:0005578) |
| 0.3 | 1.7 | GO:0005854 | nascent polypeptide-associated complex(GO:0005854) |
| 0.3 | 19.2 | GO:0000792 | heterochromatin(GO:0000792) |
| 0.3 | 1.0 | GO:0031092 | platelet alpha granule membrane(GO:0031092) |
| 0.3 | 7.5 | GO:0005778 | peroxisomal membrane(GO:0005778) microbody membrane(GO:0031903) |
| 0.3 | 1.8 | GO:0070765 | gamma-secretase complex(GO:0070765) |
| 0.3 | 4.2 | GO:0031588 | nucleotide-activated protein kinase complex(GO:0031588) |
| 0.3 | 8.8 | GO:0097546 | ciliary base(GO:0097546) |
| 0.3 | 2.0 | GO:0036021 | endolysosome lumen(GO:0036021) |
| 0.3 | 1.2 | GO:0030895 | apolipoprotein B mRNA editing enzyme complex(GO:0030895) |
| 0.3 | 0.8 | GO:0070110 | ciliary neurotrophic factor receptor complex(GO:0070110) |
| 0.3 | 8.4 | GO:0001669 | acrosomal vesicle(GO:0001669) |
| 0.3 | 27.6 | GO:0005923 | bicellular tight junction(GO:0005923) occluding junction(GO:0070160) |
| 0.3 | 0.5 | GO:0014802 | terminal cisterna(GO:0014802) |
| 0.3 | 2.6 | GO:0001891 | phagocytic cup(GO:0001891) |
| 0.3 | 4.0 | GO:0030660 | Golgi-associated vesicle membrane(GO:0030660) |
| 0.2 | 8.8 | GO:0030173 | integral component of Golgi membrane(GO:0030173) |
| 0.2 | 3.1 | GO:0000800 | lateral element(GO:0000800) |
| 0.2 | 0.7 | GO:0070195 | growth hormone receptor complex(GO:0070195) |
| 0.2 | 2.7 | GO:0030140 | trans-Golgi network transport vesicle(GO:0030140) |
| 0.2 | 1.1 | GO:0097524 | sperm plasma membrane(GO:0097524) |
| 0.2 | 6.9 | GO:0005865 | striated muscle thin filament(GO:0005865) |
| 0.2 | 3.8 | GO:0034364 | high-density lipoprotein particle(GO:0034364) |
| 0.2 | 1.5 | GO:0031931 | TORC1 complex(GO:0031931) |
| 0.2 | 3.0 | GO:0005847 | mRNA cleavage and polyadenylation specificity factor complex(GO:0005847) |
| 0.2 | 10.9 | GO:0036064 | ciliary basal body(GO:0036064) |
| 0.2 | 17.4 | GO:0043204 | perikaryon(GO:0043204) |
| 0.2 | 2.6 | GO:0035577 | azurophil granule membrane(GO:0035577) |
| 0.2 | 0.9 | GO:0031228 | intrinsic component of Golgi membrane(GO:0031228) |
| 0.2 | 37.0 | GO:0016323 | basolateral plasma membrane(GO:0016323) |
| 0.2 | 13.8 | GO:0043202 | lysosomal lumen(GO:0043202) |
| 0.2 | 1.9 | GO:0043240 | Fanconi anaemia nuclear complex(GO:0043240) |
| 0.2 | 1.4 | GO:0043020 | NADPH oxidase complex(GO:0043020) |
| 0.1 | 17.7 | GO:0032587 | ruffle membrane(GO:0032587) |
| 0.1 | 17.4 | GO:0030426 | growth cone(GO:0030426) |
| 0.1 | 573.7 | GO:0031224 | intrinsic component of membrane(GO:0031224) |
| 0.1 | 4.0 | GO:0016459 | myosin complex(GO:0016459) |
| 0.1 | 1.9 | GO:0000974 | Prp19 complex(GO:0000974) |
| 0.1 | 4.0 | GO:0005793 | endoplasmic reticulum-Golgi intermediate compartment(GO:0005793) |
| 0.1 | 0.2 | GO:0043541 | UDP-N-acetylglucosamine transferase complex(GO:0043541) |
| 0.1 | 0.8 | GO:0048500 | signal recognition particle, endoplasmic reticulum targeting(GO:0005786) signal recognition particle(GO:0048500) |
| 0.1 | 0.9 | GO:0005849 | mRNA cleavage factor complex(GO:0005849) |
| 0.1 | 0.2 | GO:0005921 | gap junction(GO:0005921) |
| 0.1 | 0.5 | GO:0070545 | PeBoW complex(GO:0070545) |
| 0.1 | 0.5 | GO:0071782 | endoplasmic reticulum tubular network(GO:0071782) |
| 0.1 | 70.7 | GO:0005615 | extracellular space(GO:0005615) |
| 0.1 | 0.3 | GO:0089701 | U2AF(GO:0089701) |
| 0.1 | 0.8 | GO:0042587 | glycogen granule(GO:0042587) |
| 0.1 | 3.1 | GO:0055037 | recycling endosome(GO:0055037) |
| 0.1 | 2.7 | GO:0001726 | ruffle(GO:0001726) |
| 0.0 | 0.2 | GO:0035686 | sperm fibrous sheath(GO:0035686) |
Gene overrepresentation in molecular function category:
| Log-likelihood per target | Total log-likelihood | Term | Description |
|---|---|---|---|
| 23.8 | 95.4 | GO:0004667 | prostaglandin-D synthase activity(GO:0004667) |
| 17.4 | 69.5 | GO:0032567 | dGTPase activity(GO:0008832) triphosphoric monoester hydrolase activity(GO:0016793) guanyl deoxyribonucleotide binding(GO:0032560) dGTP binding(GO:0032567) |
| 11.7 | 46.7 | GO:0004306 | ethanolamine-phosphate cytidylyltransferase activity(GO:0004306) |
| 11.1 | 66.8 | GO:0004489 | methylenetetrahydrofolate reductase (NAD(P)H) activity(GO:0004489) |
| 10.7 | 42.9 | GO:0016880 | glutamate-ammonia ligase activity(GO:0004356) ammonia ligase activity(GO:0016211) acid-ammonia (or amide) ligase activity(GO:0016880) |
| 9.6 | 28.9 | GO:0032093 | SAM domain binding(GO:0032093) |
| 9.6 | 76.9 | GO:0004865 | protein serine/threonine phosphatase inhibitor activity(GO:0004865) |
| 9.5 | 57.3 | GO:0004305 | ethanolamine kinase activity(GO:0004305) |
| 9.5 | 28.6 | GO:0034739 | histone deacetylase activity (H4-K16 specific)(GO:0034739) |
| 9.2 | 82.6 | GO:0060228 | phosphatidylcholine-sterol O-acyltransferase activator activity(GO:0060228) |
| 9.1 | 27.2 | GO:0030350 | iron-responsive element binding(GO:0030350) |
| 8.9 | 26.7 | GO:0098640 | integrin binding involved in cell-matrix adhesion(GO:0098640) |
| 8.7 | 26.1 | GO:0098519 | nucleotide phosphatase activity, acting on free nucleotides(GO:0098519) |
| 8.7 | 34.7 | GO:0097001 | ceramide binding(GO:0097001) |
| 8.3 | 66.6 | GO:0097643 | amylin receptor activity(GO:0097643) |
| 8.0 | 31.8 | GO:0019770 | IgG receptor activity(GO:0019770) |
| 7.9 | 47.6 | GO:0030172 | troponin C binding(GO:0030172) |
| 7.8 | 39.0 | GO:0004803 | transposase activity(GO:0004803) |
| 7.5 | 22.6 | GO:0008294 | calcium- and calmodulin-responsive adenylate cyclase activity(GO:0008294) |
| 7.3 | 36.4 | GO:0004095 | carnitine O-palmitoyltransferase activity(GO:0004095) |
| 7.2 | 21.5 | GO:0009032 | thymidine phosphorylase activity(GO:0009032) pyrimidine-nucleoside phosphorylase activity(GO:0016154) |
| 7.1 | 21.4 | GO:0070290 | N-acylphosphatidylethanolamine-specific phospholipase D activity(GO:0070290) |
| 7.1 | 21.3 | GO:0086059 | voltage-gated calcium channel activity involved SA node cell action potential(GO:0086059) |
| 7.1 | 28.4 | GO:0000995 | transcription factor activity, core RNA polymerase III binding(GO:0000995) |
| 7.1 | 28.3 | GO:0052901 | polyamine oxidase activity(GO:0046592) spermine:oxygen oxidoreductase (spermidine-forming) activity(GO:0052901) |
| 7.0 | 28.0 | GO:0032184 | SUMO polymer binding(GO:0032184) |
| 6.6 | 19.9 | GO:0050254 | rhodopsin kinase activity(GO:0050254) |
| 6.6 | 26.4 | GO:0034353 | RNA pyrophosphohydrolase activity(GO:0034353) |
| 6.3 | 18.9 | GO:0033188 | sphingomyelin synthase activity(GO:0033188) ceramide cholinephosphotransferase activity(GO:0047493) |
| 6.3 | 25.2 | GO:0004505 | phenylalanine 4-monooxygenase activity(GO:0004505) |
| 6.2 | 24.7 | GO:0042030 | ATPase inhibitor activity(GO:0042030) |
| 6.1 | 91.4 | GO:0005344 | oxygen transporter activity(GO:0005344) |
| 5.9 | 17.8 | GO:0004144 | diacylglycerol O-acyltransferase activity(GO:0004144) |
| 5.9 | 17.6 | GO:0070735 | protein-glycine ligase activity(GO:0070735) |
| 5.9 | 23.4 | GO:0061769 | ribosylnicotinamide kinase activity(GO:0050262) ribosylnicotinate kinase activity(GO:0061769) |
| 5.8 | 17.4 | GO:0001665 | alpha-N-acetylgalactosaminide alpha-2,6-sialyltransferase activity(GO:0001665) |
| 5.8 | 34.6 | GO:0008420 | CTD phosphatase activity(GO:0008420) |
| 5.6 | 33.6 | GO:0004430 | 1-phosphatidylinositol 4-kinase activity(GO:0004430) |
| 5.5 | 22.1 | GO:0004773 | steryl-sulfatase activity(GO:0004773) |
| 5.4 | 16.2 | GO:0003826 | alpha-ketoacid dehydrogenase activity(GO:0003826) 3-methyl-2-oxobutanoate dehydrogenase (2-methylpropanoyl-transferring) activity(GO:0003863) |
| 5.4 | 48.6 | GO:0004727 | prenylated protein tyrosine phosphatase activity(GO:0004727) |
| 5.4 | 27.0 | GO:0010861 | thyroid hormone receptor activator activity(GO:0010861) thyroid hormone receptor coactivator activity(GO:0030375) |
| 5.3 | 26.7 | GO:0086062 | voltage-gated sodium channel activity involved in Purkinje myocyte action potential(GO:0086062) |
| 5.2 | 20.7 | GO:0042132 | fructose 1,6-bisphosphate 1-phosphatase activity(GO:0042132) |
| 5.1 | 25.5 | GO:0004999 | vasoactive intestinal polypeptide receptor activity(GO:0004999) |
| 5.0 | 14.9 | GO:0004938 | alpha2-adrenergic receptor activity(GO:0004938) |
| 4.9 | 29.5 | GO:0004740 | pyruvate dehydrogenase (acetyl-transferring) kinase activity(GO:0004740) |
| 4.9 | 43.9 | GO:0010385 | double-stranded methylated DNA binding(GO:0010385) |
| 4.8 | 14.3 | GO:0004967 | glucagon receptor activity(GO:0004967) |
| 4.8 | 9.5 | GO:0038085 | vascular endothelial growth factor binding(GO:0038085) |
| 4.7 | 18.9 | GO:0004341 | gluconolactonase activity(GO:0004341) |
| 4.7 | 23.4 | GO:0005222 | intracellular cAMP activated cation channel activity(GO:0005222) |
| 4.7 | 28.0 | GO:0016812 | hydrolase activity, acting on carbon-nitrogen (but not peptide) bonds, in cyclic amides(GO:0016812) |
| 4.6 | 4.6 | GO:0050405 | [hydroxymethylglutaryl-CoA reductase (NADPH)] kinase activity(GO:0047322) [acetyl-CoA carboxylase] kinase activity(GO:0050405) |
| 4.6 | 32.2 | GO:0042289 | MHC class II protein binding(GO:0042289) |
| 4.5 | 9.0 | GO:0031696 | alpha-2C adrenergic receptor binding(GO:0031696) |
| 4.5 | 49.3 | GO:0070915 | lysophosphatidic acid receptor activity(GO:0070915) |
| 4.5 | 4.5 | GO:0072320 | volume-sensitive chloride channel activity(GO:0072320) |
| 4.4 | 40.0 | GO:0046974 | histone methyltransferase activity (H3-K9 specific)(GO:0046974) |
| 4.4 | 52.4 | GO:0019911 | structural constituent of myelin sheath(GO:0019911) |
| 4.4 | 17.5 | GO:1904493 | Ac-Asp-Glu binding(GO:1904492) tetrahydrofolyl-poly(glutamate) polymer binding(GO:1904493) |
| 4.3 | 17.0 | GO:0097108 | hedgehog family protein binding(GO:0097108) |
| 4.2 | 12.7 | GO:0036054 | protein-malonyllysine demalonylase activity(GO:0036054) protein-succinyllysine desuccinylase activity(GO:0036055) protein-glutaryllysine deglutarylase activity(GO:0061697) |
| 4.2 | 12.7 | GO:0016497 | substance K receptor activity(GO:0016497) |
| 4.2 | 16.8 | GO:0050119 | N-acetylglucosamine deacetylase activity(GO:0050119) |
| 4.2 | 16.8 | GO:0004449 | isocitrate dehydrogenase (NAD+) activity(GO:0004449) |
| 4.1 | 12.4 | GO:0004961 | thromboxane receptor activity(GO:0004960) thromboxane A2 receptor activity(GO:0004961) |
| 4.1 | 53.5 | GO:0097371 | MDM2/MDM4 family protein binding(GO:0097371) |
| 4.1 | 16.4 | GO:0015254 | glycerol channel activity(GO:0015254) |
| 4.1 | 16.3 | GO:0051733 | ATP-dependent polydeoxyribonucleotide 5'-hydroxyl-kinase activity(GO:0046404) polydeoxyribonucleotide kinase activity(GO:0051733) ATP-dependent polynucleotide kinase activity(GO:0051734) |
| 4.0 | 12.1 | GO:0004040 | amidase activity(GO:0004040) |
| 4.0 | 12.0 | GO:0030226 | apolipoprotein receptor activity(GO:0030226) |
| 4.0 | 12.0 | GO:0005150 | interleukin-1, Type I receptor binding(GO:0005150) |
| 4.0 | 27.7 | GO:0003828 | alpha-N-acetylneuraminate alpha-2,8-sialyltransferase activity(GO:0003828) |
| 3.9 | 11.8 | GO:0008431 | vitamin E binding(GO:0008431) |
| 3.9 | 15.8 | GO:0048403 | brain-derived neurotrophic factor binding(GO:0048403) |
| 3.9 | 11.7 | GO:0004119 | cGMP-inhibited cyclic-nucleotide phosphodiesterase activity(GO:0004119) |
| 3.9 | 15.6 | GO:0004079 | biotin-[acetyl-CoA-carboxylase] ligase activity(GO:0004077) biotin-[methylcrotonoyl-CoA-carboxylase] ligase activity(GO:0004078) biotin-[methylmalonyl-CoA-carboxytransferase] ligase activity(GO:0004079) biotin-[propionyl-CoA-carboxylase (ATP-hydrolyzing)] ligase activity(GO:0004080) biotin-protein ligase activity(GO:0018271) |
| 3.9 | 19.4 | GO:0070097 | delta-catenin binding(GO:0070097) |
| 3.9 | 7.8 | GO:0070878 | primary miRNA binding(GO:0070878) |
| 3.8 | 42.3 | GO:0016889 | endodeoxyribonuclease activity, producing 3'-phosphomonoesters(GO:0016889) |
| 3.8 | 11.4 | GO:0070984 | SET domain binding(GO:0070984) |
| 3.8 | 15.2 | GO:0032408 | MutLbeta complex binding(GO:0032406) MutSbeta complex binding(GO:0032408) |
| 3.8 | 11.3 | GO:0003829 | beta-1,3-galactosyl-O-glycosyl-glycoprotein beta-1,6-N-acetylglucosaminyltransferase activity(GO:0003829) |
| 3.8 | 15.1 | GO:0034041 | sterol-transporting ATPase activity(GO:0034041) |
| 3.7 | 3.7 | GO:0005128 | erythropoietin receptor binding(GO:0005128) |
| 3.6 | 14.4 | GO:0070644 | vitamin D response element binding(GO:0070644) |
| 3.6 | 14.4 | GO:0047298 | 4-aminobutyrate transaminase activity(GO:0003867) succinate-semialdehyde dehydrogenase binding(GO:0032145) (S)-3-amino-2-methylpropionate transaminase activity(GO:0047298) |
| 3.6 | 14.4 | GO:0004668 | protein-arginine deiminase activity(GO:0004668) |
| 3.6 | 24.9 | GO:0030369 | ICAM-3 receptor activity(GO:0030369) |
| 3.5 | 21.2 | GO:0004882 | androgen receptor activity(GO:0004882) |
| 3.5 | 211.5 | GO:0034987 | immunoglobulin receptor binding(GO:0034987) |
| 3.5 | 17.5 | GO:0070573 | metallodipeptidase activity(GO:0070573) |
| 3.5 | 21.0 | GO:0047696 | beta-adrenergic receptor kinase activity(GO:0047696) |
| 3.5 | 49.0 | GO:0055056 | D-glucose transmembrane transporter activity(GO:0055056) |
| 3.5 | 14.0 | GO:0047288 | monosialoganglioside sialyltransferase activity(GO:0047288) |
| 3.5 | 10.4 | GO:0033878 | hormone-sensitive lipase activity(GO:0033878) |
| 3.5 | 17.3 | GO:0004994 | somatostatin receptor activity(GO:0004994) |
| 3.5 | 3.5 | GO:0030618 | transforming growth factor beta receptor, pathway-specific cytoplasmic mediator activity(GO:0030618) |
| 3.4 | 24.1 | GO:0030250 | cyclase activator activity(GO:0010853) guanylate cyclase activator activity(GO:0030250) |
| 3.4 | 13.5 | GO:0032450 | maltose alpha-glucosidase activity(GO:0032450) |
| 3.4 | 30.3 | GO:0048495 | Roundabout binding(GO:0048495) |
| 3.4 | 30.3 | GO:0046935 | 1-phosphatidylinositol-3-kinase regulator activity(GO:0046935) |
| 3.4 | 13.4 | GO:0004965 | G-protein coupled GABA receptor activity(GO:0004965) |
| 3.3 | 26.8 | GO:1990829 | C-rich single-stranded DNA binding(GO:1990829) |
| 3.3 | 26.6 | GO:0031812 | G-protein coupled nucleotide receptor binding(GO:0031811) P2Y1 nucleotide receptor binding(GO:0031812) |
| 3.3 | 9.9 | GO:0033746 | histone demethylase activity (H3-R2 specific)(GO:0033746) histone demethylase activity (H4-R3 specific)(GO:0033749) |
| 3.3 | 36.2 | GO:0005451 | monovalent cation:proton antiporter activity(GO:0005451) |
| 3.3 | 13.1 | GO:0016314 | phosphatidylinositol-3,4,5-trisphosphate 3-phosphatase activity(GO:0016314) |
| 3.3 | 22.8 | GO:0015252 | hydrogen ion channel activity(GO:0015252) |
| 3.3 | 13.0 | GO:0004852 | uroporphyrinogen-III synthase activity(GO:0004852) |
| 3.3 | 19.5 | GO:0004359 | glutaminase activity(GO:0004359) |
| 3.2 | 44.9 | GO:0015379 | potassium:chloride symporter activity(GO:0015379) potassium ion symporter activity(GO:0022820) |
| 3.2 | 12.8 | GO:0015018 | galactosylgalactosylxylosylprotein 3-beta-glucuronosyltransferase activity(GO:0015018) |
| 3.2 | 22.2 | GO:0001225 | RNA polymerase II transcription coactivator binding(GO:0001225) |
| 3.2 | 28.6 | GO:0004565 | beta-galactosidase activity(GO:0004565) |
| 3.2 | 15.9 | GO:0008889 | glycerophosphodiester phosphodiesterase activity(GO:0008889) |
| 3.2 | 12.7 | GO:0033829 | O-fucosylpeptide 3-beta-N-acetylglucosaminyltransferase activity(GO:0033829) |
| 3.2 | 9.5 | GO:0005017 | platelet-derived growth factor-activated receptor activity(GO:0005017) |
| 3.2 | 15.8 | GO:0070051 | fibrinogen binding(GO:0070051) |
| 3.2 | 37.8 | GO:0015250 | water channel activity(GO:0015250) |
| 3.1 | 18.7 | GO:0005315 | inorganic phosphate transmembrane transporter activity(GO:0005315) |
| 3.1 | 12.4 | GO:0008467 | [heparan sulfate]-glucosamine 3-sulfotransferase 1 activity(GO:0008467) |
| 3.1 | 86.6 | GO:0005251 | delayed rectifier potassium channel activity(GO:0005251) |
| 3.1 | 15.4 | GO:0047066 | phospholipid-hydroperoxide glutathione peroxidase activity(GO:0047066) |
| 3.1 | 12.2 | GO:0000309 | nicotinamide-nucleotide adenylyltransferase activity(GO:0000309) |
| 3.0 | 9.1 | GO:0036134 | thromboxane-A synthase activity(GO:0004796) 12-hydroxyheptadecatrienoic acid synthase activity(GO:0036134) |
| 3.0 | 27.3 | GO:0043533 | inositol 1,3,4,5 tetrakisphosphate binding(GO:0043533) |
| 3.0 | 9.1 | GO:0042903 | tubulin deacetylase activity(GO:0042903) |
| 3.0 | 11.9 | GO:0005334 | norepinephrine:sodium symporter activity(GO:0005334) |
| 3.0 | 38.7 | GO:0070700 | BMP receptor binding(GO:0070700) |
| 3.0 | 11.9 | GO:0004741 | [pyruvate dehydrogenase (lipoamide)] phosphatase activity(GO:0004741) |
| 3.0 | 3.0 | GO:0005119 | smoothened binding(GO:0005119) |
| 3.0 | 8.9 | GO:0030158 | protein xylosyltransferase activity(GO:0030158) |
| 3.0 | 17.8 | GO:0005127 | ciliary neurotrophic factor receptor binding(GO:0005127) |
| 3.0 | 5.9 | GO:0005330 | dopamine:sodium symporter activity(GO:0005330) |
| 3.0 | 29.6 | GO:0022841 | potassium ion leak channel activity(GO:0022841) |
| 2.9 | 8.8 | GO:0005484 | SNAP receptor activity(GO:0005484) |
| 2.9 | 61.6 | GO:0019992 | diacylglycerol binding(GO:0019992) |
| 2.9 | 8.7 | GO:0035662 | Toll-like receptor 4 binding(GO:0035662) |
| 2.9 | 11.5 | GO:0000702 | oxidized base lesion DNA N-glycosylase activity(GO:0000702) |
| 2.9 | 8.6 | GO:0004584 | dolichyl-phosphate-mannose-glycolipid alpha-mannosyltransferase activity(GO:0004584) |
| 2.8 | 22.7 | GO:0016176 | superoxide-generating NADPH oxidase activator activity(GO:0016176) |
| 2.8 | 25.4 | GO:1901702 | urate transmembrane transporter activity(GO:0015143) salt transmembrane transporter activity(GO:1901702) |
| 2.8 | 14.0 | GO:0005052 | peroxisome matrix targeting signal-1 binding(GO:0005052) |
| 2.8 | 13.8 | GO:0036312 | phosphatidylinositol 3-kinase regulatory subunit binding(GO:0036312) |
| 2.7 | 11.0 | GO:0050473 | arachidonate 15-lipoxygenase activity(GO:0050473) |
| 2.7 | 24.6 | GO:0003847 | 1-alkyl-2-acetylglycerophosphocholine esterase activity(GO:0003847) |
| 2.7 | 54.4 | GO:0008510 | sodium:bicarbonate symporter activity(GO:0008510) |
| 2.7 | 21.8 | GO:0048407 | platelet-derived growth factor binding(GO:0048407) |
| 2.7 | 32.5 | GO:0001206 | transcriptional repressor activity, RNA polymerase II distal enhancer sequence-specific binding(GO:0001206) |
| 2.7 | 13.4 | GO:0005298 | proline:sodium symporter activity(GO:0005298) |
| 2.7 | 10.7 | GO:0035033 | histone deacetylase regulator activity(GO:0035033) |
| 2.7 | 18.7 | GO:0008172 | S-methyltransferase activity(GO:0008172) |
| 2.7 | 37.4 | GO:0045159 | myosin II binding(GO:0045159) |
| 2.7 | 8.0 | GO:0005011 | macrophage colony-stimulating factor receptor activity(GO:0005011) |
| 2.7 | 10.6 | GO:0015111 | iodide transmembrane transporter activity(GO:0015111) |
| 2.6 | 42.3 | GO:0016918 | retinal binding(GO:0016918) |
| 2.6 | 28.7 | GO:0004931 | extracellular ATP-gated cation channel activity(GO:0004931) ATP-gated ion channel activity(GO:0035381) |
| 2.6 | 10.4 | GO:0035673 | oligopeptide transmembrane transporter activity(GO:0035673) |
| 2.6 | 10.4 | GO:0001626 | nociceptin receptor activity(GO:0001626) |
| 2.6 | 18.1 | GO:0004465 | lipoprotein lipase activity(GO:0004465) |
| 2.6 | 31.0 | GO:0005007 | fibroblast growth factor-activated receptor activity(GO:0005007) |
| 2.6 | 7.7 | GO:0003943 | N-acetylgalactosamine-4-sulfatase activity(GO:0003943) |
| 2.6 | 41.2 | GO:0038036 | sphingosine-1-phosphate receptor activity(GO:0038036) |
| 2.6 | 54.0 | GO:0005112 | Notch binding(GO:0005112) |
| 2.6 | 105.4 | GO:0004890 | GABA-A receptor activity(GO:0004890) GABA receptor activity(GO:0016917) |
| 2.6 | 71.8 | GO:0050321 | tau-protein kinase activity(GO:0050321) |
| 2.6 | 20.5 | GO:0070411 | I-SMAD binding(GO:0070411) |
| 2.6 | 17.9 | GO:0001515 | opioid peptide activity(GO:0001515) |
| 2.6 | 17.9 | GO:0008440 | inositol-1,4,5-trisphosphate 3-kinase activity(GO:0008440) |
| 2.6 | 7.7 | GO:0016833 | oxo-acid-lyase activity(GO:0016833) |
| 2.6 | 10.2 | GO:0070095 | fructose-6-phosphate binding(GO:0070095) |
| 2.5 | 48.3 | GO:0005247 | voltage-gated chloride channel activity(GO:0005247) |
| 2.5 | 7.6 | GO:0061629 | RNA polymerase II sequence-specific DNA binding transcription factor binding(GO:0061629) |
| 2.5 | 7.6 | GO:0070364 | mitochondrial light strand promoter anti-sense binding(GO:0070361) mitochondrial heavy strand promoter anti-sense binding(GO:0070362) mitochondrial heavy strand promoter sense binding(GO:0070364) |
| 2.5 | 7.6 | GO:0015218 | pyrimidine nucleotide transmembrane transporter activity(GO:0015218) |
| 2.5 | 27.6 | GO:0005021 | vascular endothelial growth factor-activated receptor activity(GO:0005021) |
| 2.5 | 7.5 | GO:0015275 | stretch-activated, cation-selective, calcium channel activity(GO:0015275) |
| 2.5 | 7.5 | GO:0004051 | arachidonate 5-lipoxygenase activity(GO:0004051) |
| 2.4 | 41.6 | GO:0015095 | magnesium ion transmembrane transporter activity(GO:0015095) |
| 2.4 | 31.6 | GO:1990239 | steroid hormone binding(GO:1990239) |
| 2.4 | 12.0 | GO:0070740 | tubulin-glutamic acid ligase activity(GO:0070740) |
| 2.4 | 7.2 | GO:0031687 | A2A adenosine receptor binding(GO:0031687) |
| 2.4 | 7.2 | GO:0016907 | G-protein coupled acetylcholine receptor activity(GO:0016907) |
| 2.4 | 7.2 | GO:0004912 | interleukin-3 receptor activity(GO:0004912) |
| 2.4 | 9.6 | GO:0001602 | pancreatic polypeptide receptor activity(GO:0001602) |
| 2.4 | 21.4 | GO:0043426 | MRF binding(GO:0043426) |
| 2.4 | 7.1 | GO:0015057 | thrombin receptor activity(GO:0015057) |
| 2.4 | 9.4 | GO:0060002 | plus-end directed microfilament motor activity(GO:0060002) |
| 2.4 | 75.3 | GO:0005086 | ARF guanyl-nucleotide exchange factor activity(GO:0005086) |
| 2.3 | 11.7 | GO:0016941 | natriuretic peptide receptor activity(GO:0016941) |
| 2.3 | 23.4 | GO:0017151 | DEAD/H-box RNA helicase binding(GO:0017151) |
| 2.3 | 11.7 | GO:0004140 | dephospho-CoA kinase activity(GO:0004140) |
| 2.3 | 14.0 | GO:0008142 | oxysterol binding(GO:0008142) |
| 2.3 | 9.3 | GO:0019763 | immunoglobulin receptor activity(GO:0019763) |
| 2.3 | 7.0 | GO:0008900 | hydrogen:potassium-exchanging ATPase activity(GO:0008900) |
| 2.3 | 16.2 | GO:0000099 | sulfur amino acid transmembrane transporter activity(GO:0000099) |
| 2.3 | 11.5 | GO:0022897 | peptide:proton symporter activity(GO:0015333) proton-dependent peptide secondary active transmembrane transporter activity(GO:0022897) |
| 2.3 | 16.0 | GO:0003810 | protein-glutamine gamma-glutamyltransferase activity(GO:0003810) |
| 2.3 | 27.3 | GO:0004118 | cGMP-stimulated cyclic-nucleotide phosphodiesterase activity(GO:0004118) |
| 2.3 | 11.3 | GO:0008532 | N-acetyllactosaminide beta-1,3-N-acetylglucosaminyltransferase activity(GO:0008532) |
| 2.3 | 58.8 | GO:0005545 | 1-phosphatidylinositol binding(GO:0005545) |
| 2.2 | 22.4 | GO:0004065 | arylsulfatase activity(GO:0004065) |
| 2.2 | 15.6 | GO:0071558 | histone demethylase activity (H3-K27 specific)(GO:0071558) |
| 2.2 | 6.7 | GO:0005174 | CD40 receptor binding(GO:0005174) |
| 2.2 | 13.3 | GO:0003886 | DNA (cytosine-5-)-methyltransferase activity(GO:0003886) |
| 2.2 | 11.0 | GO:0022858 | L-alanine transmembrane transporter activity(GO:0015180) alanine transmembrane transporter activity(GO:0022858) |
| 2.2 | 33.0 | GO:0031702 | type 1 angiotensin receptor binding(GO:0031702) |
| 2.2 | 13.2 | GO:0004035 | alkaline phosphatase activity(GO:0004035) |
| 2.2 | 6.5 | GO:0004142 | diacylglycerol cholinephosphotransferase activity(GO:0004142) |
| 2.2 | 13.0 | GO:0008310 | single-stranded DNA 3'-5' exodeoxyribonuclease activity(GO:0008310) |
| 2.2 | 6.5 | GO:0031862 | prostanoid receptor binding(GO:0031862) |
| 2.2 | 25.8 | GO:0051378 | amine binding(GO:0043176) serotonin binding(GO:0051378) |
| 2.1 | 19.3 | GO:0030976 | thiamine pyrophosphate binding(GO:0030976) |
| 2.1 | 8.5 | GO:0090554 | phosphatidylcholine-translocating ATPase activity(GO:0090554) |
| 2.1 | 29.8 | GO:0005078 | MAP-kinase scaffold activity(GO:0005078) |
| 2.1 | 44.2 | GO:0004012 | phospholipid-translocating ATPase activity(GO:0004012) |
| 2.1 | 14.6 | GO:0051425 | PTB domain binding(GO:0051425) |
| 2.1 | 12.5 | GO:0031013 | troponin I binding(GO:0031013) |
| 2.1 | 12.5 | GO:0016174 | NAD(P)H oxidase activity(GO:0016174) |
| 2.1 | 16.6 | GO:0005534 | galactose binding(GO:0005534) |
| 2.1 | 12.4 | GO:0003998 | acylphosphatase activity(GO:0003998) |
| 2.1 | 26.9 | GO:0005355 | glucose transmembrane transporter activity(GO:0005355) |
| 2.1 | 6.2 | GO:0004336 | galactosylceramidase activity(GO:0004336) |
| 2.1 | 20.5 | GO:0016286 | small conductance calcium-activated potassium channel activity(GO:0016286) |
| 2.0 | 4.1 | GO:0086007 | voltage-gated calcium channel activity involved in cardiac muscle cell action potential(GO:0086007) |
| 2.0 | 6.1 | GO:0051120 | hepoxilin A3 synthase activity(GO:0051120) |
| 2.0 | 10.2 | GO:0047273 | galactosylgalactosylglucosylceramide beta-D-acetylgalactosaminyltransferase activity(GO:0047273) |
| 2.0 | 14.2 | GO:0050291 | sphingosine N-acyltransferase activity(GO:0050291) |
| 2.0 | 6.1 | GO:0042285 | UDP-xylosyltransferase activity(GO:0035252) xylosyltransferase activity(GO:0042285) |
| 2.0 | 10.1 | GO:0004991 | parathyroid hormone receptor activity(GO:0004991) |
| 2.0 | 6.1 | GO:0035473 | lipase binding(GO:0035473) |
| 2.0 | 12.1 | GO:0009378 | four-way junction helicase activity(GO:0009378) |
| 2.0 | 6.1 | GO:0015226 | amino-acid betaine transmembrane transporter activity(GO:0015199) carnitine transmembrane transporter activity(GO:0015226) |
| 2.0 | 28.2 | GO:0004596 | peptide alpha-N-acetyltransferase activity(GO:0004596) |
| 2.0 | 14.0 | GO:0047499 | calcium-independent phospholipase A2 activity(GO:0047499) |
| 2.0 | 90.1 | GO:0004683 | calmodulin-dependent protein kinase activity(GO:0004683) |
| 2.0 | 7.9 | GO:0001588 | dopamine neurotransmitter receptor activity, coupled via Gs(GO:0001588) |
| 2.0 | 5.9 | GO:0015204 | urea transmembrane transporter activity(GO:0015204) |
| 2.0 | 27.5 | GO:0047372 | acylglycerol lipase activity(GO:0047372) |
| 2.0 | 7.8 | GO:0042015 | interleukin-20 binding(GO:0042015) |
| 1.9 | 5.8 | GO:0047708 | biotinidase activity(GO:0047708) |
| 1.9 | 21.4 | GO:0003836 | beta-galactoside (CMP) alpha-2,3-sialyltransferase activity(GO:0003836) |
| 1.9 | 7.7 | GO:0004909 | interleukin-1, Type I, activating receptor activity(GO:0004909) |
| 1.9 | 5.8 | GO:0004936 | alpha-adrenergic receptor activity(GO:0004936) alpha1-adrenergic receptor activity(GO:0004937) |
| 1.9 | 19.3 | GO:0008131 | primary amine oxidase activity(GO:0008131) |
| 1.9 | 51.8 | GO:0043274 | phospholipase binding(GO:0043274) |
| 1.9 | 1.9 | GO:0003846 | 2-acylglycerol O-acyltransferase activity(GO:0003846) |
| 1.9 | 5.8 | GO:0052835 | inositol tetrakisphosphate 1-kinase activity(GO:0047325) inositol tetrakisphosphate kinase activity(GO:0051765) inositol-1,3,4-trisphosphate 6-kinase activity(GO:0052725) inositol-1,3,4-trisphosphate 5-kinase activity(GO:0052726) inositol-1,3,4,5,6-pentakisphosphate 1-phosphatase activity(GO:0052825) inositol-1,3,4,6-tetrakisphosphate 6-phosphatase activity(GO:0052830) inositol-1,3,4,6-tetrakisphosphate 1-phosphatase activity(GO:0052831) inositol-3,4,6-trisphosphate 1-kinase activity(GO:0052835) |
| 1.9 | 3.8 | GO:0048273 | mitogen-activated protein kinase p38 binding(GO:0048273) |
| 1.9 | 5.7 | GO:0070119 | interleukin-6 receptor activity(GO:0004915) interleukin-6 binding(GO:0019981) ciliary neurotrophic factor binding(GO:0070119) |
| 1.9 | 20.8 | GO:0032051 | clathrin light chain binding(GO:0032051) |
| 1.9 | 30.2 | GO:0008327 | methyl-CpG binding(GO:0008327) |
| 1.9 | 54.7 | GO:0004707 | MAP kinase activity(GO:0004707) |
| 1.9 | 11.3 | GO:0052811 | 1-phosphatidylinositol-3-phosphate 4-kinase activity(GO:0052811) |
| 1.9 | 5.6 | GO:0004634 | phosphopyruvate hydratase activity(GO:0004634) |
| 1.9 | 5.6 | GO:0030272 | 5-formyltetrahydrofolate cyclo-ligase activity(GO:0030272) |
| 1.9 | 13.1 | GO:0030020 | extracellular matrix structural constituent conferring tensile strength(GO:0030020) |
| 1.9 | 3.7 | GO:0005151 | interleukin-1, Type II receptor binding(GO:0005151) |
| 1.9 | 24.3 | GO:0031681 | G-protein beta-subunit binding(GO:0031681) |
| 1.9 | 13.1 | GO:0044323 | retinoic acid-responsive element binding(GO:0044323) |
| 1.9 | 9.3 | GO:0030023 | extracellular matrix constituent conferring elasticity(GO:0030023) |
| 1.9 | 5.6 | GO:0033142 | progesterone receptor binding(GO:0033142) |
| 1.9 | 9.3 | GO:0004800 | thyroxine 5'-deiodinase activity(GO:0004800) |
| 1.9 | 5.6 | GO:0047751 | 3-oxo-5-alpha-steroid 4-dehydrogenase activity(GO:0003865) steroid dehydrogenase activity, acting on the CH-CH group of donors(GO:0033765) cholestenone 5-alpha-reductase activity(GO:0047751) |
| 1.8 | 29.6 | GO:0031821 | G-protein coupled serotonin receptor binding(GO:0031821) |
| 1.8 | 1.8 | GO:0042813 | Wnt-activated receptor activity(GO:0042813) |
| 1.8 | 5.5 | GO:0031849 | olfactory receptor binding(GO:0031849) |
| 1.8 | 54.7 | GO:0004435 | phosphatidylinositol phospholipase C activity(GO:0004435) |
| 1.8 | 3.6 | GO:0004052 | arachidonate 12-lipoxygenase activity(GO:0004052) |
| 1.8 | 9.0 | GO:0003956 | NAD(P)+-protein-arginine ADP-ribosyltransferase activity(GO:0003956) |
| 1.8 | 7.1 | GO:0004925 | prolactin receptor activity(GO:0004925) |
| 1.8 | 3.6 | GO:0031716 | calcitonin receptor binding(GO:0031716) |
| 1.8 | 7.1 | GO:0035939 | microsatellite binding(GO:0035939) |
| 1.8 | 40.7 | GO:0004812 | aminoacyl-tRNA ligase activity(GO:0004812) ligase activity, forming carbon-oxygen bonds(GO:0016875) ligase activity, forming aminoacyl-tRNA and related compounds(GO:0016876) |
| 1.8 | 10.6 | GO:0030368 | interleukin-17 receptor activity(GO:0030368) |
| 1.8 | 7.1 | GO:0001632 | leukotriene B4 receptor activity(GO:0001632) |
| 1.8 | 1.8 | GO:0052739 | phosphatidylserine 1-acylhydrolase activity(GO:0052739) |
| 1.7 | 17.4 | GO:0004957 | prostaglandin E receptor activity(GO:0004957) |
| 1.7 | 5.2 | GO:0080019 | fatty-acyl-CoA reductase (alcohol-forming) activity(GO:0080019) |
| 1.7 | 54.0 | GO:0008331 | high voltage-gated calcium channel activity(GO:0008331) |
| 1.7 | 5.2 | GO:0047783 | steroid 11-beta-monooxygenase activity(GO:0004507) corticosterone 18-monooxygenase activity(GO:0047783) |
| 1.7 | 13.9 | GO:1990405 | protein antigen binding(GO:1990405) |
| 1.7 | 22.5 | GO:0036374 | glutathione hydrolase activity(GO:0036374) |
| 1.7 | 5.2 | GO:0042954 | lipoprotein transporter activity(GO:0042954) |
| 1.7 | 90.5 | GO:0043425 | bHLH transcription factor binding(GO:0043425) |
| 1.7 | 30.7 | GO:0042800 | histone methyltransferase activity (H3-K4 specific)(GO:0042800) |
| 1.7 | 11.9 | GO:0005452 | inorganic anion exchanger activity(GO:0005452) |
| 1.7 | 10.2 | GO:0015299 | solute:proton antiporter activity(GO:0015299) |
| 1.7 | 8.5 | GO:0001888 | glucuronyl-galactosyl-proteoglycan 4-alpha-N-acetylglucosaminyltransferase activity(GO:0001888) |
| 1.7 | 32.2 | GO:0035925 | mRNA 3'-UTR AU-rich region binding(GO:0035925) |
| 1.7 | 1.7 | GO:0031694 | alpha-2A adrenergic receptor binding(GO:0031694) |
| 1.7 | 11.7 | GO:0070891 | lipoteichoic acid binding(GO:0070891) |
| 1.7 | 11.7 | GO:0039706 | co-receptor binding(GO:0039706) |
| 1.7 | 5.0 | GO:0008480 | sarcosine dehydrogenase activity(GO:0008480) oxidoreductase activity, acting on the CH-NH group of donors, flavin as acceptor(GO:0046997) |
| 1.7 | 14.9 | GO:0004969 | histamine receptor activity(GO:0004969) |
| 1.7 | 8.3 | GO:0000150 | recombinase activity(GO:0000150) |
| 1.6 | 4.9 | GO:0005055 | laminin receptor activity(GO:0005055) |
| 1.6 | 4.9 | GO:0070643 | vitamin D3 25-hydroxylase activity(GO:0030343) vitamin D 25-hydroxylase activity(GO:0070643) |
| 1.6 | 6.6 | GO:0047192 | 1-alkylglycerophosphocholine O-acetyltransferase activity(GO:0047192) |
| 1.6 | 11.4 | GO:0004797 | thymidine kinase activity(GO:0004797) |
| 1.6 | 14.7 | GO:0046920 | alpha-(1->3)-fucosyltransferase activity(GO:0046920) |
| 1.6 | 24.3 | GO:0048406 | nerve growth factor binding(GO:0048406) |
| 1.6 | 6.5 | GO:0070546 | L-phenylalanine aminotransferase activity(GO:0070546) |
| 1.6 | 16.1 | GO:0051011 | microtubule minus-end binding(GO:0051011) |
| 1.6 | 8.0 | GO:0001025 | RNA polymerase III transcription factor binding(GO:0001025) |
| 1.6 | 4.8 | GO:0097677 | STAT family protein binding(GO:0097677) |
| 1.6 | 4.7 | GO:0048185 | activin binding(GO:0048185) |
| 1.6 | 3.1 | GO:0004992 | platelet activating factor receptor activity(GO:0004992) |
| 1.6 | 9.4 | GO:0004935 | adrenergic receptor activity(GO:0004935) |
| 1.6 | 9.4 | GO:0022821 | calcium, potassium:sodium antiporter activity(GO:0008273) potassium ion antiporter activity(GO:0022821) |
| 1.5 | 27.8 | GO:0004089 | carbonate dehydratase activity(GO:0004089) |
| 1.5 | 3.1 | GO:0047045 | testosterone 17-beta-dehydrogenase (NADP+) activity(GO:0047045) |
| 1.5 | 9.2 | GO:0061665 | SUMO ligase activity(GO:0061665) |
| 1.5 | 73.4 | GO:0005254 | chloride channel activity(GO:0005254) |
| 1.5 | 6.1 | GO:0004679 | AMP-activated protein kinase activity(GO:0004679) |
| 1.5 | 3.0 | GO:0008392 | arachidonic acid monooxygenase activity(GO:0008391) arachidonic acid epoxygenase activity(GO:0008392) |
| 1.5 | 94.4 | GO:0070412 | R-SMAD binding(GO:0070412) |
| 1.5 | 4.6 | GO:0047757 | chondroitin-glucuronate 5-epimerase activity(GO:0047757) |
| 1.5 | 84.9 | GO:0030507 | spectrin binding(GO:0030507) |
| 1.5 | 19.7 | GO:0030306 | ADP-ribosylation factor binding(GO:0030306) |
| 1.5 | 7.5 | GO:0016841 | ammonia-lyase activity(GO:0016841) |
| 1.5 | 7.5 | GO:0031871 | proteinase activated receptor binding(GO:0031871) |
| 1.5 | 16.3 | GO:0051864 | histone demethylase activity (H3-K36 specific)(GO:0051864) |
| 1.5 | 5.9 | GO:0016230 | sphingomyelin phosphodiesterase activator activity(GO:0016230) |
| 1.5 | 5.9 | GO:0086077 | gap junction channel activity involved in SA node cell-atrial cardiac muscle cell electrical coupling(GO:0086020) gap junction channel activity involved in AV node cell-bundle of His cell electrical coupling(GO:0086077) |
| 1.5 | 22.1 | GO:0070403 | NAD+ binding(GO:0070403) |
| 1.5 | 8.8 | GO:0018685 | alkane 1-monooxygenase activity(GO:0018685) |
| 1.5 | 17.6 | GO:0032395 | MHC class II receptor activity(GO:0032395) |
| 1.5 | 13.2 | GO:0008526 | phosphatidylinositol transporter activity(GO:0008526) |
| 1.5 | 1.5 | GO:0004980 | melanocyte-stimulating hormone receptor activity(GO:0004980) |
| 1.5 | 7.3 | GO:0046899 | nucleoside triphosphate adenylate kinase activity(GO:0046899) |
| 1.5 | 68.6 | GO:0004112 | cyclic-nucleotide phosphodiesterase activity(GO:0004112) |
| 1.4 | 4.3 | GO:0061609 | fructose-1-phosphate aldolase activity(GO:0061609) |
| 1.4 | 5.8 | GO:0003873 | 6-phosphofructo-2-kinase activity(GO:0003873) |
| 1.4 | 8.7 | GO:0000179 | rRNA (adenine-N6,N6-)-dimethyltransferase activity(GO:0000179) |
| 1.4 | 5.8 | GO:0070905 | serine binding(GO:0070905) |
| 1.4 | 24.5 | GO:0017160 | Ral GTPase binding(GO:0017160) |
| 1.4 | 4.3 | GO:0004687 | myosin light chain kinase activity(GO:0004687) |
| 1.4 | 5.8 | GO:0071813 | lipoprotein particle binding(GO:0071813) protein-lipid complex binding(GO:0071814) |
| 1.4 | 11.5 | GO:1902282 | voltage-gated potassium channel activity involved in ventricular cardiac muscle cell action potential repolarization(GO:1902282) |
| 1.4 | 4.3 | GO:0004963 | follicle-stimulating hormone receptor activity(GO:0004963) |
| 1.4 | 18.6 | GO:0042608 | T cell receptor binding(GO:0042608) |
| 1.4 | 15.7 | GO:0033613 | activating transcription factor binding(GO:0033613) |
| 1.4 | 11.4 | GO:0004111 | creatine kinase activity(GO:0004111) |
| 1.4 | 7.1 | GO:0043891 | glyceraldehyde-3-phosphate dehydrogenase (NAD+) (phosphorylating) activity(GO:0004365) glyceraldehyde-3-phosphate dehydrogenase (NAD(P)+) (phosphorylating) activity(GO:0043891) |
| 1.4 | 8.5 | GO:0016900 | oxidoreductase activity, acting on the CH-OH group of donors, disulfide as acceptor(GO:0016900) vitamin-K-epoxide reductase (warfarin-sensitive) activity(GO:0047057) |
| 1.4 | 4.2 | GO:0047756 | chondroitin 4-sulfotransferase activity(GO:0047756) |
| 1.4 | 8.4 | GO:0005221 | intracellular cyclic nucleotide activated cation channel activity(GO:0005221) cyclic nucleotide-gated ion channel activity(GO:0043855) |
| 1.4 | 11.1 | GO:0032396 | inhibitory MHC class I receptor activity(GO:0032396) |
| 1.4 | 20.7 | GO:0015643 | toxic substance binding(GO:0015643) |
| 1.4 | 38.3 | GO:0008395 | steroid hydroxylase activity(GO:0008395) |
| 1.4 | 6.8 | GO:0010857 | calcium-dependent protein kinase activity(GO:0010857) |
| 1.4 | 4.1 | GO:0035241 | protein-arginine omega-N monomethyltransferase activity(GO:0035241) |
| 1.3 | 4.0 | GO:0008267 | poly-glutamine tract binding(GO:0008267) |
| 1.3 | 8.1 | GO:0005220 | inositol 1,4,5-trisphosphate-sensitive calcium-release channel activity(GO:0005220) |
| 1.3 | 1.3 | GO:0016647 | oxidoreductase activity, acting on the CH-NH group of donors, oxygen as acceptor(GO:0016647) |
| 1.3 | 5.3 | GO:0008158 | hedgehog receptor activity(GO:0008158) |
| 1.3 | 2.7 | GO:0001002 | polymerase III regulatory region sequence-specific DNA binding(GO:0000992) RNA polymerase III type 1 promoter sequence-specific DNA binding(GO:0001002) RNA polymerase III type 2 promoter sequence-specific DNA binding(GO:0001003) |
| 1.3 | 4.0 | GO:0019166 | trans-2-enoyl-CoA reductase (NADPH) activity(GO:0019166) |
| 1.3 | 6.6 | GO:0030060 | L-malate dehydrogenase activity(GO:0030060) |
| 1.3 | 34.3 | GO:0008519 | ammonium transmembrane transporter activity(GO:0008519) |
| 1.3 | 2.6 | GO:0004995 | tachykinin receptor activity(GO:0004995) |
| 1.3 | 6.5 | GO:0043546 | molybdopterin cofactor binding(GO:0043546) |
| 1.3 | 11.6 | GO:0050682 | AF-2 domain binding(GO:0050682) |
| 1.3 | 14.1 | GO:0005520 | insulin-like growth factor binding(GO:0005520) |
| 1.3 | 3.8 | GO:0015562 | efflux transmembrane transporter activity(GO:0015562) |
| 1.3 | 343.6 | GO:0004252 | serine-type endopeptidase activity(GO:0004252) |
| 1.3 | 32.8 | GO:0043015 | gamma-tubulin binding(GO:0043015) |
| 1.3 | 10.0 | GO:0043995 | histone acetyltransferase activity (H4-K5 specific)(GO:0043995) histone acetyltransferase activity (H4-K8 specific)(GO:0043996) histone acetyltransferase activity (H4-K16 specific)(GO:0046972) |
| 1.2 | 6.2 | GO:0050610 | glutathione dehydrogenase (ascorbate) activity(GO:0045174) methylarsonate reductase activity(GO:0050610) |
| 1.2 | 5.0 | GO:0004104 | cholinesterase activity(GO:0004104) |
| 1.2 | 2.5 | GO:0016890 | site-specific endodeoxyribonuclease activity, specific for altered base(GO:0016890) |
| 1.2 | 3.7 | GO:0008330 | protein tyrosine/threonine phosphatase activity(GO:0008330) |
| 1.2 | 3.7 | GO:0071074 | eukaryotic initiation factor eIF2 binding(GO:0071074) |
| 1.2 | 11.1 | GO:0015279 | store-operated calcium channel activity(GO:0015279) |
| 1.2 | 23.2 | GO:0038191 | neuropilin binding(GO:0038191) |
| 1.2 | 6.1 | GO:0052844 | endopolyphosphatase activity(GO:0000298) diphosphoinositol-polyphosphate diphosphatase activity(GO:0008486) bis(5'-adenosyl)-hexaphosphatase activity(GO:0034431) bis(5'-adenosyl)-pentaphosphatase activity(GO:0034432) inositol diphosphate tetrakisphosphate diphosphatase activity(GO:0052840) inositol bisdiphosphate tetrakisphosphate diphosphatase activity(GO:0052841) inositol diphosphate pentakisphosphate diphosphatase activity(GO:0052842) inositol-1-diphosphate-2,3,4,5,6-pentakisphosphate diphosphatase activity(GO:0052843) inositol-3-diphosphate-1,2,4,5,6-pentakisphosphate diphosphatase activity(GO:0052844) inositol-5-diphosphate-1,2,3,4,6-pentakisphosphate diphosphatase activity(GO:0052845) inositol-1,5-bisdiphosphate-2,3,4,6-tetrakisphosphate 1-diphosphatase activity(GO:0052846) inositol-1,5-bisdiphosphate-2,3,4,6-tetrakisphosphate 5-diphosphatase activity(GO:0052847) inositol-3,5-bisdiphosphate-2,3,4,6-tetrakisphosphate 5-diphosphatase activity(GO:0052848) |
| 1.2 | 4.9 | GO:0008422 | beta-glucosidase activity(GO:0008422) |
| 1.2 | 2.4 | GO:0071532 | ankyrin repeat binding(GO:0071532) |
| 1.2 | 6.1 | GO:0070728 | leucine binding(GO:0070728) |
| 1.2 | 14.4 | GO:0035497 | cAMP response element binding(GO:0035497) |
| 1.2 | 17.9 | GO:0001223 | transcription coactivator binding(GO:0001223) |
| 1.2 | 7.2 | GO:0004046 | aminoacylase activity(GO:0004046) |
| 1.2 | 7.1 | GO:0008597 | calcium-dependent protein serine/threonine phosphatase regulator activity(GO:0008597) |
| 1.2 | 2.4 | GO:0004874 | aryl hydrocarbon receptor activity(GO:0004874) |
| 1.2 | 4.7 | GO:0043237 | laminin-1 binding(GO:0043237) |
| 1.2 | 5.9 | GO:0004082 | bisphosphoglycerate mutase activity(GO:0004082) phosphoglycerate mutase activity(GO:0004619) 2,3-bisphosphoglycerate-dependent phosphoglycerate mutase activity(GO:0046538) |
| 1.2 | 10.5 | GO:0004767 | sphingomyelin phosphodiesterase activity(GO:0004767) |
| 1.2 | 1.2 | GO:0000822 | inositol hexakisphosphate binding(GO:0000822) |
| 1.2 | 128.8 | GO:0005089 | Rho guanyl-nucleotide exchange factor activity(GO:0005089) |
| 1.1 | 11.5 | GO:0004716 | receptor signaling protein tyrosine kinase activity(GO:0004716) |
| 1.1 | 16.0 | GO:0050693 | LBD domain binding(GO:0050693) |
| 1.1 | 4.6 | GO:0003976 | UDP-N-acetylglucosamine-lysosomal-enzyme N-acetylglucosaminephosphotransferase activity(GO:0003976) |
| 1.1 | 6.8 | GO:0051032 | nucleic acid transmembrane transporter activity(GO:0051032) RNA transmembrane transporter activity(GO:0051033) |
| 1.1 | 36.3 | GO:0019198 | transmembrane receptor protein tyrosine phosphatase activity(GO:0005001) transmembrane receptor protein phosphatase activity(GO:0019198) |
| 1.1 | 1.1 | GO:0005143 | interleukin-12 receptor binding(GO:0005143) |
| 1.1 | 3.4 | GO:0005030 | neurotrophin receptor activity(GO:0005030) |
| 1.1 | 17.7 | GO:0051787 | misfolded protein binding(GO:0051787) |
| 1.1 | 23.1 | GO:0004029 | aldehyde dehydrogenase (NAD) activity(GO:0004029) |
| 1.1 | 20.9 | GO:0005217 | intracellular ligand-gated ion channel activity(GO:0005217) |
| 1.1 | 3.3 | GO:0047631 | ADP-ribose diphosphatase activity(GO:0047631) |
| 1.1 | 4.4 | GO:0004666 | prostaglandin-endoperoxide synthase activity(GO:0004666) |
| 1.1 | 32.7 | GO:0017147 | Wnt-protein binding(GO:0017147) |
| 1.1 | 49.0 | GO:0008080 | N-acetyltransferase activity(GO:0008080) |
| 1.1 | 3.3 | GO:0047184 | 1-acylglycerophosphocholine O-acyltransferase activity(GO:0047184) |
| 1.1 | 2.2 | GO:0016019 | peptidoglycan receptor activity(GO:0016019) |
| 1.1 | 5.4 | GO:0047374 | methylumbelliferyl-acetate deacetylase activity(GO:0047374) |
| 1.1 | 26.9 | GO:1905030 | voltage-gated sodium channel activity(GO:0005248) voltage-gated ion channel activity involved in regulation of postsynaptic membrane potential(GO:1905030) |
| 1.1 | 3.2 | GO:0005152 | interleukin-1 receptor antagonist activity(GO:0005152) |
| 1.1 | 15.8 | GO:0019789 | SUMO transferase activity(GO:0019789) |
| 1.1 | 12.6 | GO:0003996 | acyl-CoA ligase activity(GO:0003996) |
| 1.0 | 5.2 | GO:0004351 | glutamate decarboxylase activity(GO:0004351) |
| 1.0 | 17.7 | GO:1990380 | Lys48-specific deubiquitinase activity(GO:1990380) |
| 1.0 | 5.1 | GO:0001162 | RNA polymerase II intronic transcription regulatory region sequence-specific DNA binding(GO:0001162) |
| 1.0 | 5.1 | GO:0099529 | neurotransmitter receptor activity involved in regulation of postsynaptic membrane potential(GO:0099529) transmitter-gated ion channel activity involved in regulation of postsynaptic membrane potential(GO:1904315) |
| 1.0 | 7.2 | GO:0004873 | asialoglycoprotein receptor activity(GO:0004873) |
| 1.0 | 12.2 | GO:0042809 | vitamin D receptor binding(GO:0042809) |
| 1.0 | 10.2 | GO:0001042 | RNA polymerase I core binding(GO:0001042) |
| 1.0 | 9.1 | GO:0017162 | aryl hydrocarbon receptor binding(GO:0017162) |
| 1.0 | 2.0 | GO:0050051 | leukotriene-B4 20-monooxygenase activity(GO:0050051) |
| 1.0 | 5.0 | GO:0061676 | importin-alpha family protein binding(GO:0061676) |
| 1.0 | 9.0 | GO:0015277 | kainate selective glutamate receptor activity(GO:0015277) |
| 1.0 | 21.6 | GO:0070006 | metalloaminopeptidase activity(GO:0070006) |
| 1.0 | 2.9 | GO:0051377 | mannose-ethanolamine phosphotransferase activity(GO:0051377) |
| 1.0 | 16.6 | GO:0009881 | photoreceptor activity(GO:0009881) |
| 1.0 | 6.8 | GO:0042500 | aspartic endopeptidase activity, intramembrane cleaving(GO:0042500) |
| 1.0 | 2.9 | GO:1903763 | gap junction channel activity involved in cell communication by electrical coupling(GO:1903763) |
| 1.0 | 1.9 | GO:0016532 | superoxide dismutase copper chaperone activity(GO:0016532) |
| 1.0 | 2.9 | GO:0036505 | prosaposin receptor activity(GO:0036505) |
| 1.0 | 5.8 | GO:0008430 | selenium binding(GO:0008430) |
| 1.0 | 19.4 | GO:0003995 | acyl-CoA dehydrogenase activity(GO:0003995) |
| 1.0 | 3.9 | GO:0061628 | H3K27me3 modified histone binding(GO:0061628) |
| 1.0 | 16.4 | GO:0001530 | lipopolysaccharide binding(GO:0001530) |
| 1.0 | 3.9 | GO:0045569 | TRAIL binding(GO:0045569) |
| 1.0 | 7.7 | GO:0016015 | morphogen activity(GO:0016015) |
| 1.0 | 3.9 | GO:0004102 | choline O-acetyltransferase activity(GO:0004102) |
| 1.0 | 5.8 | GO:0004614 | phosphoglucomutase activity(GO:0004614) |
| 1.0 | 9.6 | GO:0047498 | calcium-dependent phospholipase A2 activity(GO:0047498) |
| 1.0 | 5.8 | GO:0004468 | lysine N-acetyltransferase activity, acting on acetyl phosphate as donor(GO:0004468) |
| 1.0 | 24.9 | GO:0032266 | phosphatidylinositol-3-phosphate binding(GO:0032266) |
| 1.0 | 19.1 | GO:0005522 | profilin binding(GO:0005522) |
| 1.0 | 73.6 | GO:0005249 | voltage-gated potassium channel activity(GO:0005249) |
| 1.0 | 2.9 | GO:0004878 | complement component C5a receptor activity(GO:0004878) |
| 0.9 | 12.2 | GO:0016849 | phosphorus-oxygen lyase activity(GO:0016849) |
| 0.9 | 2.8 | GO:0008169 | C-methyltransferase activity(GO:0008169) |
| 0.9 | 21.5 | GO:0043325 | phosphatidylinositol-3,4-bisphosphate binding(GO:0043325) |
| 0.9 | 5.6 | GO:0008853 | exodeoxyribonuclease III activity(GO:0008853) |
| 0.9 | 12.0 | GO:0016805 | dipeptidase activity(GO:0016805) |
| 0.9 | 8.3 | GO:0009374 | biotin binding(GO:0009374) |
| 0.9 | 3.7 | GO:0017077 | oxidative phosphorylation uncoupler activity(GO:0017077) |
| 0.9 | 3.7 | GO:0004802 | transketolase activity(GO:0004802) |
| 0.9 | 10.1 | GO:0017034 | Rap guanyl-nucleotide exchange factor activity(GO:0017034) |
| 0.9 | 3.6 | GO:0004176 | ATP-dependent peptidase activity(GO:0004176) |
| 0.9 | 73.7 | GO:0005201 | extracellular matrix structural constituent(GO:0005201) |
| 0.9 | 21.8 | GO:0005024 | transforming growth factor beta-activated receptor activity(GO:0005024) |
| 0.9 | 3.6 | GO:0004996 | thyroid-stimulating hormone receptor activity(GO:0004996) |
| 0.9 | 79.9 | GO:0019905 | syntaxin binding(GO:0019905) |
| 0.9 | 28.8 | GO:0005184 | neuropeptide hormone activity(GO:0005184) |
| 0.9 | 1.8 | GO:0070653 | high-density lipoprotein particle receptor binding(GO:0070653) |
| 0.9 | 17.9 | GO:0097109 | neuroligin family protein binding(GO:0097109) |
| 0.9 | 4.4 | GO:0004971 | AMPA glutamate receptor activity(GO:0004971) |
| 0.9 | 19.5 | GO:0000030 | mannosyltransferase activity(GO:0000030) |
| 0.9 | 13.3 | GO:0031996 | thioesterase binding(GO:0031996) |
| 0.9 | 43.3 | GO:0016279 | lysine N-methyltransferase activity(GO:0016278) protein-lysine N-methyltransferase activity(GO:0016279) |
| 0.9 | 26.2 | GO:0071837 | HMG box domain binding(GO:0071837) |
| 0.9 | 2.6 | GO:0008321 | Ral guanyl-nucleotide exchange factor activity(GO:0008321) |
| 0.9 | 3.5 | GO:0008798 | beta-aspartyl-peptidase activity(GO:0008798) |
| 0.9 | 3.5 | GO:0016495 | C-X3-C chemokine receptor activity(GO:0016495) |
| 0.9 | 7.8 | GO:0004602 | glutathione peroxidase activity(GO:0004602) |
| 0.9 | 9.5 | GO:0031995 | insulin-like growth factor II binding(GO:0031995) |
| 0.9 | 3.4 | GO:0052591 | sn-glycerol-3-phosphate:ubiquinone oxidoreductase activity(GO:0052590) sn-glycerol-3-phosphate:ubiquinone-8 oxidoreductase activity(GO:0052591) |
| 0.9 | 2.6 | GO:0001641 | group II metabotropic glutamate receptor activity(GO:0001641) |
| 0.9 | 53.7 | GO:0004712 | protein serine/threonine/tyrosine kinase activity(GO:0004712) |
| 0.8 | 5.1 | GO:0017040 | ceramidase activity(GO:0017040) |
| 0.8 | 5.8 | GO:0008417 | fucosyltransferase activity(GO:0008417) |
| 0.8 | 4.2 | GO:0004464 | leukotriene-C4 synthase activity(GO:0004464) |
| 0.8 | 10.8 | GO:0031419 | cobalamin binding(GO:0031419) |
| 0.8 | 11.6 | GO:0045236 | CXCR chemokine receptor binding(GO:0045236) |
| 0.8 | 4.9 | GO:0044213 | intronic transcription regulatory region sequence-specific DNA binding(GO:0001161) intronic transcription regulatory region DNA binding(GO:0044213) |
| 0.8 | 5.7 | GO:0042923 | neuropeptide binding(GO:0042923) |
| 0.8 | 4.1 | GO:0033743 | peptide-methionine (R)-S-oxide reductase activity(GO:0033743) |
| 0.8 | 9.7 | GO:0016494 | C-X-C chemokine receptor activity(GO:0016494) |
| 0.8 | 4.9 | GO:0034618 | nitric-oxide synthase activity(GO:0004517) arginine binding(GO:0034618) |
| 0.8 | 4.0 | GO:0051373 | FATZ binding(GO:0051373) |
| 0.8 | 3.2 | GO:0030628 | pre-mRNA 3'-splice site binding(GO:0030628) |
| 0.8 | 2.4 | GO:0060422 | peptidyl-dipeptidase inhibitor activity(GO:0060422) |
| 0.8 | 2.4 | GO:0050501 | hyaluronan synthase activity(GO:0050501) |
| 0.8 | 11.2 | GO:0032036 | myosin heavy chain binding(GO:0032036) |
| 0.8 | 5.6 | GO:0005004 | GPI-linked ephrin receptor activity(GO:0005004) |
| 0.8 | 2.4 | GO:0017153 | sodium:dicarboxylate symporter activity(GO:0017153) |
| 0.8 | 9.4 | GO:0005003 | ephrin receptor activity(GO:0005003) |
| 0.8 | 4.6 | GO:0031697 | beta-1 adrenergic receptor binding(GO:0031697) |
| 0.8 | 4.6 | GO:0005068 | transmembrane receptor protein tyrosine kinase adaptor activity(GO:0005068) |
| 0.8 | 2.3 | GO:0004886 | 9-cis retinoic acid receptor activity(GO:0004886) |
| 0.8 | 6.9 | GO:0035612 | AP-2 adaptor complex binding(GO:0035612) |
| 0.8 | 3.8 | GO:0017018 | myosin phosphatase activity(GO:0017018) |
| 0.8 | 12.1 | GO:0017046 | peptide hormone binding(GO:0017046) |
| 0.8 | 1.5 | GO:0017129 | triglyceride binding(GO:0017129) |
| 0.7 | 14.2 | GO:0005272 | sodium channel activity(GO:0005272) |
| 0.7 | 9.0 | GO:0043125 | ErbB-3 class receptor binding(GO:0043125) |
| 0.7 | 4.4 | GO:0015350 | reduced folate carrier activity(GO:0008518) methotrexate transporter activity(GO:0015350) |
| 0.7 | 2.2 | GO:0004955 | prostaglandin receptor activity(GO:0004955) |
| 0.7 | 5.2 | GO:0001517 | N-acetylglucosamine 6-O-sulfotransferase activity(GO:0001517) |
| 0.7 | 8.8 | GO:0045294 | alpha-catenin binding(GO:0045294) |
| 0.7 | 15.2 | GO:0008188 | neuropeptide receptor activity(GO:0008188) |
| 0.7 | 60.1 | GO:0003707 | steroid hormone receptor activity(GO:0003707) |
| 0.7 | 2.2 | GO:0042008 | interleukin-18 receptor activity(GO:0042008) |
| 0.7 | 27.1 | GO:0017080 | sodium channel regulator activity(GO:0017080) |
| 0.7 | 3.6 | GO:0034483 | heparan sulfate sulfotransferase activity(GO:0034483) |
| 0.7 | 5.0 | GO:1903136 | cuprous ion binding(GO:1903136) |
| 0.7 | 2.1 | GO:0016429 | tRNA (adenine-N1-)-methyltransferase activity(GO:0016429) |
| 0.7 | 2.1 | GO:0015145 | monosaccharide transmembrane transporter activity(GO:0015145) |
| 0.7 | 20.2 | GO:0005388 | calcium-transporting ATPase activity(GO:0005388) |
| 0.7 | 1.4 | GO:0016401 | palmitoyl-CoA oxidase activity(GO:0016401) |
| 0.7 | 15.2 | GO:0071949 | FAD binding(GO:0071949) |
| 0.7 | 2.7 | GO:0070742 | C2H2 zinc finger domain binding(GO:0070742) |
| 0.7 | 4.8 | GO:0004499 | N,N-dimethylaniline monooxygenase activity(GO:0004499) |
| 0.7 | 2.0 | GO:0060001 | minus-end directed microfilament motor activity(GO:0060001) |
| 0.7 | 1.4 | GO:0060230 | lipoprotein lipase activator activity(GO:0060230) |
| 0.7 | 4.1 | GO:0051525 | NFAT protein binding(GO:0051525) |
| 0.7 | 2.0 | GO:0052796 | exo-alpha-(2->3)-sialidase activity(GO:0052794) exo-alpha-(2->6)-sialidase activity(GO:0052795) exo-alpha-(2->8)-sialidase activity(GO:0052796) |
| 0.7 | 6.7 | GO:0004993 | G-protein coupled serotonin receptor activity(GO:0004993) |
| 0.7 | 0.7 | GO:0045499 | chemorepellent activity(GO:0045499) |
| 0.7 | 62.7 | GO:0005179 | hormone activity(GO:0005179) |
| 0.7 | 0.7 | GO:0019828 | aspartic-type endopeptidase inhibitor activity(GO:0019828) |
| 0.7 | 8.6 | GO:0008066 | glutamate receptor activity(GO:0008066) |
| 0.7 | 4.0 | GO:0002114 | interleukin-33 receptor activity(GO:0002114) |
| 0.7 | 4.6 | GO:0035368 | selenocysteine insertion sequence binding(GO:0035368) |
| 0.7 | 3.3 | GO:0008296 | 3'-5'-exodeoxyribonuclease activity(GO:0008296) |
| 0.6 | 2.6 | GO:0016520 | growth hormone-releasing hormone receptor activity(GO:0016520) |
| 0.6 | 3.2 | GO:0003835 | beta-galactoside alpha-2,6-sialyltransferase activity(GO:0003835) |
| 0.6 | 3.2 | GO:0005157 | macrophage colony-stimulating factor receptor binding(GO:0005157) |
| 0.6 | 8.9 | GO:0004806 | triglyceride lipase activity(GO:0004806) |
| 0.6 | 133.4 | GO:0005085 | guanyl-nucleotide exchange factor activity(GO:0005085) |
| 0.6 | 1.2 | GO:0008035 | high-density lipoprotein particle binding(GO:0008035) |
| 0.6 | 5.0 | GO:0003906 | DNA-(apurinic or apyrimidinic site) lyase activity(GO:0003906) |
| 0.6 | 4.3 | GO:1904288 | BAT3 complex binding(GO:1904288) |
| 0.6 | 20.2 | GO:0005104 | fibroblast growth factor receptor binding(GO:0005104) |
| 0.6 | 15.0 | GO:0030742 | GTP-dependent protein binding(GO:0030742) |
| 0.6 | 1.2 | GO:0004711 | ribosomal protein S6 kinase activity(GO:0004711) |
| 0.6 | 786.0 | GO:0001071 | nucleic acid binding transcription factor activity(GO:0001071) transcription factor activity, sequence-specific DNA binding(GO:0003700) |
| 0.6 | 3.0 | GO:0004370 | glycerol kinase activity(GO:0004370) |
| 0.6 | 1.8 | GO:0003845 | 11-beta-hydroxysteroid dehydrogenase [NAD(P)] activity(GO:0003845) |
| 0.6 | 2.9 | GO:0000403 | Y-form DNA binding(GO:0000403) double-strand/single-strand DNA junction binding(GO:0000406) dinucleotide repeat insertion binding(GO:0032181) |
| 0.6 | 14.0 | GO:0016409 | palmitoyltransferase activity(GO:0016409) |
| 0.6 | 18.3 | GO:0004709 | MAP kinase kinase kinase activity(GO:0004709) |
| 0.6 | 4.5 | GO:0005000 | vasopressin receptor activity(GO:0005000) |
| 0.6 | 16.2 | GO:0005230 | extracellular ligand-gated ion channel activity(GO:0005230) |
| 0.6 | 1.7 | GO:0005042 | netrin receptor activity(GO:0005042) |
| 0.5 | 9.9 | GO:0051371 | muscle alpha-actinin binding(GO:0051371) |
| 0.5 | 10.3 | GO:0031005 | filamin binding(GO:0031005) |
| 0.5 | 4.3 | GO:0016594 | glycine binding(GO:0016594) |
| 0.5 | 1.1 | GO:0031727 | CCR2 chemokine receptor binding(GO:0031727) |
| 0.5 | 2.1 | GO:0005415 | nucleoside:sodium symporter activity(GO:0005415) |
| 0.5 | 1.6 | GO:0070039 | rRNA (guanosine-2'-O-)-methyltransferase activity(GO:0070039) |
| 0.5 | 7.3 | GO:0008429 | phosphatidylethanolamine binding(GO:0008429) |
| 0.5 | 3.1 | GO:0019863 | IgE binding(GO:0019863) |
| 0.5 | 2.1 | GO:0003875 | ADP-ribosylarginine hydrolase activity(GO:0003875) |
| 0.5 | 10.9 | GO:0008191 | metalloendopeptidase inhibitor activity(GO:0008191) |
| 0.5 | 1.0 | GO:0047223 | beta-1,3-galactosyl-O-glycosyl-glycoprotein beta-1,3-N-acetylglucosaminyltransferase activity(GO:0047223) |
| 0.5 | 4.1 | GO:0015926 | glucosidase activity(GO:0015926) |
| 0.5 | 13.8 | GO:0046875 | ephrin receptor binding(GO:0046875) |
| 0.5 | 1.5 | GO:0008113 | peptide-methionine (S)-S-oxide reductase activity(GO:0008113) |
| 0.5 | 11.6 | GO:0005035 | tumor necrosis factor-activated receptor activity(GO:0005031) death receptor activity(GO:0005035) |
| 0.5 | 2.9 | GO:0039552 | RIG-I binding(GO:0039552) |
| 0.5 | 3.4 | GO:0015232 | heme transporter activity(GO:0015232) |
| 0.5 | 2.4 | GO:0004692 | cGMP-dependent protein kinase activity(GO:0004692) |
| 0.5 | 4.3 | GO:0030884 | lipid antigen binding(GO:0030882) endogenous lipid antigen binding(GO:0030883) exogenous lipid antigen binding(GO:0030884) |
| 0.5 | 3.8 | GO:0043184 | vascular endothelial growth factor receptor 2 binding(GO:0043184) |
| 0.5 | 5.7 | GO:0047035 | testosterone dehydrogenase (NAD+) activity(GO:0047035) |
| 0.5 | 4.3 | GO:0032183 | SUMO binding(GO:0032183) |
| 0.5 | 4.3 | GO:0004875 | complement receptor activity(GO:0004875) |
| 0.5 | 8.5 | GO:0005109 | frizzled binding(GO:0005109) |
| 0.5 | 7.0 | GO:0008198 | ferrous iron binding(GO:0008198) |
| 0.4 | 2.2 | GO:0003945 | N-acetyllactosamine synthase activity(GO:0003945) |
| 0.4 | 1.3 | GO:0008281 | sulfonylurea receptor activity(GO:0008281) |
| 0.4 | 7.5 | GO:0016493 | C-C chemokine receptor activity(GO:0016493) |
| 0.4 | 16.7 | GO:0016706 | oxidoreductase activity, acting on paired donors, with incorporation or reduction of molecular oxygen, 2-oxoglutarate as one donor, and incorporation of one atom each of oxygen into both donors(GO:0016706) |
| 0.4 | 2.5 | GO:0031685 | adenosine receptor binding(GO:0031685) |
| 0.4 | 5.7 | GO:0048018 | receptor agonist activity(GO:0048018) |
| 0.4 | 2.8 | GO:0015065 | uridine nucleotide receptor activity(GO:0015065) G-protein coupled pyrimidinergic nucleotide receptor activity(GO:0071553) |
| 0.4 | 1.6 | GO:0035800 | deubiquitinase activator activity(GO:0035800) |
| 0.4 | 1.6 | GO:0022865 | transmembrane electron transfer carrier(GO:0022865) |
| 0.4 | 4.7 | GO:0001102 | RNA polymerase II activating transcription factor binding(GO:0001102) |
| 0.4 | 1.5 | GO:0043273 | CTPase activity(GO:0043273) |
| 0.4 | 1.1 | GO:0002046 | opsin binding(GO:0002046) |
| 0.4 | 2.2 | GO:0033130 | acetylcholine receptor binding(GO:0033130) |
| 0.4 | 1.5 | GO:0004768 | stearoyl-CoA 9-desaturase activity(GO:0004768) acyl-CoA desaturase activity(GO:0016215) |
| 0.4 | 4.0 | GO:0016423 | tRNA (guanine) methyltransferase activity(GO:0016423) |
| 0.4 | 0.7 | GO:0005549 | odorant binding(GO:0005549) |
| 0.4 | 1.1 | GO:0003858 | 3-hydroxybutyrate dehydrogenase activity(GO:0003858) |
| 0.4 | 1.8 | GO:0019912 | cyclin-dependent protein kinase activating kinase activity(GO:0019912) |
| 0.3 | 1.7 | GO:0016427 | tRNA (cytosine) methyltransferase activity(GO:0016427) |
| 0.3 | 1.4 | GO:0019841 | retinol binding(GO:0019841) |
| 0.3 | 2.8 | GO:0003909 | DNA ligase activity(GO:0003909) |
| 0.3 | 2.4 | GO:0004623 | phospholipase A2 activity(GO:0004623) |
| 0.3 | 0.7 | GO:0004630 | phospholipase D activity(GO:0004630) |
| 0.3 | 2.4 | GO:0045545 | syndecan binding(GO:0045545) |
| 0.3 | 1.0 | GO:0050698 | proteoglycan sulfotransferase activity(GO:0050698) |
| 0.3 | 4.0 | GO:0051434 | BH3 domain binding(GO:0051434) |
| 0.3 | 3.6 | GO:0017154 | semaphorin receptor activity(GO:0017154) |
| 0.3 | 2.2 | GO:0005243 | gap junction channel activity(GO:0005243) |
| 0.3 | 2.8 | GO:0035325 | Toll-like receptor binding(GO:0035325) |
| 0.3 | 21.1 | GO:0004896 | cytokine receptor activity(GO:0004896) |
| 0.3 | 2.8 | GO:0015924 | mannosyl-oligosaccharide mannosidase activity(GO:0015924) |
| 0.3 | 6.2 | GO:0005528 | macrolide binding(GO:0005527) FK506 binding(GO:0005528) |
| 0.3 | 0.9 | GO:0036080 | GDP-fucose transmembrane transporter activity(GO:0005457) purine nucleotide-sugar transmembrane transporter activity(GO:0036080) |
| 0.3 | 1.2 | GO:0015056 | corticotrophin-releasing factor receptor activity(GO:0015056) |
| 0.3 | 1.2 | GO:0036122 | BMP binding(GO:0036122) |
| 0.3 | 0.9 | GO:0008410 | CoA-transferase activity(GO:0008410) |
| 0.3 | 0.6 | GO:0003923 | GPI-anchor transamidase activity(GO:0003923) |
| 0.3 | 1.1 | GO:0019862 | IgA binding(GO:0019862) |
| 0.3 | 8.1 | GO:0005212 | structural constituent of eye lens(GO:0005212) |
| 0.3 | 1.4 | GO:0016453 | C-acetyltransferase activity(GO:0016453) |
| 0.3 | 1.1 | GO:0017159 | pantetheine hydrolase activity(GO:0017159) |
| 0.3 | 8.3 | GO:0000149 | SNARE binding(GO:0000149) |
| 0.3 | 98.5 | GO:0004888 | transmembrane signaling receptor activity(GO:0004888) |
| 0.3 | 1.1 | GO:0015321 | sodium-dependent phosphate transmembrane transporter activity(GO:0015321) |
| 0.3 | 2.1 | GO:0005332 | gamma-aminobutyric acid:sodium symporter activity(GO:0005332) gamma-aminobutyric acid transmembrane transporter activity(GO:0015185) |
| 0.3 | 1.6 | GO:0043199 | sulfate binding(GO:0043199) |
| 0.2 | 0.7 | GO:0015116 | sulfate transmembrane transporter activity(GO:0015116) |
| 0.2 | 1.0 | GO:0015375 | neutral L-amino acid secondary active transmembrane transporter activity(GO:0005294) glycine:sodium symporter activity(GO:0015375) |
| 0.2 | 1.0 | GO:0004559 | alpha-mannosidase activity(GO:0004559) |
| 0.2 | 3.0 | GO:0015501 | glutamate:sodium symporter activity(GO:0015501) |
| 0.2 | 0.5 | GO:0016406 | carnitine O-acyltransferase activity(GO:0016406) |
| 0.2 | 0.7 | GO:0031731 | CCR6 chemokine receptor binding(GO:0031731) |
| 0.2 | 1.1 | GO:0008174 | mRNA methyltransferase activity(GO:0008174) |
| 0.2 | 5.3 | GO:0070840 | dynein complex binding(GO:0070840) |
| 0.2 | 0.6 | GO:0008384 | IkappaB kinase activity(GO:0008384) |
| 0.2 | 6.4 | GO:0004364 | glutathione transferase activity(GO:0004364) |
| 0.2 | 2.3 | GO:0022843 | voltage-gated cation channel activity(GO:0022843) |
| 0.2 | 1.7 | GO:0035312 | 5'-3' exodeoxyribonuclease activity(GO:0035312) |
| 0.2 | 0.2 | GO:0030249 | guanylate cyclase regulator activity(GO:0030249) |
| 0.2 | 5.8 | GO:0001105 | RNA polymerase II transcription coactivator activity(GO:0001105) |
| 0.2 | 1.2 | GO:0034235 | GPI anchor binding(GO:0034235) |
| 0.2 | 0.2 | GO:0035243 | protein-arginine omega-N symmetric methyltransferase activity(GO:0035243) |
| 0.2 | 1.5 | GO:0004745 | retinol dehydrogenase activity(GO:0004745) |
| 0.2 | 2.9 | GO:0046934 | phosphatidylinositol-4,5-bisphosphate 3-kinase activity(GO:0046934) |
| 0.2 | 4.7 | GO:0005262 | calcium channel activity(GO:0005262) |
| 0.2 | 0.5 | GO:0003917 | DNA topoisomerase type I activity(GO:0003917) |
| 0.2 | 3.5 | GO:0008009 | chemokine activity(GO:0008009) |
| 0.2 | 3.0 | GO:0015929 | hexosaminidase activity(GO:0015929) |
| 0.1 | 3.2 | GO:0005261 | cation channel activity(GO:0005261) |
| 0.1 | 1.6 | GO:0070016 | armadillo repeat domain binding(GO:0070016) |
| 0.1 | 0.8 | GO:0051393 | alpha-actinin binding(GO:0051393) |
| 0.1 | 0.4 | GO:0004609 | phosphatidylserine decarboxylase activity(GO:0004609) |
| 0.1 | 0.4 | GO:0019150 | D-ribulokinase activity(GO:0019150) |
| 0.1 | 0.7 | GO:0030274 | LIM domain binding(GO:0030274) |
| 0.1 | 1.0 | GO:0004126 | cytidine deaminase activity(GO:0004126) |
| 0.1 | 0.1 | GO:0030297 | transmembrane receptor protein tyrosine kinase activator activity(GO:0030297) |
| 0.1 | 0.6 | GO:1901682 | sulfur compound transmembrane transporter activity(GO:1901682) |
| 0.1 | 0.6 | GO:0004792 | thiosulfate sulfurtransferase activity(GO:0004792) |
| 0.1 | 0.5 | GO:0099580 | ion antiporter activity involved in regulation of postsynaptic membrane potential(GO:0099580) |
| 0.1 | 3.2 | GO:0005160 | transforming growth factor beta receptor binding(GO:0005160) |
| 0.1 | 0.8 | GO:0001165 | RNA polymerase I upstream control element sequence-specific DNA binding(GO:0001165) |
| 0.1 | 0.2 | GO:0004028 | 3-chloroallyl aldehyde dehydrogenase activity(GO:0004028) |
| 0.1 | 1.1 | GO:0030247 | pattern binding(GO:0001871) polysaccharide binding(GO:0030247) |
| 0.1 | 1.3 | GO:0002151 | G-quadruplex RNA binding(GO:0002151) |
| 0.1 | 1.1 | GO:0030280 | structural constituent of epidermis(GO:0030280) |
| 0.1 | 1.4 | GO:0005132 | type I interferon receptor binding(GO:0005132) |
| 0.1 | 1.3 | GO:0070001 | aspartic-type endopeptidase activity(GO:0004190) aspartic-type peptidase activity(GO:0070001) |
| 0.1 | 1.5 | GO:1901476 | carbohydrate transmembrane transporter activity(GO:0015144) carbohydrate transporter activity(GO:1901476) |
| 0.1 | 0.7 | GO:0036310 | annealing helicase activity(GO:0036310) |
| 0.1 | 0.8 | GO:0019864 | IgG binding(GO:0019864) |
| 0.1 | 0.4 | GO:0050694 | galactosylceramide sulfotransferase activity(GO:0001733) galactose 3-O-sulfotransferase activity(GO:0050694) |
| 0.1 | 2.5 | GO:0001540 | beta-amyloid binding(GO:0001540) |
| 0.1 | 0.2 | GO:0000182 | rDNA binding(GO:0000182) |
| 0.1 | 0.1 | GO:0050436 | microfibril binding(GO:0050436) |
| 0.1 | 0.2 | GO:0004577 | N-acetylglucosaminyldiphosphodolichol N-acetylglucosaminyltransferase activity(GO:0004577) |
| 0.1 | 0.5 | GO:0042834 | peptidoglycan binding(GO:0042834) |
| 0.1 | 0.6 | GO:0004000 | adenosine deaminase activity(GO:0004000) |
| 0.0 | 0.2 | GO:0016712 | oxidoreductase activity, acting on paired donors, with incorporation or reduction of molecular oxygen, reduced flavin or flavoprotein as one donor, and incorporation of one atom of oxygen(GO:0016712) |
| 0.0 | 3.5 | GO:0019210 | kinase inhibitor activity(GO:0019210) |
| 0.0 | 0.1 | GO:0004122 | cystathionine beta-synthase activity(GO:0004122) |
| 0.0 | 3.3 | GO:0017137 | Rab GTPase binding(GO:0017137) |
| 0.0 | 0.5 | GO:0008146 | sulfotransferase activity(GO:0008146) |
| 0.0 | 0.1 | GO:0015377 | cation:chloride symporter activity(GO:0015377) |
| 0.0 | 0.2 | GO:0004128 | cytochrome-b5 reductase activity, acting on NAD(P)H(GO:0004128) |
Gene overrepresentation in curated gene sets: canonical pathways category:
| Log-likelihood per target | Total log-likelihood | Term | Description |
|---|---|---|---|
| 31.8 | 31.8 | PID P38 GAMMA DELTA PATHWAY | Signaling mediated by p38-gamma and p38-delta |
| 4.4 | 8.9 | PID TCR RAS PATHWAY | Ras signaling in the CD4+ TCR pathway |
| 3.7 | 3.7 | NABA BASEMENT MEMBRANES | Genes encoding structural components of basement membranes |
| 3.7 | 3.7 | SA TRKA RECEPTOR | The TrkA receptor binds nerve growth factor to activate MAP kinase pathways and promote cell growth. |
| 2.9 | 2.9 | PID ERB GENOMIC PATHWAY | Validated nuclear estrogen receptor beta network |
| 2.9 | 5.8 | PID RANBP2 PATHWAY | Sumoylation by RanBP2 regulates transcriptional repression |
| 2.4 | 14.5 | PID IL2 PI3K PATHWAY | IL2 signaling events mediated by PI3K |
| 2.3 | 95.8 | ST WNT CA2 CYCLIC GMP PATHWAY | Wnt/Ca2+/cyclic GMP signaling. |
| 2.2 | 62.1 | PID S1P S1P4 PATHWAY | S1P4 pathway |
| 2.0 | 97.5 | NABA COLLAGENS | Genes encoding collagen proteins |
| 1.9 | 20.8 | PID RHODOPSIN PATHWAY | Visual signal transduction: Rods |
| 1.8 | 22.0 | PID IL1 PATHWAY | IL1-mediated signaling events |
| 1.8 | 18.1 | SA REG CASCADE OF CYCLIN EXPR | Expression of cyclins regulates progression through the cell cycle by activating cyclin-dependent kinases. |
| 1.8 | 33.3 | PID S1P META PATHWAY | Sphingosine 1-phosphate (S1P) pathway |
| 1.6 | 37.4 | PID TCR JNK PATHWAY | JNK signaling in the CD4+ TCR pathway |
| 1.6 | 51.2 | ST GAQ PATHWAY | G alpha q Pathway |
| 1.6 | 55.3 | ST JNK MAPK PATHWAY | JNK MAPK Pathway |
| 1.6 | 6.2 | ST INTERLEUKIN 4 PATHWAY | Interleukin 4 (IL-4) Pathway |
| 1.6 | 9.4 | PID ECADHERIN KERATINOCYTE PATHWAY | E-cadherin signaling in keratinocytes |
| 1.6 | 42.0 | PID INTEGRIN A9B1 PATHWAY | Alpha9 beta1 integrin signaling events |
| 1.6 | 49.6 | ST MYOCYTE AD PATHWAY | Myocyte Adrenergic Pathway is a specific case of the generalized Adrenergic Pathway. |
| 1.5 | 37.9 | PID HEDGEHOG 2PATHWAY | Signaling events mediated by the Hedgehog family |
| 1.5 | 14.6 | PID S1P S1P2 PATHWAY | S1P2 pathway |
| 1.4 | 60.0 | SIG PIP3 SIGNALING IN B LYMPHOCYTES | Genes related to PIP3 signaling in B lymphocytes |
| 1.4 | 64.8 | SIG CD40PATHWAYMAP | Genes related to CD40 signaling |
| 1.4 | 310.7 | NABA ECM GLYCOPROTEINS | Genes encoding structural ECM glycoproteins |
| 1.4 | 33.3 | PID LPA4 PATHWAY | LPA4-mediated signaling events |
| 1.3 | 75.5 | PID FRA PATHWAY | Validated transcriptional targets of AP1 family members Fra1 and Fra2 |
| 1.3 | 74.9 | PID RXR VDR PATHWAY | RXR and RAR heterodimerization with other nuclear receptor |
| 1.3 | 7.7 | PID THROMBIN PAR4 PATHWAY | PAR4-mediated thrombin signaling events |
| 1.3 | 16.6 | PID EPHA FWDPATHWAY | EPHA forward signaling |
| 1.2 | 2.5 | PID TXA2PATHWAY | Thromboxane A2 receptor signaling |
| 1.2 | 21.1 | PID VEGF VEGFR PATHWAY | VEGF and VEGFR signaling network |
| 1.2 | 41.8 | PID WNT CANONICAL PATHWAY | Canonical Wnt signaling pathway |
| 1.2 | 6.1 | PID AVB3 INTEGRIN PATHWAY | Integrins in angiogenesis |
| 1.2 | 47.5 | PID INTEGRIN2 PATHWAY | Beta2 integrin cell surface interactions |
| 1.2 | 15.7 | PID ERBB1 RECEPTOR PROXIMAL PATHWAY | EGF receptor (ErbB1) signaling pathway |
| 1.2 | 4.8 | ST G ALPHA S PATHWAY | G alpha s Pathway |
| 1.2 | 76.9 | PID CDC42 REG PATHWAY | Regulation of CDC42 activity |
| 1.2 | 46.2 | PID RAS PATHWAY | Regulation of Ras family activation |
| 1.2 | 33.1 | PID WNT SIGNALING PATHWAY | Wnt signaling network |
| 1.2 | 4.7 | ST TYPE I INTERFERON PATHWAY | Type I Interferon (alpha/beta IFN) Pathway |
| 1.1 | 12.5 | PID TCR CALCIUM PATHWAY | Calcium signaling in the CD4+ TCR pathway |
| 1.1 | 134.1 | PID MYC REPRESS PATHWAY | Validated targets of C-MYC transcriptional repression |
| 1.1 | 88.5 | PID IL4 2PATHWAY | IL4-mediated signaling events |
| 1.1 | 75.5 | PID ERBB4 PATHWAY | ErbB4 signaling events |
| 1.1 | 13.5 | PID INSULIN GLUCOSE PATHWAY | Insulin-mediated glucose transport |
| 1.1 | 5.3 | PID FAS PATHWAY | FAS (CD95) signaling pathway |
| 1.0 | 6.2 | ST INTERFERON GAMMA PATHWAY | Interferon gamma pathway. |
| 0.9 | 10.2 | PID ATF2 PATHWAY | ATF-2 transcription factor network |
| 0.9 | 11.0 | PID SYNDECAN 2 PATHWAY | Syndecan-2-mediated signaling events |
| 0.9 | 55.5 | PID FGF PATHWAY | FGF signaling pathway |
| 0.9 | 24.5 | ST DIFFERENTIATION PATHWAY IN PC12 CELLS | Differentiation Pathway in PC12 Cells; this is a specific case of PAC1 Receptor Pathway. |
| 0.9 | 3.5 | PID AR NONGENOMIC PATHWAY | Nongenotropic Androgen signaling |
| 0.9 | 6.0 | PID PI3KCI AKT PATHWAY | Class I PI3K signaling events mediated by Akt |
| 0.9 | 17.1 | PID ENDOTHELIN PATHWAY | Endothelins |
| 0.9 | 5.1 | ST GA13 PATHWAY | G alpha 13 Pathway |
| 0.8 | 10.4 | PID SHP2 PATHWAY | SHP2 signaling |
| 0.8 | 7.8 | ST STAT3 PATHWAY | STAT3 Pathway |
| 0.8 | 28.9 | PID RAC1 REG PATHWAY | Regulation of RAC1 activity |
| 0.8 | 9.1 | PID IL23 PATHWAY | IL23-mediated signaling events |
| 0.7 | 6.0 | PID NOTCH PATHWAY | Notch signaling pathway |
| 0.7 | 15.8 | PID CONE PATHWAY | Visual signal transduction: Cones |
| 0.7 | 5.7 | PID CXCR4 PATHWAY | CXCR4-mediated signaling events |
| 0.7 | 36.9 | PID NFAT TFPATHWAY | Calcineurin-regulated NFAT-dependent transcription in lymphocytes |
| 0.7 | 4.8 | SIG BCR SIGNALING PATHWAY | Members of the BCR signaling pathway |
| 0.6 | 38.7 | PID HNF3A PATHWAY | FOXA1 transcription factor network |
| 0.6 | 1.7 | SA PTEN PATHWAY | PTEN is a tumor suppressor that dephosphorylates the lipid messenger phosphatidylinositol triphosphate. |
| 0.5 | 32.3 | PID RHOA REG PATHWAY | Regulation of RhoA activity |
| 0.5 | 6.1 | PID FAK PATHWAY | Signaling events mediated by focal adhesion kinase |
| 0.5 | 45.0 | PID HDAC CLASSI PATHWAY | Signaling events mediated by HDAC Class I |
| 0.5 | 5.0 | PID MYC PATHWAY | C-MYC pathway |
| 0.5 | 85.6 | NABA ECM AFFILIATED | Genes encoding proteins affiliated structurally or functionally to extracellular matrix proteins |
| 0.5 | 3.4 | PID CD8 TCR PATHWAY | TCR signaling in naïve CD8+ T cells |
| 0.5 | 7.6 | PID IL27 PATHWAY | IL27-mediated signaling events |
| 0.5 | 6.6 | PID RAC1 PATHWAY | RAC1 signaling pathway |
| 0.5 | 9.9 | PID ECADHERIN STABILIZATION PATHWAY | Stabilization and expansion of the E-cadherin adherens junction |
| 0.4 | 136.9 | NABA SECRETED FACTORS | Genes encoding secreted soluble factors |
| 0.4 | 23.7 | PID HNF3B PATHWAY | FOXA2 and FOXA3 transcription factor networks |
| 0.4 | 7.2 | PID INTEGRIN1 PATHWAY | Beta1 integrin cell surface interactions |
| 0.3 | 10.6 | PID LYSOPHOSPHOLIPID PATHWAY | LPA receptor mediated events |
| 0.3 | 5.9 | PID IL2 STAT5 PATHWAY | IL2 signaling events mediated by STAT5 |
| 0.3 | 78.4 | NABA MATRISOME ASSOCIATED | Ensemble of genes encoding ECM-associated proteins including ECM-affilaited proteins, ECM regulators and secreted factors |
| 0.3 | 7.9 | PID INSULIN PATHWAY | Insulin Pathway |
| 0.3 | 1.8 | ST G ALPHA I PATHWAY | G alpha i Pathway |
| 0.3 | 4.6 | ST ERK1 ERK2 MAPK PATHWAY | ERK1/ERK2 MAPK Pathway |
| 0.3 | 3.0 | PID IL12 STAT4 PATHWAY | IL12 signaling mediated by STAT4 |
| 0.3 | 11.1 | NABA PROTEOGLYCANS | Genes encoding proteoglycans |
| 0.3 | 2.4 | PID CD40 PATHWAY | CD40/CD40L signaling |
| 0.3 | 4.8 | PID SYNDECAN 4 PATHWAY | Syndecan-4-mediated signaling events |
| 0.3 | 4.5 | PID HEDGEHOG GLI PATHWAY | Hedgehog signaling events mediated by Gli proteins |
| 0.2 | 8.4 | PID ARF6 PATHWAY | Arf6 signaling events |
| 0.2 | 16.2 | PID SMAD2 3NUCLEAR PATHWAY | Regulation of nuclear SMAD2/3 signaling |
| 0.2 | 5.1 | PID EPHB FWD PATHWAY | EPHB forward signaling |
| 0.2 | 4.5 | PID IL8 CXCR1 PATHWAY | IL8- and CXCR1-mediated signaling events |
| 0.2 | 2.4 | PID PI3K PLC TRK PATHWAY | Trk receptor signaling mediated by PI3K and PLC-gamma |
| 0.2 | 2.6 | PID UPA UPAR PATHWAY | Urokinase-type plasminogen activator (uPA) and uPAR-mediated signaling |
| 0.2 | 3.2 | PID ANTHRAX PATHWAY | Cellular roles of Anthrax toxin |
| 0.2 | 2.7 | PID INTEGRIN5 PATHWAY | Beta5 beta6 beta7 and beta8 integrin cell surface interactions |
| 0.2 | 2.3 | PID P38 ALPHA BETA DOWNSTREAM PATHWAY | Signaling mediated by p38-alpha and p38-beta |
| 0.2 | 2.4 | PID ALK2 PATHWAY | ALK2 signaling events |
| 0.2 | 2.3 | PID PS1 PATHWAY | Presenilin action in Notch and Wnt signaling |
| 0.1 | 2.5 | ST WNT BETA CATENIN PATHWAY | Wnt/beta-catenin Pathway |
| 0.1 | 2.9 | PID AP1 PATHWAY | AP-1 transcription factor network |
| 0.1 | 1.3 | PID TGFBR PATHWAY | TGF-beta receptor signaling |
| 0.1 | 1.9 | PID KIT PATHWAY | Signaling events mediated by Stem cell factor receptor (c-Kit) |
| 0.1 | 2.0 | PID FCER1 PATHWAY | Fc-epsilon receptor I signaling in mast cells |
| 0.1 | 0.6 | PID RET PATHWAY | Signaling events regulated by Ret tyrosine kinase |
| 0.0 | 1.7 | PID REG GR PATHWAY | Glucocorticoid receptor regulatory network |
| 0.0 | 0.4 | PID VEGFR1 2 PATHWAY | Signaling events mediated by VEGFR1 and VEGFR2 |
| 0.0 | 1.7 | PID P73PATHWAY | p73 transcription factor network |
| 0.0 | 0.5 | PID IL12 2PATHWAY | IL12-mediated signaling events |
| 0.0 | 0.5 | ST INTEGRIN SIGNALING PATHWAY | Integrin Signaling Pathway |
Gene overrepresentation in curated gene sets: REACTOME pathways category:
| Log-likelihood per target | Total log-likelihood | Term | Description |
|---|---|---|---|
| 13.2 | 13.2 | REACTOME THROMBOXANE SIGNALLING THROUGH TP RECEPTOR | Genes involved in Thromboxane signalling through TP receptor |
| 7.0 | 111.8 | REACTOME SYNTHESIS OF PE | Genes involved in Synthesis of PE |
| 6.7 | 6.7 | REACTOME JNK C JUN KINASES PHOSPHORYLATION AND ACTIVATION MEDIATED BY ACTIVATED HUMAN TAK1 | Genes involved in JNK (c-Jun kinases) phosphorylation and activation mediated by activated human TAK1 |
| 6.0 | 6.0 | REACTOME REGULATION OF SIGNALING BY CBL | Genes involved in Regulation of signaling by CBL |
| 4.9 | 4.9 | REACTOME RETROGRADE NEUROTROPHIN SIGNALLING | Genes involved in Retrograde neurotrophin signalling |
| 3.7 | 47.9 | REACTOME PASSIVE TRANSPORT BY AQUAPORINS | Genes involved in Passive Transport by Aquaporins |
| 3.5 | 66.8 | REACTOME INITIAL TRIGGERING OF COMPLEMENT | Genes involved in Initial triggering of complement |
| 3.5 | 45.3 | REACTOME THE ACTIVATION OF ARYLSULFATASES | Genes involved in The activation of arylsulfatases |
| 3.4 | 10.1 | REACTOME SIGNALING BY FGFR3 MUTANTS | Genes involved in Signaling by FGFR3 mutants |
| 3.3 | 3.3 | REACTOME RIG I MDA5 MEDIATED INDUCTION OF IFN ALPHA BETA PATHWAYS | Genes involved in RIG-I/MDA5 mediated induction of IFN-alpha/beta pathways |
| 3.1 | 9.2 | REACTOME NOREPINEPHRINE NEUROTRANSMITTER RELEASE CYCLE | Genes involved in Norepinephrine Neurotransmitter Release Cycle |
| 3.0 | 3.0 | REACTOME FRS2 MEDIATED CASCADE | Genes involved in FRS2-mediated cascade |
| 2.9 | 14.7 | REACTOME REGULATION OF RHEB GTPASE ACTIVITY BY AMPK | Genes involved in Regulation of Rheb GTPase activity by AMPK |
| 2.9 | 40.2 | REACTOME SEROTONIN RECEPTORS | Genes involved in Serotonin receptors |
| 2.8 | 71.0 | REACTOME REGULATION OF INSULIN LIKE GROWTH FACTOR IGF ACTIVITY BY INSULIN LIKE GROWTH FACTOR BINDING PROTEINS IGFBPS | Genes involved in Regulation of Insulin-like Growth Factor (IGF) Activity by Insulin-like Growth Factor Binding Proteins (IGFBPs) |
| 2.8 | 119.7 | REACTOME EFFECTS OF PIP2 HYDROLYSIS | Genes involved in Effects of PIP2 hydrolysis |
| 2.5 | 58.0 | REACTOME TERMINATION OF O GLYCAN BIOSYNTHESIS | Genes involved in Termination of O-glycan biosynthesis |
| 2.5 | 93.3 | REACTOME GABA A RECEPTOR ACTIVATION | Genes involved in GABA A receptor activation |
| 2.4 | 50.7 | REACTOME TRANSLOCATION OF ZAP 70 TO IMMUNOLOGICAL SYNAPSE | Genes involved in Translocation of ZAP-70 to Immunological synapse |
| 2.4 | 137.8 | REACTOME VOLTAGE GATED POTASSIUM CHANNELS | Genes involved in Voltage gated Potassium channels |
| 2.4 | 25.9 | REACTOME IRAK2 MEDIATED ACTIVATION OF TAK1 COMPLEX UPON TLR7 8 OR 9 STIMULATION | Genes involved in IRAK2 mediated activation of TAK1 complex upon TLR7/8 or 9 stimulation |
| 2.3 | 18.4 | REACTOME RNA POL I PROMOTER OPENING | Genes involved in RNA Polymerase I Promoter Opening |
| 2.3 | 52.7 | REACTOME ACYL CHAIN REMODELLING OF PE | Genes involved in Acyl chain remodelling of PE |
| 2.3 | 72.1 | REACTOME ACTIVATED AMPK STIMULATES FATTY ACID OXIDATION IN MUSCLE | Genes involved in Activated AMPK stimulates fatty-acid oxidation in muscle |
| 2.2 | 52.2 | REACTOME HDL MEDIATED LIPID TRANSPORT | Genes involved in HDL-mediated lipid transport |
| 2.2 | 45.5 | REACTOME FACILITATIVE NA INDEPENDENT GLUCOSE TRANSPORTERS | Genes involved in Facilitative Na+-independent glucose transporters |
| 2.2 | 12.9 | REACTOME A TETRASACCHARIDE LINKER SEQUENCE IS REQUIRED FOR GAG SYNTHESIS | Genes involved in A tetrasaccharide linker sequence is required for GAG synthesis |
| 2.1 | 27.4 | REACTOME ADENYLATE CYCLASE ACTIVATING PATHWAY | Genes involved in Adenylate cyclase activating pathway |
| 2.1 | 33.5 | REACTOME SEMA3A PLEXIN REPULSION SIGNALING BY INHIBITING INTEGRIN ADHESION | Genes involved in SEMA3A-Plexin repulsion signaling by inhibiting Integrin adhesion |
| 2.1 | 114.7 | REACTOME GPVI MEDIATED ACTIVATION CASCADE | Genes involved in GPVI-mediated activation cascade |
| 2.1 | 65.9 | REACTOME UNBLOCKING OF NMDA RECEPTOR GLUTAMATE BINDING AND ACTIVATION | Genes involved in Unblocking of NMDA receptor, glutamate binding and activation |
| 2.1 | 24.7 | REACTOME INHIBITION OF INSULIN SECRETION BY ADRENALINE NORADRENALINE | Genes involved in Inhibition of Insulin Secretion by Adrenaline/Noradrenaline |
| 2.0 | 26.3 | REACTOME PROSTANOID LIGAND RECEPTORS | Genes involved in Prostanoid ligand receptors |
| 2.0 | 36.0 | REACTOME PRE NOTCH PROCESSING IN GOLGI | Genes involved in Pre-NOTCH Processing in Golgi |
| 2.0 | 31.9 | REACTOME MITOCHONDRIAL TRNA AMINOACYLATION | Genes involved in Mitochondrial tRNA aminoacylation |
| 1.9 | 5.8 | REACTOME REGULATION OF KIT SIGNALING | Genes involved in Regulation of KIT signaling |
| 1.9 | 38.3 | REACTOME PLATELET CALCIUM HOMEOSTASIS | Genes involved in Platelet calcium homeostasis |
| 1.9 | 34.2 | REACTOME ORGANIC CATION ANION ZWITTERION TRANSPORT | Genes involved in Organic cation/anion/zwitterion transport |
| 1.9 | 29.8 | REACTOME SYNTHESIS OF SUBSTRATES IN N GLYCAN BIOSYTHESIS | Genes involved in Synthesis of substrates in N-glycan biosythesis |
| 1.8 | 71.1 | REACTOME INTERACTION BETWEEN L1 AND ANKYRINS | Genes involved in Interaction between L1 and Ankyrins |
| 1.8 | 59.9 | REACTOME GLUTAMATE NEUROTRANSMITTER RELEASE CYCLE | Genes involved in Glutamate Neurotransmitter Release Cycle |
| 1.7 | 67.8 | REACTOME TIGHT JUNCTION INTERACTIONS | Genes involved in Tight junction interactions |
| 1.7 | 6.9 | REACTOME DOPAMINE NEUROTRANSMITTER RELEASE CYCLE | Genes involved in Dopamine Neurotransmitter Release Cycle |
| 1.7 | 23.5 | REACTOME BIOSYNTHESIS OF THE N GLYCAN PRECURSOR DOLICHOL LIPID LINKED OLIGOSACCHARIDE LLO AND TRANSFER TO A NASCENT PROTEIN | Genes involved in Biosynthesis of the N-glycan precursor (dolichol lipid-linked oligosaccharide, LLO) and transfer to a nascent protein |
| 1.6 | 69.1 | REACTOME ION TRANSPORT BY P TYPE ATPASES | Genes involved in Ion transport by P-type ATPases |
| 1.6 | 27.5 | REACTOME COMMON PATHWAY | Genes involved in Common Pathway |
| 1.6 | 25.7 | REACTOME REVERSIBLE HYDRATION OF CARBON DIOXIDE | Genes involved in Reversible Hydration of Carbon Dioxide |
| 1.6 | 117.7 | REACTOME NCAM1 INTERACTIONS | Genes involved in NCAM1 interactions |
| 1.6 | 23.7 | REACTOME ROLE OF DCC IN REGULATING APOPTOSIS | Genes involved in Role of DCC in regulating apoptosis |
| 1.5 | 24.5 | REACTOME NA CL DEPENDENT NEUROTRANSMITTER TRANSPORTERS | Genes involved in Na+/Cl- dependent neurotransmitter transporters |
| 1.5 | 3.1 | REACTOME DESTABILIZATION OF MRNA BY BRF1 | Genes involved in Destabilization of mRNA by Butyrate Response Factor 1 (BRF1) |
| 1.5 | 30.4 | REACTOME CLASS C 3 METABOTROPIC GLUTAMATE PHEROMONE RECEPTORS | Genes involved in Class C/3 (Metabotropic glutamate/pheromone receptors) |
| 1.5 | 1.5 | REACTOME IL 3 5 AND GM CSF SIGNALING | Genes involved in Interleukin-3, 5 and GM-CSF signaling |
| 1.4 | 65.6 | REACTOME CGMP EFFECTS | Genes involved in cGMP effects |
| 1.4 | 7.1 | REACTOME EICOSANOID LIGAND BINDING RECEPTORS | Genes involved in Eicosanoid ligand-binding receptors |
| 1.4 | 7.1 | REACTOME SPRY REGULATION OF FGF SIGNALING | Genes involved in Spry regulation of FGF signaling |
| 1.4 | 15.2 | REACTOME DSCAM INTERACTIONS | Genes involved in DSCAM interactions |
| 1.3 | 42.8 | REACTOME DEGRADATION OF THE EXTRACELLULAR MATRIX | Genes involved in Degradation of the extracellular matrix |
| 1.3 | 32.8 | REACTOME ACTIVATION OF THE AP1 FAMILY OF TRANSCRIPTION FACTORS | Genes involved in Activation of the AP-1 family of transcription factors |
| 1.3 | 26.2 | REACTOME SIGNALING BY ACTIVATED POINT MUTANTS OF FGFR1 | Genes involved in Signaling by activated point mutants of FGFR1 |
| 1.3 | 7.8 | REACTOME ACETYLCHOLINE NEUROTRANSMITTER RELEASE CYCLE | Genes involved in Acetylcholine Neurotransmitter Release Cycle |
| 1.3 | 53.8 | REACTOME POTASSIUM CHANNELS | Genes involved in Potassium Channels |
| 1.3 | 2.5 | REACTOME IL 2 SIGNALING | Genes involved in Interleukin-2 signaling |
| 1.3 | 29.0 | REACTOME PROLACTIN RECEPTOR SIGNALING | Genes involved in Prolactin receptor signaling |
| 1.3 | 169.4 | REACTOME TRANSPORT OF INORGANIC CATIONS ANIONS AND AMINO ACIDS OLIGOPEPTIDES | Genes involved in Transport of inorganic cations/anions and amino acids/oligopeptides |
| 1.2 | 2.5 | REACTOME PROCESSIVE SYNTHESIS ON THE LAGGING STRAND | Genes involved in Processive synthesis on the lagging strand |
| 1.2 | 34.5 | REACTOME AMINE LIGAND BINDING RECEPTORS | Genes involved in Amine ligand-binding receptors |
| 1.2 | 3.6 | REACTOME GPCR DOWNSTREAM SIGNALING | Genes involved in GPCR downstream signaling |
| 1.2 | 23.6 | REACTOME INTRINSIC PATHWAY | Genes involved in Intrinsic Pathway |
| 1.2 | 207.1 | REACTOME G ALPHA I SIGNALLING EVENTS | Genes involved in G alpha (i) signalling events |
| 1.2 | 11.6 | REACTOME ETHANOL OXIDATION | Genes involved in Ethanol oxidation |
| 1.2 | 1.2 | REACTOME VIF MEDIATED DEGRADATION OF APOBEC3G | Genes involved in Vif-mediated degradation of APOBEC3G |
| 1.1 | 9.2 | REACTOME AMINE COMPOUND SLC TRANSPORTERS | Genes involved in Amine compound SLC transporters |
| 1.1 | 4.6 | REACTOME CONVERSION FROM APC C CDC20 TO APC C CDH1 IN LATE ANAPHASE | Genes involved in Conversion from APC/C:Cdc20 to APC/C:Cdh1 in late anaphase |
| 1.1 | 27.5 | REACTOME CS DS DEGRADATION | Genes involved in CS/DS degradation |
| 1.1 | 8.0 | REACTOME TANDEM PORE DOMAIN POTASSIUM CHANNELS | Genes involved in Tandem pore domain potassium channels |
| 1.1 | 84.3 | REACTOME PHASE1 FUNCTIONALIZATION OF COMPOUNDS | Genes involved in Phase 1 - Functionalization of compounds |
| 1.1 | 12.3 | REACTOME REGULATION OF INSULIN SECRETION BY ACETYLCHOLINE | Genes involved in Regulation of Insulin Secretion by Acetylcholine |
| 1.1 | 135.3 | REACTOME CLASS B 2 SECRETIN FAMILY RECEPTORS | Genes involved in Class B/2 (Secretin family receptors) |
| 1.1 | 6.6 | REACTOME SYNTHESIS SECRETION AND INACTIVATION OF GLP1 | Genes involved in Synthesis, Secretion, and Inactivation of Glucagon-like Peptide-1 (GLP-1) |
| 1.1 | 41.9 | REACTOME REGULATION OF BETA CELL DEVELOPMENT | Genes involved in Regulation of beta-cell development |
| 1.1 | 7.7 | REACTOME TRYPTOPHAN CATABOLISM | Genes involved in Tryptophan catabolism |
| 1.1 | 52.0 | REACTOME NOTCH1 INTRACELLULAR DOMAIN REGULATES TRANSCRIPTION | Genes involved in NOTCH1 Intracellular Domain Regulates Transcription |
| 1.1 | 16.1 | REACTOME NEUROTRANSMITTER RELEASE CYCLE | Genes involved in Neurotransmitter Release Cycle |
| 1.1 | 9.5 | REACTOME SIGNALING BY ERBB2 | Genes involved in Signaling by ERBB2 |
| 1.0 | 6.2 | REACTOME IL 6 SIGNALING | Genes involved in Interleukin-6 signaling |
| 1.0 | 8.2 | REACTOME NITRIC OXIDE STIMULATES GUANYLATE CYCLASE | Genes involved in Nitric oxide stimulates guanylate cyclase |
| 1.0 | 5.0 | REACTOME CIRCADIAN REPRESSION OF EXPRESSION BY REV ERBA | Genes involved in Circadian Repression of Expression by REV-ERBA |
| 1.0 | 438.3 | REACTOME GENERIC TRANSCRIPTION PATHWAY | Genes involved in Generic Transcription Pathway |
| 1.0 | 35.0 | REACTOME NUCLEAR SIGNALING BY ERBB4 | Genes involved in Nuclear signaling by ERBB4 |
| 1.0 | 1.0 | REACTOME E2F ENABLED INHIBITION OF PRE REPLICATION COMPLEX FORMATION | Genes involved in E2F-enabled inhibition of pre-replication complex formation |
| 0.9 | 34.8 | REACTOME GAP JUNCTION TRAFFICKING | Genes involved in Gap junction trafficking |
| 0.9 | 1.8 | REACTOME ADP SIGNALLING THROUGH P2RY1 | Genes involved in ADP signalling through P2Y purinoceptor 1 |
| 0.9 | 30.7 | REACTOME GLUTATHIONE CONJUGATION | Genes involved in Glutathione conjugation |
| 0.9 | 2.7 | REACTOME MRNA CAPPING | Genes involved in mRNA Capping |
| 0.8 | 19.0 | REACTOME HIGHLY CALCIUM PERMEABLE POSTSYNAPTIC NICOTINIC ACETYLCHOLINE RECEPTORS | Genes involved in Highly calcium permeable postsynaptic nicotinic acetylcholine receptors |
| 0.8 | 26.0 | REACTOME HS GAG BIOSYNTHESIS | Genes involved in HS-GAG biosynthesis |
| 0.8 | 9.7 | REACTOME KERATAN SULFATE DEGRADATION | Genes involved in Keratan sulfate degradation |
| 0.8 | 11.9 | REACTOME PYRIMIDINE CATABOLISM | Genes involved in Pyrimidine catabolism |
| 0.8 | 15.0 | REACTOME GROWTH HORMONE RECEPTOR SIGNALING | Genes involved in Growth hormone receptor signaling |
| 0.8 | 5.4 | REACTOME GRB2 SOS PROVIDES LINKAGE TO MAPK SIGNALING FOR INTERGRINS | Genes involved in GRB2:SOS provides linkage to MAPK signaling for Intergrins |
| 0.7 | 7.9 | REACTOME HORMONE LIGAND BINDING RECEPTORS | Genes involved in Hormone ligand-binding receptors |
| 0.7 | 5.6 | REACTOME ANDROGEN BIOSYNTHESIS | Genes involved in Androgen biosynthesis |
| 0.7 | 9.4 | REACTOME CRMPS IN SEMA3A SIGNALING | Genes involved in CRMPs in Sema3A signaling |
| 0.7 | 69.8 | REACTOME G ALPHA Q SIGNALLING EVENTS | Genes involved in G alpha (q) signalling events |
| 0.7 | 2.0 | REACTOME PLATELET AGGREGATION PLUG FORMATION | Genes involved in Platelet Aggregation (Plug Formation) |
| 0.7 | 13.1 | REACTOME SYNTHESIS OF PIPS AT THE EARLY ENDOSOME MEMBRANE | Genes involved in Synthesis of PIPs at the early endosome membrane |
| 0.6 | 11.2 | REACTOME AMINE DERIVED HORMONES | Genes involved in Amine-derived hormones |
| 0.6 | 31.2 | REACTOME MEIOTIC SYNAPSIS | Genes involved in Meiotic Synapsis |
| 0.6 | 13.1 | REACTOME ANTIGEN ACTIVATES B CELL RECEPTOR LEADING TO GENERATION OF SECOND MESSENGERS | Genes involved in Antigen Activates B Cell Receptor Leading to Generation of Second Messengers |
| 0.6 | 4.0 | REACTOME FORMATION OF FIBRIN CLOT CLOTTING CASCADE | Genes involved in Formation of Fibrin Clot (Clotting Cascade) |
| 0.6 | 12.7 | REACTOME PI3K AKT ACTIVATION | Genes involved in PI3K/AKT activation |
| 0.6 | 2.8 | REACTOME MAPK TARGETS NUCLEAR EVENTS MEDIATED BY MAP KINASES | Genes involved in MAPK targets/ Nuclear events mediated by MAP kinases |
| 0.6 | 53.6 | REACTOME MUSCLE CONTRACTION | Genes involved in Muscle contraction |
| 0.5 | 3.8 | REACTOME IL 7 SIGNALING | Genes involved in Interleukin-7 signaling |
| 0.5 | 9.8 | REACTOME SIGNAL ATTENUATION | Genes involved in Signal attenuation |
| 0.5 | 7.5 | REACTOME KERATAN SULFATE BIOSYNTHESIS | Genes involved in Keratan sulfate biosynthesis |
| 0.5 | 15.9 | REACTOME CIRCADIAN CLOCK | Genes involved in Circadian Clock |
| 0.5 | 13.3 | REACTOME PEPTIDE LIGAND BINDING RECEPTORS | Genes involved in Peptide ligand-binding receptors |
| 0.5 | 4.0 | REACTOME HOMOLOGOUS RECOMBINATION REPAIR OF REPLICATION INDEPENDENT DOUBLE STRAND BREAKS | Genes involved in Homologous recombination repair of replication-independent double-strand breaks |
| 0.5 | 15.0 | REACTOME SPHINGOLIPID DE NOVO BIOSYNTHESIS | Genes involved in Sphingolipid de novo biosynthesis |
| 0.5 | 1.9 | REACTOME ENDOSOMAL VACUOLAR PATHWAY | Genes involved in Endosomal/Vacuolar pathway |
| 0.4 | 4.2 | REACTOME NGF SIGNALLING VIA TRKA FROM THE PLASMA MEMBRANE | Genes involved in NGF signalling via TRKA from the plasma membrane |
| 0.4 | 8.9 | REACTOME ADHERENS JUNCTIONS INTERACTIONS | Genes involved in Adherens junctions interactions |
| 0.4 | 6.1 | REACTOME ALPHA LINOLENIC ACID ALA METABOLISM | Genes involved in alpha-linolenic acid (ALA) metabolism |
| 0.4 | 7.4 | REACTOME CD28 DEPENDENT PI3K AKT SIGNALING | Genes involved in CD28 dependent PI3K/Akt signaling |
| 0.3 | 8.0 | REACTOME ELONGATION ARREST AND RECOVERY | Genes involved in Elongation arrest and recovery |
| 0.3 | 6.1 | REACTOME ACTIVATION OF IRF3 IRF7 MEDIATED BY TBK1 IKK EPSILON | Genes involved in Activation of IRF3/IRF7 mediated by TBK1/IKK epsilon |
| 0.3 | 30.6 | REACTOME IMMUNOREGULATORY INTERACTIONS BETWEEN A LYMPHOID AND A NON LYMPHOID CELL | Genes involved in Immunoregulatory interactions between a Lymphoid and a non-Lymphoid cell |
| 0.3 | 3.6 | REACTOME ACTIVATION OF CHAPERONE GENES BY ATF6 ALPHA | Genes involved in Activation of Chaperone Genes by ATF6-alpha |
| 0.3 | 2.7 | REACTOME LIGAND GATED ION CHANNEL TRANSPORT | Genes involved in Ligand-gated ion channel transport |
| 0.3 | 7.1 | REACTOME G ALPHA S SIGNALLING EVENTS | Genes involved in G alpha (s) signalling events |
| 0.3 | 0.8 | REACTOME ROLE OF SECOND MESSENGERS IN NETRIN1 SIGNALING | Genes involved in Role of second messengers in netrin-1 signaling |
| 0.3 | 1.8 | REACTOME MEMBRANE BINDING AND TARGETTING OF GAG PROTEINS | Genes involved in Membrane binding and targetting of GAG proteins |
| 0.3 | 7.5 | REACTOME RAP1 SIGNALLING | Genes involved in Rap1 signalling |
| 0.3 | 0.8 | REACTOME ACTIVATION OF CHAPERONES BY ATF6 ALPHA | Genes involved in Activation of Chaperones by ATF6-alpha |
| 0.3 | 3.3 | REACTOME VEGF LIGAND RECEPTOR INTERACTIONS | Genes involved in VEGF ligand-receptor interactions |
| 0.2 | 1.9 | REACTOME GLYCOPROTEIN HORMONES | Genes involved in Glycoprotein hormones |
| 0.2 | 3.0 | REACTOME ACTIVATION OF RAC | Genes involved in Activation of Rac |
| 0.2 | 2.7 | REACTOME FGFR LIGAND BINDING AND ACTIVATION | Genes involved in FGFR ligand binding and activation |
| 0.2 | 3.5 | REACTOME ERKS ARE INACTIVATED | Genes involved in ERKs are inactivated |
| 0.2 | 0.6 | REACTOME G ALPHA Z SIGNALLING EVENTS | Genes involved in G alpha (z) signalling events |
| 0.2 | 1.8 | REACTOME STEROID HORMONES | Genes involved in Steroid hormones |
| 0.2 | 4.3 | REACTOME RESOLUTION OF AP SITES VIA THE SINGLE NUCLEOTIDE REPLACEMENT PATHWAY | Genes involved in Resolution of AP sites via the single-nucleotide replacement pathway |
| 0.2 | 2.5 | REACTOME TIE2 SIGNALING | Genes involved in Tie2 Signaling |
| 0.2 | 2.9 | REACTOME SEMA4D IN SEMAPHORIN SIGNALING | Genes involved in Sema4D in semaphorin signaling |
| 0.2 | 1.3 | REACTOME COPI MEDIATED TRANSPORT | Genes involved in COPI Mediated Transport |
| 0.2 | 2.3 | REACTOME DEFENSINS | Genes involved in Defensins |
| 0.1 | 1.5 | REACTOME SIGNAL REGULATORY PROTEIN SIRP FAMILY INTERACTIONS | Genes involved in Signal regulatory protein (SIRP) family interactions |
| 0.1 | 2.5 | REACTOME FANCONI ANEMIA PATHWAY | Genes involved in Fanconi Anemia pathway |
| 0.1 | 0.7 | REACTOME PI 3K CASCADE | Genes involved in PI-3K cascade |
| 0.1 | 2.4 | REACTOME OTHER SEMAPHORIN INTERACTIONS | Genes involved in Other semaphorin interactions |
| 0.1 | 10.8 | REACTOME TRANSMISSION ACROSS CHEMICAL SYNAPSES | Genes involved in Transmission across Chemical Synapses |
| 0.1 | 1.4 | REACTOME COMPLEMENT CASCADE | Genes involved in Complement cascade |
| 0.1 | 1.1 | REACTOME REGULATION OF HYPOXIA INDUCIBLE FACTOR HIF BY OXYGEN | Genes involved in Regulation of Hypoxia-inducible Factor (HIF) by Oxygen |
| 0.1 | 0.6 | REACTOME FORMATION OF TRANSCRIPTION COUPLED NER TC NER REPAIR COMPLEX | Genes involved in Formation of transcription-coupled NER (TC-NER) repair complex |
| 0.0 | 1.2 | REACTOME SPHINGOLIPID METABOLISM | Genes involved in Sphingolipid metabolism |
| 0.0 | 0.1 | REACTOME REGULATION OF IFNA SIGNALING | Genes involved in Regulation of IFNA signaling |