Project
GNF SymAtlas + NCI-60 cancer cell lines, human (Su, 2004; Ross, 2000)
Navigation
Downloads
Results for POU2F2_POU3F1
Z-value: 2.64
Motif logo
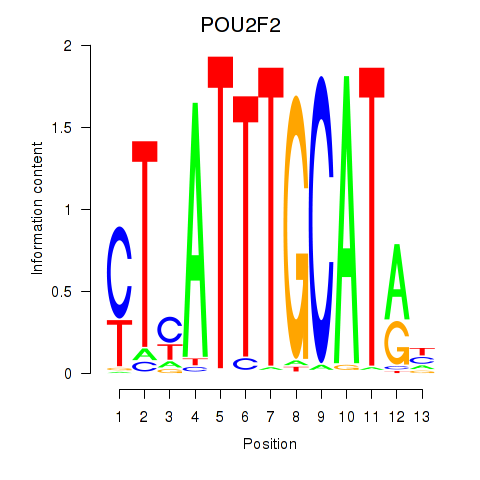
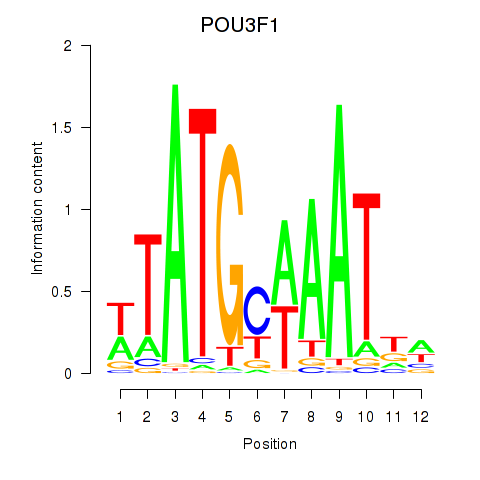
Transcription factors associated with POU2F2_POU3F1
| Gene Symbol | Gene ID | Gene Info |
|---|---|---|
|
POU2F2
|
ENSG00000028277.21 | POU2F2 |
|
POU3F1
|
ENSG00000185668.8 | POU3F1 |
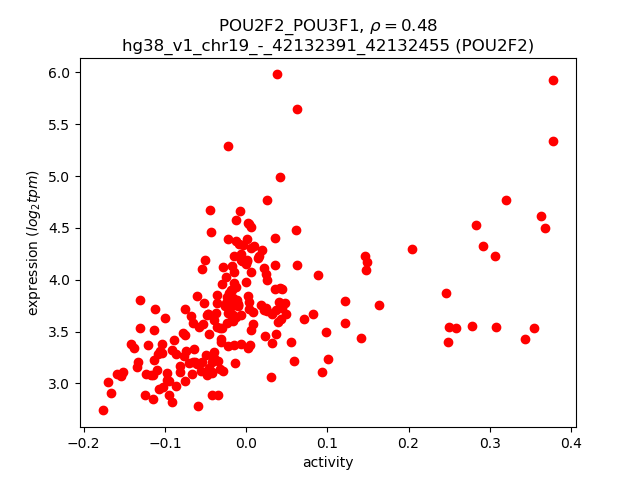
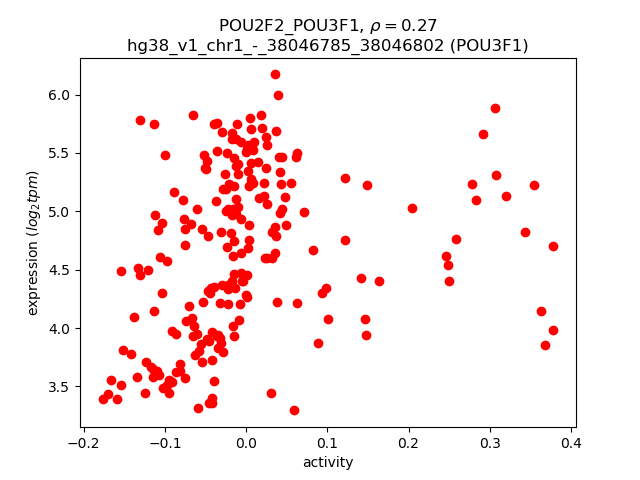
Activity-expression correlation:
| Gene | Promoter | Pearson corr. coef. | P-value | Plot |
|---|---|---|---|---|
| POU2F2 | hg38_v1_chr19_-_42132391_42132455 | 0.48 | 4.7e-14 | Click! |
| POU3F1 | hg38_v1_chr1_-_38046785_38046802 | 0.27 | 6.0e-05 | Click! |
Activity profile of POU2F2_POU3F1 motif
Sorted Z-values of POU2F2_POU3F1 motif
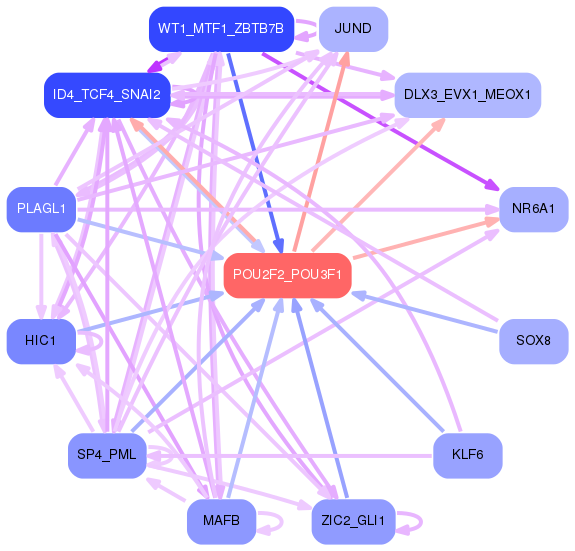
Network of associatons between targets according to the STRING database.

First level regulatory network of POU2F2_POU3F1
| Promoter | Score | Transcript | Gene | Gene Info |
|---|---|---|---|---|
| chr14_-_106117159 | 113.84 |
ENST00000390601.3
|
IGHV3-11
|
immunoglobulin heavy variable 3-11 |
| chr14_-_106470788 | 105.15 |
ENST00000434710.1
|
IGHV3-43
|
immunoglobulin heavy variable 3-43 |
| chr14_-_106538331 | 97.59 |
ENST00000390624.3
|
IGHV3-48
|
immunoglobulin heavy variable 3-48 |
| chr2_+_90209873 | 93.23 |
ENST00000468879.1
|
IGKV1D-43
|
immunoglobulin kappa variable 1D-43 |
| chr16_+_33802683 | 92.90 |
ENST00000570121.2
|
IGHV3OR16-12
|
immunoglobulin heavy variable 3/OR16-12 (non-functional) |
| chr2_-_89040745 | 92.79 |
ENST00000480492.1
|
IGKV1-12
|
immunoglobulin kappa variable 1-12 |
| chr2_-_88992903 | 85.33 |
ENST00000495489.1
|
IGKV1-8
|
immunoglobulin kappa variable 1-8 |
| chr2_+_90100235 | 79.14 |
ENST00000492446.1
|
IGKV1D-16
|
immunoglobulin kappa variable 1D-16 |
| chr16_+_32066065 | 75.00 |
ENST00000354689.6
|
IGHV3OR16-9
|
immunoglobulin heavy variable 3/OR16-9 (non-functional) |
| chr2_+_90082635 | 73.73 |
ENST00000483379.1
|
IGKV1D-17
|
immunoglobulin kappa variable 1D-17 |
| chr2_+_90159840 | 71.55 |
ENST00000377032.5
|
IGKV1D-12
|
immunoglobulin kappa variable 1D-12 |
| chr14_-_106235582 | 70.35 |
ENST00000390607.2
|
IGHV3-21
|
immunoglobulin heavy variable 3-21 |
| chr14_-_106675544 | 70.28 |
ENST00000390632.2
|
IGHV3-66
|
immunoglobulin heavy variable 3-66 |
| chr14_-_106088573 | 65.19 |
ENST00000632099.1
|
IGHV3-64D
|
immunoglobulin heavy variable 3-64D |
| chr16_+_33009175 | 62.38 |
ENST00000565407.2
|
IGHV3OR16-8
|
immunoglobulin heavy variable 3/OR16-8 (non-functional) |
| chr14_-_106658251 | 61.13 |
ENST00000454421.2
|
IGHV3-64
|
immunoglobulin heavy variable 3-64 |
| chr2_+_89884740 | 57.45 |
ENST00000509129.1
|
IGKV1D-37
|
immunoglobulin kappa variable 1D-37 (non-functional) |
| chr1_-_149842736 | 56.63 |
ENST00000369159.2
|
H2AC18
|
H2A clustered histone 18 |
| chr16_-_33845229 | 56.56 |
ENST00000569103.2
|
IGHV3OR16-17
|
immunoglobulin heavy variable 3/OR16-17 (non-functional) |
| chr2_+_89913982 | 55.96 |
ENST00000390265.2
|
IGKV1D-33
|
immunoglobulin kappa variable 1D-33 |
| chr1_+_149851053 | 54.93 |
ENST00000607355.2
|
H2AC19
|
H2A clustered histone 19 |
| chr21_-_10649835 | 54.07 |
ENST00000622028.1
|
IGHV1OR21-1
|
immunoglobulin heavy variable 1/OR21-1 (non-functional) |
| chr2_-_89297785 | 51.02 |
ENST00000465170.1
|
IGKV1-37
|
immunoglobulin kappa variable 1-37 (non-functional) |
| chr14_-_106715166 | 50.42 |
ENST00000390633.2
|
IGHV1-69
|
immunoglobulin heavy variable 1-69 |
| chr14_-_106593319 | 50.18 |
ENST00000390627.3
|
IGHV3-53
|
immunoglobulin heavy variable 3-53 |
| chr2_-_89100352 | 49.38 |
ENST00000479981.1
|
IGKV1-16
|
immunoglobulin kappa variable 1-16 |
| chr2_+_90154073 | 47.45 |
ENST00000611391.1
|
IGKV1D-13
|
immunoglobulin kappa variable 1D-13 |
| chr22_+_22357739 | 45.96 |
ENST00000390294.2
|
IGLV1-47
|
immunoglobulin lambda variable 1-47 |
| chr14_-_106811131 | 45.84 |
ENST00000424969.2
|
IGHV3-74
|
immunoglobulin heavy variable 3-74 |
| chr15_-_19988117 | 45.66 |
ENST00000558565.2
|
IGHV3OR15-7
|
immunoglobulin heavy variable 3/OR15-7 (pseudogene) |
| chr2_+_90021567 | 45.42 |
ENST00000436451.2
|
IGKV6D-21
|
immunoglobulin kappa variable 6D-21 (non-functional) |
| chr2_-_89268506 | 45.22 |
ENST00000473726.1
|
IGKV1-33
|
immunoglobulin kappa variable 1-33 |
| chr14_-_106062670 | 44.47 |
ENST00000390598.2
|
IGHV3-7
|
immunoglobulin heavy variable 3-7 |
| chr2_+_90069662 | 43.87 |
ENST00000390271.2
|
IGKV6D-41
|
immunoglobulin kappa variable 6D-41 (non-functional) |
| chr2_+_90038848 | 43.78 |
ENST00000390270.2
|
IGKV3D-20
|
immunoglobulin kappa variable 3D-20 |
| chr14_-_106389858 | 41.90 |
ENST00000390617.2
|
IGHV3-35
|
immunoglobulin heavy variable 3-35 (non-functional) |
| chr6_+_27147094 | 41.79 |
ENST00000377459.3
|
H2AC12
|
H2A clustered histone 12 |
| chr14_-_106154113 | 41.29 |
ENST00000390603.2
|
IGHV3-15
|
immunoglobulin heavy variable 3-15 |
| chr22_+_22822658 | 38.21 |
ENST00000620395.2
|
IGLV2-8
|
immunoglobulin lambda variable 2-8 |
| chr16_+_32995048 | 38.11 |
ENST00000425181.3
|
IGHV3OR16-10
|
immunoglobulin heavy variable 3/OR16-10 (non-functional) |
| chr22_+_22734577 | 37.24 |
ENST00000390310.3
|
IGLV2-18
|
immunoglobulin lambda variable 2-18 |
| chr2_+_90234809 | 37.11 |
ENST00000443397.5
|
IGKV3D-7
|
immunoglobulin kappa variable 3D-7 |
| chr22_+_22811737 | 37.10 |
ENST00000390315.3
|
IGLV3-10
|
immunoglobulin lambda variable 3-10 |
| chr1_+_149886906 | 35.36 |
ENST00000331380.4
|
H2AC20
|
H2A clustered histone 20 |
| chr2_-_88979016 | 34.82 |
ENST00000390247.2
|
IGKV3-7
|
immunoglobulin kappa variable 3-7 (non-functional) |
| chr2_-_89117844 | 34.37 |
ENST00000490686.1
|
IGKV1-17
|
immunoglobulin kappa variable 1-17 |
| chr14_-_106269133 | 33.76 |
ENST00000390609.3
|
IGHV3-23
|
immunoglobulin heavy variable 3-23 |
| chr14_-_106211453 | 33.08 |
ENST00000390606.3
|
IGHV3-20
|
immunoglobulin heavy variable 3-20 |
| chr11_-_5227063 | 32.47 |
ENST00000335295.4
ENST00000485743.1 ENST00000647020.1 |
HBB
|
hemoglobin subunit beta |
| chr22_+_22431949 | 32.36 |
ENST00000390301.3
|
IGLV1-36
|
immunoglobulin lambda variable 1-36 |
| chr17_+_20155989 | 31.73 |
ENST00000395530.6
ENST00000581399.6 ENST00000679819.1 |
SPECC1
|
sperm antigen with calponin homology and coiled-coil domains 1 |
| chr1_-_149886652 | 31.58 |
ENST00000369155.3
|
H2BC21
|
H2B clustered histone 21 |
| chr2_-_89160329 | 31.34 |
ENST00000390256.2
|
IGKV6-21
|
immunoglobulin kappa variable 6-21 (non-functional) |
| chr2_+_90172802 | 31.33 |
ENST00000390277.3
|
IGKV3D-11
|
immunoglobulin kappa variable 3D-11 |
| chr6_+_26124161 | 31.19 |
ENST00000377791.4
ENST00000602637.1 |
H2AC6
|
H2A clustered histone 6 |
| chr14_-_106025628 | 31.17 |
ENST00000631943.1
|
IGHV7-4-1
|
immunoglobulin heavy variable 7-4-1 |
| chr2_+_89862438 | 31.03 |
ENST00000448155.2
|
IGKV1D-39
|
immunoglobulin kappa variable 1D-39 |
| chr14_-_106165730 | 30.73 |
ENST00000390604.2
|
IGHV3-16
|
immunoglobulin heavy variable 3-16 (non-functional) |
| chr8_+_55879818 | 30.33 |
ENST00000520220.6
ENST00000519728.6 |
LYN
|
LYN proto-oncogene, Src family tyrosine kinase |
| chr2_-_88966767 | 30.28 |
ENST00000464162.1
|
IGKV1-6
|
immunoglobulin kappa variable 1-6 |
| chr22_+_22758698 | 30.06 |
ENST00000390312.2
|
IGLV2-14
|
immunoglobulin lambda variable 2-14 |
| chr6_+_37170133 | 29.75 |
ENST00000373509.6
|
PIM1
|
Pim-1 proto-oncogene, serine/threonine kinase |
| chr14_-_106557465 | 29.22 |
ENST00000390625.3
|
IGHV3-49
|
immunoglobulin heavy variable 3-49 |
| chr14_-_106507476 | 29.06 |
ENST00000390621.3
|
IGHV1-45
|
immunoglobulin heavy variable 1-45 |
| chr16_+_23835946 | 27.95 |
ENST00000321728.12
ENST00000643927.1 |
PRKCB
|
protein kinase C beta |
| chr2_+_113406368 | 27.94 |
ENST00000453673.3
|
IGKV1OR2-108
|
immunoglobulin kappa variable 1/OR2-108 (non-functional) |
| chr22_+_22697789 | 27.89 |
ENST00000390306.2
|
IGLV2-23
|
immunoglobulin lambda variable 2-23 |
| chr4_-_70666492 | 27.80 |
ENST00000254801.9
ENST00000391614.7 |
JCHAIN
|
joining chain of multimeric IgA and IgM |
| chr8_-_133102477 | 26.72 |
ENST00000522119.5
ENST00000523610.5 ENST00000338087.10 ENST00000521302.5 ENST00000519558.5 ENST00000519747.5 ENST00000517648.5 |
SLA
|
Src like adaptor |
| chrX_-_107717054 | 26.37 |
ENST00000503515.1
ENST00000372397.6 |
TSC22D3
|
TSC22 domain family member 3 |
| chr17_-_49764123 | 25.46 |
ENST00000240364.7
ENST00000506156.1 |
FAM117A
|
family with sequence similarity 117 member A |
| chr16_+_33827140 | 25.09 |
ENST00000562905.2
|
IGHV3OR16-13
|
immunoglobulin heavy variable 3/OR16-13 (non-functional) |
| chr8_-_133102874 | 25.00 |
ENST00000395352.7
|
SLA
|
Src like adaptor |
| chr14_-_106762576 | 24.80 |
ENST00000624687.1
|
IGHV1-69D
|
immunoglobulin heavy variable 1-69D |
| chr14_-_106360320 | 24.01 |
ENST00000390615.2
|
IGHV3-33
|
immunoglobulin heavy variable 3-33 |
| chr2_-_89245596 | 23.87 |
ENST00000468494.1
|
IGKV2-30
|
immunoglobulin kappa variable 2-30 |
| chr14_-_106277039 | 23.86 |
ENST00000390610.2
|
IGHV1-24
|
immunoglobulin heavy variable 1-24 |
| chr2_-_89320146 | 23.77 |
ENST00000498574.1
|
IGKV1-39
|
immunoglobulin kappa variable 1-39 |
| chr14_-_106335613 | 23.60 |
ENST00000603660.1
|
IGHV3-30
|
immunoglobulin heavy variable 3-30 |
| chr1_-_149812359 | 23.57 |
ENST00000369167.2
ENST00000545683.1 |
H2BC18
|
H2B clustered histone 18 |
| chr1_+_228458095 | 23.47 |
ENST00000620438.1
|
H2BU1
|
H2B.U histone 1 |
| chr22_+_22588155 | 23.26 |
ENST00000390302.3
|
IGLV2-33
|
immunoglobulin lambda variable 2-33 (non-functional) |
| chr2_-_88947820 | 22.60 |
ENST00000496168.1
|
IGKV1-5
|
immunoglobulin kappa variable 1-5 |
| chr2_+_90114838 | 22.45 |
ENST00000417279.3
|
IGKV3D-15
|
immunoglobulin kappa variable 3D-15 |
| chr7_-_100586119 | 21.88 |
ENST00000310300.11
|
LRCH4
|
leucine rich repeats and calponin homology domain containing 4 |
| chr2_+_89851723 | 20.31 |
ENST00000429992.2
|
IGKV2D-40
|
immunoglobulin kappa variable 2D-40 |
| chr2_+_89936859 | 20.03 |
ENST00000474213.1
|
IGKV2D-30
|
immunoglobulin kappa variable 2D-30 |
| chr22_+_22747383 | 19.61 |
ENST00000390311.3
|
IGLV3-16
|
immunoglobulin lambda variable 3-16 |
| chr22_+_22818994 | 19.49 |
ENST00000390316.2
|
IGLV3-9
|
immunoglobulin lambda variable 3-9 |
| chr15_-_19965101 | 19.32 |
ENST00000338912.5
|
IGHV1OR15-9
|
immunoglobulin heavy variable 1/OR15-9 (non-functional) |
| chr22_+_22686724 | 18.64 |
ENST00000390305.2
|
IGLV3-25
|
immunoglobulin lambda variable 3-25 |
| chr6_-_27146841 | 18.10 |
ENST00000356950.2
|
H2BC12
|
H2B clustered histone 12 |
| chr14_-_106875069 | 17.08 |
ENST00000390639.2
|
IGHV7-81
|
immunoglobulin heavy variable 7-81 (non-functional) |
| chr14_-_106374129 | 16.71 |
ENST00000390616.2
|
IGHV4-34
|
immunoglobulin heavy variable 4-34 |
| chr14_-_106130061 | 16.18 |
ENST00000390602.3
|
IGHV3-13
|
immunoglobulin heavy variable 3-13 |
| chr1_+_156150008 | 14.96 |
ENST00000355014.6
|
SEMA4A
|
semaphorin 4A |
| chrX_-_107775951 | 14.91 |
ENST00000315660.8
ENST00000372384.6 ENST00000502650.1 ENST00000506724.1 |
TSC22D3
|
TSC22 domain family member 3 |
| chr6_-_26216673 | 14.70 |
ENST00000541790.3
|
H2BC8
|
H2B clustered histone 8 |
| chr14_-_106737547 | 14.44 |
ENST00000632209.1
|
IGHV1-69-2
|
immunoglobulin heavy variable 1-69-2 |
| chrX_+_12975083 | 13.08 |
ENST00000451311.7
ENST00000380636.1 |
TMSB4X
|
thymosin beta 4 X-linked |
| chr19_-_17405554 | 13.05 |
ENST00000252593.7
|
BST2
|
bone marrow stromal cell antigen 2 |
| chr4_-_25863537 | 12.84 |
ENST00000502949.5
ENST00000264868.9 ENST00000513691.1 ENST00000514872.1 |
SEL1L3
|
SEL1L family member 3 |
| chr10_-_96271508 | 12.60 |
ENST00000427367.6
ENST00000413476.6 ENST00000371176.6 |
BLNK
|
B cell linker |
| chr1_+_116754422 | 12.39 |
ENST00000369478.4
ENST00000369477.1 |
CD2
|
CD2 molecule |
| chr22_+_22704265 | 12.04 |
ENST00000390307.2
|
IGLV3-22
|
immunoglobulin lambda variable 3-22 |
| chr6_-_27814757 | 11.88 |
ENST00000333151.5
|
H2AC14
|
H2A clustered histone 14 |
| chr22_+_22720615 | 11.44 |
ENST00000390309.2
|
IGLV3-19
|
immunoglobulin lambda variable 3-19 |
| chr19_-_18281612 | 11.28 |
ENST00000252818.5
|
JUND
|
JunD proto-oncogene, AP-1 transcription factor subunit |
| chr1_+_207325629 | 11.02 |
ENST00000618707.2
|
CD55
|
CD55 molecule (Cromer blood group) |
| chr6_+_26158115 | 10.60 |
ENST00000377777.5
ENST00000289316.2 |
H2BC5
|
H2B clustered histone 5 |
| chr9_+_133459965 | 10.46 |
ENST00000540581.5
ENST00000542192.5 ENST00000291722.11 ENST00000316948.9 |
CACFD1
|
calcium channel flower domain containing 1 |
| chr3_-_18425295 | 9.98 |
ENST00000338745.11
ENST00000450898.1 |
SATB1
|
SATB homeobox 1 |
| chr19_+_19033575 | 9.90 |
ENST00000392335.6
ENST00000537263.5 ENST00000540707.5 ENST00000535612.6 ENST00000541725.5 ENST00000269932.10 ENST00000546344.5 ENST00000540792.5 ENST00000536098.5 ENST00000541898.5 |
ARMC6
|
armadillo repeat containing 6 |
| chr12_-_7092422 | 9.89 |
ENST00000543835.5
ENST00000647956.2 ENST00000535233.6 |
C1R
|
complement C1r |
| chr6_+_27815010 | 9.83 |
ENST00000621112.2
|
H2BC14
|
H2B clustered histone 14 |
| chrX_-_48919015 | 9.53 |
ENST00000376509.4
|
PIM2
|
Pim-2 proto-oncogene, serine/threonine kinase |
| chr6_-_27807916 | 9.30 |
ENST00000377401.3
|
H2BC13
|
H2B clustered histone 13 |
| chr4_+_40192949 | 9.20 |
ENST00000507851.5
ENST00000615577.4 ENST00000613272.4 |
RHOH
|
ras homolog family member H |
| chr6_+_27808163 | 9.19 |
ENST00000358739.4
|
H2AC13
|
H2A clustered histone 13 |
| chr17_-_19748341 | 9.16 |
ENST00000395555.7
|
ALDH3A1
|
aldehyde dehydrogenase 3 family member A1 |
| chr21_+_38272410 | 8.90 |
ENST00000398934.5
ENST00000398930.5 |
KCNJ15
|
potassium inwardly rectifying channel subfamily J member 15 |
| chr22_-_23754376 | 8.80 |
ENST00000398465.3
ENST00000248948.4 |
VPREB3
|
V-set pre-B cell surrogate light chain 3 |
| chr6_-_81752671 | 8.75 |
ENST00000320172.11
ENST00000369754.7 ENST00000369756.3 |
TENT5A
|
terminal nucleotidyltransferase 5A |
| chr11_-_130002818 | 8.66 |
ENST00000358825.9
ENST00000360871.8 ENST00000528746.5 |
PRDM10
|
PR/SET domain 10 |
| chr17_-_19748285 | 8.66 |
ENST00000570414.1
ENST00000225740.11 |
ALDH3A1
|
aldehyde dehydrogenase 3 family member A1 |
| chr18_-_55321986 | 8.41 |
ENST00000570287.6
|
TCF4
|
transcription factor 4 |
| chr6_+_27865308 | 8.32 |
ENST00000613174.2
|
H2AC16
|
H2A clustered histone 16 |
| chr16_+_28931942 | 8.22 |
ENST00000324662.8
ENST00000538922.8 |
CD19
|
CD19 molecule |
| chr17_-_19748355 | 8.19 |
ENST00000494157.6
|
ALDH3A1
|
aldehyde dehydrogenase 3 family member A1 |
| chr16_+_56935371 | 8.03 |
ENST00000568358.1
|
HERPUD1
|
homocysteine inducible ER protein with ubiquitin like domain 1 |
| chr18_-_55322215 | 8.03 |
ENST00000457482.7
|
TCF4
|
transcription factor 4 |
| chr19_+_54617122 | 7.43 |
ENST00000396331.5
|
LILRB1
|
leukocyte immunoglobulin like receptor B1 |
| chr12_-_7503744 | 7.27 |
ENST00000396620.7
ENST00000432237.3 |
CD163
|
CD163 molecule |
| chr6_-_34146080 | 7.09 |
ENST00000538487.7
ENST00000374181.8 |
GRM4
|
glutamate metabotropic receptor 4 |
| chr19_+_17747698 | 7.03 |
ENST00000594202.5
ENST00000252771.11 |
FCHO1
|
FCH and mu domain containing endocytic adaptor 1 |
| chr6_-_35688907 | 6.98 |
ENST00000539068.5
ENST00000357266.9 |
FKBP5
|
FKBP prolyl isomerase 5 |
| chr22_+_22409755 | 6.97 |
ENST00000390299.2
|
IGLV1-40
|
immunoglobulin lambda variable 1-40 |
| chr18_-_55422492 | 6.88 |
ENST00000561992.5
ENST00000630712.2 |
TCF4
|
transcription factor 4 |
| chr9_-_124771304 | 6.84 |
ENST00000416460.6
ENST00000487099.7 |
NR6A1
|
nuclear receptor subfamily 6 group A member 1 |
| chr6_-_27132750 | 6.69 |
ENST00000607124.1
ENST00000339812.3 |
H2BC11
|
H2B clustered histone 11 |
| chr19_+_35329161 | 6.64 |
ENST00000341773.10
ENST00000600131.5 ENST00000595780.5 ENST00000597916.5 ENST00000593867.5 ENST00000600424.5 ENST00000599811.5 ENST00000536635.6 ENST00000085219.10 ENST00000544992.6 ENST00000419549.6 |
CD22
|
CD22 molecule |
| chr6_+_26216928 | 6.58 |
ENST00000303910.4
|
H2AC8
|
H2A clustered histone 8 |
| chr22_+_22030934 | 6.42 |
ENST00000390282.2
|
IGLV4-69
|
immunoglobulin lambda variable 4-69 |
| chr19_-_40285277 | 6.37 |
ENST00000579047.5
ENST00000392038.7 |
AKT2
|
AKT serine/threonine kinase 2 |
| chr6_+_27893411 | 6.36 |
ENST00000616182.2
|
H2BC17
|
H2B clustered histone 17 |
| chrX_+_12975216 | 6.15 |
ENST00000380635.5
|
TMSB4X
|
thymosin beta 4 X-linked |
| chr17_+_75525682 | 6.09 |
ENST00000392550.8
ENST00000167462.9 ENST00000375227.8 ENST00000578363.5 ENST00000579392.5 |
LLGL2
|
LLGL scribble cell polarity complex component 2 |
| chr19_-_1021114 | 6.08 |
ENST00000333175.9
ENST00000356663.8 |
TMEM259
|
transmembrane protein 259 |
| chr4_-_40515967 | 6.08 |
ENST00000381795.10
|
RBM47
|
RNA binding motif protein 47 |
| chr14_-_106005574 | 6.04 |
ENST00000390595.3
|
IGHV1-3
|
immunoglobulin heavy variable 1-3 |
| chr9_-_81688354 | 5.75 |
ENST00000418319.5
|
TLE1
|
TLE family member 1, transcriptional corepressor |
| chr2_-_174598206 | 5.73 |
ENST00000392546.6
ENST00000436221.1 |
WIPF1
|
WAS/WASL interacting protein family member 1 |
| chr7_+_27242796 | 5.71 |
ENST00000496902.7
|
EVX1
|
even-skipped homeobox 1 |
| chr1_+_103655760 | 5.57 |
ENST00000370083.9
|
AMY1A
|
amylase alpha 1A |
| chr11_-_2885728 | 5.49 |
ENST00000647251.1
ENST00000380725.2 ENST00000430149.3 ENST00000414822.8 ENST00000440480.8 |
CDKN1C
|
cyclin dependent kinase inhibitor 1C |
| chr4_-_18021727 | 5.42 |
ENST00000675605.1
ENST00000675927.1 ENST00000674942.1 ENST00000675143.1 ENST00000382226.5 ENST00000326877.8 ENST00000635767.1 |
LCORL
|
ligand dependent nuclear receptor corepressor like |
| chr11_-_62591500 | 5.35 |
ENST00000476907.6
ENST00000278279.7 |
TUT1
|
terminal uridylyl transferase 1, U6 snRNA-specific |
| chr12_-_10723307 | 5.24 |
ENST00000279550.11
ENST00000228251.9 |
YBX3
|
Y-box binding protein 3 |
| chr7_-_130440848 | 5.24 |
ENST00000675803.1
ENST00000223208.10 ENST00000343969.10 ENST00000471201.6 ENST00000675649.1 ENST00000675168.1 ENST00000469826.2 ENST00000334451.6 ENST00000675962.1 ENST00000675563.1 ENST00000480206.2 ENST00000489512.5 ENST00000676243.1 ENST00000674539.1 ENST00000675935.1 |
CEP41
|
centrosomal protein 41 |
| chr1_+_66332004 | 5.21 |
ENST00000371045.9
ENST00000531025.5 ENST00000526197.5 |
PDE4B
|
phosphodiesterase 4B |
| chr7_+_16753731 | 5.20 |
ENST00000262067.5
|
TSPAN13
|
tetraspanin 13 |
| chr12_+_62260338 | 5.03 |
ENST00000353364.7
ENST00000549523.5 |
USP15
|
ubiquitin specific peptidase 15 |
| chr8_+_19939246 | 5.00 |
ENST00000650287.1
|
LPL
|
lipoprotein lipase |
| chrX_-_130903224 | 4.97 |
ENST00000370935.5
|
ENOX2
|
ecto-NOX disulfide-thiol exchanger 2 |
| chr11_-_62601818 | 4.93 |
ENST00000278823.7
|
MTA2
|
metastasis associated 1 family member 2 |
| chr19_-_49665603 | 4.90 |
ENST00000596756.5
|
IRF3
|
interferon regulatory factor 3 |
| chr17_+_40341388 | 4.73 |
ENST00000394086.7
|
RARA
|
retinoic acid receptor alpha |
| chr4_+_123399488 | 4.72 |
ENST00000394339.2
|
SPRY1
|
sprouty RTK signaling antagonist 1 |
| chr18_-_55585773 | 4.70 |
ENST00000563824.5
ENST00000626425.2 ENST00000566514.5 ENST00000568673.5 ENST00000562847.5 ENST00000568147.5 |
TCF4
|
transcription factor 4 |
| chr2_-_218002988 | 4.65 |
ENST00000682258.1
ENST00000446903.5 |
TNS1
|
tensin 1 |
| chr10_-_96271553 | 4.59 |
ENST00000224337.10
|
BLNK
|
B cell linker |
| chr9_+_89605004 | 4.56 |
ENST00000252506.11
ENST00000375769.1 |
GADD45G
|
growth arrest and DNA damage inducible gamma |
| chr6_-_11232658 | 4.48 |
ENST00000379433.5
ENST00000379446.10 ENST00000620854.4 |
NEDD9
|
neural precursor cell expressed, developmentally down-regulated 9 |
| chr19_+_17747737 | 4.39 |
ENST00000600676.5
ENST00000600209.5 ENST00000596309.5 ENST00000598539.5 ENST00000597474.5 ENST00000593385.5 ENST00000598067.5 ENST00000593833.5 |
FCHO1
|
FCH and mu domain containing endocytic adaptor 1 |
| chr11_-_62591554 | 4.38 |
ENST00000494385.1
ENST00000308436.11 |
TUT1
|
terminal uridylyl transferase 1, U6 snRNA-specific |
| chr17_-_7929793 | 4.37 |
ENST00000303790.3
|
KCNAB3
|
potassium voltage-gated channel subfamily A regulatory beta subunit 3 |
| chr18_-_55423757 | 4.37 |
ENST00000675707.1
|
TCF4
|
transcription factor 4 |
| chr19_+_35371290 | 4.35 |
ENST00000597214.1
|
GPR42
|
G protein-coupled receptor 42 |
| chr17_-_75779758 | 4.33 |
ENST00000592643.5
ENST00000591890.5 ENST00000587171.1 ENST00000254810.8 ENST00000589599.5 |
H3-3B
|
H3.3 histone B |
| chr6_+_26272923 | 4.31 |
ENST00000377733.4
|
H2BC10
|
H2B clustered histone 10 |
| chr19_-_40285395 | 4.30 |
ENST00000424901.5
ENST00000578123.5 |
AKT2
|
AKT serine/threonine kinase 2 |
| chr8_-_56211257 | 4.28 |
ENST00000316981.8
ENST00000423799.6 ENST00000429357.2 |
PLAG1
|
PLAG1 zinc finger |
| chr12_-_7503841 | 4.26 |
ENST00000359156.8
|
CD163
|
CD163 molecule |
| chr12_+_62260374 | 4.26 |
ENST00000312635.10
ENST00000280377.10 ENST00000549237.5 |
USP15
|
ubiquitin specific peptidase 15 |
| chr7_-_73624492 | 4.17 |
ENST00000414749.6
ENST00000429400.6 ENST00000434326.5 ENST00000313375.8 ENST00000354613.5 ENST00000453275.1 |
MLXIPL
|
MLX interacting protein like |
| chr7_+_80646436 | 4.16 |
ENST00000419819.2
|
CD36
|
CD36 molecule |
| chr6_-_53148822 | 4.05 |
ENST00000259803.8
|
GCM1
|
glial cells missing transcription factor 1 |
| chrX_-_130903187 | 4.04 |
ENST00000432489.5
ENST00000394363.6 ENST00000338144.8 |
ENOX2
|
ecto-NOX disulfide-thiol exchanger 2 |
| chr7_+_100586304 | 4.00 |
ENST00000241071.11
|
FBXO24
|
F-box protein 24 |
| chr1_+_207496147 | 3.94 |
ENST00000400960.7
ENST00000367049.9 |
CR1
|
complement C3b/C4b receptor 1 (Knops blood group) |
| chrX_+_100584928 | 3.84 |
ENST00000373031.5
|
TNMD
|
tenomodulin |
| chr5_-_67196791 | 3.78 |
ENST00000256447.5
|
CD180
|
CD180 molecule |
| chr4_+_93828746 | 3.78 |
ENST00000306011.6
|
ATOH1
|
atonal bHLH transcription factor 1 |
| chr5_-_65481907 | 3.74 |
ENST00000381055.8
|
ADAMTS6
|
ADAM metallopeptidase with thrombospondin type 1 motif 6 |
| chr4_-_99321362 | 3.72 |
ENST00000625860.2
ENST00000305046.13 ENST00000506651.5 |
ADH1B
|
alcohol dehydrogenase 1B (class I), beta polypeptide |
| chrX_-_102380093 | 3.65 |
ENST00000604395.5
|
NXF2B
|
nuclear RNA export factor 2B |
| chr22_-_42614871 | 3.51 |
ENST00000252115.10
|
POLDIP3
|
DNA polymerase delta interacting protein 3 |
| chr10_-_114144599 | 3.44 |
ENST00000428953.1
|
CCDC186
|
coiled-coil domain containing 186 |
| chr7_+_50308672 | 3.32 |
ENST00000439701.2
ENST00000438033.5 ENST00000492782.6 |
IKZF1
|
IKAROS family zinc finger 1 |
| chr17_+_45135640 | 3.29 |
ENST00000586346.5
ENST00000321854.13 ENST00000398322.7 ENST00000592162.5 ENST00000376955.8 |
ACBD4
|
acyl-CoA binding domain containing 4 |
Gene Ontology Analysis
Gene overrepresentation in biological process category:
| Log-likelihood per target | Total log-likelihood | Term | Description |
|---|---|---|---|
| 15.4 | 2277.5 | GO:0006958 | complement activation, classical pathway(GO:0006958) |
| 11.7 | 58.3 | GO:0050861 | positive regulation of B cell receptor signaling pathway(GO:0050861) |
| 10.8 | 32.5 | GO:0030185 | nitric oxide transport(GO:0030185) |
| 5.2 | 41.3 | GO:0070235 | regulation of activation-induced cell death of T cells(GO:0070235) negative regulation of activation-induced cell death of T cells(GO:0070236) |
| 4.4 | 13.1 | GO:1901253 | negative regulation of intracellular transport of viral material(GO:1901253) |
| 4.2 | 739.4 | GO:0002377 | immunoglobulin production(GO:0002377) |
| 4.0 | 27.8 | GO:0060267 | positive regulation of respiratory burst(GO:0060267) |
| 3.6 | 10.7 | GO:0097473 | response to high light intensity(GO:0009644) cellular response to light intensity(GO:0071484) cellular response to high light intensity(GO:0071486) retinal rod cell apoptotic process(GO:0097473) retinal cell apoptotic process(GO:1990009) |
| 2.5 | 7.5 | GO:0021913 | regulation of transcription from RNA polymerase II promoter involved in ventral spinal cord interneuron specification(GO:0021913) |
| 2.5 | 29.7 | GO:0070561 | vitamin D receptor signaling pathway(GO:0070561) |
| 2.4 | 19.2 | GO:2000483 | negative regulation of RNA polymerase II regulatory region sequence-specific DNA binding(GO:1903026) negative regulation of interleukin-8 secretion(GO:2000483) |
| 2.1 | 12.4 | GO:0030885 | regulation of myeloid dendritic cell activation(GO:0030885) |
| 1.9 | 7.4 | GO:0035548 | gamma-delta T cell activation involved in immune response(GO:0002290) negative regulation of interferon-beta secretion(GO:0035548) regulation of gamma-delta T cell activation involved in immune response(GO:2001191) positive regulation of gamma-delta T cell activation involved in immune response(GO:2001193) |
| 1.4 | 4.2 | GO:0043973 | histone H3-K4 acetylation(GO:0043973) |
| 1.3 | 4.0 | GO:0060018 | astrocyte fate commitment(GO:0060018) |
| 1.3 | 24.0 | GO:0035090 | maintenance of apical/basal cell polarity(GO:0035090) maintenance of epithelial cell apical/basal polarity(GO:0045199) |
| 1.3 | 2.6 | GO:0048852 | hypophysis morphogenesis(GO:0048850) diencephalon morphogenesis(GO:0048852) |
| 1.2 | 4.7 | GO:0060010 | Sertoli cell fate commitment(GO:0060010) |
| 1.2 | 4.7 | GO:0060940 | epithelial to mesenchymal transition involved in cardiac fibroblast development(GO:0060940) |
| 1.2 | 7.0 | GO:0035616 | histone H2B conserved C-terminal lysine deubiquitination(GO:0035616) |
| 1.1 | 10.6 | GO:0055095 | lipoprotein particle mediated signaling(GO:0055095) low-density lipoprotein particle mediated signaling(GO:0055096) |
| 1.0 | 6.1 | GO:0016554 | cytidine to uridine editing(GO:0016554) |
| 0.9 | 9.7 | GO:0098789 | pre-mRNA cleavage required for polyadenylation(GO:0098789) |
| 0.8 | 2.5 | GO:0060435 | bronchiole development(GO:0060435) |
| 0.8 | 2.5 | GO:0046619 | optic placode formation involved in camera-type eye formation(GO:0046619) |
| 0.8 | 10.2 | GO:0060340 | positive regulation of type I interferon-mediated signaling pathway(GO:0060340) |
| 0.8 | 3.8 | GO:0035992 | tendon cell differentiation(GO:0035990) tendon formation(GO:0035992) |
| 0.8 | 3.8 | GO:0002322 | B cell proliferation involved in immune response(GO:0002322) |
| 0.7 | 5.2 | GO:0018095 | protein polyglutamylation(GO:0018095) |
| 0.7 | 6.7 | GO:0042905 | 9-cis-retinoic acid biosynthetic process(GO:0042904) 9-cis-retinoic acid metabolic process(GO:0042905) |
| 0.7 | 2.1 | GO:0001978 | regulation of systemic arterial blood pressure by carotid sinus baroreceptor feedback(GO:0001978) baroreceptor response to increased systemic arterial blood pressure(GO:0001983) positive regulation of the force of heart contraction by chemical signal(GO:0003099) |
| 0.7 | 16.7 | GO:0045063 | T-helper 1 cell differentiation(GO:0045063) |
| 0.7 | 5.2 | GO:1902219 | negative regulation of intrinsic apoptotic signaling pathway in response to osmotic stress(GO:1902219) |
| 0.6 | 3.8 | GO:2000980 | regulation of auditory receptor cell differentiation(GO:0045607) regulation of mechanoreceptor differentiation(GO:0045631) regulation of inner ear receptor cell differentiation(GO:2000980) |
| 0.6 | 8.6 | GO:0043374 | CD8-positive, alpha-beta T cell differentiation(GO:0043374) |
| 0.6 | 2.5 | GO:0071947 | protein deubiquitination involved in ubiquitin-dependent protein catabolic process(GO:0071947) |
| 0.6 | 14.1 | GO:1904294 | positive regulation of ERAD pathway(GO:1904294) |
| 0.5 | 2.2 | GO:0060743 | epithelial cell maturation involved in prostate gland development(GO:0060743) |
| 0.5 | 1.1 | GO:0033326 | cerebrospinal fluid secretion(GO:0033326) |
| 0.5 | 51.7 | GO:0038083 | peptidyl-tyrosine autophosphorylation(GO:0038083) |
| 0.5 | 2.6 | GO:0072396 | response to cell cycle checkpoint signaling(GO:0072396) response to DNA integrity checkpoint signaling(GO:0072402) response to DNA damage checkpoint signaling(GO:0072423) |
| 0.5 | 5.5 | GO:1902746 | regulation of lens fiber cell differentiation(GO:1902746) |
| 0.5 | 1.5 | GO:0071676 | negative regulation of mononuclear cell migration(GO:0071676) |
| 0.5 | 2.7 | GO:0060370 | susceptibility to T cell mediated cytotoxicity(GO:0060370) |
| 0.4 | 5.2 | GO:1901898 | negative regulation of relaxation of cardiac muscle(GO:1901898) |
| 0.4 | 7.1 | GO:0007196 | adenylate cyclase-inhibiting G-protein coupled glutamate receptor signaling pathway(GO:0007196) |
| 0.4 | 11.4 | GO:0048268 | clathrin coat assembly(GO:0048268) |
| 0.4 | 5.8 | GO:2000811 | negative regulation of anoikis(GO:2000811) |
| 0.4 | 1.4 | GO:2000342 | negative regulation of chemokine (C-X-C motif) ligand 2 production(GO:2000342) |
| 0.4 | 1.1 | GO:0070681 | glutaminyl-tRNAGln biosynthesis via transamidation(GO:0070681) |
| 0.3 | 3.1 | GO:1903800 | positive regulation of production of miRNAs involved in gene silencing by miRNA(GO:1903800) |
| 0.3 | 2.9 | GO:0072513 | positive regulation of secondary heart field cardioblast proliferation(GO:0072513) |
| 0.3 | 4.2 | GO:0090324 | negative regulation of oxidative phosphorylation(GO:0090324) |
| 0.3 | 2.5 | GO:0006689 | ganglioside catabolic process(GO:0006689) |
| 0.3 | 4.3 | GO:0060252 | positive regulation of glial cell proliferation(GO:0060252) |
| 0.3 | 6.5 | GO:0016973 | poly(A)+ mRNA export from nucleus(GO:0016973) |
| 0.3 | 5.8 | GO:0009223 | pyrimidine deoxyribonucleotide catabolic process(GO:0009223) |
| 0.2 | 77.4 | GO:0002250 | adaptive immune response(GO:0002250) |
| 0.2 | 8.2 | GO:0030449 | regulation of complement activation(GO:0030449) |
| 0.2 | 35.4 | GO:0051591 | response to cAMP(GO:0051591) |
| 0.2 | 1.0 | GO:0042320 | regulation of circadian sleep/wake cycle, REM sleep(GO:0042320) |
| 0.2 | 1.5 | GO:0070995 | NADPH oxidation(GO:0070995) |
| 0.2 | 3.3 | GO:0031033 | myosin filament organization(GO:0031033) |
| 0.2 | 9.6 | GO:0010761 | fibroblast migration(GO:0010761) |
| 0.1 | 7.4 | GO:0034260 | negative regulation of GTPase activity(GO:0034260) |
| 0.1 | 3.1 | GO:0007597 | blood coagulation, intrinsic pathway(GO:0007597) |
| 0.1 | 6.1 | GO:0032878 | regulation of establishment or maintenance of cell polarity(GO:0032878) |
| 0.1 | 8.2 | GO:0006953 | acute-phase response(GO:0006953) |
| 0.1 | 9.5 | GO:0016239 | positive regulation of macroautophagy(GO:0016239) |
| 0.1 | 1.9 | GO:0042359 | vitamin D metabolic process(GO:0042359) |
| 0.1 | 2.2 | GO:0046069 | cGMP catabolic process(GO:0046069) |
| 0.1 | 4.3 | GO:0000413 | protein peptidyl-prolyl isomerization(GO:0000413) |
| 0.1 | 0.2 | GO:0005989 | lactose metabolic process(GO:0005988) lactose biosynthetic process(GO:0005989) |
| 0.1 | 0.5 | GO:0043697 | forebrain anterior/posterior pattern specification(GO:0021797) dedifferentiation(GO:0043696) cell dedifferentiation(GO:0043697) |
| 0.1 | 1.0 | GO:0060272 | embryonic skeletal joint morphogenesis(GO:0060272) |
| 0.1 | 1.2 | GO:0060575 | intestinal epithelial cell differentiation(GO:0060575) |
| 0.1 | 1.8 | GO:0042347 | negative regulation of NF-kappaB import into nucleus(GO:0042347) |
| 0.1 | 4.6 | GO:0045071 | negative regulation of viral genome replication(GO:0045071) |
| 0.1 | 2.4 | GO:0007603 | phototransduction, visible light(GO:0007603) |
| 0.0 | 1.4 | GO:0010719 | negative regulation of epithelial to mesenchymal transition(GO:0010719) |
| 0.0 | 1.4 | GO:0015012 | heparan sulfate proteoglycan biosynthetic process(GO:0015012) |
| 0.0 | 0.8 | GO:0016180 | snRNA processing(GO:0016180) |
| 0.0 | 3.7 | GO:0003279 | cardiac septum development(GO:0003279) |
| 0.0 | 5.2 | GO:1903169 | regulation of calcium ion transmembrane transport(GO:1903169) |
| 0.0 | 3.6 | GO:0006959 | humoral immune response(GO:0006959) |
| 0.0 | 3.4 | GO:0051291 | protein heterooligomerization(GO:0051291) |
| 0.0 | 0.7 | GO:0060711 | labyrinthine layer development(GO:0060711) |
| 0.0 | 0.2 | GO:0030854 | positive regulation of granulocyte differentiation(GO:0030854) |
| 0.0 | 0.7 | GO:0032570 | response to progesterone(GO:0032570) |
| 0.0 | 0.4 | GO:0075522 | IRES-dependent viral translational initiation(GO:0075522) |
| 0.0 | 0.3 | GO:0035563 | positive regulation of chromatin binding(GO:0035563) |
| 0.0 | 1.0 | GO:0046426 | negative regulation of JAK-STAT cascade(GO:0046426) negative regulation of STAT cascade(GO:1904893) |
| 0.0 | 1.6 | GO:0002433 | immune response-regulating cell surface receptor signaling pathway involved in phagocytosis(GO:0002433) Fc-gamma receptor signaling pathway involved in phagocytosis(GO:0038096) |
| 0.0 | 0.2 | GO:0036150 | phosphatidylserine acyl-chain remodeling(GO:0036150) |
| 0.0 | 2.0 | GO:0002576 | platelet degranulation(GO:0002576) |
Gene overrepresentation in cellular component category:
| Log-likelihood per target | Total log-likelihood | Term | Description |
|---|---|---|---|
| 19.7 | 1045.8 | GO:0042571 | immunoglobulin complex, circulating(GO:0042571) |
| 8.1 | 32.5 | GO:0031838 | haptoglobin-hemoglobin complex(GO:0031838) |
| 6.1 | 30.3 | GO:0034666 | integrin alpha2-beta1 complex(GO:0034666) |
| 2.2 | 395.9 | GO:0072562 | blood microparticle(GO:0072562) |
| 1.4 | 11.3 | GO:0035976 | AP1 complex(GO:0035976) |
| 1.1 | 8.0 | GO:1990037 | Lewy body core(GO:1990037) |
| 1.0 | 1.9 | GO:0031232 | extrinsic component of external side of plasma membrane(GO:0031232) |
| 0.9 | 2.6 | GO:0043293 | apoptosome(GO:0043293) |
| 0.7 | 19.2 | GO:0031093 | platelet alpha granule lumen(GO:0031093) |
| 0.6 | 9.7 | GO:0005847 | mRNA cleavage and polyadenylation specificity factor complex(GO:0005847) |
| 0.6 | 949.0 | GO:0005615 | extracellular space(GO:0005615) |
| 0.5 | 1.6 | GO:0005927 | muscle tendon junction(GO:0005927) |
| 0.4 | 12.4 | GO:0046658 | anchored component of plasma membrane(GO:0046658) |
| 0.4 | 6.5 | GO:0000346 | transcription export complex(GO:0000346) |
| 0.4 | 1.1 | GO:0030956 | glutamyl-tRNA(Gln) amidotransferase complex(GO:0030956) |
| 0.3 | 13.3 | GO:0005720 | nuclear heterochromatin(GO:0005720) |
| 0.3 | 1.5 | GO:1990031 | pinceau fiber(GO:1990031) |
| 0.3 | 1.8 | GO:0098560 | cytoplasmic side of late endosome membrane(GO:0098560) |
| 0.2 | 5.2 | GO:0000930 | gamma-tubulin complex(GO:0000930) |
| 0.2 | 24.1 | GO:0031225 | anchored component of membrane(GO:0031225) |
| 0.2 | 2.0 | GO:0031092 | platelet alpha granule membrane(GO:0031092) |
| 0.2 | 1.8 | GO:0042622 | photoreceptor outer segment membrane(GO:0042622) |
| 0.1 | 19.0 | GO:0016605 | PML body(GO:0016605) |
| 0.1 | 29.9 | GO:0031234 | extrinsic component of cytoplasmic side of plasma membrane(GO:0031234) |
| 0.1 | 4.9 | GO:0090545 | NuRD complex(GO:0016581) CHD-type complex(GO:0090545) |
| 0.1 | 25.8 | GO:0032993 | protein-DNA complex(GO:0032993) |
| 0.1 | 7.4 | GO:0001772 | immunological synapse(GO:0001772) |
| 0.1 | 25.9 | GO:0009897 | external side of plasma membrane(GO:0009897) |
| 0.1 | 11.4 | GO:0005905 | clathrin-coated pit(GO:0005905) |
| 0.1 | 7.9 | GO:0005884 | actin filament(GO:0005884) |
| 0.1 | 10.7 | GO:0032587 | ruffle membrane(GO:0032587) |
| 0.1 | 5.2 | GO:0005844 | polysome(GO:0005844) |
| 0.1 | 374.3 | GO:0005576 | extracellular region(GO:0005576) |
| 0.1 | 0.8 | GO:0032039 | integrator complex(GO:0032039) |
| 0.1 | 0.5 | GO:0005672 | transcription factor TFIIA complex(GO:0005672) |
| 0.0 | 4.0 | GO:0036064 | ciliary basal body(GO:0036064) |
| 0.0 | 2.1 | GO:0005901 | caveola(GO:0005901) |
| 0.0 | 2.2 | GO:0030134 | ER to Golgi transport vesicle(GO:0030134) |
| 0.0 | 0.7 | GO:0097381 | photoreceptor disc membrane(GO:0097381) |
| 0.0 | 4.9 | GO:0005938 | cell cortex(GO:0005938) |
| 0.0 | 1.6 | GO:0031463 | Cul3-RING ubiquitin ligase complex(GO:0031463) |
| 0.0 | 4.7 | GO:0000151 | ubiquitin ligase complex(GO:0000151) |
| 0.0 | 2.2 | GO:0043204 | perikaryon(GO:0043204) |
| 0.0 | 0.4 | GO:0016592 | mediator complex(GO:0016592) |
| 0.0 | 0.4 | GO:1902711 | GABA-A receptor complex(GO:1902711) |
Gene overrepresentation in molecular function category:
| Log-likelihood per target | Total log-likelihood | Term | Description |
|---|---|---|---|
| 17.4 | 1045.8 | GO:0034987 | immunoglobulin receptor binding(GO:0034987) |
| 10.2 | 1903.6 | GO:0003823 | antigen binding(GO:0003823) |
| 7.0 | 28.0 | GO:0004698 | calcium-dependent protein kinase C activity(GO:0004698) |
| 5.9 | 29.4 | GO:0043208 | glycosphingolipid binding(GO:0043208) |
| 4.6 | 32.5 | GO:0030492 | hemoglobin binding(GO:0030492) |
| 4.6 | 41.3 | GO:0043426 | MRF binding(GO:0043426) |
| 2.9 | 8.6 | GO:0001861 | complement component C4b receptor activity(GO:0001861) complement component C3b receptor activity(GO:0004877) |
| 2.0 | 32.7 | GO:0004028 | 3-chloroallyl aldehyde dehydrogenase activity(GO:0004028) |
| 1.9 | 29.7 | GO:0043024 | ribosomal small subunit binding(GO:0043024) |
| 1.9 | 9.3 | GO:0061649 | ubiquitinated histone binding(GO:0061649) |
| 1.9 | 7.4 | GO:0030107 | HLA-A specific inhibitory MHC class I receptor activity(GO:0030107) |
| 1.9 | 5.6 | GO:0004556 | alpha-amylase activity(GO:0004556) |
| 1.7 | 5.0 | GO:0017129 | triglyceride binding(GO:0017129) |
| 1.5 | 32.1 | GO:0001087 | transcription factor activity, sequence-specific DNA binding, RNA polymerase recruiting(GO:0001011) transcription factor activity, TFIIB-class binding(GO:0001087) |
| 1.4 | 9.7 | GO:0004652 | polynucleotide adenylyltransferase activity(GO:0004652) |
| 1.0 | 17.2 | GO:0005068 | transmembrane receptor protein tyrosine kinase adaptor activity(GO:0005068) |
| 1.0 | 3.0 | GO:0042008 | interleukin-18 receptor activity(GO:0042008) |
| 0.8 | 2.5 | GO:0052796 | exo-alpha-(2->3)-sialidase activity(GO:0052794) exo-alpha-(2->6)-sialidase activity(GO:0052795) exo-alpha-(2->8)-sialidase activity(GO:0052796) |
| 0.8 | 11.4 | GO:0035612 | AP-2 adaptor complex binding(GO:0035612) |
| 0.7 | 2.1 | GO:0004937 | alpha1-adrenergic receptor activity(GO:0004937) |
| 0.7 | 5.6 | GO:0070892 | lipoteichoic acid receptor activity(GO:0070892) |
| 0.7 | 2.0 | GO:0005137 | interleukin-5 receptor binding(GO:0005137) |
| 0.7 | 12.6 | GO:0038191 | neuropilin binding(GO:0038191) |
| 0.6 | 5.8 | GO:0019103 | pyrimidine nucleotide binding(GO:0019103) |
| 0.6 | 13.1 | GO:0008191 | metalloendopeptidase inhibitor activity(GO:0008191) |
| 0.6 | 4.7 | GO:0044323 | retinoic acid-responsive element binding(GO:0044323) |
| 0.6 | 51.0 | GO:0004715 | non-membrane spanning protein tyrosine kinase activity(GO:0004715) |
| 0.6 | 1.7 | GO:0008321 | Ral guanyl-nucleotide exchange factor activity(GO:0008321) |
| 0.5 | 4.2 | GO:0030274 | LIM domain binding(GO:0030274) |
| 0.5 | 3.7 | GO:0004024 | alcohol dehydrogenase activity, zinc-dependent(GO:0004024) |
| 0.5 | 8.7 | GO:0015467 | G-protein activated inward rectifier potassium channel activity(GO:0015467) |
| 0.4 | 13.7 | GO:0016922 | ligand-dependent nuclear receptor binding(GO:0016922) |
| 0.4 | 4.6 | GO:0001730 | 2'-5'-oligoadenylate synthetase activity(GO:0001730) |
| 0.4 | 1.1 | GO:0050567 | glutaminyl-tRNA synthase (glutamine-hydrolyzing) activity(GO:0050567) |
| 0.3 | 1.4 | GO:0008467 | [heparan sulfate]-glucosamine 3-sulfotransferase 1 activity(GO:0008467) |
| 0.3 | 7.4 | GO:0005095 | GTPase inhibitor activity(GO:0005095) |
| 0.3 | 5.5 | GO:0004861 | cyclin-dependent protein serine/threonine kinase inhibitor activity(GO:0004861) |
| 0.3 | 9.0 | GO:0015035 | protein disulfide oxidoreductase activity(GO:0015035) |
| 0.3 | 5.7 | GO:0005522 | profilin binding(GO:0005522) |
| 0.3 | 1.4 | GO:0070097 | delta-catenin binding(GO:0070097) |
| 0.3 | 2.4 | GO:0050682 | AF-2 domain binding(GO:0050682) |
| 0.2 | 2.7 | GO:0004118 | cGMP-stimulated cyclic-nucleotide phosphodiesterase activity(GO:0004118) |
| 0.2 | 11.5 | GO:0005044 | scavenger receptor activity(GO:0005044) |
| 0.2 | 0.7 | GO:0090555 | phosphatidylethanolamine-translocating ATPase activity(GO:0090555) |
| 0.2 | 2.6 | GO:0016174 | NAD(P)H oxidase activity(GO:0016174) |
| 0.2 | 3.3 | GO:0008140 | cAMP response element binding protein binding(GO:0008140) |
| 0.2 | 0.4 | GO:0030375 | thyroid hormone receptor activator activity(GO:0010861) thyroid hormone receptor coactivator activity(GO:0030375) |
| 0.2 | 7.1 | GO:0008066 | glutamate receptor activity(GO:0008066) |
| 0.2 | 4.3 | GO:0005527 | macrolide binding(GO:0005527) FK506 binding(GO:0005528) |
| 0.2 | 5.2 | GO:0043015 | gamma-tubulin binding(GO:0043015) |
| 0.1 | 1.8 | GO:0043855 | intracellular cyclic nucleotide activated cation channel activity(GO:0005221) cyclic nucleotide-gated ion channel activity(GO:0043855) |
| 0.1 | 2.5 | GO:1990380 | Lys48-specific deubiquitinase activity(GO:1990380) |
| 0.1 | 5.8 | GO:0001106 | RNA polymerase II transcription corepressor activity(GO:0001106) |
| 0.1 | 1.5 | GO:0070700 | BMP receptor binding(GO:0070700) |
| 0.1 | 2.2 | GO:0005537 | mannose binding(GO:0005537) |
| 0.1 | 4.2 | GO:0003785 | actin monomer binding(GO:0003785) |
| 0.1 | 2.6 | GO:0008656 | cysteine-type endopeptidase activator activity involved in apoptotic process(GO:0008656) |
| 0.1 | 1.4 | GO:0016493 | C-C chemokine receptor activity(GO:0016493) |
| 0.1 | 0.2 | GO:0052739 | phosphatidylserine 1-acylhydrolase activity(GO:0052739) |
| 0.1 | 2.2 | GO:0005123 | death receptor binding(GO:0005123) |
| 0.1 | 1.4 | GO:0000062 | fatty-acyl-CoA binding(GO:0000062) |
| 0.1 | 0.2 | GO:0004461 | lactose synthase activity(GO:0004461) |
| 0.1 | 6.7 | GO:0001618 | virus receptor activity(GO:0001618) |
| 0.1 | 1.1 | GO:0001968 | fibronectin binding(GO:0001968) |
| 0.1 | 6.1 | GO:0019905 | syntaxin binding(GO:0019905) |
| 0.1 | 1.1 | GO:0008510 | sodium:bicarbonate symporter activity(GO:0008510) |
| 0.1 | 0.7 | GO:0015643 | toxic substance binding(GO:0015643) |
| 0.0 | 9.9 | GO:0004252 | serine-type endopeptidase activity(GO:0004252) |
| 0.0 | 0.4 | GO:1990829 | C-rich single-stranded DNA binding(GO:1990829) |
| 0.0 | 0.6 | GO:0031419 | cobalamin binding(GO:0031419) |
| 0.0 | 2.0 | GO:0004864 | protein phosphatase inhibitor activity(GO:0004864) |
| 0.0 | 3.1 | GO:0004869 | cysteine-type endopeptidase inhibitor activity(GO:0004869) |
| 0.0 | 1.8 | GO:0050699 | WW domain binding(GO:0050699) |
| 0.0 | 2.8 | GO:0046934 | phosphatidylinositol-4,5-bisphosphate 3-kinase activity(GO:0046934) |
| 0.0 | 0.1 | GO:0035877 | death effector domain binding(GO:0035877) cysteine-type endopeptidase activity involved in apoptotic signaling pathway(GO:0097199) |
| 0.0 | 1.0 | GO:0071855 | neuropeptide receptor binding(GO:0071855) |
| 0.0 | 2.9 | GO:0004725 | protein tyrosine phosphatase activity(GO:0004725) |
| 0.0 | 1.2 | GO:0004222 | metalloendopeptidase activity(GO:0004222) |
Gene overrepresentation in curated gene sets: canonical pathways category:
| Log-likelihood per target | Total log-likelihood | Term | Description |
|---|---|---|---|
| 2.5 | 62.1 | PID IL5 PATHWAY | IL5-mediated signaling events |
| 1.2 | 28.0 | PID TCR JNK PATHWAY | JNK signaling in the CD4+ TCR pathway |
| 0.5 | 32.0 | ST B CELL ANTIGEN RECEPTOR | B Cell Antigen Receptor |
| 0.3 | 46.7 | PID PDGFRB PATHWAY | PDGFR-beta signaling pathway |
| 0.2 | 11.0 | ST PHOSPHOINOSITIDE 3 KINASE PATHWAY | PI3K Pathway |
| 0.2 | 8.9 | PID INTEGRIN A9B1 PATHWAY | Alpha9 beta1 integrin signaling events |
| 0.2 | 24.2 | PID AR PATHWAY | Coregulation of Androgen receptor activity |
| 0.2 | 2.6 | SA PROGRAMMED CELL DEATH | Programmed cell death, or apoptosis, eliminates damaged or unneeded cells. |
| 0.1 | 5.2 | SIG BCR SIGNALING PATHWAY | Members of the BCR signaling pathway |
| 0.1 | 5.7 | PID FCER1 PATHWAY | Fc-epsilon receptor I signaling in mast cells |
| 0.1 | 6.5 | PID MTOR 4PATHWAY | mTOR signaling pathway |
| 0.1 | 3.3 | PID NFAT TFPATHWAY | Calcineurin-regulated NFAT-dependent transcription in lymphocytes |
| 0.1 | 3.1 | PID SYNDECAN 2 PATHWAY | Syndecan-2-mediated signaling events |
| 0.1 | 12.6 | NABA ECM AFFILIATED | Genes encoding proteins affiliated structurally or functionally to extracellular matrix proteins |
| 0.1 | 7.8 | WNT SIGNALING | Genes related to Wnt-mediated signal transduction |
| 0.1 | 4.6 | PID ILK PATHWAY | Integrin-linked kinase signaling |
| 0.1 | 2.0 | PID RETINOIC ACID PATHWAY | Retinoic acid receptors-mediated signaling |
| 0.0 | 3.3 | PID IL12 2PATHWAY | IL12-mediated signaling events |
| 0.0 | 1.4 | PID MAPK TRK PATHWAY | Trk receptor signaling mediated by the MAPK pathway |
| 0.0 | 0.6 | PID RHODOPSIN PATHWAY | Visual signal transduction: Rods |
Gene overrepresentation in curated gene sets: REACTOME pathways category:
| Log-likelihood per target | Total log-likelihood | Term | Description |
|---|---|---|---|
| 1.8 | 30.3 | REACTOME PECAM1 INTERACTIONS | Genes involved in PECAM1 interactions |
| 1.1 | 28.0 | REACTOME TRAFFICKING OF GLUR2 CONTAINING AMPA RECEPTORS | Genes involved in Trafficking of GluR2-containing AMPA receptors |
| 0.9 | 10.7 | REACTOME NEGATIVE REGULATION OF THE PI3K AKT NETWORK | Genes involved in Negative regulation of the PI3K/AKT network |
| 0.8 | 19.6 | REACTOME REGULATION OF COMPLEMENT CASCADE | Genes involved in Regulation of Complement cascade |
| 0.7 | 15.0 | REACTOME OTHER SEMAPHORIN INTERACTIONS | Genes involved in Other semaphorin interactions |
| 0.6 | 17.2 | REACTOME REGULATION OF SIGNALING BY CBL | Genes involved in Regulation of signaling by CBL |
| 0.5 | 10.2 | REACTOME ACTIVATION OF IRF3 IRF7 MEDIATED BY TBK1 IKK EPSILON | Genes involved in Activation of IRF3/IRF7 mediated by TBK1/IKK epsilon |
| 0.5 | 5.6 | REACTOME DIGESTION OF DIETARY CARBOHYDRATE | Genes involved in Digestion of dietary carbohydrate |
| 0.4 | 29.7 | REACTOME MYOGENESIS | Genes involved in Myogenesis |
| 0.4 | 5.8 | REACTOME PURINE CATABOLISM | Genes involved in Purine catabolism |
| 0.4 | 7.1 | REACTOME CLASS C 3 METABOTROPIC GLUTAMATE PHEROMONE RECEPTORS | Genes involved in Class C/3 (Metabotropic glutamate/pheromone receptors) |
| 0.3 | 8.2 | REACTOME ANTIGEN ACTIVATES B CELL RECEPTOR LEADING TO GENERATION OF SECOND MESSENGERS | Genes involved in Antigen Activates B Cell Receptor Leading to Generation of Second Messengers |
| 0.3 | 8.7 | REACTOME INHIBITION OF VOLTAGE GATED CA2 CHANNELS VIA GBETA GAMMA SUBUNITS | Genes involved in Inhibition of voltage gated Ca2+ channels via Gbeta/gamma subunits |
| 0.2 | 4.7 | REACTOME EGFR DOWNREGULATION | Genes involved in EGFR downregulation |
| 0.2 | 5.0 | REACTOME CHYLOMICRON MEDIATED LIPID TRANSPORT | Genes involved in Chylomicron-mediated lipid transport |
| 0.2 | 8.0 | REACTOME ACTIVATION OF GENES BY ATF4 | Genes involved in Activation of Genes by ATF4 |
| 0.2 | 3.3 | REACTOME ROLE OF DCC IN REGULATING APOPTOSIS | Genes involved in Role of DCC in regulating apoptosis |
| 0.2 | 27.9 | REACTOME RESPONSE TO ELEVATED PLATELET CYTOSOLIC CA2 | Genes involved in Response to elevated platelet cytosolic Ca2+ |
| 0.1 | 1.9 | REACTOME HDL MEDIATED LIPID TRANSPORT | Genes involved in HDL-mediated lipid transport |
| 0.1 | 5.2 | REACTOME DARPP 32 EVENTS | Genes involved in DARPP-32 events |
| 0.1 | 7.4 | REACTOME IMMUNOREGULATORY INTERACTIONS BETWEEN A LYMPHOID AND A NON LYMPHOID CELL | Genes involved in Immunoregulatory interactions between a Lymphoid and a non-Lymphoid cell |
| 0.1 | 5.2 | REACTOME LOSS OF NLP FROM MITOTIC CENTROSOMES | Genes involved in Loss of Nlp from mitotic centrosomes |
| 0.1 | 6.0 | REACTOME NUCLEAR RECEPTOR TRANSCRIPTION PATHWAY | Genes involved in Nuclear Receptor transcription pathway |
| 0.0 | 4.6 | REACTOME INTERFERON ALPHA BETA SIGNALING | Genes involved in Interferon alpha/beta signaling |
| 0.0 | 2.5 | REACTOME GLYCOSPHINGOLIPID METABOLISM | Genes involved in Glycosphingolipid metabolism |
| 0.0 | 2.2 | REACTOME CGMP EFFECTS | Genes involved in cGMP effects |
| 0.0 | 1.1 | REACTOME IL RECEPTOR SHC SIGNALING | Genes involved in Interleukin receptor SHC signaling |
| 0.0 | 1.4 | REACTOME HS GAG BIOSYNTHESIS | Genes involved in HS-GAG biosynthesis |
| 0.0 | 1.9 | REACTOME AMINE LIGAND BINDING RECEPTORS | Genes involved in Amine ligand-binding receptors |
| 0.0 | 3.1 | REACTOME CLASS B 2 SECRETIN FAMILY RECEPTORS | Genes involved in Class B/2 (Secretin family receptors) |
| 0.0 | 4.0 | REACTOME INTEGRATION OF ENERGY METABOLISM | Genes involved in Integration of energy metabolism |
| 0.0 | 1.2 | REACTOME INTRINSIC PATHWAY FOR APOPTOSIS | Genes involved in Intrinsic Pathway for Apoptosis |
| 0.0 | 0.7 | REACTOME ABC FAMILY PROTEINS MEDIATED TRANSPORT | Genes involved in ABC-family proteins mediated transport |