Project
GNF SymAtlas + NCI-60 cancer cell lines, human (Su, 2004; Ross, 2000)
Navigation
Downloads
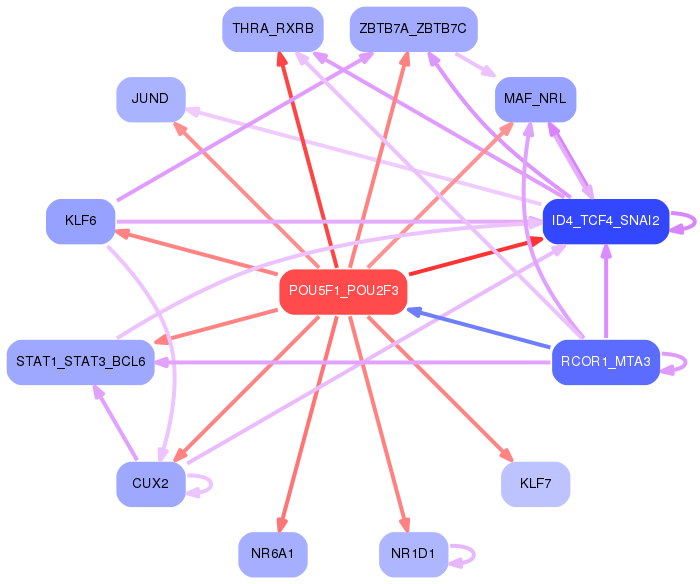
Results for POU5F1_POU2F3
Z-value: 3.26
Motif logo
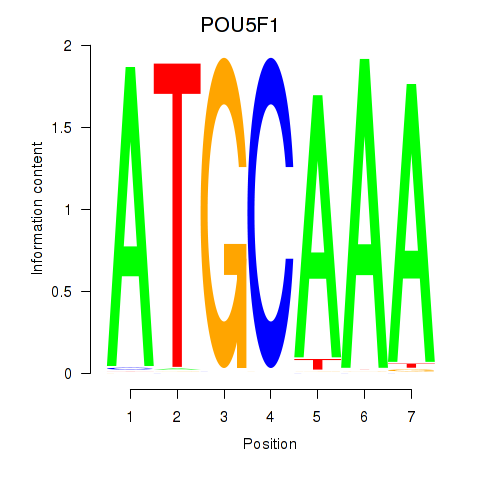
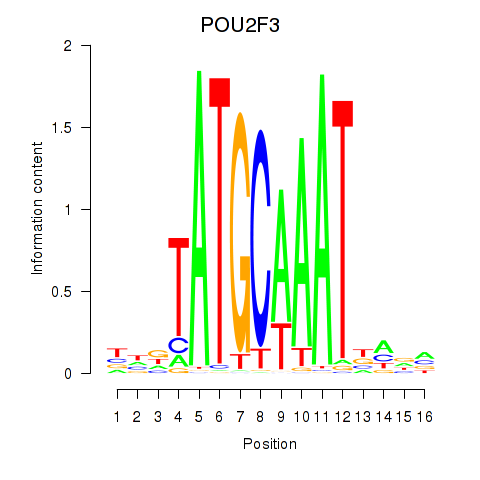
Transcription factors associated with POU5F1_POU2F3
| Gene Symbol | Gene ID | Gene Info |
|---|---|---|
|
POU5F1
|
ENSG00000204531.20 | POU5F1 |
|
POU2F3
|
ENSG00000137709.10 | POU2F3 |
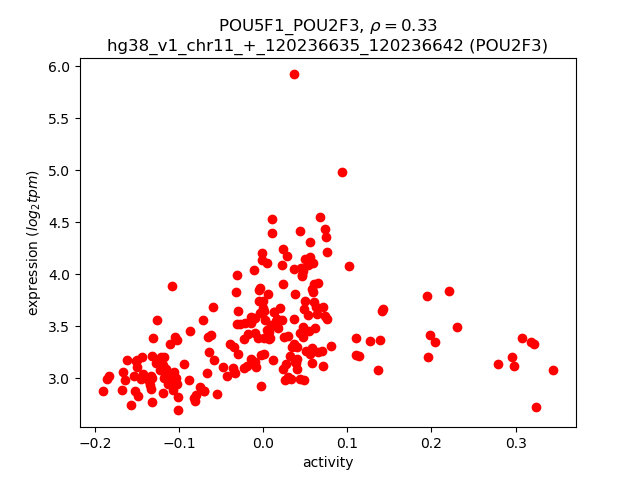
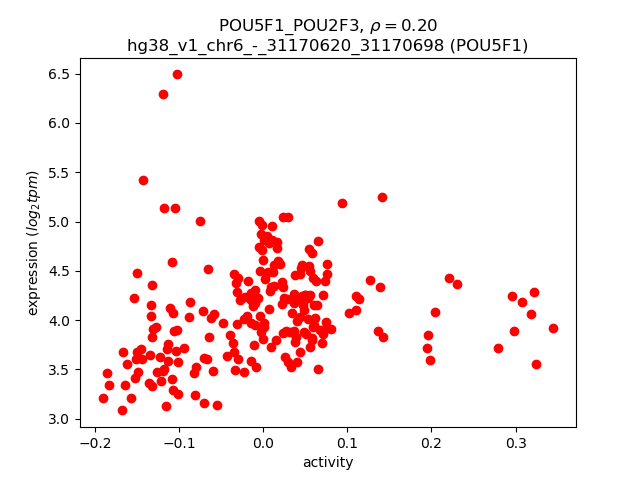
Activity-expression correlation:
| Gene | Promoter | Pearson corr. coef. | P-value | Plot |
|---|---|---|---|---|
| POU2F3 | hg38_v1_chr11_+_120236635_120236642, hg38_v1_chr11_+_120240135_120240199 | 0.33 | 6.7e-07 | Click! |
| POU5F1 | hg38_v1_chr6_-_31170620_31170698 | 0.20 | 3.3e-03 | Click! |
Activity profile of POU5F1_POU2F3 motif
Sorted Z-values of POU5F1_POU2F3 motif
Network of associatons between targets according to the STRING database.

First level regulatory network of POU5F1_POU2F3
| Promoter | Score | Transcript | Gene | Gene Info |
|---|---|---|---|---|
| chr2_-_89100352 | 92.63 |
ENST00000479981.1
|
IGKV1-16
|
immunoglobulin kappa variable 1-16 |
| chr2_+_90100235 | 90.54 |
ENST00000492446.1
|
IGKV1D-16
|
immunoglobulin kappa variable 1D-16 |
| chr2_+_90021567 | 86.69 |
ENST00000436451.2
|
IGKV6D-21
|
immunoglobulin kappa variable 6D-21 (non-functional) |
| chr2_+_90209873 | 86.58 |
ENST00000468879.1
|
IGKV1D-43
|
immunoglobulin kappa variable 1D-43 |
| chr2_-_88992903 | 85.21 |
ENST00000495489.1
|
IGKV1-8
|
immunoglobulin kappa variable 1-8 |
| chr2_+_90159840 | 83.58 |
ENST00000377032.5
|
IGKV1D-12
|
immunoglobulin kappa variable 1D-12 |
| chr2_-_89160329 | 80.22 |
ENST00000390256.2
|
IGKV6-21
|
immunoglobulin kappa variable 6-21 (non-functional) |
| chr14_-_106593319 | 76.92 |
ENST00000390627.3
|
IGHV3-53
|
immunoglobulin heavy variable 3-53 |
| chr2_-_89040745 | 76.61 |
ENST00000480492.1
|
IGKV1-12
|
immunoglobulin kappa variable 1-12 |
| chr2_+_90069662 | 75.64 |
ENST00000390271.2
|
IGKV6D-41
|
immunoglobulin kappa variable 6D-41 (non-functional) |
| chr2_+_90038848 | 73.85 |
ENST00000390270.2
|
IGKV3D-20
|
immunoglobulin kappa variable 3D-20 |
| chr14_-_106117159 | 70.62 |
ENST00000390601.3
|
IGHV3-11
|
immunoglobulin heavy variable 3-11 |
| chr2_+_90082635 | 69.71 |
ENST00000483379.1
|
IGKV1D-17
|
immunoglobulin kappa variable 1D-17 |
| chr22_+_22758698 | 67.59 |
ENST00000390312.2
|
IGLV2-14
|
immunoglobulin lambda variable 2-14 |
| chr2_-_89245596 | 66.02 |
ENST00000468494.1
|
IGKV2-30
|
immunoglobulin kappa variable 2-30 |
| chr1_+_228458095 | 64.52 |
ENST00000620438.1
|
H2BU1
|
H2B.U histone 1 |
| chr2_+_89936859 | 63.94 |
ENST00000474213.1
|
IGKV2D-30
|
immunoglobulin kappa variable 2D-30 |
| chr2_+_89959979 | 61.58 |
ENST00000453166.2
|
IGKV2D-28
|
immunoglobulin kappa variable 2D-28 |
| chr14_-_106675544 | 60.19 |
ENST00000390632.2
|
IGHV3-66
|
immunoglobulin heavy variable 3-66 |
| chr22_+_22357739 | 60.10 |
ENST00000390294.2
|
IGLV1-47
|
immunoglobulin lambda variable 1-47 |
| chr14_-_106277039 | 59.69 |
ENST00000390610.2
|
IGHV1-24
|
immunoglobulin heavy variable 1-24 |
| chr22_+_22734577 | 58.18 |
ENST00000390310.3
|
IGLV2-18
|
immunoglobulin lambda variable 2-18 |
| chr22_+_22431949 | 55.85 |
ENST00000390301.3
|
IGLV1-36
|
immunoglobulin lambda variable 1-36 |
| chr14_-_106470788 | 55.60 |
ENST00000434710.1
|
IGHV3-43
|
immunoglobulin heavy variable 3-43 |
| chr21_-_10649835 | 53.19 |
ENST00000622028.1
|
IGHV1OR21-1
|
immunoglobulin heavy variable 1/OR21-1 (non-functional) |
| chr2_+_89851723 | 52.21 |
ENST00000429992.2
|
IGKV2D-40
|
immunoglobulin kappa variable 2D-40 |
| chr2_+_89884740 | 51.93 |
ENST00000509129.1
|
IGKV1D-37
|
immunoglobulin kappa variable 1D-37 (non-functional) |
| chr2_-_89143133 | 51.28 |
ENST00000492167.1
|
IGKV3-20
|
immunoglobulin kappa variable 3-20 |
| chr2_+_90114838 | 50.78 |
ENST00000417279.3
|
IGKV3D-15
|
immunoglobulin kappa variable 3D-15 |
| chr4_-_70666492 | 49.25 |
ENST00000254801.9
ENST00000391614.7 |
JCHAIN
|
joining chain of multimeric IgA and IgM |
| chr2_+_89947508 | 48.55 |
ENST00000491977.1
|
IGKV2D-29
|
immunoglobulin kappa variable 2D-29 |
| chr2_+_89913982 | 47.75 |
ENST00000390265.2
|
IGKV1D-33
|
immunoglobulin kappa variable 1D-33 |
| chr14_-_106012390 | 47.03 |
ENST00000455737.2
|
IGHV4-4
|
immunoglobulin heavy variable 4-4 |
| chr22_+_22720615 | 46.80 |
ENST00000390309.2
|
IGLV3-19
|
immunoglobulin lambda variable 3-19 |
| chr2_-_89268506 | 45.79 |
ENST00000473726.1
|
IGKV1-33
|
immunoglobulin kappa variable 1-33 |
| chr2_+_90154073 | 45.60 |
ENST00000611391.1
|
IGKV1D-13
|
immunoglobulin kappa variable 1D-13 |
| chr2_-_89320146 | 45.44 |
ENST00000498574.1
|
IGKV1-39
|
immunoglobulin kappa variable 1-39 |
| chr15_-_21742799 | 44.31 |
ENST00000622410.2
|
ENSG00000278263.2
|
novel protein, identical to IGHV4-4 |
| chr14_-_106658251 | 44.05 |
ENST00000454421.2
|
IGHV3-64
|
immunoglobulin heavy variable 3-64 |
| chr2_-_89222461 | 43.60 |
ENST00000482769.1
|
IGKV2-28
|
immunoglobulin kappa variable 2-28 |
| chr22_+_22822658 | 43.06 |
ENST00000620395.2
|
IGLV2-8
|
immunoglobulin lambda variable 2-8 |
| chr16_+_33802683 | 43.04 |
ENST00000570121.2
|
IGHV3OR16-12
|
immunoglobulin heavy variable 3/OR16-12 (non-functional) |
| chr2_-_89297785 | 42.70 |
ENST00000465170.1
|
IGKV1-37
|
immunoglobulin kappa variable 1-37 (non-functional) |
| chrX_-_107775951 | 42.47 |
ENST00000315660.8
ENST00000372384.6 ENST00000502650.1 ENST00000506724.1 |
TSC22D3
|
TSC22 domain family member 3 |
| chr16_+_23835946 | 42.35 |
ENST00000321728.12
ENST00000643927.1 |
PRKCB
|
protein kinase C beta |
| chr14_-_106622837 | 42.06 |
ENST00000390628.3
|
IGHV1-58
|
immunoglobulin heavy variable 1-58 |
| chr22_+_22792485 | 41.43 |
ENST00000390314.2
|
IGLV2-11
|
immunoglobulin lambda variable 2-11 |
| chr14_-_106088573 | 41.39 |
ENST00000632099.1
|
IGHV3-64D
|
immunoglobulin heavy variable 3-64D |
| chrX_-_107717054 | 40.72 |
ENST00000503515.1
ENST00000372397.6 |
TSC22D3
|
TSC22 domain family member 3 |
| chr7_-_100586119 | 40.71 |
ENST00000310300.11
|
LRCH4
|
leucine rich repeats and calponin homology domain containing 4 |
| chr14_-_106538331 | 40.56 |
ENST00000390624.3
|
IGHV3-48
|
immunoglobulin heavy variable 3-48 |
| chr2_-_88947820 | 40.36 |
ENST00000496168.1
|
IGKV1-5
|
immunoglobulin kappa variable 1-5 |
| chr16_+_32066065 | 39.96 |
ENST00000354689.6
|
IGHV3OR16-9
|
immunoglobulin heavy variable 3/OR16-9 (non-functional) |
| chr14_-_106715166 | 38.93 |
ENST00000390633.2
|
IGHV1-69
|
immunoglobulin heavy variable 1-69 |
| chr11_-_5227063 | 38.62 |
ENST00000335295.4
ENST00000485743.1 ENST00000647020.1 |
HBB
|
hemoglobin subunit beta |
| chr22_+_22697789 | 38.31 |
ENST00000390306.2
|
IGLV2-23
|
immunoglobulin lambda variable 2-23 |
| chr14_-_106762576 | 37.69 |
ENST00000624687.1
|
IGHV1-69D
|
immunoglobulin heavy variable 1-69D |
| chr2_+_87338511 | 36.77 |
ENST00000421835.2
|
IGKV3OR2-268
|
immunoglobulin kappa variable 3/OR2-268 (non-functional) |
| chr2_-_89213917 | 36.64 |
ENST00000498435.1
|
IGKV1-27
|
immunoglobulin kappa variable 1-27 |
| chr2_-_88857582 | 35.87 |
ENST00000390237.2
|
IGKC
|
immunoglobulin kappa constant |
| chr10_-_96271508 | 35.61 |
ENST00000427367.6
ENST00000413476.6 ENST00000371176.6 |
BLNK
|
B cell linker |
| chr14_-_105987068 | 35.53 |
ENST00000390594.3
|
IGHV1-2
|
immunoglobulin heavy variable 1-2 |
| chr15_-_19988117 | 35.43 |
ENST00000558565.2
|
IGHV3OR15-7
|
immunoglobulin heavy variable 3/OR15-7 (pseudogene) |
| chr2_+_89862438 | 34.84 |
ENST00000448155.2
|
IGKV1D-39
|
immunoglobulin kappa variable 1D-39 |
| chr2_-_88979016 | 34.08 |
ENST00000390247.2
|
IGKV3-7
|
immunoglobulin kappa variable 3-7 (non-functional) |
| chr2_+_90234809 | 34.04 |
ENST00000443397.5
|
IGKV3D-7
|
immunoglobulin kappa variable 3D-7 |
| chr14_-_106389858 | 33.97 |
ENST00000390617.2
|
IGHV3-35
|
immunoglobulin heavy variable 3-35 (non-functional) |
| chr12_-_91180365 | 33.54 |
ENST00000547937.5
|
DCN
|
decorin |
| chr6_-_32589833 | 33.29 |
ENST00000360004.5
|
HLA-DRB1
|
major histocompatibility complex, class II, DR beta 1 |
| chr4_+_40192949 | 32.84 |
ENST00000507851.5
ENST00000615577.4 ENST00000613272.4 |
RHOH
|
ras homolog family member H |
| chr16_+_33009175 | 32.69 |
ENST00000565407.2
|
IGHV3OR16-8
|
immunoglobulin heavy variable 3/OR16-8 (non-functional) |
| chr1_-_149886652 | 32.52 |
ENST00000369155.3
|
H2BC21
|
H2B clustered histone 21 |
| chr14_-_106025628 | 32.32 |
ENST00000631943.1
|
IGHV7-4-1
|
immunoglobulin heavy variable 7-4-1 |
| chr2_+_88885397 | 32.28 |
ENST00000390243.2
|
IGKV4-1
|
immunoglobulin kappa variable 4-1 |
| chr2_-_89117844 | 32.07 |
ENST00000490686.1
|
IGKV1-17
|
immunoglobulin kappa variable 1-17 |
| chr22_+_22594528 | 31.51 |
ENST00000390303.3
|
IGLV3-32
|
immunoglobulin lambda variable 3-32 (non-functional) |
| chr2_+_113406368 | 30.95 |
ENST00000453673.3
|
IGKV1OR2-108
|
immunoglobulin kappa variable 1/OR2-108 (non-functional) |
| chr3_+_186930759 | 30.66 |
ENST00000677292.1
ENST00000458216.5 |
ST6GAL1
|
ST6 beta-galactoside alpha-2,6-sialyltransferase 1 |
| chr2_+_90172802 | 30.34 |
ENST00000390277.3
|
IGKV3D-11
|
immunoglobulin kappa variable 3D-11 |
| chr1_-_204411804 | 29.20 |
ENST00000367188.5
|
PPP1R15B
|
protein phosphatase 1 regulatory subunit 15B |
| chr22_+_22747383 | 29.15 |
ENST00000390311.3
|
IGLV3-16
|
immunoglobulin lambda variable 3-16 |
| chr12_-_91179355 | 29.04 |
ENST00000550563.5
ENST00000546370.5 |
DCN
|
decorin |
| chr14_-_106154113 | 28.85 |
ENST00000390603.2
|
IGHV3-15
|
immunoglobulin heavy variable 3-15 |
| chr2_-_88966767 | 28.31 |
ENST00000464162.1
|
IGKV1-6
|
immunoglobulin kappa variable 1-6 |
| chr1_-_153390976 | 28.15 |
ENST00000368732.5
ENST00000368733.4 |
S100A8
|
S100 calcium binding protein A8 |
| chr2_-_89085787 | 27.20 |
ENST00000390252.2
|
IGKV3-15
|
immunoglobulin kappa variable 3-15 |
| chr14_-_106374129 | 27.14 |
ENST00000390616.2
|
IGHV4-34
|
immunoglobulin heavy variable 4-34 |
| chr6_+_37170133 | 26.32 |
ENST00000373509.6
|
PIM1
|
Pim-1 proto-oncogene, serine/threonine kinase |
| chr22_+_22686724 | 26.07 |
ENST00000390305.2
|
IGLV3-25
|
immunoglobulin lambda variable 3-25 |
| chr6_-_107824294 | 25.82 |
ENST00000369020.8
ENST00000369022.6 |
SCML4
|
Scm polycomb group protein like 4 |
| chr22_+_22409755 | 25.81 |
ENST00000390299.2
|
IGLV1-40
|
immunoglobulin lambda variable 1-40 |
| chr17_-_49764123 | 25.57 |
ENST00000240364.7
ENST00000506156.1 |
FAM117A
|
family with sequence similarity 117 member A |
| chr6_-_32816910 | 25.54 |
ENST00000447394.1
ENST00000438763.7 |
HLA-DOB
|
major histocompatibility complex, class II, DO beta |
| chr1_+_5992639 | 25.37 |
ENST00000666163.1
ENST00000671676.1 ENST00000658883.1 ENST00000445501.6 ENST00000668706.1 ENST00000653262.1 ENST00000389632.9 ENST00000341524.6 ENST00000462676.3 |
KCNAB2
|
potassium voltage-gated channel subfamily A regulatory beta subunit 2 |
| chr3_+_186930518 | 25.28 |
ENST00000169298.8
ENST00000457772.6 ENST00000455441.5 ENST00000427315.5 |
ST6GAL1
|
ST6 beta-galactoside alpha-2,6-sialyltransferase 1 |
| chr14_-_106627685 | 25.04 |
ENST00000390629.3
|
IGHV4-59
|
immunoglobulin heavy variable 4-59 |
| chr19_+_19033575 | 24.92 |
ENST00000392335.6
ENST00000537263.5 ENST00000540707.5 ENST00000535612.6 ENST00000541725.5 ENST00000269932.10 ENST00000546344.5 ENST00000540792.5 ENST00000536098.5 ENST00000541898.5 |
ARMC6
|
armadillo repeat containing 6 |
| chr19_+_21020675 | 24.75 |
ENST00000595401.1
|
ZNF430
|
zinc finger protein 430 |
| chr19_-_19033480 | 24.30 |
ENST00000452918.7
ENST00000600377.1 ENST00000337018.10 |
SUGP2
|
SURP and G-patch domain containing 2 |
| chr18_-_55422492 | 24.13 |
ENST00000561992.5
ENST00000630712.2 |
TCF4
|
transcription factor 4 |
| chr18_-_55401751 | 24.05 |
ENST00000537856.7
|
TCF4
|
transcription factor 4 |
| chr18_-_55589795 | 23.58 |
ENST00000568740.5
ENST00000629387.2 |
TCF4
|
transcription factor 4 |
| chr17_-_63932261 | 23.53 |
ENST00000349817.2
ENST00000006750.8 ENST00000392795.7 |
CD79B
|
CD79b molecule |
| chr19_-_1021114 | 23.37 |
ENST00000333175.9
ENST00000356663.8 |
TMEM259
|
transmembrane protein 259 |
| chr18_-_55322215 | 23.13 |
ENST00000457482.7
|
TCF4
|
transcription factor 4 |
| chr16_+_32995048 | 23.11 |
ENST00000425181.3
|
IGHV3OR16-10
|
immunoglobulin heavy variable 3/OR16-10 (non-functional) |
| chr18_+_44680093 | 22.83 |
ENST00000426838.8
ENST00000677068.1 |
SETBP1
|
SET binding protein 1 |
| chr18_-_55588535 | 22.76 |
ENST00000566286.5
ENST00000566279.5 ENST00000626595.2 ENST00000564999.5 ENST00000616053.4 ENST00000356073.8 |
TCF4
|
transcription factor 4 |
| chr18_-_55321986 | 22.73 |
ENST00000570287.6
|
TCF4
|
transcription factor 4 |
| chr22_+_22818994 | 22.54 |
ENST00000390316.2
|
IGLV3-9
|
immunoglobulin lambda variable 3-9 |
| chr8_-_133102477 | 22.47 |
ENST00000522119.5
ENST00000523610.5 ENST00000338087.10 ENST00000521302.5 ENST00000519558.5 ENST00000519747.5 ENST00000517648.5 |
SLA
|
Src like adaptor |
| chr7_-_36985060 | 22.46 |
ENST00000396040.6
|
ELMO1
|
engulfment and cell motility 1 |
| chr16_-_33845229 | 22.07 |
ENST00000569103.2
|
IGHV3OR16-17
|
immunoglobulin heavy variable 3/OR16-17 (non-functional) |
| chr18_-_55589836 | 21.86 |
ENST00000537578.5
ENST00000564403.6 |
TCF4
|
transcription factor 4 |
| chr18_-_55589770 | 21.53 |
ENST00000565018.6
ENST00000636400.2 |
TCF4
|
transcription factor 4 |
| chr17_+_40062810 | 21.40 |
ENST00000584985.5
ENST00000264637.8 |
THRA
|
thyroid hormone receptor alpha |
| chr22_+_22380766 | 21.28 |
ENST00000390297.3
|
IGLV1-44
|
immunoglobulin lambda variable 1-44 |
| chr11_-_62601818 | 21.27 |
ENST00000278823.7
|
MTA2
|
metastasis associated 1 family member 2 |
| chr17_+_7650916 | 21.02 |
ENST00000250111.9
|
ATP1B2
|
ATPase Na+/K+ transporting subunit beta 2 |
| chr5_-_172771187 | 20.72 |
ENST00000239223.4
|
DUSP1
|
dual specificity phosphatase 1 |
| chr18_-_55321640 | 20.16 |
ENST00000637169.2
|
TCF4
|
transcription factor 4 |
| chr22_-_23754376 | 20.14 |
ENST00000398465.3
ENST00000248948.4 |
VPREB3
|
V-set pre-B cell surrogate light chain 3 |
| chr12_-_91182652 | 20.07 |
ENST00000552145.5
ENST00000546745.5 |
DCN
|
decorin |
| chr19_-_38617912 | 20.01 |
ENST00000591517.5
|
MAP4K1
|
mitogen-activated protein kinase kinase kinase kinase 1 |
| chr15_-_19965101 | 19.93 |
ENST00000338912.5
|
IGHV1OR15-9
|
immunoglobulin heavy variable 1/OR15-9 (non-functional) |
| chr22_+_22704265 | 19.86 |
ENST00000390307.2
|
IGLV3-22
|
immunoglobulin lambda variable 3-22 |
| chr8_-_133102874 | 19.75 |
ENST00000395352.7
|
SLA
|
Src like adaptor |
| chr19_+_52269579 | 19.61 |
ENST00000593703.1
ENST00000439461.6 ENST00000601711.5 ENST00000599581.5 |
ZNF766
|
zinc finger protein 766 |
| chr7_-_130440848 | 19.51 |
ENST00000675803.1
ENST00000223208.10 ENST00000343969.10 ENST00000471201.6 ENST00000675649.1 ENST00000675168.1 ENST00000469826.2 ENST00000334451.6 ENST00000675962.1 ENST00000675563.1 ENST00000480206.2 ENST00000489512.5 ENST00000676243.1 ENST00000674539.1 ENST00000675935.1 |
CEP41
|
centrosomal protein 41 |
| chr12_-_7092422 | 19.43 |
ENST00000543835.5
ENST00000647956.2 ENST00000535233.6 |
C1R
|
complement C1r |
| chr1_+_156150008 | 19.31 |
ENST00000355014.6
|
SEMA4A
|
semaphorin 4A |
| chr2_-_89010515 | 18.94 |
ENST00000493819.1
|
IGKV1-9
|
immunoglobulin kappa variable 1-9 |
| chrX_-_13817027 | 18.86 |
ENST00000493677.5
ENST00000355135.6 ENST00000316715.9 |
GPM6B
|
glycoprotein M6B |
| chr6_-_159000174 | 18.86 |
ENST00000367069.7
|
RSPH3
|
radial spoke head 3 |
| chr18_-_55588184 | 18.85 |
ENST00000354452.8
ENST00000565908.6 ENST00000635822.2 |
TCF4
|
transcription factor 4 |
| chr22_-_18936142 | 18.74 |
ENST00000438924.5
ENST00000457083.1 ENST00000357068.11 ENST00000420436.5 ENST00000334029.6 ENST00000610940.4 |
PRODH
|
proline dehydrogenase 1 |
| chr14_-_106811131 | 18.65 |
ENST00000424969.2
|
IGHV3-74
|
immunoglobulin heavy variable 3-74 |
| chr14_-_106411021 | 18.55 |
ENST00000390618.2
|
IGHV3-38
|
immunoglobulin heavy variable 3-38 (non-functional) |
| chr18_+_44680875 | 18.36 |
ENST00000649279.2
ENST00000677699.1 |
SETBP1
|
SET binding protein 1 |
| chr20_+_35968566 | 18.25 |
ENST00000373973.7
ENST00000349339.5 ENST00000489667.1 ENST00000538900.1 |
CNBD2
|
cyclic nucleotide binding domain containing 2 |
| chr14_-_106360320 | 18.12 |
ENST00000390615.2
|
IGHV3-33
|
immunoglobulin heavy variable 3-33 |
| chr12_-_91182784 | 18.07 |
ENST00000547568.6
ENST00000052754.10 ENST00000552962.5 |
DCN
|
decorin |
| chr16_+_90022600 | 17.73 |
ENST00000620723.4
ENST00000268699.9 |
GAS8
|
growth arrest specific 8 |
| chr14_-_106165730 | 17.68 |
ENST00000390604.2
|
IGHV3-16
|
immunoglobulin heavy variable 3-16 (non-functional) |
| chr22_+_22811737 | 17.53 |
ENST00000390315.3
|
IGLV3-10
|
immunoglobulin lambda variable 3-10 |
| chr17_-_75779758 | 17.53 |
ENST00000592643.5
ENST00000591890.5 ENST00000587171.1 ENST00000254810.8 ENST00000589599.5 |
H3-3B
|
H3.3 histone B |
| chr1_-_30757767 | 17.04 |
ENST00000294507.4
|
LAPTM5
|
lysosomal protein transmembrane 5 |
| chr7_+_100586304 | 16.97 |
ENST00000241071.11
|
FBXO24
|
F-box protein 24 |
| chr14_-_106422175 | 16.91 |
ENST00000390619.2
|
IGHV4-39
|
immunoglobulin heavy variable 4-39 |
| chr1_+_192809031 | 16.63 |
ENST00000235382.7
|
RGS2
|
regulator of G protein signaling 2 |
| chr12_+_25052634 | 16.47 |
ENST00000548766.5
|
IRAG2
|
inositol 1,4,5-triphosphate receptor associated 2 |
| chr19_-_38617928 | 16.44 |
ENST00000396857.7
ENST00000586296.5 |
MAP4K1
|
mitogen-activated protein kinase kinase kinase kinase 1 |
| chr12_+_25052512 | 16.34 |
ENST00000557489.5
ENST00000354454.7 ENST00000536173.5 |
IRAG2
|
inositol 1,4,5-triphosphate receptor associated 2 |
| chr18_+_44700796 | 15.99 |
ENST00000677130.1
|
SETBP1
|
SET binding protein 1 |
| chr14_-_106062670 | 15.98 |
ENST00000390598.2
|
IGHV3-7
|
immunoglobulin heavy variable 3-7 |
| chr9_-_35618367 | 15.95 |
ENST00000378431.5
ENST00000378430.3 ENST00000259633.9 |
CD72
|
CD72 molecule |
| chr18_-_55351977 | 15.93 |
ENST00000643689.1
|
TCF4
|
transcription factor 4 |
| chr12_-_6663136 | 15.84 |
ENST00000396807.8
ENST00000619641.4 ENST00000446105.6 |
ING4
|
inhibitor of growth family member 4 |
| chr14_-_106639589 | 15.80 |
ENST00000390630.3
|
IGHV4-61
|
immunoglobulin heavy variable 4-61 |
| chr19_-_52786742 | 15.67 |
ENST00000338230.3
ENST00000648973.1 |
ZNF600
|
zinc finger protein 600 |
| chr19_-_893172 | 15.48 |
ENST00000325464.6
ENST00000312090.10 |
MED16
|
mediator complex subunit 16 |
| chr22_+_39994926 | 15.43 |
ENST00000333407.11
|
FAM83F
|
family with sequence similarity 83 member F |
| chr13_-_76886397 | 15.38 |
ENST00000377474.4
|
KCTD12
|
potassium channel tetramerization domain containing 12 |
| chr13_-_99307387 | 15.20 |
ENST00000376414.5
|
GPR183
|
G protein-coupled receptor 183 |
| chr12_-_16600703 | 15.20 |
ENST00000616247.4
|
LMO3
|
LIM domain only 3 |
| chr9_-_34691204 | 15.16 |
ENST00000378800.3
ENST00000311925.7 |
CCL19
|
C-C motif chemokine ligand 19 |
| chr12_-_122716790 | 15.12 |
ENST00000528880.3
|
HCAR3
|
hydroxycarboxylic acid receptor 3 |
| chr12_-_16608073 | 15.07 |
ENST00000441439.6
|
LMO3
|
LIM domain only 3 |
| chr7_-_77199808 | 15.03 |
ENST00000248598.6
|
FGL2
|
fibrinogen like 2 |
| chr12_+_25052732 | 15.02 |
ENST00000547044.5
|
IRAG2
|
inositol 1,4,5-triphosphate receptor associated 2 |
| chr8_+_55879818 | 14.81 |
ENST00000520220.6
ENST00000519728.6 |
LYN
|
LYN proto-oncogene, Src family tyrosine kinase |
| chr12_-_91179517 | 14.71 |
ENST00000551354.1
|
DCN
|
decorin |
| chr19_+_35329161 | 14.51 |
ENST00000341773.10
ENST00000600131.5 ENST00000595780.5 ENST00000597916.5 ENST00000593867.5 ENST00000600424.5 ENST00000599811.5 ENST00000536635.6 ENST00000085219.10 ENST00000544992.6 ENST00000419549.6 |
CD22
|
CD22 molecule |
| chr12_-_6663083 | 14.50 |
ENST00000467678.5
ENST00000493873.1 ENST00000412586.6 ENST00000423703.6 ENST00000444704.5 ENST00000341550.9 |
ING4
|
inhibitor of growth family member 4 |
| chr15_-_22185402 | 14.50 |
ENST00000557788.2
|
IGHV4OR15-8
|
immunoglobulin heavy variable 4/OR15-8 (non-functional) |
| chr8_+_19939246 | 14.47 |
ENST00000650287.1
|
LPL
|
lipoprotein lipase |
| chr12_-_91179472 | 14.44 |
ENST00000550099.5
ENST00000546391.5 |
DCN
|
decorin |
| chr11_-_64744102 | 14.44 |
ENST00000431822.5
ENST00000394432.8 ENST00000377486.7 |
RASGRP2
|
RAS guanyl releasing protein 2 |
| chr12_-_16608183 | 14.24 |
ENST00000354662.5
ENST00000538051.5 |
LMO3
|
LIM domain only 3 |
| chr6_-_152636855 | 14.13 |
ENST00000367248.7
ENST00000423061.6 |
SYNE1
|
spectrin repeat containing nuclear envelope protein 1 |
| chr9_-_124771304 | 13.91 |
ENST00000416460.6
ENST00000487099.7 |
NR6A1
|
nuclear receptor subfamily 6 group A member 1 |
| chrX_-_40647509 | 13.51 |
ENST00000378421.1
ENST00000378426.5 ENST00000327877.10 |
CXorf38
|
chromosome X open reading frame 38 |
| chr5_+_50665899 | 13.50 |
ENST00000505697.6
|
PARP8
|
poly(ADP-ribose) polymerase family member 8 |
| chr2_-_50347789 | 13.34 |
ENST00000628364.2
|
NRXN1
|
neurexin 1 |
| chr1_+_103655760 | 13.28 |
ENST00000370083.9
|
AMY1A
|
amylase alpha 1A |
| chr1_+_92080305 | 13.26 |
ENST00000342818.4
ENST00000636805.2 |
BTBD8
|
BTB domain containing 8 |
| chrX_-_13817346 | 13.25 |
ENST00000356942.9
|
GPM6B
|
glycoprotein M6B |
| chr6_-_24877262 | 13.09 |
ENST00000378023.8
ENST00000540914.5 |
RIPOR2
|
RHO family interacting cell polarization regulator 2 |
| chr10_-_96271553 | 13.08 |
ENST00000224337.10
|
BLNK
|
B cell linker |
| chr1_+_32200587 | 13.06 |
ENST00000373602.10
ENST00000421922.6 ENST00000681230.1 |
CCDC28B
|
coiled-coil domain containing 28B |
| chr15_-_88256139 | 13.05 |
ENST00000626019.2
|
NTRK3
|
neurotrophic receptor tyrosine kinase 3 |
| chr2_+_68365274 | 13.01 |
ENST00000234313.8
|
PLEK
|
pleckstrin |
| chr18_-_55402187 | 12.77 |
ENST00000630268.2
ENST00000570177.6 |
TCF4
|
transcription factor 4 |
| chr22_-_42614871 | 12.69 |
ENST00000252115.10
|
POLDIP3
|
DNA polymerase delta interacting protein 3 |
| chr19_+_53333731 | 12.64 |
ENST00000595091.6
ENST00000458035.3 |
ZNF845
|
zinc finger protein 845 |
| chr16_+_58249910 | 12.55 |
ENST00000219299.8
ENST00000443128.6 ENST00000616795.1 |
CCDC113
|
coiled-coil domain containing 113 |
| chr12_-_11269696 | 12.49 |
ENST00000381842.7
|
PRB3
|
proline rich protein BstNI subfamily 3 |
| chr1_-_100249815 | 12.47 |
ENST00000370131.3
ENST00000681617.1 ENST00000681780.1 ENST00000370132.8 |
DBT
|
dihydrolipoamide branched chain transacylase E2 |
| chr14_-_106557465 | 12.42 |
ENST00000390625.3
|
IGHV3-49
|
immunoglobulin heavy variable 3-49 |
| chr6_-_137219340 | 12.40 |
ENST00000367739.9
ENST00000458076.5 ENST00000414770.5 |
IFNGR1
|
interferon gamma receptor 1 |
Gene Ontology Analysis
Gene overrepresentation in biological process category:
| Log-likelihood per target | Total log-likelihood | Term | Description |
|---|---|---|---|
| 17.7 | 2615.3 | GO:0006958 | complement activation, classical pathway(GO:0006958) |
| 12.9 | 38.6 | GO:0030185 | nitric oxide transport(GO:0030185) |
| 11.4 | 57.2 | GO:0050861 | positive regulation of B cell receptor signaling pathway(GO:0050861) |
| 10.9 | 32.7 | GO:0052026 | modulation by virus of host transcription(GO:0019056) positive regulation of sprouting of injured axon(GO:0048687) positive regulation of axon extension involved in regeneration(GO:0048691) modulation by symbiont of host transcription(GO:0052026) |
| 10.4 | 83.2 | GO:0070235 | regulation of activation-induced cell death of T cells(GO:0070235) negative regulation of activation-induced cell death of T cells(GO:0070236) |
| 10.0 | 129.9 | GO:1900747 | negative regulation of vascular endothelial growth factor signaling pathway(GO:1900747) |
| 8.5 | 25.5 | GO:0002581 | negative regulation of antigen processing and presentation of peptide or polysaccharide antigen via MHC class II(GO:0002581) |
| 8.3 | 33.3 | GO:0002399 | MHC class II protein complex assembly(GO:0002399) |
| 7.0 | 49.3 | GO:0060267 | positive regulation of respiratory burst(GO:0060267) |
| 7.0 | 21.0 | GO:1903288 | positive regulation of potassium ion import(GO:1903288) |
| 6.4 | 44.5 | GO:2000324 | positive regulation of glucocorticoid receptor signaling pathway(GO:2000324) |
| 6.2 | 18.7 | GO:0010133 | proline catabolic process to glutamate(GO:0010133) |
| 5.9 | 17.8 | GO:0021913 | regulation of transcription from RNA polymerase II promoter involved in ventral spinal cord interneuron specification(GO:0021913) |
| 5.8 | 23.2 | GO:0003241 | growth involved in heart morphogenesis(GO:0003241) |
| 5.7 | 1007.7 | GO:0002377 | immunoglobulin production(GO:0002377) |
| 5.3 | 21.1 | GO:2000639 | regulation of SREBP signaling pathway(GO:2000638) negative regulation of SREBP signaling pathway(GO:2000639) |
| 5.1 | 15.2 | GO:0097026 | dendritic cell dendrite assembly(GO:0097026) regulation of dendritic cell dendrite assembly(GO:2000547) |
| 5.0 | 5.0 | GO:1990441 | negative regulation of transcription from RNA polymerase II promoter in response to endoplasmic reticulum stress(GO:1990441) |
| 4.0 | 12.1 | GO:0002305 | gamma-delta intraepithelial T cell differentiation(GO:0002304) CD8-positive, gamma-delta intraepithelial T cell differentiation(GO:0002305) |
| 4.0 | 16.0 | GO:0099558 | maintenance of synapse structure(GO:0099558) |
| 3.9 | 7.9 | GO:0035166 | post-embryonic hemopoiesis(GO:0035166) |
| 3.9 | 11.7 | GO:0060086 | circadian temperature homeostasis(GO:0060086) |
| 3.6 | 10.9 | GO:0071226 | response to molecule of fungal origin(GO:0002238) cellular response to molecule of fungal origin(GO:0071226) |
| 3.6 | 18.0 | GO:0014807 | regulation of somitogenesis(GO:0014807) |
| 3.4 | 17.1 | GO:0045925 | positive regulation of female receptivity(GO:0045925) |
| 3.3 | 16.6 | GO:0071877 | regulation of adrenergic receptor signaling pathway(GO:0071877) |
| 3.3 | 10.0 | GO:0099557 | trans-synaptic signaling by trans-synaptic complex, modulating synaptic transmission(GO:0099557) |
| 3.3 | 19.7 | GO:0090245 | axis elongation involved in somitogenesis(GO:0090245) |
| 3.2 | 29.2 | GO:1903898 | negative regulation of PERK-mediated unfolded protein response(GO:1903898) negative regulation of endoplasmic reticulum stress-induced eIF2 alpha phosphorylation(GO:1903912) |
| 3.2 | 12.8 | GO:0036269 | swimming behavior(GO:0036269) |
| 3.2 | 25.4 | GO:0070995 | NADPH oxidation(GO:0070995) |
| 3.1 | 27.6 | GO:0050882 | voluntary musculoskeletal movement(GO:0050882) |
| 3.0 | 36.5 | GO:0051611 | negative regulation of neurotransmitter uptake(GO:0051581) regulation of serotonin uptake(GO:0051611) negative regulation of serotonin uptake(GO:0051612) |
| 3.0 | 33.0 | GO:0097116 | gephyrin clustering involved in postsynaptic density assembly(GO:0097116) |
| 3.0 | 20.9 | GO:0010890 | positive regulation of sequestering of triglyceride(GO:0010890) |
| 3.0 | 8.9 | GO:0021593 | rhombomere morphogenesis(GO:0021593) rhombomere 3 morphogenesis(GO:0021658) |
| 2.9 | 8.6 | GO:1905167 | positive regulation of lysosomal protein catabolic process(GO:1905167) |
| 2.8 | 28.2 | GO:0032119 | sequestering of zinc ion(GO:0032119) |
| 2.8 | 19.5 | GO:0018095 | protein polyglutamylation(GO:0018095) |
| 2.8 | 8.3 | GO:0000738 | DNA catabolic process, exonucleolytic(GO:0000738) |
| 2.8 | 11.0 | GO:0003431 | growth plate cartilage chondrocyte growth(GO:0003430) growth plate cartilage chondrocyte development(GO:0003431) |
| 2.7 | 8.0 | GO:0072709 | cellular response to sorbitol(GO:0072709) |
| 2.6 | 18.5 | GO:1904526 | regulation of microtubule binding(GO:1904526) |
| 2.6 | 13.1 | GO:0044027 | hypermethylation of CpG island(GO:0044027) |
| 2.6 | 13.1 | GO:2001107 | negative regulation of establishment of T cell polarity(GO:1903904) negative regulation of Rho guanyl-nucleotide exchange factor activity(GO:2001107) |
| 2.5 | 20.1 | GO:0002457 | T cell antigen processing and presentation(GO:0002457) |
| 2.5 | 4.9 | GO:0090264 | immune complex clearance(GO:0002434) immune complex clearance by monocytes and macrophages(GO:0002436) regulation of immune complex clearance by monocytes and macrophages(GO:0090264) |
| 2.5 | 44.3 | GO:0045199 | maintenance of apical/basal cell polarity(GO:0035090) maintenance of epithelial cell apical/basal polarity(GO:0045199) |
| 2.4 | 17.0 | GO:0033029 | neutrophil apoptotic process(GO:0001781) regulation of neutrophil apoptotic process(GO:0033029) |
| 2.3 | 42.1 | GO:0006054 | N-acetylneuraminate metabolic process(GO:0006054) |
| 2.3 | 30.3 | GO:0043983 | histone H4-K12 acetylation(GO:0043983) |
| 2.3 | 18.6 | GO:0003190 | atrioventricular valve formation(GO:0003190) |
| 2.3 | 11.3 | GO:0015688 | iron chelate transport(GO:0015688) siderophore transport(GO:0015891) |
| 2.2 | 26.3 | GO:0070561 | vitamin D receptor signaling pathway(GO:0070561) |
| 2.2 | 6.6 | GO:0019075 | virus maturation(GO:0019075) |
| 2.2 | 13.0 | GO:0033625 | positive regulation of integrin activation(GO:0033625) |
| 2.2 | 8.7 | GO:0090370 | negative regulation of cholesterol efflux(GO:0090370) |
| 2.2 | 6.5 | GO:0061026 | cardiac muscle tissue regeneration(GO:0061026) |
| 2.1 | 14.8 | GO:0006003 | fructose 2,6-bisphosphate metabolic process(GO:0006003) |
| 2.1 | 6.3 | GO:0018242 | protein O-linked glycosylation via serine(GO:0018242) |
| 2.1 | 4.1 | GO:1901624 | negative regulation of lymphocyte chemotaxis(GO:1901624) |
| 2.0 | 18.1 | GO:0099566 | regulation of postsynaptic cytosolic calcium ion concentration(GO:0099566) |
| 2.0 | 20.0 | GO:0006957 | complement activation, alternative pathway(GO:0006957) |
| 2.0 | 11.9 | GO:1902261 | positive regulation of delayed rectifier potassium channel activity(GO:1902261) |
| 2.0 | 7.8 | GO:1900158 | positive regulation of osteoclast proliferation(GO:0090290) negative regulation of bone mineralization involved in bone maturation(GO:1900158) |
| 1.9 | 15.2 | GO:0043615 | astrocyte cell migration(GO:0043615) |
| 1.9 | 5.7 | GO:0060366 | subpallium cell proliferation in forebrain(GO:0022012) lateral ganglionic eminence cell proliferation(GO:0022018) lambdoid suture morphogenesis(GO:0060366) sagittal suture morphogenesis(GO:0060367) anterior semicircular canal development(GO:0060873) lateral semicircular canal development(GO:0060875) |
| 1.9 | 7.5 | GO:0002881 | negative regulation of chronic inflammatory response to non-antigenic stimulus(GO:0002881) |
| 1.8 | 7.3 | GO:0043375 | negative regulation of cellular pH reduction(GO:0032848) CD8-positive, alpha-beta T cell lineage commitment(GO:0043375) negative regulation of retinal cell programmed cell death(GO:0046671) |
| 1.8 | 9.1 | GO:0090258 | negative regulation of mitochondrial fission(GO:0090258) |
| 1.8 | 7.1 | GO:0060741 | prostate gland stromal morphogenesis(GO:0060741) |
| 1.7 | 3.5 | GO:0070346 | positive regulation of fat cell proliferation(GO:0070346) |
| 1.7 | 13.7 | GO:0019732 | antifungal humoral response(GO:0019732) |
| 1.7 | 5.0 | GO:0071934 | thiamine transport(GO:0015888) thiamine transmembrane transport(GO:0071934) |
| 1.7 | 8.3 | GO:0042320 | regulation of circadian sleep/wake cycle, REM sleep(GO:0042320) |
| 1.6 | 4.9 | GO:1903644 | regulation of chaperone-mediated protein folding(GO:1903644) |
| 1.6 | 8.2 | GO:0038161 | prolactin signaling pathway(GO:0038161) |
| 1.6 | 14.6 | GO:0042905 | 9-cis-retinoic acid biosynthetic process(GO:0042904) 9-cis-retinoic acid metabolic process(GO:0042905) |
| 1.6 | 12.9 | GO:1903026 | negative regulation of RNA polymerase II regulatory region sequence-specific DNA binding(GO:1903026) |
| 1.6 | 6.3 | GO:0000023 | maltose metabolic process(GO:0000023) |
| 1.5 | 7.7 | GO:0033141 | positive regulation of peptidyl-serine phosphorylation of STAT protein(GO:0033141) |
| 1.5 | 4.6 | GO:0051946 | regulation of amino acid uptake involved in synaptic transmission(GO:0051941) regulation of glutamate uptake involved in transmission of nerve impulse(GO:0051946) regulation of L-glutamate import(GO:1900920) |
| 1.5 | 7.6 | GO:0030070 | insulin processing(GO:0030070) |
| 1.5 | 4.6 | GO:0010621 | negative regulation of transcription by transcription factor localization(GO:0010621) hepatic duct development(GO:0061011) |
| 1.5 | 4.5 | GO:0097535 | lymphoid lineage cell migration(GO:0097534) lymphoid lineage cell migration into thymus(GO:0097535) |
| 1.5 | 10.5 | GO:0043696 | forebrain anterior/posterior pattern specification(GO:0021797) dedifferentiation(GO:0043696) cell dedifferentiation(GO:0043697) |
| 1.5 | 7.4 | GO:0008050 | courtship behavior(GO:0007619) female courtship behavior(GO:0008050) |
| 1.4 | 1.4 | GO:0032752 | positive regulation of interleukin-3 production(GO:0032752) interleukin-3 biosynthetic process(GO:0042223) regulation of interleukin-3 biosynthetic process(GO:0045399) positive regulation of interleukin-3 biosynthetic process(GO:0045401) |
| 1.4 | 9.9 | GO:0070212 | protein poly-ADP-ribosylation(GO:0070212) |
| 1.4 | 4.2 | GO:2001034 | positive regulation of double-strand break repair via nonhomologous end joining(GO:2001034) |
| 1.4 | 20.7 | GO:0035970 | peptidyl-threonine dephosphorylation(GO:0035970) |
| 1.3 | 8.0 | GO:0060414 | aorta smooth muscle tissue morphogenesis(GO:0060414) |
| 1.3 | 4.0 | GO:0060661 | submandibular salivary gland formation(GO:0060661) hair follicle cell proliferation(GO:0071335) regulation of hair follicle cell proliferation(GO:0071336) positive regulation of hair follicle cell proliferation(GO:0071338) |
| 1.3 | 1.3 | GO:0032224 | positive regulation of synaptic transmission, cholinergic(GO:0032224) |
| 1.3 | 9.2 | GO:0001714 | endodermal cell fate specification(GO:0001714) |
| 1.3 | 9.1 | GO:0035021 | negative regulation of Rac protein signal transduction(GO:0035021) |
| 1.3 | 3.8 | GO:0097473 | response to high light intensity(GO:0009644) cellular response to light intensity(GO:0071484) cellular response to high light intensity(GO:0071486) retinal rod cell apoptotic process(GO:0097473) retinal cell apoptotic process(GO:1990009) |
| 1.3 | 5.1 | GO:0030035 | microspike assembly(GO:0030035) |
| 1.3 | 3.8 | GO:1903348 | positive regulation of bicellular tight junction assembly(GO:1903348) |
| 1.3 | 6.3 | GO:0033058 | directional locomotion(GO:0033058) |
| 1.2 | 4.9 | GO:0019355 | nicotinamide nucleotide biosynthetic process from aspartate(GO:0019355) 'de novo' NAD biosynthetic process(GO:0034627) 'de novo' NAD biosynthetic process from aspartate(GO:0034628) |
| 1.2 | 6.0 | GO:0002606 | dendritic cell antigen processing and presentation(GO:0002468) regulation of dendritic cell antigen processing and presentation(GO:0002604) positive regulation of dendritic cell antigen processing and presentation(GO:0002606) |
| 1.2 | 7.2 | GO:0061737 | leukotriene signaling pathway(GO:0061737) |
| 1.2 | 22.6 | GO:0016973 | poly(A)+ mRNA export from nucleus(GO:0016973) |
| 1.2 | 4.7 | GO:0098957 | anterograde axonal transport of mitochondrion(GO:0098957) |
| 1.1 | 9.2 | GO:0061179 | negative regulation of insulin secretion involved in cellular response to glucose stimulus(GO:0061179) |
| 1.1 | 13.3 | GO:0048251 | elastic fiber assembly(GO:0048251) |
| 1.1 | 7.6 | GO:0007161 | calcium-independent cell-matrix adhesion(GO:0007161) |
| 1.1 | 2.2 | GO:0048852 | hypophysis morphogenesis(GO:0048850) diencephalon morphogenesis(GO:0048852) |
| 1.1 | 8.5 | GO:0070842 | aggresome assembly(GO:0070842) |
| 1.0 | 7.3 | GO:0010499 | proteasomal ubiquitin-independent protein catabolic process(GO:0010499) |
| 1.0 | 25.6 | GO:1904294 | positive regulation of ERAD pathway(GO:1904294) |
| 1.0 | 9.1 | GO:0033088 | regulation of immature T cell proliferation in thymus(GO:0033084) negative regulation of immature T cell proliferation in thymus(GO:0033088) |
| 1.0 | 5.0 | GO:0007412 | axon target recognition(GO:0007412) |
| 1.0 | 4.0 | GO:0002322 | B cell proliferation involved in immune response(GO:0002322) |
| 1.0 | 3.0 | GO:1903028 | regulation of opsonization(GO:1903027) positive regulation of opsonization(GO:1903028) |
| 1.0 | 23.8 | GO:0045063 | T-helper 1 cell differentiation(GO:0045063) |
| 1.0 | 2.9 | GO:0061386 | closure of optic fissure(GO:0061386) |
| 1.0 | 5.8 | GO:0006196 | AMP catabolic process(GO:0006196) |
| 1.0 | 4.8 | GO:1903244 | positive regulation of cardiac muscle adaptation(GO:0010615) positive regulation of cardiac muscle hypertrophy in response to stress(GO:1903244) |
| 1.0 | 8.7 | GO:0030822 | positive regulation of cyclic nucleotide catabolic process(GO:0030807) positive regulation of cAMP catabolic process(GO:0030822) |
| 1.0 | 6.7 | GO:0090324 | negative regulation of oxidative phosphorylation(GO:0090324) |
| 0.9 | 7.5 | GO:0043654 | recognition of apoptotic cell(GO:0043654) |
| 0.9 | 2.8 | GO:0070340 | detection of bacterial lipoprotein(GO:0042494) detection of triacyl bacterial lipopeptide(GO:0042495) detection of bacterial lipopeptide(GO:0070340) |
| 0.9 | 4.6 | GO:0036072 | intramembranous ossification(GO:0001957) direct ossification(GO:0036072) |
| 0.9 | 9.1 | GO:0001865 | NK T cell differentiation(GO:0001865) |
| 0.9 | 37.2 | GO:0007257 | activation of JUN kinase activity(GO:0007257) |
| 0.9 | 3.6 | GO:0006627 | protein processing involved in protein targeting to mitochondrion(GO:0006627) |
| 0.9 | 4.5 | GO:0045348 | positive regulation of MHC class II biosynthetic process(GO:0045348) |
| 0.9 | 2.7 | GO:0030186 | melatonin metabolic process(GO:0030186) melatonin biosynthetic process(GO:0030187) |
| 0.9 | 2.7 | GO:0018101 | protein citrullination(GO:0018101) histone citrullination(GO:0036414) |
| 0.9 | 8.9 | GO:1900122 | positive regulation of receptor binding(GO:1900122) |
| 0.9 | 2.7 | GO:0070681 | glutaminyl-tRNAGln biosynthesis via transamidation(GO:0070681) |
| 0.9 | 3.4 | GO:2000255 | negative regulation of male germ cell proliferation(GO:2000255) |
| 0.9 | 17.9 | GO:0044146 | negative regulation of growth of symbiont involved in interaction with host(GO:0044146) |
| 0.8 | 3.4 | GO:0046485 | ether lipid metabolic process(GO:0046485) |
| 0.8 | 4.2 | GO:0022614 | membrane to membrane docking(GO:0022614) |
| 0.8 | 11.7 | GO:0048665 | neuron fate specification(GO:0048665) |
| 0.8 | 12.2 | GO:0006600 | creatine metabolic process(GO:0006600) |
| 0.8 | 5.7 | GO:0034587 | piRNA metabolic process(GO:0034587) |
| 0.8 | 13.0 | GO:0032688 | negative regulation of interferon-beta production(GO:0032688) |
| 0.8 | 8.8 | GO:1902746 | regulation of lens fiber cell differentiation(GO:1902746) |
| 0.8 | 3.2 | GO:0019477 | L-lysine catabolic process to acetyl-CoA(GO:0019474) L-lysine catabolic process(GO:0019477) L-lysine metabolic process(GO:0046440) |
| 0.8 | 21.6 | GO:0050860 | negative regulation of T cell receptor signaling pathway(GO:0050860) |
| 0.8 | 4.6 | GO:0060594 | fibroblast growth factor receptor signaling pathway involved in negative regulation of apoptotic process in bone marrow(GO:0035602) fibroblast growth factor receptor signaling pathway involved in hemopoiesis(GO:0035603) fibroblast growth factor receptor signaling pathway involved in positive regulation of cell proliferation in bone marrow(GO:0035604) mammary gland specification(GO:0060594) fibroblast growth factor receptor signaling pathway involved in mammary gland specification(GO:0060595) mammary gland bud formation(GO:0060615) branch elongation involved in salivary gland morphogenesis(GO:0060667) mesenchymal cell differentiation involved in lung development(GO:0060915) regulation of apoptotic process in bone marrow(GO:0071865) negative regulation of apoptotic process in bone marrow(GO:0071866) |
| 0.8 | 4.6 | GO:0021648 | thorax and anterior abdomen determination(GO:0007356) vestibulocochlear nerve morphogenesis(GO:0021648) vestibulocochlear nerve formation(GO:0021650) |
| 0.7 | 4.5 | GO:0006689 | ganglioside catabolic process(GO:0006689) |
| 0.7 | 2.2 | GO:0048733 | sebaceous gland development(GO:0048733) |
| 0.7 | 4.4 | GO:0030223 | neutrophil differentiation(GO:0030223) |
| 0.7 | 7.1 | GO:0036309 | protein localization to M-band(GO:0036309) protein localization to T-tubule(GO:0036371) |
| 0.7 | 0.7 | GO:0021521 | ventral spinal cord interneuron specification(GO:0021521) cell fate specification involved in pattern specification(GO:0060573) |
| 0.7 | 2.8 | GO:0072396 | response to cell cycle checkpoint signaling(GO:0072396) response to DNA integrity checkpoint signaling(GO:0072402) response to DNA damage checkpoint signaling(GO:0072423) |
| 0.7 | 2.8 | GO:1990502 | dense core granule maturation(GO:1990502) |
| 0.7 | 2.8 | GO:2000196 | positive regulation of female gonad development(GO:2000196) |
| 0.7 | 2.1 | GO:0060907 | positive regulation of macrophage cytokine production(GO:0060907) |
| 0.7 | 2.1 | GO:0061590 | calcium activated phospholipid scrambling(GO:0061588) calcium activated phosphatidylcholine scrambling(GO:0061590) calcium activated galactosylceramide scrambling(GO:0061591) |
| 0.7 | 9.1 | GO:0042355 | fucose catabolic process(GO:0019317) L-fucose metabolic process(GO:0042354) L-fucose catabolic process(GO:0042355) |
| 0.7 | 26.0 | GO:0035235 | ionotropic glutamate receptor signaling pathway(GO:0035235) |
| 0.7 | 188.3 | GO:0006367 | transcription initiation from RNA polymerase II promoter(GO:0006367) |
| 0.7 | 10.9 | GO:0031033 | myosin filament organization(GO:0031033) |
| 0.7 | 2.7 | GO:0021759 | globus pallidus development(GO:0021759) |
| 0.7 | 8.8 | GO:1990440 | ATF6-mediated unfolded protein response(GO:0036500) positive regulation of transcription from RNA polymerase II promoter in response to endoplasmic reticulum stress(GO:1990440) |
| 0.7 | 6.8 | GO:2000288 | positive regulation of myoblast proliferation(GO:2000288) |
| 0.7 | 5.3 | GO:0072733 | response to staurosporine(GO:0072733) cellular response to staurosporine(GO:0072734) |
| 0.7 | 11.9 | GO:0015671 | oxygen transport(GO:0015671) |
| 0.7 | 7.9 | GO:0042908 | xenobiotic transport(GO:0042908) |
| 0.7 | 7.8 | GO:0050966 | detection of mechanical stimulus involved in sensory perception of pain(GO:0050966) |
| 0.7 | 3.9 | GO:0006651 | diacylglycerol biosynthetic process(GO:0006651) |
| 0.6 | 71.3 | GO:0030183 | B cell differentiation(GO:0030183) |
| 0.6 | 42.0 | GO:0034260 | negative regulation of GTPase activity(GO:0034260) |
| 0.6 | 5.2 | GO:1900748 | positive regulation of vascular endothelial growth factor signaling pathway(GO:1900748) |
| 0.6 | 8.4 | GO:2000811 | negative regulation of anoikis(GO:2000811) |
| 0.6 | 16.6 | GO:0050832 | defense response to fungus(GO:0050832) |
| 0.6 | 8.2 | GO:0010991 | regulation of SMAD protein complex assembly(GO:0010990) negative regulation of SMAD protein complex assembly(GO:0010991) |
| 0.6 | 5.7 | GO:0098735 | positive regulation of the force of heart contraction(GO:0098735) |
| 0.6 | 9.4 | GO:0048263 | determination of dorsal identity(GO:0048263) |
| 0.6 | 3.1 | GO:0015742 | alpha-ketoglutarate transport(GO:0015742) |
| 0.6 | 6.1 | GO:0006824 | cobalt ion transport(GO:0006824) |
| 0.6 | 1.2 | GO:0046878 | positive regulation of saliva secretion(GO:0046878) |
| 0.6 | 3.0 | GO:0016998 | cell wall macromolecule catabolic process(GO:0016998) |
| 0.6 | 1.8 | GO:0097211 | response to gonadotropin-releasing hormone(GO:0097210) cellular response to gonadotropin-releasing hormone(GO:0097211) |
| 0.6 | 7.2 | GO:0060272 | embryonic skeletal joint morphogenesis(GO:0060272) |
| 0.6 | 5.3 | GO:0000395 | mRNA 5'-splice site recognition(GO:0000395) |
| 0.6 | 4.1 | GO:0036343 | psychomotor behavior(GO:0036343) |
| 0.6 | 2.9 | GO:0032074 | negative regulation of nuclease activity(GO:0032074) |
| 0.6 | 2.2 | GO:0048631 | regulation of skeletal muscle tissue growth(GO:0048631) |
| 0.6 | 2.8 | GO:1901409 | positive regulation of phosphorylation of RNA polymerase II C-terminal domain(GO:1901409) |
| 0.6 | 5.5 | GO:0072672 | neutrophil extravasation(GO:0072672) |
| 0.5 | 2.2 | GO:0010430 | fatty acid omega-oxidation(GO:0010430) |
| 0.5 | 1.1 | GO:0060586 | multicellular organismal iron ion homeostasis(GO:0060586) |
| 0.5 | 29.3 | GO:0021762 | substantia nigra development(GO:0021762) |
| 0.5 | 12.4 | GO:0060334 | regulation of response to interferon-gamma(GO:0060330) regulation of interferon-gamma-mediated signaling pathway(GO:0060334) |
| 0.5 | 15.9 | GO:0016601 | Rac protein signal transduction(GO:0016601) |
| 0.5 | 7.9 | GO:0031573 | intra-S DNA damage checkpoint(GO:0031573) |
| 0.5 | 4.2 | GO:0060754 | positive regulation of mast cell chemotaxis(GO:0060754) |
| 0.5 | 8.1 | GO:0030277 | maintenance of gastrointestinal epithelium(GO:0030277) |
| 0.5 | 5.5 | GO:1903800 | positive regulation of production of miRNAs involved in gene silencing by miRNA(GO:1903800) |
| 0.5 | 5.8 | GO:0061158 | 3'-UTR-mediated mRNA destabilization(GO:0061158) |
| 0.5 | 21.9 | GO:0010762 | regulation of fibroblast migration(GO:0010762) |
| 0.5 | 2.4 | GO:0090131 | mesenchyme migration(GO:0090131) |
| 0.5 | 28.3 | GO:0038083 | peptidyl-tyrosine autophosphorylation(GO:0038083) |
| 0.5 | 5.1 | GO:0008343 | adult feeding behavior(GO:0008343) |
| 0.5 | 2.8 | GO:0060054 | positive regulation of epithelial cell proliferation involved in wound healing(GO:0060054) |
| 0.5 | 4.6 | GO:0086028 | bundle of His cell to Purkinje myocyte signaling(GO:0086028) bundle of His cell action potential(GO:0086043) |
| 0.5 | 2.3 | GO:2000291 | regulation of myoblast proliferation(GO:2000291) |
| 0.5 | 12.3 | GO:0046676 | negative regulation of insulin secretion(GO:0046676) |
| 0.5 | 10.5 | GO:0021542 | dentate gyrus development(GO:0021542) |
| 0.5 | 5.4 | GO:0030322 | stabilization of membrane potential(GO:0030322) |
| 0.5 | 8.1 | GO:0010719 | negative regulation of epithelial to mesenchymal transition(GO:0010719) |
| 0.4 | 0.9 | GO:1903691 | positive regulation of wound healing, spreading of epidermal cells(GO:1903691) |
| 0.4 | 6.2 | GO:1990001 | regulation of nucleotide-binding oligomerization domain containing signaling pathway(GO:0070424) inhibition of cysteine-type endopeptidase activity involved in apoptotic process(GO:1990001) |
| 0.4 | 8.3 | GO:0036035 | osteoclast development(GO:0036035) |
| 0.4 | 8.8 | GO:0097151 | positive regulation of inhibitory postsynaptic potential(GO:0097151) modulation of inhibitory postsynaptic potential(GO:0098828) |
| 0.4 | 10.0 | GO:0090129 | positive regulation of synapse maturation(GO:0090129) |
| 0.4 | 1.7 | GO:2000980 | regulation of auditory receptor cell differentiation(GO:0045607) regulation of mechanoreceptor differentiation(GO:0045631) regulation of inner ear receptor cell differentiation(GO:2000980) |
| 0.4 | 1.3 | GO:0098758 | response to interleukin-8(GO:0098758) cellular response to interleukin-8(GO:0098759) |
| 0.4 | 1.3 | GO:0051835 | positive regulation of synapse structural plasticity(GO:0051835) |
| 0.4 | 7.6 | GO:0043923 | positive regulation by host of viral transcription(GO:0043923) |
| 0.4 | 1.3 | GO:0001983 | regulation of systemic arterial blood pressure by carotid sinus baroreceptor feedback(GO:0001978) baroreceptor response to increased systemic arterial blood pressure(GO:0001983) |
| 0.4 | 1.6 | GO:0044314 | protein K27-linked ubiquitination(GO:0044314) |
| 0.4 | 2.4 | GO:0046092 | deoxycytidine metabolic process(GO:0046092) |
| 0.4 | 29.9 | GO:0071277 | cellular response to calcium ion(GO:0071277) |
| 0.4 | 11.4 | GO:0061003 | positive regulation of dendritic spine morphogenesis(GO:0061003) |
| 0.4 | 9.0 | GO:0006309 | apoptotic DNA fragmentation(GO:0006309) |
| 0.4 | 1.6 | GO:0002525 | acute inflammatory response to non-antigenic stimulus(GO:0002525) regulation of acute inflammatory response to non-antigenic stimulus(GO:0002877) positive regulation of acute inflammatory response to non-antigenic stimulus(GO:0002879) |
| 0.4 | 12.5 | GO:0009081 | branched-chain amino acid metabolic process(GO:0009081) branched-chain amino acid catabolic process(GO:0009083) |
| 0.4 | 5.0 | GO:0014809 | regulation of skeletal muscle contraction by regulation of release of sequestered calcium ion(GO:0014809) |
| 0.4 | 3.4 | GO:0030854 | positive regulation of granulocyte differentiation(GO:0030854) |
| 0.4 | 8.4 | GO:2000001 | regulation of DNA damage checkpoint(GO:2000001) |
| 0.4 | 6.8 | GO:0005513 | detection of calcium ion(GO:0005513) |
| 0.4 | 3.7 | GO:0001574 | ganglioside biosynthetic process(GO:0001574) |
| 0.4 | 3.7 | GO:0090292 | nuclear matrix anchoring at nuclear membrane(GO:0090292) |
| 0.4 | 2.5 | GO:0042756 | drinking behavior(GO:0042756) |
| 0.4 | 1.1 | GO:0042560 | folic acid-containing compound catabolic process(GO:0009397) pteridine-containing compound catabolic process(GO:0042560) |
| 0.3 | 7.3 | GO:0042347 | negative regulation of NF-kappaB import into nucleus(GO:0042347) |
| 0.3 | 2.4 | GO:0046886 | positive regulation of hormone biosynthetic process(GO:0046886) |
| 0.3 | 4.0 | GO:0006044 | N-acetylglucosamine metabolic process(GO:0006044) |
| 0.3 | 4.6 | GO:0030502 | negative regulation of bone mineralization(GO:0030502) |
| 0.3 | 2.6 | GO:0006572 | tyrosine catabolic process(GO:0006572) |
| 0.3 | 2.3 | GO:0021520 | spinal cord motor neuron cell fate specification(GO:0021520) |
| 0.3 | 9.7 | GO:0015012 | heparan sulfate proteoglycan biosynthetic process(GO:0015012) |
| 0.3 | 75.8 | GO:0002250 | adaptive immune response(GO:0002250) |
| 0.3 | 1.2 | GO:0034773 | histone H4-K20 trimethylation(GO:0034773) establishment of Sertoli cell barrier(GO:0097368) |
| 0.3 | 2.4 | GO:0070166 | enamel mineralization(GO:0070166) |
| 0.3 | 2.1 | GO:0060452 | positive regulation of cardiac muscle contraction(GO:0060452) |
| 0.3 | 2.9 | GO:0097369 | sodium ion import(GO:0097369) sodium ion import across plasma membrane(GO:0098719) sodium ion import into cell(GO:1990118) |
| 0.3 | 0.8 | GO:0003139 | secondary heart field specification(GO:0003139) |
| 0.3 | 1.7 | GO:1902514 | regulation of calcium ion transmembrane transport via high voltage-gated calcium channel(GO:1902514) positive regulation of calcium ion transmembrane transport via high voltage-gated calcium channel(GO:1904879) |
| 0.3 | 20.1 | GO:0010923 | negative regulation of phosphatase activity(GO:0010923) |
| 0.3 | 2.4 | GO:0060074 | synapse maturation(GO:0060074) |
| 0.3 | 4.3 | GO:0001709 | cell fate determination(GO:0001709) |
| 0.3 | 3.5 | GO:0045974 | miRNA mediated inhibition of translation(GO:0035278) negative regulation of translation, ncRNA-mediated(GO:0040033) regulation of translation, ncRNA-mediated(GO:0045974) |
| 0.3 | 2.6 | GO:0046007 | negative regulation of activated T cell proliferation(GO:0046007) |
| 0.3 | 2.6 | GO:0042985 | negative regulation of amyloid precursor protein biosynthetic process(GO:0042985) |
| 0.3 | 1.8 | GO:0044557 | relaxation of smooth muscle(GO:0044557) |
| 0.3 | 3.1 | GO:1904903 | ESCRT complex disassembly(GO:1904896) ESCRT III complex disassembly(GO:1904903) |
| 0.3 | 6.0 | GO:0071108 | protein K48-linked deubiquitination(GO:0071108) |
| 0.3 | 4.4 | GO:0021854 | hypothalamus development(GO:0021854) |
| 0.3 | 3.0 | GO:0016191 | synaptic vesicle uncoating(GO:0016191) |
| 0.2 | 1.2 | GO:0006127 | glycerophosphate shuttle(GO:0006127) |
| 0.2 | 4.7 | GO:0002260 | lymphocyte homeostasis(GO:0002260) |
| 0.2 | 3.5 | GO:0070544 | histone H3-K36 demethylation(GO:0070544) |
| 0.2 | 24.9 | GO:0050911 | detection of chemical stimulus involved in sensory perception of smell(GO:0050911) |
| 0.2 | 5.9 | GO:0043651 | linoleic acid metabolic process(GO:0043651) |
| 0.2 | 7.3 | GO:0045747 | positive regulation of Notch signaling pathway(GO:0045747) |
| 0.2 | 6.3 | GO:0046597 | negative regulation of viral entry into host cell(GO:0046597) |
| 0.2 | 8.7 | GO:0051973 | positive regulation of telomerase activity(GO:0051973) |
| 0.2 | 1.2 | GO:2001106 | regulation of Rho guanyl-nucleotide exchange factor activity(GO:2001106) |
| 0.2 | 3.5 | GO:0007258 | JUN phosphorylation(GO:0007258) |
| 0.2 | 3.1 | GO:0036158 | outer dynein arm assembly(GO:0036158) |
| 0.2 | 1.1 | GO:0006432 | phenylalanyl-tRNA aminoacylation(GO:0006432) |
| 0.2 | 2.4 | GO:2000821 | regulation of grooming behavior(GO:2000821) |
| 0.2 | 9.0 | GO:0010830 | regulation of myotube differentiation(GO:0010830) |
| 0.2 | 4.9 | GO:0046135 | pyrimidine nucleoside catabolic process(GO:0046135) |
| 0.2 | 1.9 | GO:0019375 | galactosylceramide biosynthetic process(GO:0006682) galactolipid biosynthetic process(GO:0019375) |
| 0.2 | 2.1 | GO:0015870 | acetylcholine transport(GO:0015870) |
| 0.2 | 9.9 | GO:0016239 | positive regulation of macroautophagy(GO:0016239) |
| 0.2 | 6.8 | GO:0045744 | negative regulation of G-protein coupled receptor protein signaling pathway(GO:0045744) |
| 0.2 | 4.4 | GO:0046069 | cGMP catabolic process(GO:0046069) |
| 0.2 | 1.0 | GO:0048539 | bone marrow development(GO:0048539) |
| 0.2 | 1.9 | GO:0045329 | carnitine biosynthetic process(GO:0045329) |
| 0.2 | 6.4 | GO:0022400 | regulation of rhodopsin mediated signaling pathway(GO:0022400) |
| 0.2 | 1.3 | GO:0015760 | hexose phosphate transport(GO:0015712) glucose-6-phosphate transport(GO:0015760) |
| 0.2 | 4.2 | GO:0034204 | lipid translocation(GO:0034204) phospholipid translocation(GO:0045332) |
| 0.2 | 0.6 | GO:0044339 | canonical Wnt signaling pathway involved in osteoblast differentiation(GO:0044339) |
| 0.2 | 5.1 | GO:0033198 | response to ATP(GO:0033198) |
| 0.2 | 4.7 | GO:0032012 | regulation of ARF protein signal transduction(GO:0032012) |
| 0.2 | 3.6 | GO:0006488 | dolichol-linked oligosaccharide biosynthetic process(GO:0006488) |
| 0.2 | 2.9 | GO:0034497 | protein localization to pre-autophagosomal structure(GO:0034497) |
| 0.2 | 3.2 | GO:0006590 | thyroid hormone generation(GO:0006590) |
| 0.2 | 11.9 | GO:0048278 | vesicle docking(GO:0048278) |
| 0.2 | 5.5 | GO:0006376 | mRNA splice site selection(GO:0006376) |
| 0.2 | 3.4 | GO:0019373 | epoxygenase P450 pathway(GO:0019373) |
| 0.2 | 4.8 | GO:0007214 | gamma-aminobutyric acid signaling pathway(GO:0007214) |
| 0.2 | 0.3 | GO:0051365 | cellular response to potassium ion starvation(GO:0051365) |
| 0.2 | 5.4 | GO:0010107 | potassium ion import(GO:0010107) |
| 0.1 | 1.7 | GO:1900028 | negative regulation of ruffle assembly(GO:1900028) |
| 0.1 | 0.3 | GO:0035992 | tendon cell differentiation(GO:0035990) tendon formation(GO:0035992) |
| 0.1 | 4.4 | GO:0060976 | coronary vasculature development(GO:0060976) |
| 0.1 | 3.5 | GO:0010738 | regulation of protein kinase A signaling(GO:0010738) |
| 0.1 | 3.2 | GO:0007608 | sensory perception of smell(GO:0007608) |
| 0.1 | 3.7 | GO:0032007 | negative regulation of TOR signaling(GO:0032007) |
| 0.1 | 16.2 | GO:0048839 | inner ear development(GO:0048839) |
| 0.1 | 2.3 | GO:0035589 | G-protein coupled purinergic nucleotide receptor signaling pathway(GO:0035589) purinergic nucleotide receptor signaling pathway(GO:0035590) |
| 0.1 | 6.9 | GO:0006968 | cellular defense response(GO:0006968) |
| 0.1 | 5.9 | GO:0019730 | antimicrobial humoral response(GO:0019730) |
| 0.1 | 0.7 | GO:0003402 | planar cell polarity pathway involved in axis elongation(GO:0003402) |
| 0.1 | 2.9 | GO:0002092 | positive regulation of receptor internalization(GO:0002092) |
| 0.1 | 4.9 | GO:0019228 | neuronal action potential(GO:0019228) |
| 0.1 | 7.3 | GO:0071349 | interleukin-12-mediated signaling pathway(GO:0035722) response to interleukin-12(GO:0070671) cellular response to interleukin-12(GO:0071349) |
| 0.1 | 1.9 | GO:0032463 | negative regulation of protein homooligomerization(GO:0032463) |
| 0.1 | 0.4 | GO:0044210 | 'de novo' CTP biosynthetic process(GO:0044210) |
| 0.1 | 0.2 | GO:0021514 | ventral spinal cord interneuron differentiation(GO:0021514) |
| 0.1 | 3.9 | GO:0016486 | peptide hormone processing(GO:0016486) |
| 0.1 | 2.0 | GO:0035640 | exploration behavior(GO:0035640) |
| 0.1 | 2.6 | GO:0042417 | dopamine metabolic process(GO:0042417) |
| 0.1 | 1.2 | GO:0014883 | transition between fast and slow fiber(GO:0014883) |
| 0.1 | 0.9 | GO:0035162 | embryonic hemopoiesis(GO:0035162) |
| 0.1 | 0.8 | GO:0002507 | tolerance induction(GO:0002507) |
| 0.1 | 0.7 | GO:0086073 | bundle of His cell-Purkinje myocyte adhesion involved in cell communication(GO:0086073) |
| 0.1 | 2.2 | GO:0006706 | steroid catabolic process(GO:0006706) |
| 0.1 | 0.7 | GO:0003360 | brainstem development(GO:0003360) |
| 0.1 | 0.7 | GO:2000124 | regulation of endocannabinoid signaling pathway(GO:2000124) |
| 0.1 | 0.2 | GO:0045415 | negative regulation of interleukin-8 biosynthetic process(GO:0045415) negative regulation of chemokine (C-X-C motif) ligand 2 production(GO:2000342) |
| 0.1 | 4.7 | GO:0045071 | negative regulation of viral genome replication(GO:0045071) |
| 0.1 | 1.5 | GO:0007205 | protein kinase C-activating G-protein coupled receptor signaling pathway(GO:0007205) |
| 0.1 | 0.4 | GO:0033353 | S-adenosylmethionine cycle(GO:0033353) |
| 0.1 | 0.7 | GO:0043507 | positive regulation of JUN kinase activity(GO:0043507) |
| 0.1 | 0.5 | GO:0060012 | synaptic transmission, glycinergic(GO:0060012) |
| 0.1 | 3.2 | GO:0007631 | feeding behavior(GO:0007631) |
| 0.1 | 1.0 | GO:0048873 | homeostasis of number of cells within a tissue(GO:0048873) |
| 0.1 | 1.5 | GO:0042267 | natural killer cell mediated cytotoxicity(GO:0042267) |
| 0.0 | 2.2 | GO:1902042 | negative regulation of extrinsic apoptotic signaling pathway via death domain receptors(GO:1902042) |
| 0.0 | 2.2 | GO:0007212 | dopamine receptor signaling pathway(GO:0007212) |
| 0.0 | 1.3 | GO:0045652 | regulation of megakaryocyte differentiation(GO:0045652) |
| 0.0 | 3.3 | GO:1903955 | positive regulation of protein targeting to mitochondrion(GO:1903955) |
| 0.0 | 0.4 | GO:0038084 | vascular endothelial growth factor signaling pathway(GO:0038084) |
| 0.0 | 0.9 | GO:0003091 | renal water homeostasis(GO:0003091) |
| 0.0 | 1.7 | GO:0090630 | activation of GTPase activity(GO:0090630) |
| 0.0 | 0.5 | GO:0060711 | labyrinthine layer development(GO:0060711) |
| 0.0 | 0.5 | GO:0030513 | positive regulation of BMP signaling pathway(GO:0030513) |
| 0.0 | 0.5 | GO:0019433 | triglyceride catabolic process(GO:0019433) |
| 0.0 | 1.4 | GO:0019722 | calcium-mediated signaling(GO:0019722) |
| 0.0 | 0.1 | GO:0006116 | NADH oxidation(GO:0006116) |
| 0.0 | 1.3 | GO:0070268 | cornification(GO:0070268) |
| 0.0 | 0.1 | GO:0021516 | dorsal spinal cord development(GO:0021516) |
Gene overrepresentation in cellular component category:
| Log-likelihood per target | Total log-likelihood | Term | Description |
|---|---|---|---|
| 33.5 | 100.5 | GO:0071754 | IgM immunoglobulin complex(GO:0071753) IgM immunoglobulin complex, circulating(GO:0071754) pentameric IgM immunoglobulin complex(GO:0071756) |
| 15.1 | 756.4 | GO:0042571 | immunoglobulin complex, circulating(GO:0042571) |
| 10.0 | 129.9 | GO:0098647 | collagen type VI trimer(GO:0005589) collagen beaded filament(GO:0098647) |
| 9.7 | 38.6 | GO:0031838 | haptoglobin-hemoglobin complex(GO:0031838) |
| 7.4 | 22.1 | GO:0098843 | postsynaptic endocytic zone(GO:0098843) |
| 6.9 | 34.5 | GO:0019815 | B cell receptor complex(GO:0019815) |
| 5.1 | 25.4 | GO:1990031 | pinceau fiber(GO:1990031) |
| 3.4 | 610.5 | GO:0072562 | blood microparticle(GO:0072562) |
| 3.1 | 58.8 | GO:0042613 | MHC class II protein complex(GO:0042613) |
| 3.0 | 21.1 | GO:1990452 | Parkin-FBXW7-Cul1 ubiquitin ligase complex(GO:1990452) |
| 3.0 | 14.8 | GO:0034666 | integrin alpha2-beta1 complex(GO:0034666) |
| 2.7 | 13.6 | GO:0060201 | clathrin-sculpted acetylcholine transport vesicle(GO:0060200) clathrin-sculpted acetylcholine transport vesicle membrane(GO:0060201) |
| 2.7 | 8.0 | GO:0030485 | smooth muscle contractile fiber(GO:0030485) |
| 2.5 | 15.0 | GO:0005577 | fibrinogen complex(GO:0005577) |
| 2.5 | 12.5 | GO:0005947 | mitochondrial alpha-ketoglutarate dehydrogenase complex(GO:0005947) |
| 2.4 | 12.0 | GO:0044308 | axonal spine(GO:0044308) |
| 2.2 | 8.7 | GO:0032937 | SREBP-SCAP-Insig complex(GO:0032937) |
| 1.9 | 20.5 | GO:0005955 | calcineurin complex(GO:0005955) |
| 1.8 | 14.6 | GO:0035976 | AP1 complex(GO:0035976) |
| 1.7 | 29.2 | GO:0000164 | protein phosphatase type 1 complex(GO:0000164) |
| 1.7 | 13.3 | GO:0071953 | elastic fiber(GO:0071953) |
| 1.7 | 18.2 | GO:0060171 | stereocilium membrane(GO:0060171) |
| 1.6 | 22.5 | GO:0032045 | guanyl-nucleotide exchange factor complex(GO:0032045) |
| 1.6 | 4.7 | GO:0032437 | cuticular plate(GO:0032437) |
| 1.5 | 9.1 | GO:0045298 | tubulin complex(GO:0045298) |
| 1.4 | 5.7 | GO:0071546 | pi-body(GO:0071546) |
| 1.4 | 4.2 | GO:0071065 | alpha9-beta1 integrin-vascular cell adhesion molecule-1 complex(GO:0071065) |
| 1.3 | 33.1 | GO:0044295 | axonal growth cone(GO:0044295) |
| 1.3 | 10.2 | GO:0014701 | junctional sarcoplasmic reticulum membrane(GO:0014701) |
| 1.3 | 22.6 | GO:0000346 | transcription export complex(GO:0000346) |
| 1.2 | 21.0 | GO:0005890 | sodium:potassium-exchanging ATPase complex(GO:0005890) |
| 1.1 | 3.2 | GO:0031933 | telomeric heterochromatin(GO:0031933) |
| 1.0 | 7.3 | GO:0098560 | cytoplasmic side of late endosome membrane(GO:0098560) |
| 1.0 | 4.0 | GO:0000308 | cytoplasmic cyclin-dependent protein kinase holoenzyme complex(GO:0000308) |
| 1.0 | 196.2 | GO:0032993 | protein-DNA complex(GO:0032993) |
| 0.9 | 2.8 | GO:0043293 | apoptosome(GO:0043293) |
| 0.9 | 11.2 | GO:0005687 | U4 snRNP(GO:0005687) |
| 0.9 | 2.8 | GO:0035354 | Toll-like receptor 1-Toll-like receptor 2 protein complex(GO:0035354) |
| 0.9 | 2.7 | GO:1990316 | ATG1/ULK1 kinase complex(GO:1990316) |
| 0.9 | 36.0 | GO:0016592 | mediator complex(GO:0016592) |
| 0.9 | 2.7 | GO:0030956 | glutamyl-tRNA(Gln) amidotransferase complex(GO:0030956) |
| 0.9 | 17.1 | GO:0042627 | chylomicron(GO:0042627) |
| 0.8 | 8.4 | GO:0043596 | nuclear replication fork(GO:0043596) |
| 0.8 | 8.3 | GO:0031618 | nuclear pericentric heterochromatin(GO:0031618) |
| 0.8 | 1319.1 | GO:0005615 | extracellular space(GO:0005615) |
| 0.7 | 6.6 | GO:0000813 | ESCRT I complex(GO:0000813) |
| 0.7 | 3.6 | GO:0030130 | clathrin coat of trans-Golgi network vesicle(GO:0030130) |
| 0.7 | 17.5 | GO:0001518 | voltage-gated sodium channel complex(GO:0001518) |
| 0.7 | 6.8 | GO:0031083 | BLOC-1 complex(GO:0031083) |
| 0.7 | 4.0 | GO:0000322 | storage vacuole(GO:0000322) |
| 0.7 | 60.6 | GO:0032580 | Golgi cisterna membrane(GO:0032580) |
| 0.7 | 8.7 | GO:0033256 | I-kappaB/NF-kappaB complex(GO:0033256) |
| 0.6 | 19.4 | GO:0090545 | NuRD complex(GO:0016581) CHD-type complex(GO:0090545) |
| 0.6 | 40.9 | GO:0001772 | immunological synapse(GO:0001772) |
| 0.6 | 25.5 | GO:0001533 | cornified envelope(GO:0001533) |
| 0.6 | 4.8 | GO:0005833 | hemoglobin complex(GO:0005833) |
| 0.6 | 9.5 | GO:0005885 | Arp2/3 protein complex(GO:0005885) |
| 0.6 | 11.6 | GO:0005657 | replication fork(GO:0005657) |
| 0.6 | 74.0 | GO:0016605 | PML body(GO:0016605) |
| 0.6 | 70.3 | GO:0042734 | presynaptic membrane(GO:0042734) |
| 0.6 | 33.7 | GO:0030426 | growth cone(GO:0030426) |
| 0.5 | 5.9 | GO:0033588 | Elongator holoenzyme complex(GO:0033588) |
| 0.5 | 4.5 | GO:0043083 | synaptic cleft(GO:0043083) |
| 0.4 | 3.1 | GO:0036157 | outer dynein arm(GO:0036157) |
| 0.4 | 27.4 | GO:0031901 | early endosome membrane(GO:0031901) |
| 0.4 | 5.0 | GO:0016013 | syntrophin complex(GO:0016013) |
| 0.4 | 2.4 | GO:0097442 | CA3 pyramidal cell dendrite(GO:0097442) |
| 0.4 | 12.7 | GO:0030027 | lamellipodium(GO:0030027) |
| 0.4 | 12.6 | GO:0034451 | centriolar satellite(GO:0034451) |
| 0.3 | 8.5 | GO:0016235 | aggresome(GO:0016235) |
| 0.3 | 5.1 | GO:0031594 | neuromuscular junction(GO:0031594) |
| 0.3 | 2.3 | GO:1990037 | Lewy body core(GO:1990037) |
| 0.3 | 9.0 | GO:0043204 | perikaryon(GO:0043204) |
| 0.3 | 13.2 | GO:0031430 | M band(GO:0031430) |
| 0.3 | 9.2 | GO:0031904 | endosome lumen(GO:0031904) |
| 0.3 | 3.7 | GO:0034993 | microtubule organizing center attachment site(GO:0034992) LINC complex(GO:0034993) |
| 0.3 | 1.4 | GO:0002080 | acrosomal membrane(GO:0002080) |
| 0.3 | 5.2 | GO:0046930 | pore complex(GO:0046930) |
| 0.3 | 7.9 | GO:0005859 | muscle myosin complex(GO:0005859) |
| 0.3 | 2.4 | GO:0098839 | postsynaptic density membrane(GO:0098839) |
| 0.3 | 17.7 | GO:0043195 | terminal bouton(GO:0043195) |
| 0.3 | 8.1 | GO:0000791 | euchromatin(GO:0000791) |
| 0.2 | 3.1 | GO:0000815 | ESCRT III complex(GO:0000815) |
| 0.2 | 6.4 | GO:0044224 | juxtaparanode region of axon(GO:0044224) |
| 0.2 | 9.7 | GO:1904115 | axon cytoplasm(GO:1904115) |
| 0.2 | 19.3 | GO:0036064 | ciliary basal body(GO:0036064) |
| 0.2 | 20.4 | GO:0000123 | histone acetyltransferase complex(GO:0000123) |
| 0.2 | 4.2 | GO:0005665 | DNA-directed RNA polymerase II, core complex(GO:0005665) |
| 0.2 | 1.2 | GO:0009331 | glycerol-3-phosphate dehydrogenase complex(GO:0009331) |
| 0.2 | 5.3 | GO:0097381 | photoreceptor disc membrane(GO:0097381) |
| 0.2 | 1.9 | GO:0031464 | Cul4A-RING E3 ubiquitin ligase complex(GO:0031464) |
| 0.2 | 2.3 | GO:0042622 | photoreceptor outer segment membrane(GO:0042622) |
| 0.2 | 5.8 | GO:0044309 | dendritic spine(GO:0043197) neuron spine(GO:0044309) |
| 0.2 | 26.3 | GO:0032587 | ruffle membrane(GO:0032587) |
| 0.2 | 6.4 | GO:0014704 | intercalated disc(GO:0014704) |
| 0.2 | 2.5 | GO:0031235 | intrinsic component of the cytoplasmic side of the plasma membrane(GO:0031235) |
| 0.2 | 8.8 | GO:0016459 | myosin complex(GO:0016459) |
| 0.2 | 2.4 | GO:0048786 | presynaptic active zone(GO:0048786) |
| 0.2 | 8.7 | GO:0005902 | microvillus(GO:0005902) |
| 0.2 | 11.8 | GO:0001726 | ruffle(GO:0001726) |
| 0.1 | 4.3 | GO:0005892 | acetylcholine-gated channel complex(GO:0005892) |
| 0.1 | 1.3 | GO:0042589 | zymogen granule membrane(GO:0042589) |
| 0.1 | 4.0 | GO:0030173 | integral component of Golgi membrane(GO:0030173) |
| 0.1 | 2.7 | GO:0031932 | TORC2 complex(GO:0031932) |
| 0.1 | 2.9 | GO:0031306 | intrinsic component of mitochondrial outer membrane(GO:0031306) |
| 0.1 | 636.6 | GO:0005886 | plasma membrane(GO:0005886) |
| 0.1 | 2.9 | GO:0031093 | platelet alpha granule lumen(GO:0031093) |
| 0.1 | 16.8 | GO:0005788 | endoplasmic reticulum lumen(GO:0005788) |
| 0.1 | 1.0 | GO:0005672 | transcription factor TFIIA complex(GO:0005672) |
| 0.1 | 2.7 | GO:0035327 | transcriptionally active chromatin(GO:0035327) |
| 0.1 | 5.7 | GO:0031463 | Cul3-RING ubiquitin ligase complex(GO:0031463) |
| 0.1 | 10.6 | GO:0001650 | fibrillar center(GO:0001650) |
| 0.1 | 1.2 | GO:0005861 | troponin complex(GO:0005861) |
| 0.0 | 0.8 | GO:0016514 | SWI/SNF complex(GO:0016514) |
| 0.0 | 1.2 | GO:0001669 | acrosomal vesicle(GO:0001669) |
| 0.0 | 0.7 | GO:0000178 | exosome (RNase complex)(GO:0000178) |
| 0.0 | 2.2 | GO:0030176 | integral component of endoplasmic reticulum membrane(GO:0030176) |
| 0.0 | 2.5 | GO:0045202 | synapse(GO:0045202) |
| 0.0 | 1.0 | GO:0016363 | nuclear matrix(GO:0016363) |
Gene overrepresentation in molecular function category:
| Log-likelihood per target | Total log-likelihood | Term | Description |
|---|---|---|---|
| 15.4 | 3656.9 | GO:0003823 | antigen binding(GO:0003823) |
| 12.5 | 261.8 | GO:0001011 | transcription factor activity, sequence-specific DNA binding, RNA polymerase recruiting(GO:0001011) transcription factor activity, TFIIB-class binding(GO:0001087) |
| 11.2 | 55.9 | GO:0003835 | beta-galactoside alpha-2,6-sialyltransferase activity(GO:0003835) |
| 10.6 | 42.4 | GO:0004698 | calcium-dependent protein kinase C activity(GO:0004698) |
| 9.4 | 28.2 | GO:0035662 | Toll-like receptor 4 binding(GO:0035662) |
| 8.4 | 75.7 | GO:0043426 | MRF binding(GO:0043426) |
| 6.9 | 20.7 | GO:0008330 | protein tyrosine/threonine phosphatase activity(GO:0008330) |
| 6.2 | 43.7 | GO:0030492 | hemoglobin binding(GO:0030492) |
| 4.8 | 14.5 | GO:0017129 | triglyceride binding(GO:0017129) |
| 4.4 | 13.3 | GO:0004556 | alpha-amylase activity(GO:0004556) |
| 4.4 | 21.8 | GO:0010861 | thyroid hormone receptor activator activity(GO:0010861) thyroid hormone receptor coactivator activity(GO:0030375) |
| 4.3 | 34.1 | GO:0004971 | AMPA glutamate receptor activity(GO:0004971) |
| 3.5 | 10.6 | GO:0004157 | dihydropyrimidinase activity(GO:0004157) |
| 3.1 | 12.4 | GO:0004906 | interferon-gamma receptor activity(GO:0004906) |
| 3.0 | 11.9 | GO:0050119 | N-acetylglucosamine deacetylase activity(GO:0050119) |
| 3.0 | 32.7 | GO:0005030 | neurotrophin receptor activity(GO:0005030) |
| 2.9 | 8.7 | GO:0000247 | C-8 sterol isomerase activity(GO:0000247) |
| 2.9 | 8.6 | GO:0030226 | apolipoprotein receptor activity(GO:0030226) |
| 2.9 | 48.7 | GO:0005068 | transmembrane receptor protein tyrosine kinase adaptor activity(GO:0005068) |
| 2.8 | 8.3 | GO:0008859 | exoribonuclease II activity(GO:0008859) |
| 2.7 | 13.7 | GO:0005152 | interleukin-1 receptor antagonist activity(GO:0005152) |
| 2.7 | 8.0 | GO:0004833 | tryptophan 2,3-dioxygenase activity(GO:0004833) |
| 2.5 | 15.2 | GO:0008142 | oxysterol binding(GO:0008142) |
| 2.5 | 15.2 | GO:0031735 | CCR10 chemokine receptor binding(GO:0031735) |
| 2.5 | 14.8 | GO:0003873 | 6-phosphofructo-2-kinase activity(GO:0003873) |
| 2.5 | 12.3 | GO:0043208 | glycosphingolipid binding(GO:0043208) |
| 2.4 | 9.8 | GO:0008467 | [heparan sulfate]-glucosamine 3-sulfotransferase 1 activity(GO:0008467) |
| 2.4 | 11.8 | GO:0004522 | ribonuclease A activity(GO:0004522) |
| 2.3 | 9.2 | GO:0017077 | oxidative phosphorylation uncoupler activity(GO:0017077) |
| 2.3 | 9.1 | GO:0099609 | microtubule lateral binding(GO:0099609) |
| 2.1 | 6.3 | GO:0030158 | protein xylosyltransferase activity(GO:0030158) |
| 2.1 | 8.2 | GO:0004925 | prolactin receptor activity(GO:0004925) |
| 2.0 | 4.0 | GO:0080084 | RNA polymerase III type 1 promoter DNA binding(GO:0001030) RNA polymerase III type 2 promoter DNA binding(GO:0001031) 5S rDNA binding(GO:0080084) |
| 1.9 | 13.4 | GO:0046625 | sphingolipid binding(GO:0046625) |
| 1.9 | 7.5 | GO:0016495 | C-X3-C chemokine receptor activity(GO:0016495) |
| 1.8 | 36.4 | GO:0008349 | MAP kinase kinase kinase kinase activity(GO:0008349) |
| 1.8 | 16.2 | GO:0050682 | AF-2 domain binding(GO:0050682) |
| 1.8 | 21.0 | GO:0005391 | sodium:potassium-exchanging ATPase activity(GO:0005391) |
| 1.7 | 13.8 | GO:0005220 | inositol 1,4,5-trisphosphate-sensitive calcium-release channel activity(GO:0005220) |
| 1.7 | 8.6 | GO:0030109 | HLA-B specific inhibitory MHC class I receptor activity(GO:0030109) |
| 1.7 | 6.8 | GO:0004668 | protein-arginine deiminase activity(GO:0004668) |
| 1.7 | 20.1 | GO:0097027 | ubiquitin-protein transferase activator activity(GO:0097027) |
| 1.7 | 5.0 | GO:0015234 | thiamine transmembrane transporter activity(GO:0015234) thiamine uptake transmembrane transporter activity(GO:0015403) |
| 1.6 | 3.3 | GO:0042806 | fucose binding(GO:0042806) |
| 1.6 | 4.9 | GO:0031727 | CCR2 chemokine receptor binding(GO:0031727) |
| 1.6 | 26.3 | GO:0043024 | ribosomal small subunit binding(GO:0043024) |
| 1.6 | 45.5 | GO:0097109 | neuroligin family protein binding(GO:0097109) |
| 1.6 | 6.3 | GO:0032450 | maltose alpha-glucosidase activity(GO:0032450) |
| 1.6 | 7.9 | GO:0001010 | transcription factor activity, sequence-specific DNA binding transcription factor recruiting(GO:0001010) |
| 1.5 | 20.1 | GO:0070324 | thyroid hormone binding(GO:0070324) |
| 1.5 | 4.6 | GO:1990430 | extracellular matrix protein binding(GO:1990430) |
| 1.5 | 38.0 | GO:0005095 | GTPase inhibitor activity(GO:0005095) |
| 1.5 | 9.1 | GO:0017060 | 3-galactosyl-N-acetylglucosaminide 4-alpha-L-fucosyltransferase activity(GO:0017060) |
| 1.5 | 4.5 | GO:0042008 | interleukin-18 receptor activity(GO:0042008) |
| 1.5 | 4.5 | GO:0031731 | CCR6 chemokine receptor binding(GO:0031731) |
| 1.5 | 4.5 | GO:0052795 | exo-alpha-(2->3)-sialidase activity(GO:0052794) exo-alpha-(2->6)-sialidase activity(GO:0052795) exo-alpha-(2->8)-sialidase activity(GO:0052796) |
| 1.5 | 14.7 | GO:0005549 | odorant binding(GO:0005549) |
| 1.4 | 5.7 | GO:0099580 | ion antiporter activity involved in regulation of postsynaptic membrane potential(GO:0099580) |
| 1.4 | 2.8 | GO:0035663 | Toll-like receptor 2 binding(GO:0035663) |
| 1.4 | 116.8 | GO:0050840 | extracellular matrix binding(GO:0050840) |
| 1.3 | 4.0 | GO:0042285 | UDP-xylosyltransferase activity(GO:0035252) xylosyltransferase activity(GO:0042285) |
| 1.3 | 4.0 | GO:0032427 | GBD domain binding(GO:0032427) |
| 1.3 | 19.7 | GO:0042809 | vitamin D receptor binding(GO:0042809) |
| 1.3 | 13.8 | GO:0070679 | inositol 1,4,5 trisphosphate binding(GO:0070679) |
| 1.2 | 17.3 | GO:0035325 | Toll-like receptor binding(GO:0035325) |
| 1.2 | 4.9 | GO:0000309 | nicotinamide-nucleotide adenylyltransferase activity(GO:0000309) |
| 1.2 | 3.6 | GO:0004060 | arylamine N-acetyltransferase activity(GO:0004060) |
| 1.2 | 12.7 | GO:0051525 | NFAT protein binding(GO:0051525) |
| 1.1 | 26.1 | GO:0043325 | phosphatidylinositol-3,4-bisphosphate binding(GO:0043325) |
| 1.1 | 7.7 | GO:0016167 | glial cell-derived neurotrophic factor receptor activity(GO:0016167) |
| 1.1 | 22.4 | GO:0019992 | diacylglycerol binding(GO:0019992) |
| 1.0 | 6.0 | GO:0099583 | neurotransmitter receptor activity involved in regulation of postsynaptic cytosolic calcium ion concentration(GO:0099583) |
| 1.0 | 6.0 | GO:0016807 | cysteine-type carboxypeptidase activity(GO:0016807) cysteine-type exopeptidase activity(GO:0070004) |
| 1.0 | 11.9 | GO:0005344 | oxygen transporter activity(GO:0005344) |
| 1.0 | 4.9 | GO:0070097 | delta-catenin binding(GO:0070097) |
| 0.9 | 3.7 | GO:0047291 | neolactotetraosylceramide alpha-2,3-sialyltransferase activity(GO:0004513) lactosylceramide alpha-2,3-sialyltransferase activity(GO:0047291) |
| 0.9 | 3.7 | GO:0022850 | serotonin-gated cation channel activity(GO:0022850) |
| 0.9 | 3.6 | GO:0047708 | biotinidase activity(GO:0047708) |
| 0.9 | 2.7 | GO:0050567 | glutaminyl-tRNA synthase (glutamine-hydrolyzing) activity(GO:0050567) |
| 0.9 | 11.4 | GO:0001730 | 2'-5'-oligoadenylate synthetase activity(GO:0001730) |
| 0.9 | 3.4 | GO:0004667 | prostaglandin-D synthase activity(GO:0004667) |
| 0.9 | 12.8 | GO:0001161 | intronic transcription regulatory region sequence-specific DNA binding(GO:0001161) intronic transcription regulatory region DNA binding(GO:0044213) |
| 0.8 | 5.9 | GO:0008440 | inositol-1,4,5-trisphosphate 3-kinase activity(GO:0008440) |
| 0.8 | 5.1 | GO:0003998 | acylphosphatase activity(GO:0003998) |
| 0.8 | 5.0 | GO:0031694 | alpha-2A adrenergic receptor binding(GO:0031694) |
| 0.8 | 10.0 | GO:0005005 | transmembrane-ephrin receptor activity(GO:0005005) |
| 0.8 | 11.5 | GO:0008253 | 5'-nucleotidase activity(GO:0008253) |
| 0.8 | 4.9 | GO:0004704 | NF-kappaB-inducing kinase activity(GO:0004704) |
| 0.8 | 2.4 | GO:0004874 | aryl hydrocarbon receptor activity(GO:0004874) |
| 0.8 | 8.7 | GO:0017034 | Rap guanyl-nucleotide exchange factor activity(GO:0017034) |
| 0.8 | 11.7 | GO:0001222 | transcription corepressor binding(GO:0001222) |
| 0.8 | 2.3 | GO:0005136 | interleukin-4 receptor binding(GO:0005136) |
| 0.7 | 4.3 | GO:0060961 | phospholipase D inhibitor activity(GO:0060961) |
| 0.7 | 11.5 | GO:0004028 | 3-chloroallyl aldehyde dehydrogenase activity(GO:0004028) retinal binding(GO:0016918) |
| 0.7 | 7.9 | GO:0008559 | xenobiotic-transporting ATPase activity(GO:0008559) |
| 0.7 | 5.0 | GO:0043812 | phosphatidylinositol-4-phosphate phosphatase activity(GO:0043812) |
| 0.7 | 4.2 | GO:0008420 | CTD phosphatase activity(GO:0008420) |
| 0.7 | 22.7 | GO:0004033 | aldo-keto reductase (NADP) activity(GO:0004033) |
| 0.7 | 11.9 | GO:0008179 | adenylate cyclase binding(GO:0008179) |
| 0.7 | 13.2 | GO:0005112 | Notch binding(GO:0005112) |
| 0.7 | 21.6 | GO:0008157 | protein phosphatase 1 binding(GO:0008157) |
| 0.6 | 5.8 | GO:0003876 | AMP deaminase activity(GO:0003876) adenosine-phosphate deaminase activity(GO:0047623) |
| 0.6 | 1.9 | GO:0008336 | gamma-butyrobetaine dioxygenase activity(GO:0008336) |
| 0.6 | 3.2 | GO:0016647 | oxidoreductase activity, acting on the CH-NH group of donors, oxygen as acceptor(GO:0016647) |
| 0.6 | 3.2 | GO:0004800 | thyroxine 5'-deiodinase activity(GO:0004800) |
| 0.6 | 3.2 | GO:0003956 | NAD(P)+-protein-arginine ADP-ribosyltransferase activity(GO:0003956) |
| 0.6 | 6.3 | GO:0004972 | NMDA glutamate receptor activity(GO:0004972) |
| 0.6 | 18.1 | GO:0071949 | FAD binding(GO:0071949) |
| 0.6 | 2.5 | GO:0004687 | myosin light chain kinase activity(GO:0004687) |
| 0.6 | 7.3 | GO:0051434 | BH3 domain binding(GO:0051434) |
| 0.5 | 2.2 | GO:0004031 | aldehyde oxidase activity(GO:0004031) ethanol binding(GO:0035276) |
| 0.5 | 6.5 | GO:0022842 | leak channel activity(GO:0022840) narrow pore channel activity(GO:0022842) |
| 0.5 | 2.2 | GO:0004773 | steryl-sulfatase activity(GO:0004773) |
| 0.5 | 2.1 | GO:1901375 | acetylcholine transmembrane transporter activity(GO:0005277) acetate ester transmembrane transporter activity(GO:1901375) |
| 0.5 | 1.5 | GO:0004634 | phosphopyruvate hydratase activity(GO:0004634) |
| 0.5 | 17.5 | GO:1905030 | voltage-gated sodium channel activity(GO:0005248) voltage-gated ion channel activity involved in regulation of postsynaptic membrane potential(GO:1905030) |
| 0.5 | 3.0 | GO:0003796 | lysozyme activity(GO:0003796) |
| 0.5 | 4.5 | GO:0015277 | kainate selective glutamate receptor activity(GO:0015277) |
| 0.5 | 6.0 | GO:0042834 | peptidoglycan binding(GO:0042834) |
| 0.5 | 5.5 | GO:0003708 | retinoic acid receptor activity(GO:0003708) |
| 0.5 | 16.5 | GO:0001671 | ATPase activator activity(GO:0001671) |
| 0.5 | 6.5 | GO:0004716 | receptor signaling protein tyrosine kinase activity(GO:0004716) |
| 0.5 | 24.2 | GO:0030552 | cAMP binding(GO:0030552) |
| 0.5 | 3.4 | GO:0016714 | oxidoreductase activity, acting on paired donors, with incorporation or reduction of molecular oxygen, reduced pteridine as one donor, and incorporation of one atom of oxygen(GO:0016714) |
| 0.5 | 9.6 | GO:0016922 | ligand-dependent nuclear receptor binding(GO:0016922) |
| 0.5 | 10.0 | GO:0000062 | fatty-acyl-CoA binding(GO:0000062) |
| 0.4 | 7.5 | GO:0048018 | receptor agonist activity(GO:0048018) |
| 0.4 | 36.8 | GO:0004715 | non-membrane spanning protein tyrosine kinase activity(GO:0004715) |
| 0.4 | 9.9 | GO:0070403 | NAD+ binding(GO:0070403) |
| 0.4 | 1.3 | GO:0019959 | interleukin-8 binding(GO:0019959) |
| 0.4 | 5.6 | GO:0048407 | platelet-derived growth factor binding(GO:0048407) |
| 0.4 | 4.3 | GO:0035005 | 1-phosphatidylinositol-4-phosphate 3-kinase activity(GO:0035005) |
| 0.4 | 4.2 | GO:0008131 | primary amine oxidase activity(GO:0008131) |
| 0.4 | 4.2 | GO:0005172 | vascular endothelial growth factor receptor binding(GO:0005172) |
| 0.4 | 7.9 | GO:0050786 | RAGE receptor binding(GO:0050786) |
| 0.4 | 8.2 | GO:0030553 | cGMP binding(GO:0030553) |
| 0.4 | 12.2 | GO:0016769 | transferase activity, transferring nitrogenous groups(GO:0016769) |
| 0.4 | 3.1 | GO:0004022 | alcohol dehydrogenase (NAD) activity(GO:0004022) |
| 0.4 | 4.6 | GO:0005007 | fibroblast growth factor-activated receptor activity(GO:0005007) |
| 0.4 | 2.7 | GO:0008172 | S-methyltransferase activity(GO:0008172) |
| 0.4 | 2.3 | GO:0045029 | UDP-activated nucleotide receptor activity(GO:0045029) |
| 0.4 | 7.0 | GO:0038191 | neuropilin binding(GO:0038191) |
| 0.4 | 2.2 | GO:0016174 | NAD(P)H oxidase activity(GO:0016174) |
| 0.4 | 1.1 | GO:0030272 | 5-formyltetrahydrofolate cyclo-ligase activity(GO:0030272) |
| 0.3 | 10.1 | GO:0031624 | ubiquitin conjugating enzyme binding(GO:0031624) |
| 0.3 | 64.5 | GO:0001078 | transcriptional repressor activity, RNA polymerase II core promoter proximal region sequence-specific binding(GO:0001078) |
| 0.3 | 2.4 | GO:0004137 | deoxycytidine kinase activity(GO:0004137) thymidine kinase activity(GO:0004797) |
| 0.3 | 3.1 | GO:0015143 | urate transmembrane transporter activity(GO:0015143) salt transmembrane transporter activity(GO:1901702) |
| 0.3 | 7.4 | GO:0002162 | dystroglycan binding(GO:0002162) |
| 0.3 | 3.4 | GO:0004064 | arylesterase activity(GO:0004064) |
| 0.3 | 1.3 | GO:0061513 | hexose phosphate transmembrane transporter activity(GO:0015119) organophosphate:inorganic phosphate antiporter activity(GO:0015315) hexose-phosphate:inorganic phosphate antiporter activity(GO:0015526) glucose 6-phosphate:inorganic phosphate antiporter activity(GO:0061513) |
| 0.3 | 5.6 | GO:0004861 | cyclin-dependent protein serine/threonine kinase inhibitor activity(GO:0004861) |
| 0.3 | 1.3 | GO:0001588 | dopamine neurotransmitter receptor activity, coupled via Gs(GO:0001588) |
| 0.3 | 8.5 | GO:0005109 | frizzled binding(GO:0005109) |
| 0.3 | 1.3 | GO:0031716 | calcitonin receptor binding(GO:0031716) |
| 0.3 | 5.0 | GO:0015250 | water channel activity(GO:0015250) |
| 0.3 | 1.2 | GO:0052590 | sn-glycerol-3-phosphate:ubiquinone oxidoreductase activity(GO:0052590) sn-glycerol-3-phosphate:ubiquinone-8 oxidoreductase activity(GO:0052591) |
| 0.3 | 0.3 | GO:0090555 | phosphatidylethanolamine-translocating ATPase activity(GO:0090555) |
| 0.3 | 7.5 | GO:0008175 | tRNA methyltransferase activity(GO:0008175) |
| 0.3 | 5.7 | GO:0008391 | arachidonic acid monooxygenase activity(GO:0008391) arachidonic acid epoxygenase activity(GO:0008392) |
| 0.3 | 4.4 | GO:0008140 | cAMP response element binding protein binding(GO:0008140) |
| 0.3 | 5.2 | GO:0017160 | Ral GTPase binding(GO:0017160) |
| 0.3 | 1.4 | GO:0019763 | immunoglobulin receptor activity(GO:0019763) |
| 0.3 | 2.9 | GO:0015385 | sodium:proton antiporter activity(GO:0015385) potassium:proton antiporter activity(GO:0015386) |
| 0.3 | 9.9 | GO:0071889 | 14-3-3 protein binding(GO:0071889) |
| 0.3 | 11.3 | GO:0050699 | WW domain binding(GO:0050699) |
| 0.3 | 2.7 | GO:0031386 | protein tag(GO:0031386) |
| 0.3 | 3.5 | GO:0016909 | JUN kinase activity(GO:0004705) SAP kinase activity(GO:0016909) |
| 0.3 | 7.8 | GO:0003887 | DNA-directed DNA polymerase activity(GO:0003887) |
| 0.3 | 7.7 | GO:0001965 | G-protein alpha-subunit binding(GO:0001965) |
| 0.3 | 9.2 | GO:0008188 | neuropeptide receptor activity(GO:0008188) |
| 0.3 | 3.8 | GO:0031432 | titin binding(GO:0031432) |
| 0.3 | 12.3 | GO:0001103 | RNA polymerase II repressing transcription factor binding(GO:0001103) |
| 0.3 | 31.5 | GO:0004222 | metalloendopeptidase activity(GO:0004222) |
| 0.2 | 12.5 | GO:0001099 | basal transcription machinery binding(GO:0001098) basal RNA polymerase II transcription machinery binding(GO:0001099) |
| 0.2 | 4.7 | GO:0016493 | C-C chemokine receptor activity(GO:0016493) |
| 0.2 | 2.7 | GO:0035612 | AP-2 adaptor complex binding(GO:0035612) |
| 0.2 | 3.5 | GO:0051864 | histone demethylase activity (H3-K36 specific)(GO:0051864) |
| 0.2 | 4.7 | GO:0050811 | GABA receptor binding(GO:0050811) |
| 0.2 | 8.4 | GO:0043539 | protein serine/threonine kinase activator activity(GO:0043539) |
| 0.2 | 4.2 | GO:0001055 | RNA polymerase II activity(GO:0001055) |
| 0.2 | 5.5 | GO:0035198 | miRNA binding(GO:0035198) |
| 0.2 | 1.1 | GO:0004826 | phenylalanine-tRNA ligase activity(GO:0004826) |
| 0.2 | 4.4 | GO:0099589 | serotonin receptor activity(GO:0099589) |
| 0.2 | 4.0 | GO:0015467 | G-protein activated inward rectifier potassium channel activity(GO:0015467) |
| 0.2 | 19.8 | GO:0000980 | RNA polymerase II distal enhancer sequence-specific DNA binding(GO:0000980) |
| 0.2 | 2.9 | GO:0047617 | acyl-CoA hydrolase activity(GO:0047617) |
| 0.2 | 1.0 | GO:0004771 | sterol esterase activity(GO:0004771) |
| 0.2 | 3.9 | GO:0004012 | phospholipid-translocating ATPase activity(GO:0004012) |
| 0.2 | 4.2 | GO:0034237 | protein kinase A regulatory subunit binding(GO:0034237) |
| 0.2 | 0.8 | GO:0004706 | JUN kinase kinase kinase activity(GO:0004706) |
| 0.2 | 5.8 | GO:0004602 | glutathione peroxidase activity(GO:0004602) |
| 0.2 | 2.1 | GO:0005229 | intracellular calcium activated chloride channel activity(GO:0005229) |
| 0.2 | 7.8 | GO:0005164 | tumor necrosis factor receptor binding(GO:0005164) |
| 0.2 | 6.2 | GO:0043027 | cysteine-type endopeptidase inhibitor activity involved in apoptotic process(GO:0043027) |
| 0.2 | 4.3 | GO:0042166 | acetylcholine binding(GO:0042166) |
| 0.2 | 3.9 | GO:0004435 | phosphatidylinositol phospholipase C activity(GO:0004435) |
| 0.2 | 4.7 | GO:0005086 | ARF guanyl-nucleotide exchange factor activity(GO:0005086) |
| 0.2 | 19.1 | GO:0005089 | Rho guanyl-nucleotide exchange factor activity(GO:0005089) |
| 0.2 | 30.8 | GO:0004252 | serine-type endopeptidase activity(GO:0004252) |
| 0.2 | 3.7 | GO:0005521 | lamin binding(GO:0005521) |
| 0.2 | 1.7 | GO:0086056 | voltage-gated calcium channel activity involved in AV node cell action potential(GO:0086056) |
| 0.1 | 6.8 | GO:0005484 | SNAP receptor activity(GO:0005484) |
| 0.1 | 3.6 | GO:0000030 | mannosyltransferase activity(GO:0000030) |
| 0.1 | 5.6 | GO:0005246 | calcium channel regulator activity(GO:0005246) |
| 0.1 | 2.4 | GO:0015095 | magnesium ion transmembrane transporter activity(GO:0015095) |
| 0.1 | 6.7 | GO:0036002 | pre-mRNA binding(GO:0036002) |
| 0.1 | 4.8 | GO:0004890 | GABA-A receptor activity(GO:0004890) |
| 0.1 | 2.1 | GO:0045294 | alpha-catenin binding(GO:0045294) |
| 0.1 | 31.5 | GO:0005085 | guanyl-nucleotide exchange factor activity(GO:0005085) |
| 0.1 | 3.1 | GO:0008574 | ATP-dependent microtubule motor activity, plus-end-directed(GO:0008574) |
| 0.1 | 2.1 | GO:0008499 | UDP-galactose:beta-N-acetylglucosamine beta-1,3-galactosyltransferase activity(GO:0008499) |
| 0.1 | 4.4 | GO:0005184 | neuropeptide hormone activity(GO:0005184) |
| 0.1 | 4.0 | GO:0030332 | cyclin binding(GO:0030332) |
| 0.1 | 4.0 | GO:0004364 | glutathione transferase activity(GO:0004364) |
| 0.1 | 0.7 | GO:0031697 | beta-1 adrenergic receptor binding(GO:0031697) |
| 0.1 | 0.7 | GO:0086083 | cell adhesive protein binding involved in bundle of His cell-Purkinje myocyte communication(GO:0086083) |
| 0.1 | 1.4 | GO:0005242 | inward rectifier potassium channel activity(GO:0005242) |
| 0.1 | 1.5 | GO:0004143 | diacylglycerol kinase activity(GO:0004143) |
| 0.1 | 0.3 | GO:0004613 | phosphoenolpyruvate carboxykinase activity(GO:0004611) phosphoenolpyruvate carboxykinase (GTP) activity(GO:0004613) |
| 0.1 | 8.6 | GO:0004713 | protein tyrosine kinase activity(GO:0004713) |
| 0.1 | 0.4 | GO:0003883 | CTP synthase activity(GO:0003883) |
| 0.1 | 1.7 | GO:0005522 | profilin binding(GO:0005522) |
| 0.1 | 0.5 | GO:0005237 | inhibitory extracellular ligand-gated ion channel activity(GO:0005237) extracellular-glycine-gated ion channel activity(GO:0016933) extracellular-glycine-gated chloride channel activity(GO:0016934) |
| 0.1 | 11.2 | GO:0031072 | heat shock protein binding(GO:0031072) |
| 0.1 | 3.4 | GO:0008009 | chemokine activity(GO:0008009) |
| 0.1 | 4.1 | GO:0032934 | cholesterol binding(GO:0015485) sterol binding(GO:0032934) |
| 0.1 | 3.6 | GO:0022834 | ligand-gated ion channel activity(GO:0015276) ligand-gated channel activity(GO:0022834) |
| 0.1 | 1.8 | GO:0017147 | Wnt-protein binding(GO:0017147) |
| 0.1 | 1.3 | GO:0042800 | histone methyltransferase activity (H3-K4 specific)(GO:0042800) |
| 0.1 | 0.4 | GO:0004013 | adenosylhomocysteinase activity(GO:0004013) trialkylsulfonium hydrolase activity(GO:0016802) |
| 0.1 | 5.8 | GO:0004984 | olfactory receptor activity(GO:0004984) |
| 0.1 | 11.1 | GO:0017137 | Rab GTPase binding(GO:0017137) |
| 0.1 | 0.7 | GO:0031404 | chloride ion binding(GO:0031404) |
| 0.1 | 6.7 | GO:0019208 | phosphatase regulator activity(GO:0019208) |
| 0.1 | 1.9 | GO:0005044 | scavenger receptor activity(GO:0005044) |
| 0.1 | 1.1 | GO:0001106 | RNA polymerase II transcription corepressor activity(GO:0001106) |
| 0.1 | 2.2 | GO:0004385 | guanylate kinase activity(GO:0004385) |
| 0.1 | 0.7 | GO:0047372 | acylglycerol lipase activity(GO:0047372) |
| 0.0 | 1.2 | GO:0005546 | phosphatidylinositol-4,5-bisphosphate binding(GO:0005546) |
| 0.0 | 0.8 | GO:0017075 | syntaxin-1 binding(GO:0017075) |
| 0.0 | 0.1 | GO:0008511 | sodium:potassium:chloride symporter activity(GO:0008511) |
| 0.0 | 0.1 | GO:0061609 | fructose-1-phosphate aldolase activity(GO:0061609) |
| 0.0 | 0.6 | GO:0004709 | MAP kinase kinase kinase activity(GO:0004709) |
| 0.0 | 1.3 | GO:0005249 | voltage-gated potassium channel activity(GO:0005249) |
| 0.0 | 1.5 | GO:0051117 | ATPase binding(GO:0051117) |
| 0.0 | 0.4 | GO:0008395 | steroid hydroxylase activity(GO:0008395) |
| 0.0 | 1.3 | GO:0001227 | transcriptional repressor activity, RNA polymerase II transcription regulatory region sequence-specific binding(GO:0001227) |
| 0.0 | 0.1 | GO:0030215 | semaphorin receptor binding(GO:0030215) |
Gene overrepresentation in curated gene sets: canonical pathways category:
| Log-likelihood per target | Total log-likelihood | Term | Description |
|---|---|---|---|
| 3.6 | 83.8 | PID TCR JNK PATHWAY | JNK signaling in the CD4+ TCR pathway |
| 2.3 | 116.0 | NABA PROTEOGLYCANS | Genes encoding proteoglycans |
| 1.7 | 271.1 | PID BETA CATENIN NUC PATHWAY | Regulation of nuclear beta catenin signaling and target gene transcription |
| 1.5 | 61.9 | SA B CELL RECEPTOR COMPLEXES | Antigen binding to B cell receptors activates protein tyrosine kinases, such as the Src family, which ultimate activate MAP kinases. |
| 1.4 | 20.2 | ST G ALPHA S PATHWAY | G alpha s Pathway |
| 1.4 | 21.3 | ST INTERFERON GAMMA PATHWAY | Interferon gamma pathway. |
| 1.3 | 26.3 | PID IL5 PATHWAY | IL5-mediated signaling events |
| 1.0 | 31.0 | PID TOLL ENDOGENOUS PATHWAY | Endogenous TLR signaling |
| 0.9 | 49.8 | PID BCR 5PATHWAY | BCR signaling pathway |
| 0.9 | 17.1 | PID P38 GAMMA DELTA PATHWAY | Signaling mediated by p38-gamma and p38-delta |
| 0.8 | 15.3 | PID CIRCADIAN PATHWAY | Circadian rhythm pathway |
| 0.8 | 7.2 | PID CXCR4 PATHWAY | CXCR4-mediated signaling events |
| 0.8 | 34.8 | PID FCER1 PATHWAY | Fc-epsilon receptor I signaling in mast cells |
| 0.8 | 60.0 | PID TCR PATHWAY | TCR signaling in naïve CD4+ T cells |
| 0.7 | 8.7 | PID NFKAPPAB ATYPICAL PATHWAY | Atypical NF-kappaB pathway |
| 0.7 | 21.9 | PID NETRIN PATHWAY | Netrin-mediated signaling events |
| 0.6 | 6.4 | PID RAS PATHWAY | Regulation of Ras family activation |
| 0.6 | 13.8 | PID RXR VDR PATHWAY | RXR and RAR heterodimerization with other nuclear receptor |
| 0.6 | 21.1 | PID MYC PATHWAY | C-MYC pathway |
| 0.6 | 21.7 | PID IL2 STAT5 PATHWAY | IL2 signaling events mediated by STAT5 |
| 0.6 | 21.1 | ST ERK1 ERK2 MAPK PATHWAY | ERK1/ERK2 MAPK Pathway |
| 0.5 | 17.6 | SIG PIP3 SIGNALING IN B LYMPHOCYTES | Genes related to PIP3 signaling in B lymphocytes |
| 0.5 | 7.1 | PID ATF2 PATHWAY | ATF-2 transcription factor network |
| 0.5 | 17.7 | SA CASPASE CASCADE | Apoptosis is mediated by caspases, cysteine proteases arranged in a proteolytic cascade. |
| 0.5 | 63.1 | PID PDGFRB PATHWAY | PDGFR-beta signaling pathway |
| 0.5 | 26.6 | PID MTOR 4PATHWAY | mTOR signaling pathway |
| 0.5 | 10.0 | PID EPHRINB REV PATHWAY | Ephrin B reverse signaling |
| 0.4 | 10.0 | ST TUMOR NECROSIS FACTOR PATHWAY | Tumor Necrosis Factor Pathway. |
| 0.4 | 9.1 | PID PI3KCI PATHWAY | Class I PI3K signaling events |
| 0.4 | 15.0 | PID NCADHERIN PATHWAY | N-cadherin signaling events |
| 0.4 | 2.3 | PID EPHA2 FWD PATHWAY | EPHA2 forward signaling |
| 0.4 | 7.8 | PID DNA PK PATHWAY | DNA-PK pathway in nonhomologous end joining |
| 0.3 | 7.8 | PID TRAIL PATHWAY | TRAIL signaling pathway |
| 0.3 | 4.8 | PID IL12 STAT4 PATHWAY | IL12 signaling mediated by STAT4 |
| 0.3 | 4.7 | PID ERB GENOMIC PATHWAY | Validated nuclear estrogen receptor beta network |
| 0.3 | 5.8 | PID KIT PATHWAY | Signaling events mediated by Stem cell factor receptor (c-Kit) |
| 0.3 | 13.5 | PID INTEGRIN2 PATHWAY | Beta2 integrin cell surface interactions |
| 0.3 | 18.0 | PID RHOA REG PATHWAY | Regulation of RhoA activity |
| 0.3 | 8.0 | PID ALPHA SYNUCLEIN PATHWAY | Alpha-synuclein signaling |
| 0.3 | 13.2 | PID IL4 2PATHWAY | IL4-mediated signaling events |
| 0.2 | 4.8 | PID TRKR PATHWAY | Neurotrophic factor-mediated Trk receptor signaling |
| 0.2 | 5.6 | PID NFAT TFPATHWAY | Calcineurin-regulated NFAT-dependent transcription in lymphocytes |
| 0.2 | 5.6 | PID ENDOTHELIN PATHWAY | Endothelins |
| 0.2 | 8.5 | PID ARF6 PATHWAY | Arf6 signaling events |
| 0.2 | 7.2 | PID RHODOPSIN PATHWAY | Visual signal transduction: Rods |
| 0.2 | 8.2 | PID PTP1B PATHWAY | Signaling events mediated by PTP1B |
| 0.2 | 10.7 | PID HEDGEHOG GLI PATHWAY | Hedgehog signaling events mediated by Gli proteins |
| 0.2 | 3.0 | PID LPA4 PATHWAY | LPA4-mediated signaling events |
| 0.2 | 1.3 | PID IL8 CXCR1 PATHWAY | IL8- and CXCR1-mediated signaling events |
| 0.2 | 5.5 | PID RETINOIC ACID PATHWAY | Retinoic acid receptors-mediated signaling |
| 0.2 | 3.4 | ST WNT BETA CATENIN PATHWAY | Wnt/beta-catenin Pathway |
| 0.2 | 2.4 | PID HIF1A PATHWAY | Hypoxic and oxygen homeostasis regulation of HIF-1-alpha |
| 0.1 | 5.8 | PID INTEGRIN A4B1 PATHWAY | Alpha4 beta1 integrin signaling events |
| 0.1 | 4.0 | PID IL12 2PATHWAY | IL12-mediated signaling events |
| 0.1 | 4.4 | PID ERBB NETWORK PATHWAY | ErbB receptor signaling network |
| 0.1 | 5.2 | PID SHP2 PATHWAY | SHP2 signaling |
| 0.1 | 4.0 | PID FGF PATHWAY | FGF signaling pathway |
| 0.1 | 2.8 | PID UPA UPAR PATHWAY | Urokinase-type plasminogen activator (uPA) and uPAR-mediated signaling |
| 0.1 | 26.5 | NABA ECM GLYCOPROTEINS | Genes encoding structural ECM glycoproteins |
| 0.1 | 12.8 | PID CMYB PATHWAY | C-MYB transcription factor network |
| 0.1 | 1.8 | PID P38 ALPHA BETA PATHWAY | Regulation of p38-alpha and p38-beta |
| 0.1 | 2.8 | PID ANGIOPOIETIN RECEPTOR PATHWAY | Angiopoietin receptor Tie2-mediated signaling |
| 0.1 | 7.6 | PID HDAC CLASSI PATHWAY | Signaling events mediated by HDAC Class I |
| 0.1 | 19.7 | NABA ECM AFFILIATED | Genes encoding proteins affiliated structurally or functionally to extracellular matrix proteins |
| 0.1 | 2.4 | ST GA13 PATHWAY | G alpha 13 Pathway |
| 0.1 | 4.2 | PID BMP PATHWAY | BMP receptor signaling |
| 0.1 | 3.9 | PID LKB1 PATHWAY | LKB1 signaling events |
| 0.1 | 1.8 | PID WNT SIGNALING PATHWAY | Wnt signaling network |
| 0.1 | 0.8 | PID IFNG PATHWAY | IFN-gamma pathway |
| 0.1 | 0.6 | PID P38 MKK3 6PATHWAY | p38 MAPK signaling pathway |
| 0.0 | 0.4 | PID VEGF VEGFR PATHWAY | VEGF and VEGFR signaling network |
| 0.0 | 0.1 | PID AVB3 INTEGRIN PATHWAY | Integrins in angiogenesis |
| 0.0 | 0.2 | PID MAPK TRK PATHWAY | Trk receptor signaling mediated by the MAPK pathway |
Gene overrepresentation in curated gene sets: REACTOME pathways category:
| Log-likelihood per target | Total log-likelihood | Term | Description |
|---|---|---|---|
| 4.8 | 129.9 | REACTOME CS DS DEGRADATION | Genes involved in CS/DS degradation |
| 3.5 | 261.9 | REACTOME MYOGENESIS | Genes involved in Myogenesis |
| 2.9 | 76.5 | REACTOME TRAFFICKING OF GLUR2 CONTAINING AMPA RECEPTORS | Genes involved in Trafficking of GluR2-containing AMPA receptors |
| 2.9 | 34.6 | REACTOME DIGESTION OF DIETARY CARBOHYDRATE | Genes involved in Digestion of dietary carbohydrate |
| 2.4 | 55.9 | REACTOME TERMINATION OF O GLYCAN BIOSYNTHESIS | Genes involved in Termination of O-glycan biosynthesis |
| 2.1 | 70.1 | REACTOME REGULATION OF SIGNALING BY CBL | Genes involved in Regulation of signaling by CBL |
| 1.6 | 33.3 | REACTOME TRANSLOCATION OF ZAP 70 TO IMMUNOLOGICAL SYNAPSE | Genes involved in Translocation of ZAP-70 to Immunological synapse |
| 1.4 | 13.5 | REACTOME BETA DEFENSINS | Genes involved in Beta defensins |
| 1.1 | 8.0 | REACTOME TRYPTOPHAN CATABOLISM | Genes involved in Tryptophan catabolism |
| 1.1 | 8.7 | REACTOME ACTIVATION OF NF KAPPAB IN B CELLS | Genes involved in Activation of NF-kappaB in B Cells |
| 1.0 | 5.0 | REACTOME ACTIVATION OF THE AP1 FAMILY OF TRANSCRIPTION FACTORS | Genes involved in Activation of the AP-1 family of transcription factors |
| 0.9 | 22.4 | REACTOME ACETYLCHOLINE NEUROTRANSMITTER RELEASE CYCLE | Genes involved in Acetylcholine Neurotransmitter Release Cycle |
| 0.9 | 7.3 | REACTOME REGULATION OF GENE EXPRESSION IN BETA CELLS | Genes involved in Regulation of gene expression in beta cells |
| 0.9 | 34.6 | REACTOME RAP1 SIGNALLING | Genes involved in Rap1 signalling |
| 0.8 | 22.5 | REACTOME THE ROLE OF NEF IN HIV1 REPLICATION AND DISEASE PATHOGENESIS | Genes involved in The role of Nef in HIV-1 replication and disease pathogenesis |
| 0.8 | 5.4 | REACTOME TANDEM PORE DOMAIN POTASSIUM CHANNELS | Genes involved in Tandem pore domain potassium channels |
| 0.8 | 19.4 | REACTOME OTHER SEMAPHORIN INTERACTIONS | Genes involved in Other semaphorin interactions |
| 0.8 | 11.5 | REACTOME PURINE CATABOLISM | Genes involved in Purine catabolism |
| 0.7 | 10.7 | REACTOME ANTIGEN ACTIVATES B CELL RECEPTOR LEADING TO GENERATION OF SECOND MESSENGERS | Genes involved in Antigen Activates B Cell Receptor Leading to Generation of Second Messengers |
| 0.7 | 14.5 | REACTOME CHYLOMICRON MEDIATED LIPID TRANSPORT | Genes involved in Chylomicron-mediated lipid transport |
| 0.5 | 12.4 | REACTOME REGULATION OF IFNG SIGNALING | Genes involved in Regulation of IFNG signaling |
| 0.5 | 54.9 | REACTOME NUCLEAR RECEPTOR TRANSCRIPTION PATHWAY | Genes involved in Nuclear Receptor transcription pathway |
| 0.5 | 8.8 | REACTOME ACTIVATION OF CHAPERONES BY ATF6 ALPHA | Genes involved in Activation of Chaperones by ATF6-alpha |
| 0.5 | 30.0 | REACTOME VOLTAGE GATED POTASSIUM CHANNELS | Genes involved in Voltage gated Potassium channels |
| 0.5 | 4.8 | REACTOME ROLE OF SECOND MESSENGERS IN NETRIN1 SIGNALING | Genes involved in Role of second messengers in netrin-1 signaling |
| 0.4 | 6.6 | REACTOME ROLE OF DCC IN REGULATING APOPTOSIS | Genes involved in Role of DCC in regulating apoptosis |
| 0.4 | 12.5 | REACTOME BRANCHED CHAIN AMINO ACID CATABOLISM | Genes involved in Branched-chain amino acid catabolism |
| 0.4 | 5.0 | REACTOME PASSIVE TRANSPORT BY AQUAPORINS | Genes involved in Passive Transport by Aquaporins |
| 0.4 | 7.6 | REACTOME INSULIN SYNTHESIS AND PROCESSING | Genes involved in Insulin Synthesis and Processing |
| 0.4 | 4.0 | REACTOME TOLL RECEPTOR CASCADES | Genes involved in Toll Receptor Cascades |
| 0.4 | 8.2 | REACTOME GENERATION OF SECOND MESSENGER MOLECULES | Genes involved in Generation of second messenger molecules |
| 0.4 | 15.3 | REACTOME CGMP EFFECTS | Genes involved in cGMP effects |
| 0.4 | 31.7 | REACTOME OLFACTORY SIGNALING PATHWAY | Genes involved in Olfactory Signaling Pathway |
| 0.4 | 9.5 | REACTOME JNK C JUN KINASES PHOSPHORYLATION AND ACTIVATION MEDIATED BY ACTIVATED HUMAN TAK1 | Genes involved in JNK (c-Jun kinases) phosphorylation and activation mediated by activated human TAK1 |
| 0.3 | 7.3 | REACTOME ACTIVATION OF BH3 ONLY PROTEINS | Genes involved in Activation of BH3-only proteins |
| 0.3 | 6.2 | REACTOME NOD1 2 SIGNALING PATHWAY | Genes involved in NOD1/2 Signaling Pathway |
| 0.3 | 9.7 | REACTOME HS GAG BIOSYNTHESIS | Genes involved in HS-GAG biosynthesis |
| 0.3 | 4.8 | REACTOME SIGNAL ATTENUATION | Genes involved in Signal attenuation |
| 0.3 | 5.7 | REACTOME XENOBIOTICS | Genes involved in Xenobiotics |
| 0.3 | 6.8 | REACTOME PROTEOLYTIC CLEAVAGE OF SNARE COMPLEX PROTEINS | Genes involved in Proteolytic cleavage of SNARE complex proteins |
| 0.3 | 54.8 | REACTOME SIGNALING BY RHO GTPASES | Genes involved in Signaling by Rho GTPases |
| 0.3 | 5.7 | REACTOME PLATELET CALCIUM HOMEOSTASIS | Genes involved in Platelet calcium homeostasis |
| 0.3 | 8.2 | REACTOME PROLACTIN RECEPTOR SIGNALING | Genes involved in Prolactin receptor signaling |
| 0.3 | 6.1 | REACTOME AMINE DERIVED HORMONES | Genes involved in Amine-derived hormones |
| 0.3 | 18.2 | REACTOME NOTCH1 INTRACELLULAR DOMAIN REGULATES TRANSCRIPTION | Genes involved in NOTCH1 Intracellular Domain Regulates Transcription |
| 0.3 | 7.8 | REACTOME EXTRINSIC PATHWAY FOR APOPTOSIS | Genes involved in Extrinsic Pathway for Apoptosis |
| 0.3 | 9.1 | REACTOME CASPASE MEDIATED CLEAVAGE OF CYTOSKELETAL PROTEINS | Genes involved in Caspase-mediated cleavage of cytoskeletal proteins |
| 0.3 | 4.6 | REACTOME BMAL1 CLOCK NPAS2 ACTIVATES CIRCADIAN EXPRESSION | Genes involved in BMAL1:CLOCK/NPAS2 Activates Circadian Expression |
| 0.3 | 5.0 | REACTOME TAK1 ACTIVATES NFKB BY PHOSPHORYLATION AND ACTIVATION OF IKKS COMPLEX | Genes involved in TAK1 activates NFkB by phosphorylation and activation of IKKs complex |
| 0.3 | 6.3 | REACTOME UNBLOCKING OF NMDA RECEPTOR GLUTAMATE BINDING AND ACTIVATION | Genes involved in Unblocking of NMDA receptor, glutamate binding and activation |
| 0.3 | 26.3 | REACTOME TRANSCRIPTIONAL REGULATION OF WHITE ADIPOCYTE DIFFERENTIATION | Genes involved in Transcriptional Regulation of White Adipocyte Differentiation |
| 0.2 | 21.2 | REACTOME IMMUNOREGULATORY INTERACTIONS BETWEEN A LYMPHOID AND A NON LYMPHOID CELL | Genes involved in Immunoregulatory interactions between a Lymphoid and a non-Lymphoid cell |
| 0.2 | 15.2 | REACTOME CHEMOKINE RECEPTORS BIND CHEMOKINES | Genes involved in Chemokine receptors bind chemokines |
| 0.2 | 3.8 | REACTOME AKT PHOSPHORYLATES TARGETS IN THE CYTOSOL | Genes involved in AKT phosphorylates targets in the cytosol |
| 0.2 | 4.0 | REACTOME MTORC1 MEDIATED SIGNALLING | Genes involved in mTORC1-mediated signalling |
| 0.2 | 4.4 | REACTOME SHC1 EVENTS IN ERBB4 SIGNALING | Genes involved in SHC1 events in ERBB4 signaling |
| 0.2 | 43.1 | REACTOME G ALPHA I SIGNALLING EVENTS | Genes involved in G alpha (i) signalling events |
| 0.2 | 8.9 | REACTOME LIGAND GATED ION CHANNEL TRANSPORT | Genes involved in Ligand-gated ion channel transport |
| 0.2 | 4.0 | REACTOME GABA B RECEPTOR ACTIVATION | Genes involved in GABA B receptor activation |
| 0.2 | 1.5 | REACTOME DOWNSTREAM SIGNAL TRANSDUCTION | Genes involved in Downstream signal transduction |
| 0.2 | 4.3 | REACTOME PRESYNAPTIC NICOTINIC ACETYLCHOLINE RECEPTORS | Genes involved in Presynaptic nicotinic acetylcholine receptors |
| 0.2 | 2.2 | REACTOME THE ACTIVATION OF ARYLSULFATASES | Genes involved in The activation of arylsulfatases |
| 0.2 | 8.2 | REACTOME ABC FAMILY PROTEINS MEDIATED TRANSPORT | Genes involved in ABC-family proteins mediated transport |
| 0.2 | 5.8 | REACTOME SIGNALING BY ERBB2 | Genes involved in Signaling by ERBB2 |
| 0.2 | 3.8 | REACTOME SIGNALING BY HIPPO | Genes involved in Signaling by Hippo |
| 0.2 | 4.2 | REACTOME VIRAL MESSENGER RNA SYNTHESIS | Genes involved in Viral Messenger RNA Synthesis |
| 0.2 | 7.3 | REACTOME LATENT INFECTION OF HOMO SAPIENS WITH MYCOBACTERIUM TUBERCULOSIS | Genes involved in Latent infection of Homo sapiens with Mycobacterium tuberculosis |
| 0.2 | 14.6 | REACTOME CLASS B 2 SECRETIN FAMILY RECEPTORS | Genes involved in Class B/2 (Secretin family receptors) |
| 0.2 | 4.0 | REACTOME FGFR2C LIGAND BINDING AND ACTIVATION | Genes involved in FGFR2c ligand binding and activation |
| 0.2 | 3.0 | REACTOME SIGNALING BY FGFR1 FUSION MUTANTS | Genes involved in Signaling by FGFR1 fusion mutants |
| 0.2 | 2.8 | REACTOME INTRINSIC PATHWAY FOR APOPTOSIS | Genes involved in Intrinsic Pathway for Apoptosis |
| 0.2 | 1.4 | REACTOME EGFR DOWNREGULATION | Genes involved in EGFR downregulation |
| 0.1 | 3.1 | REACTOME ENDOSOMAL SORTING COMPLEX REQUIRED FOR TRANSPORT ESCRT | Genes involved in Endosomal Sorting Complex Required For Transport (ESCRT) |
| 0.1 | 2.6 | REACTOME APOPTOTIC CLEAVAGE OF CELLULAR PROTEINS | Genes involved in Apoptotic cleavage of cellular proteins |
| 0.1 | 3.9 | REACTOME ACTIVATION OF KAINATE RECEPTORS UPON GLUTAMATE BINDING | Genes involved in Activation of Kainate Receptors upon glutamate binding |
| 0.1 | 3.0 | REACTOME LYSOSOME VESICLE BIOGENESIS | Genes involved in Lysosome Vesicle Biogenesis |
| 0.1 | 4.7 | REACTOME INTERACTION BETWEEN L1 AND ANKYRINS | Genes involved in Interaction between L1 and Ankyrins |
| 0.1 | 3.6 | REACTOME BIOSYNTHESIS OF THE N GLYCAN PRECURSOR DOLICHOL LIPID LINKED OLIGOSACCHARIDE LLO AND TRANSFER TO A NASCENT PROTEIN | Genes involved in Biosynthesis of the N-glycan precursor (dolichol lipid-linked oligosaccharide, LLO) and transfer to a nascent protein |
| 0.1 | 1.7 | REACTOME INHIBITION OF INSULIN SECRETION BY ADRENALINE NORADRENALINE | Genes involved in Inhibition of Insulin Secretion by Adrenaline/Noradrenaline |
| 0.1 | 4.3 | REACTOME GLYCOSPHINGOLIPID METABOLISM | Genes involved in Glycosphingolipid metabolism |
| 0.1 | 5.8 | REACTOME MEIOTIC SYNAPSIS | Genes involved in Meiotic Synapsis |
| 0.1 | 3.9 | REACTOME GLUTATHIONE CONJUGATION | Genes involved in Glutathione conjugation |
| 0.1 | 9.8 | REACTOME INTERFERON ALPHA BETA SIGNALING | Genes involved in Interferon alpha/beta signaling |
| 0.1 | 2.4 | REACTOME AMYLOIDS | Genes involved in Amyloids |
| 0.1 | 0.6 | REACTOME SIGNALING BY SCF KIT | Genes involved in Signaling by SCF-KIT |
| 0.1 | 2.2 | REACTOME DOWNREGULATION OF TGF BETA RECEPTOR SIGNALING | Genes involved in Downregulation of TGF-beta receptor signaling |
| 0.1 | 1.1 | REACTOME MITOCHONDRIAL TRNA AMINOACYLATION | Genes involved in Mitochondrial tRNA aminoacylation |
| 0.1 | 12.7 | REACTOME METABOLISM OF AMINO ACIDS AND DERIVATIVES | Genes involved in Metabolism of amino acids and derivatives |
| 0.1 | 2.4 | REACTOME DEGRADATION OF THE EXTRACELLULAR MATRIX | Genes involved in Degradation of the extracellular matrix |
| 0.1 | 9.0 | REACTOME G ALPHA Q SIGNALLING EVENTS | Genes involved in G alpha (q) signalling events |
| 0.1 | 15.0 | REACTOME GENERIC TRANSCRIPTION PATHWAY | Genes involved in Generic Transcription Pathway |
| 0.0 | 2.1 | REACTOME ION TRANSPORT BY P TYPE ATPASES | Genes involved in Ion transport by P-type ATPases |
| 0.0 | 1.8 | REACTOME COLLAGEN FORMATION | Genes involved in Collagen formation |
| 0.0 | 0.5 | REACTOME SYNTHESIS OF BILE ACIDS AND BILE SALTS VIA 24 HYDROXYCHOLESTEROL | Genes involved in Synthesis of bile acids and bile salts via 24-hydroxycholesterol |
| 0.0 | 2.5 | REACTOME NCAM1 INTERACTIONS | Genes involved in NCAM1 interactions |
| 0.0 | 0.7 | REACTOME NEPHRIN INTERACTIONS | Genes involved in Nephrin interactions |
| 0.0 | 2.2 | REACTOME TRANSPORT OF MATURE TRANSCRIPT TO CYTOPLASM | Genes involved in Transport of Mature Transcript to Cytoplasm |
| 0.0 | 1.1 | REACTOME AMINE COMPOUND SLC TRANSPORTERS | Genes involved in Amine compound SLC transporters |
| 0.0 | 0.4 | REACTOME VEGF LIGAND RECEPTOR INTERACTIONS | Genes involved in VEGF ligand-receptor interactions |
| 0.0 | 0.2 | REACTOME CLASS C 3 METABOTROPIC GLUTAMATE PHEROMONE RECEPTORS | Genes involved in Class C/3 (Metabotropic glutamate/pheromone receptors) |
| 0.0 | 0.2 | REACTOME TIE2 SIGNALING | Genes involved in Tie2 Signaling |