Project
GNF SymAtlas + NCI-60 cancer cell lines, human (Su, 2004; Ross, 2000)
Navigation
Downloads
Results for PPARA
Z-value: 1.16
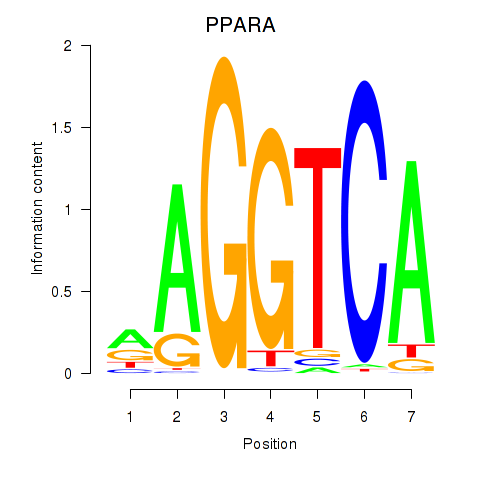
Motif logo
Transcription factors associated with PPARA
| Gene Symbol | Gene ID | Gene Info |
|---|---|---|
|
PPARA
|
ENSG00000186951.16 | PPARA |
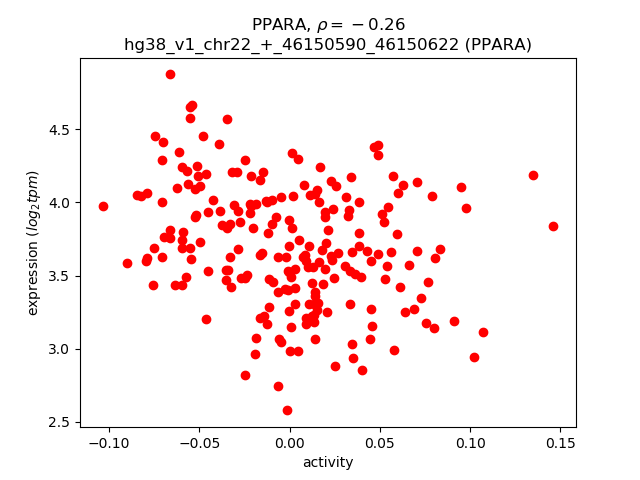
Activity-expression correlation:
| Gene | Promoter | Pearson corr. coef. | P-value | Plot |
|---|---|---|---|---|
| PPARA | hg38_v1_chr22_+_46150590_46150622 | -0.26 | 1.0e-04 | Click! |
Activity profile of PPARA motif
Sorted Z-values of PPARA motif
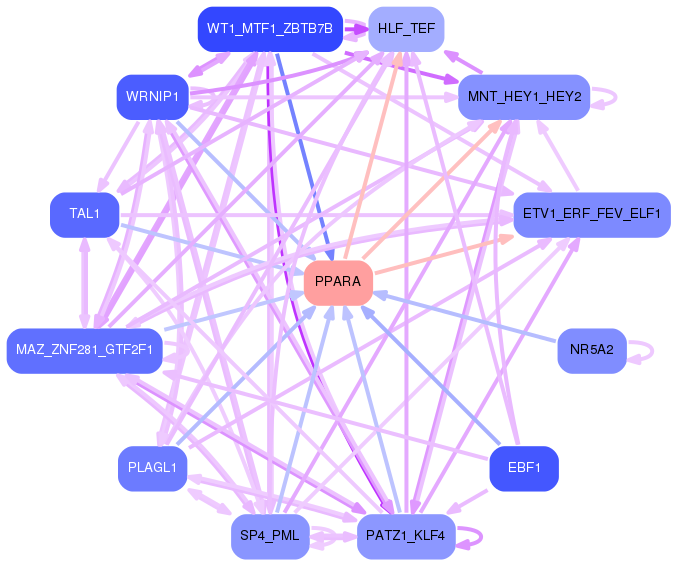
Network of associatons between targets according to the STRING database.

First level regulatory network of PPARA
Gene Ontology Analysis
Gene overrepresentation in biological process category:
| Log-likelihood per target | Total log-likelihood | Term | Description |
|---|---|---|---|
| 7.1 | 50.0 | GO:2000324 | positive regulation of glucocorticoid receptor signaling pathway(GO:2000324) |
| 4.9 | 14.8 | GO:1900920 | regulation of amino acid uptake involved in synaptic transmission(GO:0051941) regulation of glutamate uptake involved in transmission of nerve impulse(GO:0051946) regulation of L-glutamate import(GO:1900920) |
| 4.9 | 14.6 | GO:0006781 | succinyl-CoA pathway(GO:0006781) |
| 4.6 | 18.4 | GO:0000961 | negative regulation of mitochondrial RNA catabolic process(GO:0000961) |
| 4.1 | 20.5 | GO:0099590 | neurotransmitter receptor internalization(GO:0099590) |
| 3.6 | 10.9 | GO:2000374 | regulation of oxygen metabolic process(GO:2000374) |
| 3.5 | 14.1 | GO:0042776 | mitochondrial ATP synthesis coupled proton transport(GO:0042776) |
| 3.4 | 10.2 | GO:1903028 | positive regulation of opsonization(GO:1903028) |
| 3.1 | 18.3 | GO:1903690 | negative regulation of wound healing, spreading of epidermal cells(GO:1903690) |
| 3.1 | 9.2 | GO:0060382 | release from viral latency(GO:0019046) regulation of DNA strand elongation(GO:0060382) |
| 3.0 | 9.1 | GO:1903279 | protein transport into plasma membrane raft(GO:0044861) regulation of calcium:sodium antiporter activity(GO:1903279) positive regulation of calcium:sodium antiporter activity(GO:1903281) positive regulation of potassium ion import(GO:1903288) |
| 2.7 | 13.5 | GO:0044375 | regulation of peroxisome size(GO:0044375) |
| 2.7 | 8.0 | GO:0051939 | gamma-aminobutyric acid import(GO:0051939) |
| 2.7 | 29.4 | GO:0036376 | sodium ion export from cell(GO:0036376) |
| 2.6 | 7.9 | GO:1903565 | negative regulation of protein localization to cilium(GO:1903565) regulation of protein localization to ciliary membrane(GO:1903567) negative regulation of protein localization to ciliary membrane(GO:1903568) |
| 2.5 | 45.0 | GO:0006123 | mitochondrial electron transport, cytochrome c to oxygen(GO:0006123) |
| 2.5 | 9.9 | GO:0006238 | CMP salvage(GO:0006238) CMP biosynthetic process(GO:0009224) CMP metabolic process(GO:0046035) |
| 2.4 | 34.3 | GO:0006122 | mitochondrial electron transport, ubiquinol to cytochrome c(GO:0006122) |
| 2.4 | 41.1 | GO:0090361 | platelet-derived growth factor production(GO:0090360) regulation of platelet-derived growth factor production(GO:0090361) |
| 2.3 | 6.8 | GO:1902445 | regulation of mitochondrial membrane permeability involved in programmed necrotic cell death(GO:1902445) negative regulation of oxidative phosphorylation uncoupler activity(GO:2000276) |
| 2.2 | 8.9 | GO:0035610 | protein side chain deglutamylation(GO:0035610) |
| 2.1 | 25.2 | GO:0070495 | regulation of thrombin receptor signaling pathway(GO:0070494) negative regulation of thrombin receptor signaling pathway(GO:0070495) negative regulation of guanyl-nucleotide exchange factor activity(GO:1905098) |
| 2.1 | 31.1 | GO:1904714 | regulation of chaperone-mediated autophagy(GO:1904714) |
| 2.0 | 8.0 | GO:1904045 | cellular response to aldosterone(GO:1904045) |
| 2.0 | 17.7 | GO:0045039 | protein import into mitochondrial inner membrane(GO:0045039) |
| 1.9 | 5.8 | GO:1904247 | positive regulation of polynucleotide adenylyltransferase activity(GO:1904247) |
| 1.8 | 11.0 | GO:0030644 | cellular chloride ion homeostasis(GO:0030644) |
| 1.8 | 111.9 | GO:0006120 | mitochondrial electron transport, NADH to ubiquinone(GO:0006120) |
| 1.8 | 9.2 | GO:0021699 | cerebellum maturation(GO:0021590) cerebellar cortex maturation(GO:0021699) |
| 1.8 | 10.9 | GO:0071442 | positive regulation of histone H3-K14 acetylation(GO:0071442) |
| 1.7 | 6.7 | GO:0044210 | 'de novo' CTP biosynthetic process(GO:0044210) |
| 1.7 | 5.0 | GO:0098582 | innate vocalization behavior(GO:0098582) |
| 1.6 | 15.9 | GO:0071787 | endoplasmic reticulum tubular network assembly(GO:0071787) |
| 1.6 | 7.8 | GO:1900245 | positive regulation of MDA-5 signaling pathway(GO:1900245) |
| 1.5 | 9.1 | GO:0098707 | ferrous iron import into cell(GO:0097460) ferrous iron import across plasma membrane(GO:0098707) |
| 1.5 | 13.1 | GO:0014052 | regulation of gamma-aminobutyric acid secretion(GO:0014052) |
| 1.4 | 2.8 | GO:0017055 | negative regulation of RNA polymerase II transcriptional preinitiation complex assembly(GO:0017055) |
| 1.3 | 5.2 | GO:0006556 | S-adenosylmethionine biosynthetic process(GO:0006556) |
| 1.3 | 3.9 | GO:0006106 | fumarate metabolic process(GO:0006106) |
| 1.3 | 36.0 | GO:0032012 | regulation of ARF protein signal transduction(GO:0032012) |
| 1.3 | 7.7 | GO:0043456 | regulation of pentose-phosphate shunt(GO:0043456) |
| 1.3 | 7.6 | GO:0002424 | T cell mediated immune response to tumor cell(GO:0002424) regulation of T cell mediated immune response to tumor cell(GO:0002840) |
| 1.2 | 6.0 | GO:1903588 | negative regulation of blood vessel endothelial cell proliferation involved in sprouting angiogenesis(GO:1903588) |
| 1.1 | 17.1 | GO:0007258 | JUN phosphorylation(GO:0007258) |
| 1.1 | 8.6 | GO:0035989 | tendon development(GO:0035989) |
| 1.1 | 4.3 | GO:2000259 | positive regulation of complement activation(GO:0045917) positive regulation of protein activation cascade(GO:2000259) |
| 1.1 | 5.3 | GO:0030242 | pexophagy(GO:0030242) |
| 1.0 | 4.1 | GO:0061083 | regulation of protein refolding(GO:0061083) negative regulation of protein refolding(GO:0061084) |
| 1.0 | 6.1 | GO:0061732 | mitochondrial acetyl-CoA biosynthetic process from pyruvate(GO:0061732) |
| 1.0 | 5.9 | GO:0019255 | UDP-glucuronate biosynthetic process(GO:0006065) glucose 1-phosphate metabolic process(GO:0019255) |
| 0.9 | 14.2 | GO:0000338 | protein deneddylation(GO:0000338) |
| 0.9 | 0.9 | GO:1901856 | negative regulation of cellular respiration(GO:1901856) |
| 0.9 | 3.7 | GO:1904428 | negative regulation of tubulin deacetylation(GO:1904428) |
| 0.9 | 9.4 | GO:0042407 | cristae formation(GO:0042407) |
| 0.8 | 11.0 | GO:0021796 | cerebral cortex regionalization(GO:0021796) |
| 0.8 | 10.9 | GO:1904322 | response to forskolin(GO:1904321) cellular response to forskolin(GO:1904322) |
| 0.8 | 2.5 | GO:0098935 | dendritic transport(GO:0098935) anterograde dendritic transport(GO:0098937) |
| 0.8 | 4.0 | GO:0035900 | response to isolation stress(GO:0035900) |
| 0.8 | 2.4 | GO:0007518 | myoblast fate determination(GO:0007518) |
| 0.8 | 29.7 | GO:0030262 | apoptotic nuclear changes(GO:0030262) |
| 0.8 | 5.5 | GO:0000255 | allantoin metabolic process(GO:0000255) |
| 0.8 | 3.1 | GO:1900147 | Schwann cell migration(GO:0036135) regulation of Schwann cell migration(GO:1900147) |
| 0.8 | 6.2 | GO:1903593 | regulation of histamine secretion by mast cell(GO:1903593) |
| 0.8 | 4.6 | GO:0032483 | regulation of Rab protein signal transduction(GO:0032483) |
| 0.8 | 4.5 | GO:2001206 | positive regulation of osteoclast development(GO:2001206) |
| 0.7 | 2.2 | GO:0036304 | umbilical cord morphogenesis(GO:0036304) umbilical cord development(GO:0061027) negative regulation of transcription from RNA polymerase II promoter involved in smooth muscle cell differentiation(GO:2000820) |
| 0.7 | 5.9 | GO:0010993 | regulation of ubiquitin homeostasis(GO:0010993) free ubiquitin chain polymerization(GO:0010994) |
| 0.7 | 8.0 | GO:0007144 | female meiosis I(GO:0007144) |
| 0.7 | 12.2 | GO:0003322 | pancreatic A cell development(GO:0003322) |
| 0.7 | 2.1 | GO:1903033 | regulation of microtubule plus-end binding(GO:1903031) positive regulation of microtubule plus-end binding(GO:1903033) |
| 0.7 | 2.7 | GO:2000297 | negative regulation of synapse maturation(GO:2000297) |
| 0.7 | 50.1 | GO:0000381 | regulation of alternative mRNA splicing, via spliceosome(GO:0000381) |
| 0.7 | 23.6 | GO:0006099 | tricarboxylic acid cycle(GO:0006099) |
| 0.7 | 4.0 | GO:0006108 | malate metabolic process(GO:0006108) |
| 0.7 | 8.5 | GO:0019388 | galactose catabolic process(GO:0019388) |
| 0.6 | 6.5 | GO:0070836 | caveola assembly(GO:0070836) |
| 0.6 | 5.6 | GO:0010265 | SCF complex assembly(GO:0010265) |
| 0.6 | 3.7 | GO:0007296 | vitellogenesis(GO:0007296) |
| 0.6 | 10.3 | GO:0007253 | cytoplasmic sequestering of NF-kappaB(GO:0007253) |
| 0.6 | 1.8 | GO:1903721 | regulation of I-kappaB phosphorylation(GO:1903719) positive regulation of I-kappaB phosphorylation(GO:1903721) |
| 0.6 | 2.8 | GO:1902774 | late endosome to lysosome transport(GO:1902774) |
| 0.6 | 2.2 | GO:0016584 | nucleosome positioning(GO:0016584) |
| 0.5 | 7.9 | GO:0043374 | CD8-positive, alpha-beta T cell differentiation(GO:0043374) |
| 0.5 | 4.7 | GO:0070070 | proton-transporting V-type ATPase complex assembly(GO:0070070) vacuolar proton-transporting V-type ATPase complex assembly(GO:0070072) |
| 0.5 | 3.7 | GO:1901189 | arterial endothelial cell fate commitment(GO:0060844) blood vessel lumenization(GO:0072554) positive regulation of ephrin receptor signaling pathway(GO:1901189) positive regulation of canonical Wnt signaling pathway involved in cardiac muscle cell fate commitment(GO:1901297) positive regulation of canonical Wnt signaling pathway involved in heart development(GO:1905068) |
| 0.5 | 7.8 | GO:0070601 | centromeric sister chromatid cohesion(GO:0070601) |
| 0.5 | 2.1 | GO:0044206 | pyrimidine ribonucleotide salvage(GO:0010138) pyrimidine nucleotide salvage(GO:0032262) UMP salvage(GO:0044206) |
| 0.5 | 5.1 | GO:0032510 | endosome to lysosome transport via multivesicular body sorting pathway(GO:0032510) |
| 0.5 | 8.0 | GO:0030150 | protein import into mitochondrial matrix(GO:0030150) |
| 0.5 | 1.5 | GO:0006741 | NADP biosynthetic process(GO:0006741) |
| 0.5 | 6.8 | GO:1901387 | positive regulation of voltage-gated calcium channel activity(GO:1901387) |
| 0.5 | 8.8 | GO:1901897 | regulation of relaxation of cardiac muscle(GO:1901897) |
| 0.5 | 1.4 | GO:0030997 | regulation of centriole-centriole cohesion(GO:0030997) |
| 0.5 | 8.6 | GO:0006851 | mitochondrial calcium ion transport(GO:0006851) |
| 0.4 | 6.7 | GO:2000394 | positive regulation of lamellipodium morphogenesis(GO:2000394) |
| 0.4 | 17.4 | GO:0006376 | mRNA splice site selection(GO:0006376) |
| 0.4 | 1.3 | GO:0042823 | pyridoxal phosphate metabolic process(GO:0042822) pyridoxal phosphate biosynthetic process(GO:0042823) |
| 0.4 | 2.9 | GO:0032417 | positive regulation of sodium:proton antiporter activity(GO:0032417) |
| 0.4 | 1.6 | GO:0010841 | positive regulation of circadian sleep/wake cycle, wakefulness(GO:0010841) |
| 0.4 | 4.0 | GO:0003402 | planar cell polarity pathway involved in axis elongation(GO:0003402) |
| 0.4 | 4.8 | GO:0046784 | viral mRNA export from host cell nucleus(GO:0046784) |
| 0.4 | 2.8 | GO:0006499 | N-terminal protein myristoylation(GO:0006499) |
| 0.4 | 0.8 | GO:0061198 | fungiform papilla formation(GO:0061198) |
| 0.4 | 3.9 | GO:0001574 | ganglioside biosynthetic process(GO:0001574) |
| 0.4 | 3.9 | GO:0043951 | negative regulation of cAMP-mediated signaling(GO:0043951) |
| 0.4 | 3.9 | GO:0006390 | transcription from mitochondrial promoter(GO:0006390) |
| 0.4 | 1.2 | GO:0070681 | glutaminyl-tRNAGln biosynthesis via transamidation(GO:0070681) |
| 0.4 | 0.4 | GO:0090164 | asymmetric Golgi ribbon formation(GO:0090164) |
| 0.4 | 3.5 | GO:0048096 | chromatin-mediated maintenance of transcription(GO:0048096) |
| 0.3 | 2.8 | GO:0002084 | protein depalmitoylation(GO:0002084) |
| 0.3 | 1.7 | GO:0007221 | positive regulation of transcription of Notch receptor target(GO:0007221) |
| 0.3 | 3.0 | GO:0000414 | regulation of histone H3-K36 methylation(GO:0000414) |
| 0.3 | 3.9 | GO:0051964 | negative regulation of synapse assembly(GO:0051964) |
| 0.3 | 5.8 | GO:0043306 | positive regulation of mast cell activation involved in immune response(GO:0033008) positive regulation of mast cell degranulation(GO:0043306) |
| 0.3 | 5.3 | GO:0033599 | regulation of mammary gland epithelial cell proliferation(GO:0033599) |
| 0.3 | 8.9 | GO:0048268 | clathrin coat assembly(GO:0048268) |
| 0.3 | 8.3 | GO:0015988 | energy coupled proton transmembrane transport, against electrochemical gradient(GO:0015988) ATP hydrolysis coupled proton transport(GO:0015991) ATP hydrolysis coupled transmembrane transport(GO:0090662) |
| 0.3 | 2.7 | GO:0030951 | establishment or maintenance of microtubule cytoskeleton polarity(GO:0030951) |
| 0.3 | 4.5 | GO:0034497 | protein localization to pre-autophagosomal structure(GO:0034497) |
| 0.3 | 3.5 | GO:0048227 | plasma membrane to endosome transport(GO:0048227) |
| 0.3 | 7.6 | GO:0015937 | coenzyme A biosynthetic process(GO:0015937) |
| 0.3 | 2.6 | GO:0016559 | peroxisome fission(GO:0016559) |
| 0.3 | 6.5 | GO:0045161 | neuronal ion channel clustering(GO:0045161) |
| 0.3 | 0.8 | GO:1901355 | response to rapamycin(GO:1901355) |
| 0.3 | 1.4 | GO:0070966 | nuclear-transcribed mRNA catabolic process, no-go decay(GO:0070966) |
| 0.3 | 3.6 | GO:0010603 | regulation of cytoplasmic mRNA processing body assembly(GO:0010603) |
| 0.3 | 2.0 | GO:0098814 | spontaneous neurotransmitter secretion(GO:0061669) spontaneous synaptic transmission(GO:0098814) |
| 0.3 | 7.9 | GO:1901687 | glutathione derivative metabolic process(GO:1901685) glutathione derivative biosynthetic process(GO:1901687) |
| 0.3 | 0.8 | GO:0090234 | regulation of kinetochore assembly(GO:0090234) |
| 0.2 | 2.9 | GO:0034975 | protein folding in endoplasmic reticulum(GO:0034975) |
| 0.2 | 2.9 | GO:1900227 | positive regulation of NLRP3 inflammasome complex assembly(GO:1900227) |
| 0.2 | 1.0 | GO:0070345 | negative regulation of fat cell proliferation(GO:0070345) |
| 0.2 | 3.6 | GO:0070102 | interleukin-6-mediated signaling pathway(GO:0070102) |
| 0.2 | 1.7 | GO:0045647 | negative regulation of erythrocyte differentiation(GO:0045647) |
| 0.2 | 3.3 | GO:0042532 | negative regulation of tyrosine phosphorylation of STAT protein(GO:0042532) |
| 0.2 | 10.1 | GO:0021762 | substantia nigra development(GO:0021762) |
| 0.2 | 7.3 | GO:0008334 | histone mRNA metabolic process(GO:0008334) |
| 0.2 | 2.3 | GO:0051085 | chaperone mediated protein folding requiring cofactor(GO:0051085) |
| 0.2 | 7.7 | GO:0045948 | positive regulation of translational initiation(GO:0045948) |
| 0.2 | 1.5 | GO:0017196 | N-terminal peptidyl-methionine acetylation(GO:0017196) |
| 0.2 | 0.4 | GO:0060501 | positive regulation of epithelial cell proliferation involved in lung morphogenesis(GO:0060501) |
| 0.2 | 1.8 | GO:0098909 | regulation of cardiac muscle cell action potential involved in regulation of contraction(GO:0098909) |
| 0.2 | 2.0 | GO:1900029 | positive regulation of ruffle assembly(GO:1900029) |
| 0.2 | 0.6 | GO:1901503 | ether lipid biosynthetic process(GO:0008611) glycerol ether biosynthetic process(GO:0046504) ether biosynthetic process(GO:1901503) |
| 0.2 | 3.3 | GO:0006744 | ubiquinone biosynthetic process(GO:0006744) quinone biosynthetic process(GO:1901663) |
| 0.2 | 4.9 | GO:0007095 | mitotic G2 DNA damage checkpoint(GO:0007095) |
| 0.2 | 5.4 | GO:0010669 | epithelial structure maintenance(GO:0010669) |
| 0.2 | 10.1 | GO:0000413 | protein peptidyl-prolyl isomerization(GO:0000413) |
| 0.2 | 5.1 | GO:0050860 | negative regulation of T cell receptor signaling pathway(GO:0050860) |
| 0.2 | 16.8 | GO:0045454 | cell redox homeostasis(GO:0045454) |
| 0.2 | 10.5 | GO:0051693 | actin filament capping(GO:0051693) |
| 0.2 | 0.5 | GO:0006172 | ADP biosynthetic process(GO:0006172) |
| 0.2 | 0.7 | GO:0034627 | nicotinamide nucleotide biosynthetic process from aspartate(GO:0019355) 'de novo' NAD biosynthetic process(GO:0034627) 'de novo' NAD biosynthetic process from aspartate(GO:0034628) |
| 0.2 | 2.8 | GO:0097031 | NADH dehydrogenase complex assembly(GO:0010257) mitochondrial respiratory chain complex I assembly(GO:0032981) mitochondrial respiratory chain complex I biogenesis(GO:0097031) |
| 0.2 | 7.5 | GO:0015949 | nucleobase-containing small molecule interconversion(GO:0015949) |
| 0.2 | 3.7 | GO:0035435 | phosphate ion transmembrane transport(GO:0035435) |
| 0.2 | 2.2 | GO:1903286 | regulation of potassium ion import(GO:1903286) |
| 0.2 | 6.4 | GO:0048665 | neuron fate specification(GO:0048665) |
| 0.2 | 12.3 | GO:0070125 | mitochondrial translational elongation(GO:0070125) |
| 0.2 | 9.7 | GO:0050771 | negative regulation of axonogenesis(GO:0050771) |
| 0.2 | 1.4 | GO:0099566 | regulation of postsynaptic cytosolic calcium ion concentration(GO:0099566) |
| 0.2 | 5.2 | GO:0042026 | protein refolding(GO:0042026) |
| 0.2 | 1.4 | GO:0072383 | plus-end-directed vesicle transport along microtubule(GO:0072383) |
| 0.2 | 4.7 | GO:0016601 | Rac protein signal transduction(GO:0016601) |
| 0.1 | 5.7 | GO:0034314 | Arp2/3 complex-mediated actin nucleation(GO:0034314) |
| 0.1 | 1.7 | GO:0052697 | flavonoid glucuronidation(GO:0052696) xenobiotic glucuronidation(GO:0052697) |
| 0.1 | 1.0 | GO:1901314 | negative regulation of histone ubiquitination(GO:0033183) negative regulation of protein K63-linked ubiquitination(GO:1900045) regulation of histone H2A K63-linked ubiquitination(GO:1901314) negative regulation of histone H2A K63-linked ubiquitination(GO:1901315) negative regulation of protein polyubiquitination(GO:1902915) |
| 0.1 | 3.1 | GO:0006491 | N-glycan processing(GO:0006491) |
| 0.1 | 1.4 | GO:0021847 | tyrosine metabolic process(GO:0006570) ventricular zone neuroblast division(GO:0021847) |
| 0.1 | 1.6 | GO:1902224 | ketone body metabolic process(GO:1902224) |
| 0.1 | 9.2 | GO:0051865 | protein autoubiquitination(GO:0051865) |
| 0.1 | 0.4 | GO:0051835 | positive regulation of synapse structural plasticity(GO:0051835) |
| 0.1 | 1.1 | GO:0000244 | spliceosomal tri-snRNP complex assembly(GO:0000244) |
| 0.1 | 0.6 | GO:0090118 | receptor-mediated endocytosis of low-density lipoprotein particle involved in cholesterol transport(GO:0090118) |
| 0.1 | 0.7 | GO:1902109 | response to staurosporine(GO:0072733) cellular response to staurosporine(GO:0072734) negative regulation of mitochondrial membrane permeability involved in apoptotic process(GO:1902109) |
| 0.1 | 0.8 | GO:0060372 | regulation of atrial cardiac muscle cell membrane repolarization(GO:0060372) |
| 0.1 | 2.3 | GO:0033169 | histone H3-K9 demethylation(GO:0033169) |
| 0.1 | 1.0 | GO:0001672 | regulation of chromatin assembly or disassembly(GO:0001672) |
| 0.1 | 2.7 | GO:0071420 | cellular response to histamine(GO:0071420) |
| 0.1 | 5.6 | GO:0050850 | positive regulation of calcium-mediated signaling(GO:0050850) |
| 0.1 | 0.4 | GO:0018197 | peptidyl-aspartic acid modification(GO:0018197) peptidyl-aspartic acid hydroxylation(GO:0042264) |
| 0.1 | 1.2 | GO:0006527 | arginine catabolic process(GO:0006527) |
| 0.1 | 3.3 | GO:0000291 | nuclear-transcribed mRNA catabolic process, exonucleolytic(GO:0000291) exonucleolytic nuclear-transcribed mRNA catabolic process involved in deadenylation-dependent decay(GO:0043928) |
| 0.1 | 1.8 | GO:0006782 | protoporphyrinogen IX biosynthetic process(GO:0006782) |
| 0.1 | 6.2 | GO:0060997 | dendritic spine morphogenesis(GO:0060997) |
| 0.1 | 0.3 | GO:0061591 | calcium activated phospholipid scrambling(GO:0061588) calcium activated phosphatidylcholine scrambling(GO:0061590) calcium activated galactosylceramide scrambling(GO:0061591) |
| 0.1 | 0.5 | GO:0030538 | embryonic genitalia morphogenesis(GO:0030538) |
| 0.1 | 3.3 | GO:0045737 | positive regulation of cyclin-dependent protein serine/threonine kinase activity(GO:0045737) |
| 0.1 | 2.2 | GO:0097067 | cellular response to thyroid hormone stimulus(GO:0097067) |
| 0.1 | 9.2 | GO:1900034 | regulation of cellular response to heat(GO:1900034) |
| 0.1 | 1.0 | GO:0043569 | negative regulation of insulin-like growth factor receptor signaling pathway(GO:0043569) |
| 0.1 | 10.1 | GO:0021987 | cerebral cortex development(GO:0021987) |
| 0.1 | 1.4 | GO:0090110 | cargo loading into COPII-coated vesicle(GO:0090110) |
| 0.1 | 0.9 | GO:0050812 | acetyl-CoA biosynthetic process from pyruvate(GO:0006086) regulation of acetyl-CoA biosynthetic process from pyruvate(GO:0010510) regulation of acyl-CoA biosynthetic process(GO:0050812) |
| 0.1 | 4.3 | GO:0006301 | postreplication repair(GO:0006301) |
| 0.1 | 13.1 | GO:0006457 | protein folding(GO:0006457) |
| 0.1 | 5.1 | GO:0006501 | C-terminal protein lipidation(GO:0006501) |
| 0.1 | 1.3 | GO:0061049 | physiological muscle hypertrophy(GO:0003298) physiological cardiac muscle hypertrophy(GO:0003301) cell growth involved in cardiac muscle cell development(GO:0061049) |
| 0.1 | 5.5 | GO:0010977 | negative regulation of neuron projection development(GO:0010977) |
| 0.1 | 2.3 | GO:0046655 | folic acid metabolic process(GO:0046655) |
| 0.1 | 0.8 | GO:0051683 | establishment of Golgi localization(GO:0051683) |
| 0.1 | 0.2 | GO:2000687 | negative regulation of rubidium ion transport(GO:2000681) negative regulation of rubidium ion transmembrane transporter activity(GO:2000687) |
| 0.1 | 0.8 | GO:0006415 | translational termination(GO:0006415) |
| 0.1 | 1.2 | GO:0007064 | mitotic sister chromatid cohesion(GO:0007064) |
| 0.1 | 2.9 | GO:0003091 | renal water homeostasis(GO:0003091) |
| 0.1 | 0.5 | GO:0070995 | NADPH oxidation(GO:0070995) |
| 0.1 | 0.9 | GO:0016973 | poly(A)+ mRNA export from nucleus(GO:0016973) |
| 0.1 | 0.4 | GO:0051823 | regulation of synapse structural plasticity(GO:0051823) |
| 0.1 | 0.2 | GO:0012502 | induction of programmed cell death(GO:0012502) positive regulation of apoptotic process in other organism(GO:0044533) positive regulation by symbiont of host programmed cell death(GO:0052042) positive regulation by organism of programmed cell death in other organism involved in symbiotic interaction(GO:0052330) positive regulation by organism of apoptotic process in other organism involved in symbiotic interaction(GO:0052501) |
| 0.1 | 1.4 | GO:0071539 | protein localization to centrosome(GO:0071539) |
| 0.1 | 0.4 | GO:0045292 | mRNA cis splicing, via spliceosome(GO:0045292) |
| 0.0 | 2.3 | GO:0043525 | positive regulation of neuron apoptotic process(GO:0043525) |
| 0.0 | 0.4 | GO:0015677 | copper ion import(GO:0015677) |
| 0.0 | 0.7 | GO:0040015 | negative regulation of multicellular organism growth(GO:0040015) |
| 0.0 | 0.7 | GO:0006783 | heme biosynthetic process(GO:0006783) |
| 0.0 | 0.7 | GO:0031572 | G2 DNA damage checkpoint(GO:0031572) |
| 0.0 | 1.6 | GO:0002209 | behavioral fear response(GO:0001662) behavioral defense response(GO:0002209) |
| 0.0 | 1.9 | GO:0030490 | maturation of SSU-rRNA(GO:0030490) |
| 0.0 | 3.0 | GO:0007030 | Golgi organization(GO:0007030) |
| 0.0 | 1.5 | GO:0034260 | negative regulation of GTPase activity(GO:0034260) |
| 0.0 | 0.6 | GO:0006337 | nucleosome disassembly(GO:0006337) chromatin disassembly(GO:0031498) |
| 0.0 | 2.7 | GO:0006334 | nucleosome assembly(GO:0006334) |
| 0.0 | 1.5 | GO:0007032 | endosome organization(GO:0007032) |
| 0.0 | 0.4 | GO:0051290 | protein heterotetramerization(GO:0051290) |
| 0.0 | 0.8 | GO:0045668 | negative regulation of osteoblast differentiation(GO:0045668) |
| 0.0 | 1.0 | GO:0021510 | spinal cord development(GO:0021510) |
| 0.0 | 0.3 | GO:0043567 | regulation of insulin-like growth factor receptor signaling pathway(GO:0043567) |
| 0.0 | 0.6 | GO:0046785 | microtubule polymerization(GO:0046785) |
| 0.0 | 0.4 | GO:0031581 | hemidesmosome assembly(GO:0031581) |
| 0.0 | 0.0 | GO:0071481 | cellular response to X-ray(GO:0071481) |
Gene overrepresentation in cellular component category:
| Log-likelihood per target | Total log-likelihood | Term | Description |
|---|---|---|---|
| 6.9 | 34.5 | GO:0045272 | plasma membrane respiratory chain complex I(GO:0045272) |
| 4.3 | 17.4 | GO:0070032 | synaptobrevin 2-SNAP-25-syntaxin-1a-complexin I complex(GO:0070032) |
| 3.7 | 48.4 | GO:0045275 | mitochondrial respiratory chain complex III(GO:0005750) respiratory chain complex III(GO:0045275) |
| 3.3 | 29.8 | GO:0044327 | dendritic spine head(GO:0044327) |
| 3.2 | 34.7 | GO:0005751 | mitochondrial respiratory chain complex IV(GO:0005751) |
| 2.9 | 17.7 | GO:0042721 | mitochondrial inner membrane protein insertion complex(GO:0042721) |
| 2.9 | 8.6 | GO:0005592 | collagen type XI trimer(GO:0005592) |
| 2.1 | 32.8 | GO:0005890 | sodium:potassium-exchanging ATPase complex(GO:0005890) |
| 2.0 | 12.1 | GO:0061617 | MICOS complex(GO:0061617) |
| 1.8 | 18.3 | GO:0045180 | basal cortex(GO:0045180) |
| 1.8 | 20.1 | GO:0005853 | eukaryotic translation elongation factor 1 complex(GO:0005853) |
| 1.8 | 1.8 | GO:0070470 | plasma membrane respiratory chain(GO:0070470) |
| 1.7 | 5.2 | GO:0048269 | methionine adenosyltransferase complex(GO:0048269) |
| 1.6 | 11.0 | GO:0097451 | glial limiting end-foot(GO:0097451) |
| 1.4 | 5.7 | GO:0045283 | mitochondrial respiratory chain complex II, succinate dehydrogenase complex (ubiquinone)(GO:0005749) succinate dehydrogenase complex (ubiquinone)(GO:0045257) respiratory chain complex II(GO:0045273) succinate dehydrogenase complex(GO:0045281) fumarate reductase complex(GO:0045283) |
| 1.3 | 77.4 | GO:0045271 | mitochondrial respiratory chain complex I(GO:0005747) NADH dehydrogenase complex(GO:0030964) respiratory chain complex I(GO:0045271) |
| 1.3 | 9.3 | GO:0031415 | NatA complex(GO:0031415) |
| 1.2 | 12.8 | GO:0033180 | proton-transporting V-type ATPase, V1 domain(GO:0033180) |
| 1.0 | 5.7 | GO:0031232 | extrinsic component of external side of plasma membrane(GO:0031232) |
| 0.9 | 4.7 | GO:0043291 | RAVE complex(GO:0043291) |
| 0.9 | 7.1 | GO:0000931 | gamma-tubulin large complex(GO:0000931) gamma-tubulin ring complex(GO:0008274) |
| 0.9 | 5.3 | GO:1990316 | ATG1/ULK1 kinase complex(GO:1990316) |
| 0.9 | 2.6 | GO:0016939 | kinesin II complex(GO:0016939) |
| 0.8 | 9.9 | GO:0045254 | pyruvate dehydrogenase complex(GO:0045254) |
| 0.8 | 13.1 | GO:0030285 | integral component of synaptic vesicle membrane(GO:0030285) intrinsic component of synaptic vesicle membrane(GO:0098563) |
| 0.8 | 4.9 | GO:0045252 | oxoglutarate dehydrogenase complex(GO:0045252) |
| 0.8 | 11.4 | GO:0005687 | U4 snRNP(GO:0005687) |
| 0.7 | 3.0 | GO:0071986 | Ragulator complex(GO:0071986) |
| 0.7 | 2.8 | GO:0033263 | CORVET complex(GO:0033263) |
| 0.6 | 3.9 | GO:0045239 | tricarboxylic acid cycle enzyme complex(GO:0045239) |
| 0.6 | 11.0 | GO:0070469 | respiratory chain(GO:0070469) |
| 0.6 | 2.6 | GO:0001405 | presequence translocase-associated import motor(GO:0001405) |
| 0.6 | 3.8 | GO:0072669 | tRNA-splicing ligase complex(GO:0072669) |
| 0.6 | 10.5 | GO:0008091 | spectrin(GO:0008091) |
| 0.6 | 5.2 | GO:0072546 | ER membrane protein complex(GO:0072546) |
| 0.6 | 29.6 | GO:0042645 | nucleoid(GO:0009295) mitochondrial nucleoid(GO:0042645) |
| 0.5 | 4.8 | GO:0000347 | THO complex(GO:0000347) THO complex part of transcription export complex(GO:0000445) |
| 0.5 | 13.1 | GO:0071782 | endoplasmic reticulum tubular network(GO:0071782) |
| 0.5 | 2.1 | GO:0030981 | cortical microtubule cytoskeleton(GO:0030981) |
| 0.5 | 9.2 | GO:0098800 | inner mitochondrial membrane protein complex(GO:0098800) |
| 0.5 | 3.3 | GO:1990726 | Lsm1-7-Pat1 complex(GO:1990726) |
| 0.5 | 1.8 | GO:0044307 | dendritic branch(GO:0044307) |
| 0.5 | 5.0 | GO:0032045 | guanyl-nucleotide exchange factor complex(GO:0032045) |
| 0.4 | 3.7 | GO:0002193 | MAML1-RBP-Jkappa- ICN1 complex(GO:0002193) |
| 0.4 | 8.9 | GO:0032585 | multivesicular body membrane(GO:0032585) |
| 0.4 | 16.1 | GO:0000315 | organellar large ribosomal subunit(GO:0000315) mitochondrial large ribosomal subunit(GO:0005762) |
| 0.4 | 3.6 | GO:0046696 | lipopolysaccharide receptor complex(GO:0046696) |
| 0.4 | 3.6 | GO:0097427 | microtubule bundle(GO:0097427) |
| 0.4 | 3.9 | GO:0061574 | ASAP complex(GO:0061574) |
| 0.4 | 1.2 | GO:0030956 | glutamyl-tRNA(Gln) amidotransferase complex(GO:0030956) |
| 0.4 | 5.1 | GO:0000815 | ESCRT III complex(GO:0000815) |
| 0.4 | 1.1 | GO:0071001 | U4/U6 snRNP(GO:0071001) |
| 0.3 | 2.7 | GO:0031931 | TORC1 complex(GO:0031931) |
| 0.3 | 7.0 | GO:0032433 | filopodium tip(GO:0032433) |
| 0.3 | 2.2 | GO:0016589 | NURF complex(GO:0016589) |
| 0.3 | 22.5 | GO:0005834 | heterotrimeric G-protein complex(GO:0005834) |
| 0.3 | 14.2 | GO:0008180 | COP9 signalosome(GO:0008180) |
| 0.3 | 1.4 | GO:0044308 | axonal spine(GO:0044308) |
| 0.3 | 5.7 | GO:0005885 | Arp2/3 protein complex(GO:0005885) |
| 0.3 | 0.5 | GO:1990635 | proximal dendrite(GO:1990635) |
| 0.3 | 1.8 | GO:0030121 | AP-1 adaptor complex(GO:0030121) |
| 0.2 | 3.0 | GO:0045009 | melanosome membrane(GO:0033162) chitosome(GO:0045009) |
| 0.2 | 15.5 | GO:0099501 | synaptic vesicle membrane(GO:0030672) exocytic vesicle membrane(GO:0099501) |
| 0.2 | 56.1 | GO:0043209 | myelin sheath(GO:0043209) |
| 0.2 | 6.6 | GO:0030057 | desmosome(GO:0030057) |
| 0.2 | 32.6 | GO:0032587 | ruffle membrane(GO:0032587) |
| 0.2 | 4.3 | GO:0005720 | nuclear heterochromatin(GO:0005720) |
| 0.2 | 10.8 | GO:0019005 | SCF ubiquitin ligase complex(GO:0019005) |
| 0.2 | 39.5 | GO:0030427 | site of polarized growth(GO:0030427) |
| 0.2 | 2.3 | GO:0036056 | filtration diaphragm(GO:0036056) slit diaphragm(GO:0036057) |
| 0.2 | 1.6 | GO:0033391 | chromatoid body(GO:0033391) |
| 0.2 | 42.4 | GO:0005802 | trans-Golgi network(GO:0005802) |
| 0.2 | 3.5 | GO:0005721 | pericentric heterochromatin(GO:0005721) |
| 0.2 | 2.8 | GO:0034045 | pre-autophagosomal structure membrane(GO:0034045) |
| 0.2 | 2.2 | GO:0034663 | endoplasmic reticulum chaperone complex(GO:0034663) |
| 0.2 | 1.1 | GO:0005851 | eukaryotic translation initiation factor 2B complex(GO:0005851) |
| 0.1 | 7.3 | GO:0033017 | sarcoplasmic reticulum membrane(GO:0033017) |
| 0.1 | 3.5 | GO:0005779 | integral component of peroxisomal membrane(GO:0005779) intrinsic component of peroxisomal membrane(GO:0031231) |
| 0.1 | 9.9 | GO:0008021 | synaptic vesicle(GO:0008021) |
| 0.1 | 0.7 | GO:0070552 | BRISC complex(GO:0070552) |
| 0.1 | 9.5 | GO:0101003 | ficolin-1-rich granule membrane(GO:0101003) |
| 0.1 | 2.7 | GO:0035371 | microtubule plus-end(GO:0035371) |
| 0.1 | 2.5 | GO:0071141 | SMAD protein complex(GO:0071141) |
| 0.1 | 2.5 | GO:0032839 | dendrite cytoplasm(GO:0032839) |
| 0.1 | 8.4 | GO:0005758 | mitochondrial intermembrane space(GO:0005758) |
| 0.1 | 15.2 | GO:0031225 | anchored component of membrane(GO:0031225) |
| 0.1 | 2.0 | GO:0042405 | nuclear inclusion body(GO:0042405) |
| 0.1 | 2.9 | GO:0032590 | dendrite membrane(GO:0032590) |
| 0.1 | 0.5 | GO:1990031 | pinceau fiber(GO:1990031) |
| 0.1 | 8.9 | GO:0000922 | spindle pole(GO:0000922) |
| 0.1 | 4.0 | GO:0031430 | M band(GO:0031430) |
| 0.1 | 0.5 | GO:0043196 | varicosity(GO:0043196) |
| 0.1 | 0.6 | GO:0097442 | CA3 pyramidal cell dendrite(GO:0097442) |
| 0.1 | 0.8 | GO:0030126 | COPI vesicle coat(GO:0030126) |
| 0.1 | 9.4 | GO:0031901 | early endosome membrane(GO:0031901) |
| 0.1 | 26.2 | GO:0005874 | microtubule(GO:0005874) |
| 0.1 | 0.9 | GO:0000124 | SAGA complex(GO:0000124) |
| 0.1 | 4.9 | GO:0000118 | histone deacetylase complex(GO:0000118) |
| 0.1 | 0.4 | GO:0005742 | mitochondrial outer membrane translocase complex(GO:0005742) |
| 0.1 | 0.3 | GO:0036396 | MIS complex(GO:0036396) mRNA editing complex(GO:0045293) |
| 0.1 | 0.8 | GO:0008074 | guanylate cyclase complex, soluble(GO:0008074) |
| 0.1 | 10.4 | GO:0005769 | early endosome(GO:0005769) |
| 0.0 | 12.1 | GO:0005743 | mitochondrial inner membrane(GO:0005743) |
| 0.0 | 1.4 | GO:0034451 | centriolar satellite(GO:0034451) |
| 0.0 | 2.0 | GO:0005637 | nuclear inner membrane(GO:0005637) |
| 0.0 | 0.8 | GO:0005665 | DNA-directed RNA polymerase II, core complex(GO:0005665) |
| 0.0 | 15.7 | GO:0000785 | chromatin(GO:0000785) |
| 0.0 | 2.9 | GO:0035578 | azurophil granule lumen(GO:0035578) |
| 0.0 | 0.4 | GO:0030056 | hemidesmosome(GO:0030056) |
| 0.0 | 0.6 | GO:0008305 | integrin complex(GO:0008305) |
| 0.0 | 1.8 | GO:0005819 | spindle(GO:0005819) |
| 0.0 | 0.3 | GO:0032982 | myosin filament(GO:0032982) |
| 0.0 | 0.8 | GO:0048786 | presynaptic active zone(GO:0048786) |
| 0.0 | 0.2 | GO:0097452 | GAIT complex(GO:0097452) |
| 0.0 | 1.6 | GO:0005882 | intermediate filament(GO:0005882) |
| 0.0 | 3.7 | GO:0005759 | mitochondrial matrix(GO:0005759) |
Gene overrepresentation in molecular function category:
| Log-likelihood per target | Total log-likelihood | Term | Description |
|---|---|---|---|
| 3.7 | 14.6 | GO:0004775 | succinate-CoA ligase (ADP-forming) activity(GO:0004775) |
| 3.4 | 44.4 | GO:0005391 | sodium:potassium-exchanging ATPase activity(GO:0005391) |
| 3.3 | 26.7 | GO:0016681 | ubiquinol-cytochrome-c reductase activity(GO:0008121) oxidoreductase activity, acting on diphenols and related substances as donors, cytochrome as acceptor(GO:0016681) |
| 3.1 | 9.4 | GO:0000035 | acyl binding(GO:0000035) |
| 2.8 | 8.5 | GO:0003974 | UDP-N-acetylglucosamine 4-epimerase activity(GO:0003974) UDP-glucose 4-epimerase activity(GO:0003978) |
| 2.5 | 9.8 | GO:0051538 | 3 iron, 4 sulfur cluster binding(GO:0051538) |
| 2.1 | 112.7 | GO:0008137 | NADH dehydrogenase (ubiquinone) activity(GO:0008137) NADH dehydrogenase (quinone) activity(GO:0050136) |
| 1.7 | 6.7 | GO:0003883 | CTP synthase activity(GO:0003883) |
| 1.7 | 6.7 | GO:0047391 | alkylglycerophosphoethanolamine phosphodiesterase activity(GO:0047391) |
| 1.5 | 7.7 | GO:0004082 | bisphosphoglycerate mutase activity(GO:0004082) phosphoglycerate mutase activity(GO:0004619) 2,3-bisphosphoglycerate-dependent phosphoglycerate mutase activity(GO:0046538) |
| 1.5 | 5.9 | GO:0003983 | UTP:glucose-1-phosphate uridylyltransferase activity(GO:0003983) UTP-monosaccharide-1-phosphate uridylyltransferase activity(GO:0051748) |
| 1.4 | 9.9 | GO:0004849 | uridine kinase activity(GO:0004849) |
| 1.3 | 5.3 | GO:0004449 | isocitrate dehydrogenase (NAD+) activity(GO:0004449) |
| 1.3 | 17.1 | GO:0004705 | JUN kinase activity(GO:0004705) SAP kinase activity(GO:0016909) |
| 1.2 | 9.9 | GO:0034603 | pyruvate dehydrogenase activity(GO:0004738) pyruvate dehydrogenase [NAD(P)+] activity(GO:0034603) pyruvate dehydrogenase (NAD+) activity(GO:0034604) |
| 1.2 | 9.6 | GO:0008379 | thioredoxin peroxidase activity(GO:0008379) |
| 1.1 | 14.8 | GO:0031681 | G-protein beta-subunit binding(GO:0031681) |
| 1.1 | 4.5 | GO:0046933 | proton-transporting ATP synthase activity, rotational mechanism(GO:0046933) |
| 1.1 | 8.8 | GO:0015288 | porin activity(GO:0015288) |
| 1.1 | 30.7 | GO:0015002 | cytochrome-c oxidase activity(GO:0004129) heme-copper terminal oxidase activity(GO:0015002) oxidoreductase activity, acting on a heme group of donors, oxygen as acceptor(GO:0016676) |
| 1.1 | 6.6 | GO:0004839 | ubiquitin activating enzyme activity(GO:0004839) |
| 1.1 | 36.0 | GO:0005086 | ARF guanyl-nucleotide exchange factor activity(GO:0005086) |
| 1.0 | 8.2 | GO:0004111 | creatine kinase activity(GO:0004111) |
| 1.0 | 5.0 | GO:0050220 | prostaglandin-E synthase activity(GO:0050220) |
| 1.0 | 8.0 | GO:0005332 | gamma-aminobutyric acid:sodium symporter activity(GO:0005332) gamma-aminobutyric acid transmembrane transporter activity(GO:0015185) |
| 1.0 | 3.9 | GO:0004513 | neolactotetraosylceramide alpha-2,3-sialyltransferase activity(GO:0004513) lactosylceramide alpha-2,3-sialyltransferase activity(GO:0047291) |
| 1.0 | 4.9 | GO:0004591 | oxoglutarate dehydrogenase (succinyl-transferring) activity(GO:0004591) |
| 0.9 | 2.6 | GO:0052816 | medium-chain acyl-CoA hydrolase activity(GO:0052815) long-chain acyl-CoA hydrolase activity(GO:0052816) |
| 0.9 | 4.3 | GO:0031871 | proteinase activated receptor binding(GO:0031871) |
| 0.8 | 1.7 | GO:0008177 | succinate dehydrogenase (ubiquinone) activity(GO:0008177) |
| 0.8 | 7.5 | GO:1904315 | neurotransmitter receptor activity involved in regulation of postsynaptic membrane potential(GO:0099529) transmitter-gated ion channel activity involved in regulation of postsynaptic membrane potential(GO:1904315) |
| 0.8 | 8.9 | GO:0032051 | clathrin light chain binding(GO:0032051) |
| 0.8 | 4.0 | GO:0004473 | malate dehydrogenase (decarboxylating) (NAD+) activity(GO:0004471) malate dehydrogenase (decarboxylating) (NADP+) activity(GO:0004473) oxaloacetate decarboxylase activity(GO:0008948) |
| 0.8 | 19.9 | GO:0051010 | microtubule plus-end binding(GO:0051010) |
| 0.8 | 9.3 | GO:0031802 | type 5 metabotropic glutamate receptor binding(GO:0031802) |
| 0.8 | 9.8 | GO:0004723 | calcium-dependent protein serine/threonine phosphatase activity(GO:0004723) |
| 0.7 | 20.1 | GO:0003746 | translation elongation factor activity(GO:0003746) |
| 0.7 | 9.1 | GO:0005381 | iron ion transmembrane transporter activity(GO:0005381) |
| 0.7 | 6.2 | GO:0004727 | prenylated protein tyrosine phosphatase activity(GO:0004727) |
| 0.7 | 8.9 | GO:0016018 | cyclosporin A binding(GO:0016018) |
| 0.7 | 9.3 | GO:0004596 | peptide alpha-N-acetyltransferase activity(GO:0004596) |
| 0.7 | 2.0 | GO:1990050 | phosphatidic acid transporter activity(GO:1990050) |
| 0.7 | 2.0 | GO:0050613 | delta14-sterol reductase activity(GO:0050613) |
| 0.6 | 7.7 | GO:1990247 | N6-methyladenosine-containing RNA binding(GO:1990247) |
| 0.6 | 10.1 | GO:0031821 | G-protein coupled serotonin receptor binding(GO:0031821) |
| 0.6 | 3.6 | GO:0034186 | apolipoprotein A-I binding(GO:0034186) |
| 0.6 | 2.3 | GO:0004487 | methenyltetrahydrofolate cyclohydrolase activity(GO:0004477) methylenetetrahydrofolate dehydrogenase (NAD+) activity(GO:0004487) methylenetetrahydrofolate dehydrogenase (NADP+) activity(GO:0004488) |
| 0.6 | 4.0 | GO:0010858 | calcium-dependent protein kinase regulator activity(GO:0010858) |
| 0.6 | 2.2 | GO:0035939 | microsatellite binding(GO:0035939) |
| 0.6 | 3.3 | GO:0061575 | cyclin-dependent protein serine/threonine kinase activator activity(GO:0061575) |
| 0.5 | 4.9 | GO:0019784 | NEDD8-specific protease activity(GO:0019784) |
| 0.5 | 2.1 | GO:0032551 | pyrimidine nucleoside binding(GO:0001884) UTP binding(GO:0002134) pyrimidine ribonucleoside binding(GO:0032551) |
| 0.5 | 8.0 | GO:0004017 | adenylate kinase activity(GO:0004017) |
| 0.5 | 6.3 | GO:0016174 | NAD(P)H oxidase activity(GO:0016174) |
| 0.5 | 3.1 | GO:0015450 | P-P-bond-hydrolysis-driven protein transmembrane transporter activity(GO:0015450) |
| 0.5 | 21.0 | GO:0017091 | AU-rich element binding(GO:0017091) |
| 0.5 | 4.0 | GO:0070699 | type II activin receptor binding(GO:0070699) |
| 0.5 | 17.4 | GO:0017075 | syntaxin-1 binding(GO:0017075) |
| 0.5 | 2.9 | GO:0004468 | lysine N-acetyltransferase activity, acting on acetyl phosphate as donor(GO:0004468) |
| 0.5 | 6.2 | GO:0000774 | adenyl-nucleotide exchange factor activity(GO:0000774) |
| 0.5 | 22.4 | GO:0036002 | pre-mRNA binding(GO:0036002) |
| 0.4 | 1.3 | GO:0031403 | lithium ion binding(GO:0031403) |
| 0.4 | 5.9 | GO:0034450 | ubiquitin-ubiquitin ligase activity(GO:0034450) |
| 0.4 | 1.2 | GO:0050567 | glutaminyl-tRNA synthase (glutamine-hydrolyzing) activity(GO:0050567) |
| 0.4 | 8.3 | GO:0044769 | ATPase activity, coupled to transmembrane movement of ions, rotational mechanism(GO:0044769) proton-transporting ATPase activity, rotational mechanism(GO:0046961) |
| 0.4 | 4.4 | GO:0017070 | U6 snRNA binding(GO:0017070) |
| 0.4 | 1.8 | GO:0016749 | 5-aminolevulinate synthase activity(GO:0003870) N-succinyltransferase activity(GO:0016749) |
| 0.3 | 1.0 | GO:0008267 | poly-glutamine tract binding(GO:0008267) |
| 0.3 | 4.8 | GO:0043225 | anion transmembrane-transporting ATPase activity(GO:0043225) |
| 0.3 | 5.1 | GO:1990381 | ubiquitin-specific protease binding(GO:1990381) |
| 0.3 | 8.2 | GO:0043325 | phosphatidylinositol-3,4-bisphosphate binding(GO:0043325) |
| 0.3 | 2.4 | GO:0019870 | potassium channel inhibitor activity(GO:0019870) |
| 0.3 | 4.5 | GO:0080025 | phosphatidylinositol-3,5-bisphosphate binding(GO:0080025) |
| 0.3 | 8.0 | GO:0005528 | macrolide binding(GO:0005527) FK506 binding(GO:0005528) |
| 0.3 | 3.5 | GO:0038132 | neuregulin binding(GO:0038132) |
| 0.3 | 1.1 | GO:0004466 | long-chain-acyl-CoA dehydrogenase activity(GO:0004466) |
| 0.3 | 1.4 | GO:0004167 | dopachrome isomerase activity(GO:0004167) |
| 0.3 | 0.8 | GO:0008294 | calcium- and calmodulin-responsive adenylate cyclase activity(GO:0008294) |
| 0.3 | 6.8 | GO:0044548 | S100 protein binding(GO:0044548) |
| 0.3 | 3.9 | GO:0008432 | JUN kinase binding(GO:0008432) |
| 0.3 | 10.2 | GO:0030159 | receptor signaling complex scaffold activity(GO:0030159) |
| 0.3 | 2.8 | GO:0008474 | palmitoyl-(protein) hydrolase activity(GO:0008474) palmitoyl hydrolase activity(GO:0098599) |
| 0.3 | 25.0 | GO:0051087 | chaperone binding(GO:0051087) |
| 0.2 | 13.7 | GO:0048487 | beta-tubulin binding(GO:0048487) |
| 0.2 | 5.8 | GO:0070300 | phosphatidic acid binding(GO:0070300) |
| 0.2 | 3.7 | GO:0000150 | recombinase activity(GO:0000150) |
| 0.2 | 11.1 | GO:0016831 | carboxy-lyase activity(GO:0016831) |
| 0.2 | 8.4 | GO:0030742 | GTP-dependent protein binding(GO:0030742) |
| 0.2 | 0.9 | GO:0004741 | [pyruvate dehydrogenase (lipoamide)] phosphatase activity(GO:0004741) |
| 0.2 | 2.1 | GO:0004128 | cytochrome-b5 reductase activity, acting on NAD(P)H(GO:0004128) |
| 0.2 | 9.4 | GO:0042169 | SH2 domain binding(GO:0042169) |
| 0.2 | 0.8 | GO:0032184 | SUMO polymer binding(GO:0032184) |
| 0.2 | 0.4 | GO:0070404 | NADH binding(GO:0070404) |
| 0.2 | 12.0 | GO:0070412 | R-SMAD binding(GO:0070412) |
| 0.2 | 11.4 | GO:0031491 | nucleosome binding(GO:0031491) |
| 0.2 | 7.4 | GO:0017025 | TBP-class protein binding(GO:0017025) |
| 0.2 | 3.5 | GO:0035173 | histone kinase activity(GO:0035173) |
| 0.2 | 0.7 | GO:0004515 | nicotinamide-nucleotide adenylyltransferase activity(GO:0000309) nicotinate-nucleotide adenylyltransferase activity(GO:0004515) |
| 0.2 | 3.7 | GO:0015114 | phosphate ion transmembrane transporter activity(GO:0015114) |
| 0.2 | 2.5 | GO:0050811 | GABA receptor binding(GO:0050811) |
| 0.2 | 3.6 | GO:0008093 | cytoskeletal adaptor activity(GO:0008093) |
| 0.2 | 1.2 | GO:0016403 | dimethylargininase activity(GO:0016403) |
| 0.2 | 1.6 | GO:0000340 | RNA 7-methylguanosine cap binding(GO:0000340) |
| 0.2 | 12.0 | GO:0050840 | extracellular matrix binding(GO:0050840) |
| 0.1 | 6.3 | GO:0005080 | protein kinase C binding(GO:0005080) |
| 0.1 | 10.8 | GO:0032947 | protein complex scaffold(GO:0032947) |
| 0.1 | 46.5 | GO:0015631 | tubulin binding(GO:0015631) |
| 0.1 | 36.2 | GO:0044822 | mRNA binding(GO:0003729) poly(A) RNA binding(GO:0044822) |
| 0.1 | 8.3 | GO:0017080 | sodium channel regulator activity(GO:0017080) |
| 0.1 | 2.9 | GO:0001087 | transcription factor activity, sequence-specific DNA binding, RNA polymerase recruiting(GO:0001011) transcription factor activity, TFIIB-class binding(GO:0001087) |
| 0.1 | 6.1 | GO:0004364 | glutathione transferase activity(GO:0004364) |
| 0.1 | 3.0 | GO:0005095 | GTPase inhibitor activity(GO:0005095) |
| 0.1 | 8.6 | GO:0016651 | oxidoreductase activity, acting on NAD(P)H(GO:0016651) |
| 0.1 | 7.3 | GO:0001105 | RNA polymerase II transcription coactivator activity(GO:0001105) |
| 0.1 | 1.6 | GO:0046790 | virion binding(GO:0046790) |
| 0.1 | 0.4 | GO:0004597 | peptide-aspartate beta-dioxygenase activity(GO:0004597) |
| 0.1 | 2.3 | GO:0032454 | histone demethylase activity (H3-K9 specific)(GO:0032454) |
| 0.1 | 16.9 | GO:0017124 | SH3 domain binding(GO:0017124) |
| 0.1 | 3.9 | GO:0016765 | transferase activity, transferring alkyl or aryl (other than methyl) groups(GO:0016765) |
| 0.1 | 5.7 | GO:0043531 | ADP binding(GO:0043531) |
| 0.1 | 9.3 | GO:0017048 | Rho GTPase binding(GO:0017048) |
| 0.1 | 3.9 | GO:0004407 | histone deacetylase activity(GO:0004407) |
| 0.1 | 5.8 | GO:0070063 | RNA polymerase binding(GO:0070063) |
| 0.1 | 0.7 | GO:0008269 | JAK pathway signal transduction adaptor activity(GO:0008269) |
| 0.1 | 0.7 | GO:0000268 | peroxisome targeting sequence binding(GO:0000268) |
| 0.1 | 17.8 | GO:0061630 | ubiquitin protein ligase activity(GO:0061630) |
| 0.1 | 1.4 | GO:0034185 | apolipoprotein binding(GO:0034185) |
| 0.1 | 3.8 | GO:0005246 | calcium channel regulator activity(GO:0005246) |
| 0.1 | 3.2 | GO:0004864 | protein phosphatase inhibitor activity(GO:0004864) |
| 0.1 | 0.3 | GO:0017128 | phospholipid scramblase activity(GO:0017128) |
| 0.1 | 0.1 | GO:0070181 | small ribosomal subunit rRNA binding(GO:0070181) |
| 0.1 | 0.6 | GO:0031812 | G-protein coupled nucleotide receptor binding(GO:0031811) P2Y1 nucleotide receptor binding(GO:0031812) |
| 0.1 | 1.1 | GO:0042043 | neurexin family protein binding(GO:0042043) |
| 0.1 | 11.3 | GO:0003735 | structural constituent of ribosome(GO:0003735) |
| 0.1 | 4.9 | GO:0004860 | protein kinase inhibitor activity(GO:0004860) |
| 0.1 | 0.4 | GO:0005375 | copper ion transmembrane transporter activity(GO:0005375) |
| 0.1 | 3.9 | GO:0016836 | hydro-lyase activity(GO:0016836) |
| 0.1 | 7.6 | GO:0020037 | heme binding(GO:0020037) |
| 0.1 | 1.5 | GO:0003951 | NAD+ kinase activity(GO:0003951) |
| 0.1 | 1.2 | GO:0008242 | omega peptidase activity(GO:0008242) |
| 0.1 | 1.6 | GO:0030506 | ankyrin binding(GO:0030506) |
| 0.1 | 0.4 | GO:0003810 | protein-glutamine gamma-glutamyltransferase activity(GO:0003810) |
| 0.0 | 1.6 | GO:0004497 | monooxygenase activity(GO:0004497) |
| 0.0 | 1.0 | GO:0019213 | deacetylase activity(GO:0019213) |
| 0.0 | 0.8 | GO:0086008 | voltage-gated potassium channel activity involved in cardiac muscle cell action potential repolarization(GO:0086008) |
| 0.0 | 6.5 | GO:0005200 | structural constituent of cytoskeleton(GO:0005200) |
| 0.0 | 1.5 | GO:0015269 | calcium-activated potassium channel activity(GO:0015269) |
| 0.0 | 0.3 | GO:1904929 | coreceptor activity involved in Wnt signaling pathway, planar cell polarity pathway(GO:1904929) |
| 0.0 | 0.7 | GO:0015467 | G-protein activated inward rectifier potassium channel activity(GO:0015467) |
| 0.0 | 3.7 | GO:0004222 | metalloendopeptidase activity(GO:0004222) |
| 0.0 | 0.4 | GO:0070273 | phosphatidylinositol-4-phosphate binding(GO:0070273) |
| 0.0 | 0.5 | GO:0051430 | corticotropin-releasing hormone receptor binding(GO:0051429) corticotropin-releasing hormone receptor 1 binding(GO:0051430) |
| 0.0 | 2.6 | GO:0051082 | unfolded protein binding(GO:0051082) |
| 0.0 | 1.0 | GO:0030552 | cAMP binding(GO:0030552) |
| 0.0 | 0.3 | GO:0031995 | insulin-like growth factor II binding(GO:0031995) |
| 0.0 | 0.4 | GO:0070064 | proline-rich region binding(GO:0070064) |
| 0.0 | 0.5 | GO:0005388 | calcium-transporting ATPase activity(GO:0005388) |
| 0.0 | 1.1 | GO:0003743 | translation initiation factor activity(GO:0003743) |
| 0.0 | 3.2 | GO:0001227 | transcriptional repressor activity, RNA polymerase II transcription regulatory region sequence-specific binding(GO:0001227) |
Gene overrepresentation in curated gene sets: canonical pathways category:
| Log-likelihood per target | Total log-likelihood | Term | Description |
|---|---|---|---|
| 1.3 | 25.2 | PID P38 GAMMA DELTA PATHWAY | Signaling mediated by p38-gamma and p38-delta |
| 0.5 | 18.9 | ST WNT CA2 CYCLIC GMP PATHWAY | Wnt/Ca2+/cyclic GMP signaling. |
| 0.4 | 5.4 | SA G2 AND M PHASES | Cdc25 activates the cdc2/cyclin B complex to induce the G2/M transition. |
| 0.4 | 17.1 | ST GRANULE CELL SURVIVAL PATHWAY | Granule Cell Survival Pathway is a specific case of more general PAC1 Receptor Pathway. |
| 0.4 | 10.1 | PID S1P S1P4 PATHWAY | S1P4 pathway |
| 0.3 | 7.6 | PID TOLL ENDOGENOUS PATHWAY | Endogenous TLR signaling |
| 0.3 | 35.9 | PID MYC REPRESS PATHWAY | Validated targets of C-MYC transcriptional repression |
| 0.3 | 16.9 | PID ERBB1 INTERNALIZATION PATHWAY | Internalization of ErbB1 |
| 0.2 | 6.2 | PID PRL SIGNALING EVENTS PATHWAY | Signaling events mediated by PRL |
| 0.2 | 13.9 | PID IL2 STAT5 PATHWAY | IL2 signaling events mediated by STAT5 |
| 0.2 | 23.0 | PID P75 NTR PATHWAY | p75(NTR)-mediated signaling |
| 0.2 | 2.2 | PID IL6 7 PATHWAY | IL6-mediated signaling events |
| 0.2 | 3.1 | PID EPHA2 FWD PATHWAY | EPHA2 forward signaling |
| 0.2 | 8.6 | NABA COLLAGENS | Genes encoding collagen proteins |
| 0.2 | 13.6 | PID CASPASE PATHWAY | Caspase cascade in apoptosis |
| 0.2 | 4.9 | PID P38 MKK3 6PATHWAY | p38 MAPK signaling pathway |
| 0.2 | 5.2 | PID NETRIN PATHWAY | Netrin-mediated signaling events |
| 0.2 | 7.8 | PID CERAMIDE PATHWAY | Ceramide signaling pathway |
| 0.2 | 12.4 | PID ILK PATHWAY | Integrin-linked kinase signaling |
| 0.1 | 4.2 | PID IFNG PATHWAY | IFN-gamma pathway |
| 0.1 | 12.5 | PID AR PATHWAY | Coregulation of Androgen receptor activity |
| 0.1 | 3.7 | PID PS1 PATHWAY | Presenilin action in Notch and Wnt signaling |
| 0.1 | 4.9 | PID TRKR PATHWAY | Neurotrophic factor-mediated Trk receptor signaling |
| 0.1 | 3.7 | PID FOXM1 PATHWAY | FOXM1 transcription factor network |
| 0.1 | 1.8 | PID ERBB NETWORK PATHWAY | ErbB receptor signaling network |
| 0.1 | 1.4 | PID EPHB FWD PATHWAY | EPHB forward signaling |
| 0.0 | 4.7 | PID MYC ACTIV PATHWAY | Validated targets of C-MYC transcriptional activation |
| 0.0 | 2.2 | PID ECADHERIN NASCENT AJ PATHWAY | E-cadherin signaling in the nascent adherens junction |
| 0.0 | 1.1 | PID ARF 3PATHWAY | Arf1 pathway |
| 0.0 | 0.8 | PID LPA4 PATHWAY | LPA4-mediated signaling events |
| 0.0 | 1.2 | ST FAS SIGNALING PATHWAY | Fas Signaling Pathway |
| 0.0 | 0.9 | PID LIS1 PATHWAY | Lissencephaly gene (LIS1) in neuronal migration and development |
| 0.0 | 1.4 | PID TELOMERASE PATHWAY | Regulation of Telomerase |
| 0.0 | 0.6 | PID ERBB4 PATHWAY | ErbB4 signaling events |
| 0.0 | 1.9 | PID CMYB PATHWAY | C-MYB transcription factor network |
| 0.0 | 0.6 | PID INTEGRIN CS PATHWAY | Integrin family cell surface interactions |
| 0.0 | 0.7 | PID CDC42 REG PATHWAY | Regulation of CDC42 activity |
| 0.0 | 1.1 | PID P73PATHWAY | p73 transcription factor network |
| 0.0 | 0.5 | PID AP1 PATHWAY | AP-1 transcription factor network |
| 0.0 | 0.4 | PID NCADHERIN PATHWAY | N-cadherin signaling events |
Gene overrepresentation in curated gene sets: REACTOME pathways category:
| Log-likelihood per target | Total log-likelihood | Term | Description |
|---|---|---|---|
| 2.4 | 207.7 | REACTOME RESPIRATORY ELECTRON TRANSPORT | Genes involved in Respiratory electron transport |
| 1.4 | 29.9 | REACTOME CITRIC ACID CYCLE TCA CYCLE | Genes involved in Citric acid cycle (TCA cycle) |
| 0.8 | 44.7 | REACTOME ION TRANSPORT BY P TYPE ATPASES | Genes involved in Ion transport by P-type ATPases |
| 0.7 | 18.7 | REACTOME INSULIN SYNTHESIS AND PROCESSING | Genes involved in Insulin Synthesis and Processing |
| 0.7 | 11.3 | REACTOME VITAMIN B5 PANTOTHENATE METABOLISM | Genes involved in Vitamin B5 (pantothenate) metabolism |
| 0.7 | 10.8 | REACTOME REGULATION OF PYRUVATE DEHYDROGENASE PDH COMPLEX | Genes involved in Regulation of pyruvate dehydrogenase (PDH) complex |
| 0.6 | 17.1 | REACTOME ACTIVATION OF THE AP1 FAMILY OF TRANSCRIPTION FACTORS | Genes involved in Activation of the AP-1 family of transcription factors |
| 0.6 | 32.7 | REACTOME MITOCHONDRIAL PROTEIN IMPORT | Genes involved in Mitochondrial Protein Import |
| 0.6 | 22.2 | REACTOME SIGNALING BY FGFR1 FUSION MUTANTS | Genes involved in Signaling by FGFR1 fusion mutants |
| 0.6 | 17.4 | REACTOME TRANSFERRIN ENDOCYTOSIS AND RECYCLING | Genes involved in Transferrin endocytosis and recycling |
| 0.5 | 10.9 | REACTOME ADENYLATE CYCLASE INHIBITORY PATHWAY | Genes involved in Adenylate cyclase inhibitory pathway |
| 0.5 | 11.8 | REACTOME SIGNAL REGULATORY PROTEIN SIRP FAMILY INTERACTIONS | Genes involved in Signal regulatory protein (SIRP) family interactions |
| 0.4 | 5.6 | REACTOME CALNEXIN CALRETICULIN CYCLE | Genes involved in Calnexin/calreticulin cycle |
| 0.3 | 12.2 | REACTOME SYNTHESIS SECRETION AND INACTIVATION OF GIP | Genes involved in Synthesis, Secretion, and Inactivation of Glucose-dependent Insulinotropic Polypeptide (GIP) |
| 0.3 | 5.1 | REACTOME SLBP DEPENDENT PROCESSING OF REPLICATION DEPENDENT HISTONE PRE MRNAS | Genes involved in SLBP Dependent Processing of Replication-Dependent Histone Pre-mRNAs |
| 0.3 | 2.0 | REACTOME BINDING AND ENTRY OF HIV VIRION | Genes involved in Binding and entry of HIV virion |
| 0.3 | 3.3 | REACTOME SCFSKP2 MEDIATED DEGRADATION OF P27 P21 | Genes involved in SCF(Skp2)-mediated degradation of p27/p21 |
| 0.3 | 12.0 | REACTOME PYRIMIDINE METABOLISM | Genes involved in Pyrimidine metabolism |
| 0.3 | 4.0 | REACTOME APOPTOSIS INDUCED DNA FRAGMENTATION | Genes involved in Apoptosis induced DNA fragmentation |
| 0.3 | 9.6 | REACTOME CASPASE MEDIATED CLEAVAGE OF CYTOSKELETAL PROTEINS | Genes involved in Caspase-mediated cleavage of cytoskeletal proteins |
| 0.3 | 6.6 | REACTOME GLUCURONIDATION | Genes involved in Glucuronidation |
| 0.3 | 5.4 | REACTOME TETRAHYDROBIOPTERIN BH4 SYNTHESIS RECYCLING SALVAGE AND REGULATION | Genes involved in Tetrahydrobiopterin (BH4) synthesis, recycling, salvage and regulation |
| 0.3 | 30.7 | REACTOME P75 NTR RECEPTOR MEDIATED SIGNALLING | Genes involved in p75 NTR receptor-mediated signalling |
| 0.2 | 8.0 | REACTOME SYNTHESIS AND INTERCONVERSION OF NUCLEOTIDE DI AND TRIPHOSPHATES | Genes involved in Synthesis and interconversion of nucleotide di- and triphosphates |
| 0.2 | 5.1 | REACTOME ENDOSOMAL SORTING COMPLEX REQUIRED FOR TRANSPORT ESCRT | Genes involved in Endosomal Sorting Complex Required For Transport (ESCRT) |
| 0.2 | 7.9 | REACTOME GLUTATHIONE CONJUGATION | Genes involved in Glutathione conjugation |
| 0.2 | 1.4 | REACTOME APC CDC20 MEDIATED DEGRADATION OF NEK2A | Genes involved in APC-Cdc20 mediated degradation of Nek2A |
| 0.2 | 3.4 | REACTOME PROCESSING OF INTRONLESS PRE MRNAS | Genes involved in Processing of Intronless Pre-mRNAs |
| 0.2 | 2.1 | REACTOME REGULATION OF ORNITHINE DECARBOXYLASE ODC | Genes involved in Regulation of ornithine decarboxylase (ODC) |
| 0.2 | 3.7 | REACTOME NOTCH HLH TRANSCRIPTION PATHWAY | Genes involved in Notch-HLH transcription pathway |
| 0.2 | 5.2 | REACTOME SULFUR AMINO ACID METABOLISM | Genes involved in Sulfur amino acid metabolism |
| 0.2 | 5.3 | REACTOME KINESINS | Genes involved in Kinesins |
| 0.2 | 5.4 | REACTOME CYCLIN A B1 ASSOCIATED EVENTS DURING G2 M TRANSITION | Genes involved in Cyclin A/B1 associated events during G2/M transition |
| 0.2 | 4.0 | REACTOME N GLYCAN ANTENNAE ELONGATION | Genes involved in N-Glycan antennae elongation |
| 0.2 | 2.2 | REACTOME ACTIVATION OF CHAPERONE GENES BY ATF6 ALPHA | Genes involved in Activation of Chaperone Genes by ATF6-alpha |
| 0.2 | 5.8 | REACTOME GABA SYNTHESIS RELEASE REUPTAKE AND DEGRADATION | Genes involved in GABA synthesis, release, reuptake and degradation |
| 0.1 | 7.9 | REACTOME APOPTOTIC CLEAVAGE OF CELLULAR PROTEINS | Genes involved in Apoptotic cleavage of cellular proteins |
| 0.1 | 8.6 | REACTOME COLLAGEN FORMATION | Genes involved in Collagen formation |
| 0.1 | 1.1 | REACTOME COPI MEDIATED TRANSPORT | Genes involved in COPI Mediated Transport |
| 0.1 | 2.6 | REACTOME SYNTHESIS OF BILE ACIDS AND BILE SALTS VIA 7ALPHA HYDROXYCHOLESTEROL | Genes involved in Synthesis of bile acids and bile salts via 7alpha-hydroxycholesterol |
| 0.1 | 31.7 | REACTOME ANTIGEN PROCESSING UBIQUITINATION PROTEASOME DEGRADATION | Genes involved in Antigen processing: Ubiquitination & Proteasome degradation |
| 0.1 | 4.7 | REACTOME THE ROLE OF NEF IN HIV1 REPLICATION AND DISEASE PATHOGENESIS | Genes involved in The role of Nef in HIV-1 replication and disease pathogenesis |
| 0.1 | 3.1 | REACTOME IONOTROPIC ACTIVITY OF KAINATE RECEPTORS | Genes involved in Ionotropic activity of Kainate Receptors |
| 0.1 | 4.3 | REACTOME NUCLEAR SIGNALING BY ERBB4 | Genes involved in Nuclear signaling by ERBB4 |
| 0.1 | 2.2 | REACTOME DEPOSITION OF NEW CENPA CONTAINING NUCLEOSOMES AT THE CENTROMERE | Genes involved in Deposition of New CENPA-containing Nucleosomes at the Centromere |
| 0.1 | 1.4 | REACTOME TRAFFICKING OF GLUR2 CONTAINING AMPA RECEPTORS | Genes involved in Trafficking of GluR2-containing AMPA receptors |
| 0.1 | 1.6 | REACTOME MTORC1 MEDIATED SIGNALLING | Genes involved in mTORC1-mediated signalling |
| 0.1 | 4.5 | REACTOME GLYCOLYSIS | Genes involved in Glycolysis |
| 0.1 | 1.0 | REACTOME CDC6 ASSOCIATION WITH THE ORC ORIGIN COMPLEX | Genes involved in CDC6 association with the ORC:origin complex |
| 0.1 | 1.4 | REACTOME ANTIGEN PRESENTATION FOLDING ASSEMBLY AND PEPTIDE LOADING OF CLASS I MHC | Genes involved in Antigen Presentation: Folding, assembly and peptide loading of class I MHC |
| 0.1 | 2.5 | REACTOME RAP1 SIGNALLING | Genes involved in Rap1 signalling |
| 0.1 | 1.8 | REACTOME DOWNREGULATION OF ERBB2 ERBB3 SIGNALING | Genes involved in Downregulation of ERBB2:ERBB3 signaling |
| 0.0 | 2.0 | REACTOME CHOLESTEROL BIOSYNTHESIS | Genes involved in Cholesterol biosynthesis |
| 0.0 | 2.9 | REACTOME MYOGENESIS | Genes involved in Myogenesis |
| 0.0 | 0.6 | REACTOME PEROXISOMAL LIPID METABOLISM | Genes involved in Peroxisomal lipid metabolism |
| 0.0 | 2.8 | REACTOME ANTIVIRAL MECHANISM BY IFN STIMULATED GENES | Genes involved in Antiviral mechanism by IFN-stimulated genes |
| 0.0 | 2.6 | REACTOME LOSS OF NLP FROM MITOTIC CENTROSOMES | Genes involved in Loss of Nlp from mitotic centrosomes |
| 0.0 | 0.7 | REACTOME GABA B RECEPTOR ACTIVATION | Genes involved in GABA B receptor activation |
| 0.0 | 1.3 | REACTOME INTERACTION BETWEEN L1 AND ANKYRINS | Genes involved in Interaction between L1 and Ankyrins |
| 0.0 | 2.6 | REACTOME FACTORS INVOLVED IN MEGAKARYOCYTE DEVELOPMENT AND PLATELET PRODUCTION | Genes involved in Factors involved in megakaryocyte development and platelet production |
| 0.0 | 0.5 | REACTOME METAL ION SLC TRANSPORTERS | Genes involved in Metal ion SLC transporters |
| 0.0 | 0.6 | REACTOME ASSOCIATION OF TRIC CCT WITH TARGET PROTEINS DURING BIOSYNTHESIS | Genes involved in Association of TriC/CCT with target proteins during biosynthesis |
| 0.0 | 0.2 | REACTOME SYNTHESIS OF SUBSTRATES IN N GLYCAN BIOSYTHESIS | Genes involved in Synthesis of substrates in N-glycan biosythesis |
| 0.0 | 0.9 | REACTOME GOLGI ASSOCIATED VESICLE BIOGENESIS | Genes involved in Golgi Associated Vesicle Biogenesis |