Project
GNF SymAtlas + NCI-60 cancer cell lines, human (Su, 2004; Ross, 2000)
Navigation
Downloads
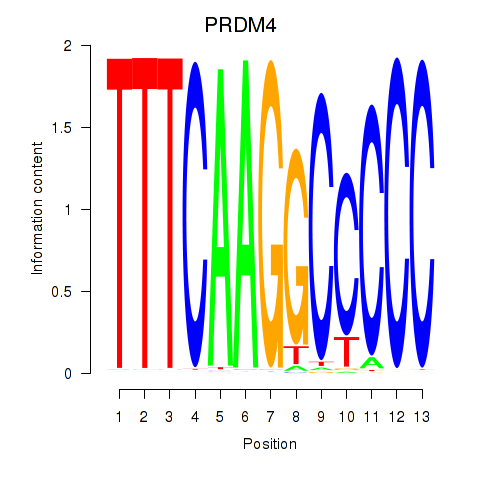
Results for PRDM4
Z-value: 0.65
Motif logo
Transcription factors associated with PRDM4
| Gene Symbol | Gene ID | Gene Info |
|---|---|---|
|
PRDM4
|
ENSG00000110851.12 | PRDM4 |
Activity-expression correlation:
| Gene | Promoter | Pearson corr. coef. | P-value | Plot |
|---|---|---|---|---|
| PRDM4 | hg38_v1_chr12_-_107761113_107761176 | -0.01 | 9.3e-01 | Click! |
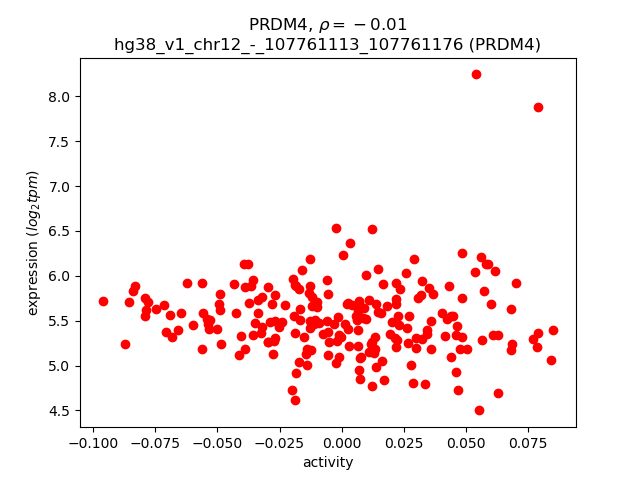
Activity profile of PRDM4 motif
Sorted Z-values of PRDM4 motif
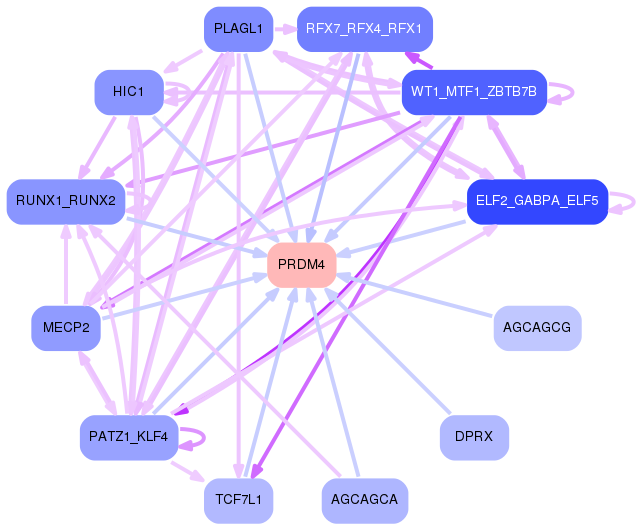
Network of associatons between targets according to the STRING database.

First level regulatory network of PRDM4
| Promoter | Score | Transcript | Gene | Gene Info |
|---|---|---|---|---|
| chr12_-_10723307 | 15.72 |
ENST00000279550.11
ENST00000228251.9 |
YBX3
|
Y-box binding protein 3 |
| chr12_-_57846686 | 15.20 |
ENST00000548823.1
ENST00000398073.7 |
CTDSP2
|
CTD small phosphatase 2 |
| chr1_-_224433776 | 13.23 |
ENST00000678879.1
ENST00000651911.2 |
WDR26
|
WD repeat domain 26 |
| chr19_+_42220283 | 10.98 |
ENST00000301215.8
ENST00000597945.1 |
ZNF526
|
zinc finger protein 526 |
| chr14_+_105486867 | 9.88 |
ENST00000409393.6
ENST00000392531.4 |
CRIP1
|
cysteine rich protein 1 |
| chr2_+_218399838 | 8.00 |
ENST00000273062.7
|
CTDSP1
|
CTD small phosphatase 1 |
| chr16_-_67936808 | 7.89 |
ENST00000358514.9
|
PSMB10
|
proteasome 20S subunit beta 10 |
| chr4_-_10116845 | 6.41 |
ENST00000382451.6
ENST00000382452.6 |
WDR1
|
WD repeat domain 1 |
| chr7_+_143381907 | 6.25 |
ENST00000392910.6
|
ZYX
|
zyxin |
| chr19_+_40611863 | 6.16 |
ENST00000601032.5
|
LTBP4
|
latent transforming growth factor beta binding protein 4 |
| chr4_-_10116779 | 6.04 |
ENST00000499869.7
|
WDR1
|
WD repeat domain 1 |
| chr20_+_62938111 | 5.66 |
ENST00000266069.5
|
GID8
|
GID complex subunit 8 homolog |
| chr7_+_143381561 | 5.63 |
ENST00000354434.8
|
ZYX
|
zyxin |
| chr21_+_33403391 | 5.55 |
ENST00000290219.11
ENST00000381995.5 |
IFNGR2
|
interferon gamma receptor 2 |
| chr12_+_69585666 | 5.42 |
ENST00000543146.2
|
CCT2
|
chaperonin containing TCP1 subunit 2 |
| chr17_+_44557476 | 5.22 |
ENST00000315323.5
|
FZD2
|
frizzled class receptor 2 |
| chr2_+_233388146 | 4.67 |
ENST00000409813.7
|
DGKD
|
diacylglycerol kinase delta |
| chr15_-_66504832 | 4.09 |
ENST00000569438.2
ENST00000569696.5 ENST00000307961.11 |
RPL4
|
ribosomal protein L4 |
| chr15_+_45023137 | 3.98 |
ENST00000674211.1
ENST00000267814.14 |
SORD
|
sorbitol dehydrogenase |
| chr14_-_95516616 | 3.89 |
ENST00000682763.1
|
SYNE3
|
spectrin repeat containing nuclear envelope family member 3 |
| chr21_+_34073569 | 3.32 |
ENST00000399312.3
ENST00000381151.5 ENST00000362077.4 |
MRPS6
SLC5A3
ENSG00000272657.1
|
mitochondrial ribosomal protein S6 solute carrier family 5 member 3 novel transcript |
| chr6_-_32192630 | 3.28 |
ENST00000375040.8
|
GPSM3
|
G protein signaling modulator 3 |
| chr4_+_673518 | 3.28 |
ENST00000506838.5
|
MYL5
|
myosin light chain 5 |
| chr4_-_82373946 | 3.06 |
ENST00000352301.8
ENST00000509107.1 ENST00000353341.8 ENST00000313899.12 |
HNRNPD
|
heterogeneous nuclear ribonucleoprotein D |
| chr6_-_32192845 | 3.01 |
ENST00000487761.5
|
GPSM3
|
G protein signaling modulator 3 |
| chr15_+_66505289 | 2.89 |
ENST00000565627.5
ENST00000564179.5 ENST00000307897.10 |
ZWILCH
|
zwilch kinetochore protein |
| chr9_+_93576557 | 2.63 |
ENST00000359246.9
ENST00000375376.8 |
PHF2
|
PHD finger protein 2 |
| chr15_+_66504959 | 2.45 |
ENST00000535141.6
ENST00000613446.4 ENST00000446801.6 |
ZWILCH
|
zwilch kinetochore protein |
| chr10_-_103918128 | 2.37 |
ENST00000224950.8
|
STN1
|
STN1 subunit of CST complex |
| chr1_+_172533104 | 2.30 |
ENST00000616058.4
ENST00000263688.4 ENST00000610051.5 |
SUCO
|
SUN domain containing ossification factor |
| chr20_-_62937936 | 2.20 |
ENST00000266070.8
ENST00000370371.8 |
DIDO1
|
death inducer-obliterator 1 |
| chr22_-_21002081 | 2.18 |
ENST00000215742.9
ENST00000399133.2 |
THAP7
|
THAP domain containing 7 |
| chr5_-_181261078 | 2.12 |
ENST00000611618.1
|
TRIM52
|
tripartite motif containing 52 |
| chr19_-_11529094 | 2.02 |
ENST00000588998.5
ENST00000586149.1 |
ECSIT
|
ECSIT signaling integrator |
| chr10_-_103452384 | 1.97 |
ENST00000369788.7
|
CALHM2
|
calcium homeostasis modulator family member 2 |
| chr1_-_42766978 | 1.95 |
ENST00000372526.2
ENST00000236040.8 ENST00000296388.10 ENST00000397054.7 |
P3H1
|
prolyl 3-hydroxylase 1 |
| chr1_+_42767241 | 1.91 |
ENST00000372525.7
|
C1orf50
|
chromosome 1 open reading frame 50 |
| chr11_+_47257953 | 1.79 |
ENST00000437276.1
ENST00000436029.5 ENST00000467728.5 ENST00000441012.7 ENST00000405853.7 |
NR1H3
|
nuclear receptor subfamily 1 group H member 3 |
| chr11_+_19117123 | 1.72 |
ENST00000399351.7
ENST00000446113.7 |
ZDHHC13
|
zinc finger DHHC-type palmitoyltransferase 13 |
| chr7_+_91264426 | 1.70 |
ENST00000287934.4
|
FZD1
|
frizzled class receptor 1 |
| chr5_+_159916475 | 1.44 |
ENST00000306675.5
|
ADRA1B
|
adrenoceptor alpha 1B |
| chr14_+_31561376 | 1.37 |
ENST00000550649.5
ENST00000281081.12 |
NUBPL
|
nucleotide binding protein like |
| chr19_-_11529116 | 1.25 |
ENST00000592312.5
ENST00000590480.1 ENST00000585318.5 ENST00000270517.12 ENST00000252440.11 ENST00000417981.6 |
ECSIT
|
ECSIT signaling integrator |
| chrX_+_49235460 | 1.24 |
ENST00000376227.4
|
CCDC22
|
coiled-coil domain containing 22 |
| chr1_+_26787667 | 1.18 |
ENST00000674335.1
|
PIGV
|
phosphatidylinositol glycan anchor biosynthesis class V |
| chr13_+_51861963 | 1.17 |
ENST00000242819.7
|
CCDC70
|
coiled-coil domain containing 70 |
| chr1_+_218345326 | 1.17 |
ENST00000366930.9
|
TGFB2
|
transforming growth factor beta 2 |
| chr2_+_203706475 | 1.08 |
ENST00000374481.7
ENST00000458610.6 |
CD28
|
CD28 molecule |
| chr1_+_26787926 | 0.96 |
ENST00000674202.1
ENST00000674222.1 |
PIGV
|
phosphatidylinositol glycan anchor biosynthesis class V |
| chr16_+_14974974 | 0.92 |
ENST00000535621.6
ENST00000396410.9 ENST00000566426.1 |
PDXDC1
|
pyridoxal dependent decarboxylase domain containing 1 |
| chr1_+_26788166 | 0.73 |
ENST00000374145.6
ENST00000431541.6 ENST00000674273.1 |
PIGV
|
phosphatidylinositol glycan anchor biosynthesis class V |
| chr5_-_103120097 | 0.73 |
ENST00000508629.5
ENST00000399004.7 |
GIN1
|
gypsy retrotransposon integrase 1 |
| chr15_-_35085295 | 0.47 |
ENST00000528386.4
|
NANOGP8
|
Nanog homeobox retrogene P8 |
| chr10_+_122163590 | 0.43 |
ENST00000368999.5
|
TACC2
|
transforming acidic coiled-coil containing protein 2 |
| chr12_+_15322480 | 0.34 |
ENST00000674188.1
ENST00000281171.9 ENST00000543886.6 |
PTPRO
|
protein tyrosine phosphatase receptor type O |
| chr17_+_7884783 | 0.26 |
ENST00000380358.9
|
CHD3
|
chromodomain helicase DNA binding protein 3 |
| chr16_+_14975098 | 0.23 |
ENST00000569715.5
ENST00000627450.2 |
PDXDC1
|
pyridoxal dependent decarboxylase domain containing 1 |
| chr4_+_673897 | 0.22 |
ENST00000505477.5
|
MYL5
|
myosin light chain 5 |
| chr14_-_105065422 | 0.12 |
ENST00000329797.8
ENST00000539291.6 ENST00000392585.2 |
GPR132
|
G protein-coupled receptor 132 |
| chrX_+_116436599 | 0.11 |
ENST00000598581.3
|
SLC6A14
|
solute carrier family 6 member 14 |
| chr12_+_15322529 | 0.09 |
ENST00000348962.7
|
PTPRO
|
protein tyrosine phosphatase receptor type O |
| chr11_+_8019193 | 0.02 |
ENST00000534099.5
|
TUB
|
TUB bipartite transcription factor |
Gene Ontology Analysis
Gene overrepresentation in biological process category:
| Log-likelihood per target | Total log-likelihood | Term | Description |
|---|---|---|---|
| 3.1 | 12.4 | GO:0042247 | morphogenesis of follicular epithelium(GO:0016333) establishment or maintenance of polarity of follicular epithelium(GO:0016334) establishment of planar polarity of follicular epithelium(GO:0042247) |
| 2.5 | 9.9 | GO:0060741 | prostate gland stromal morphogenesis(GO:0060741) |
| 2.0 | 15.7 | GO:1902219 | negative regulation of intrinsic apoptotic signaling pathway in response to osmotic stress(GO:1902219) |
| 1.3 | 4.0 | GO:0006059 | hexitol metabolic process(GO:0006059) |
| 1.1 | 3.3 | GO:0015798 | myo-inositol transport(GO:0015798) |
| 1.0 | 3.1 | GO:1901355 | response to rapamycin(GO:1901355) |
| 0.9 | 6.9 | GO:0003150 | muscular septum morphogenesis(GO:0003150) |
| 0.8 | 5.4 | GO:0090666 | scaRNA localization to Cajal body(GO:0090666) |
| 0.7 | 2.6 | GO:0061187 | regulation of chromatin silencing at rDNA(GO:0061187) negative regulation of chromatin silencing at rDNA(GO:0061188) |
| 0.6 | 1.9 | GO:1901874 | negative regulation of post-translational protein modification(GO:1901874) |
| 0.6 | 1.8 | GO:0090341 | negative regulation of secretion of lysosomal enzymes(GO:0090341) |
| 0.4 | 6.3 | GO:1900017 | positive regulation of cytokine production involved in inflammatory response(GO:1900017) |
| 0.4 | 1.2 | GO:0042704 | uterine wall breakdown(GO:0042704) |
| 0.4 | 1.4 | GO:0001994 | norepinephrine-epinephrine vasoconstriction involved in regulation of systemic arterial blood pressure(GO:0001994) |
| 0.3 | 3.9 | GO:0090286 | cytoskeletal anchoring at nuclear membrane(GO:0090286) |
| 0.2 | 4.7 | GO:0046339 | diacylglycerol metabolic process(GO:0046339) |
| 0.2 | 6.2 | GO:0030252 | growth hormone secretion(GO:0030252) |
| 0.1 | 5.5 | GO:0060334 | regulation of interferon-gamma-mediated signaling pathway(GO:0060334) |
| 0.1 | 2.9 | GO:0016254 | preassembly of GPI anchor in ER membrane(GO:0016254) |
| 0.1 | 23.2 | GO:2000134 | negative regulation of G1/S transition of mitotic cell cycle(GO:2000134) |
| 0.1 | 0.4 | GO:0036058 | filtration diaphragm assembly(GO:0036058) slit diaphragm assembly(GO:0036060) |
| 0.1 | 1.7 | GO:1903830 | magnesium ion transmembrane transport(GO:1903830) |
| 0.1 | 2.3 | GO:0032967 | positive regulation of collagen biosynthetic process(GO:0032967) |
| 0.1 | 7.5 | GO:0031146 | SCF-dependent proteasomal ubiquitin-dependent protein catabolic process(GO:0031146) |
| 0.1 | 1.2 | GO:0007253 | cytoplasmic sequestering of NF-kappaB(GO:0007253) |
| 0.1 | 2.4 | GO:0032211 | negative regulation of telomere maintenance via telomerase(GO:0032211) |
| 0.1 | 1.1 | GO:0002863 | positive regulation of inflammatory response to antigenic stimulus(GO:0002863) |
| 0.1 | 11.9 | GO:0043149 | integrin-mediated signaling pathway(GO:0007229) contractile actin filament bundle assembly(GO:0030038) stress fiber assembly(GO:0043149) |
| 0.1 | 4.6 | GO:0032981 | NADH dehydrogenase complex assembly(GO:0010257) mitochondrial respiratory chain complex I assembly(GO:0032981) mitochondrial respiratory chain complex I biogenesis(GO:0097031) |
| 0.1 | 0.7 | GO:0015074 | DNA integration(GO:0015074) |
| 0.0 | 5.3 | GO:0007093 | mitotic cell cycle checkpoint(GO:0007093) |
| 0.0 | 4.1 | GO:0002181 | cytoplasmic translation(GO:0002181) |
| 0.0 | 0.1 | GO:0010972 | negative regulation of G2/M transition of mitotic cell cycle(GO:0010972) |
| 0.0 | 3.5 | GO:0006937 | regulation of muscle contraction(GO:0006937) |
| 0.0 | 2.1 | GO:0051092 | positive regulation of NF-kappaB transcription factor activity(GO:0051092) |
Gene overrepresentation in cellular component category:
| Log-likelihood per target | Total log-likelihood | Term | Description |
|---|---|---|---|
| 2.5 | 12.4 | GO:0042643 | actomyosin, actin portion(GO:0042643) |
| 1.3 | 5.3 | GO:1990423 | RZZ complex(GO:1990423) |
| 1.1 | 7.9 | GO:1990111 | spermatoproteasome complex(GO:1990111) |
| 0.6 | 2.4 | GO:1990879 | CST complex(GO:1990879) |
| 0.5 | 2.9 | GO:0031501 | mannosyltransferase complex(GO:0031501) |
| 0.4 | 5.4 | GO:0002199 | zona pellucida receptor complex(GO:0002199) |
| 0.3 | 3.9 | GO:0034993 | microtubule organizing center attachment site(GO:0034992) LINC complex(GO:0034993) |
| 0.2 | 15.7 | GO:0005844 | polysome(GO:0005844) |
| 0.1 | 3.3 | GO:0005763 | organellar small ribosomal subunit(GO:0000314) mitochondrial small ribosomal subunit(GO:0005763) |
| 0.1 | 11.9 | GO:0001725 | stress fiber(GO:0001725) contractile actin filament bundle(GO:0097517) |
| 0.1 | 1.7 | GO:1990909 | Wnt signalosome(GO:1990909) |
| 0.1 | 3.5 | GO:0005859 | muscle myosin complex(GO:0005859) |
| 0.1 | 2.3 | GO:0030867 | rough endoplasmic reticulum membrane(GO:0030867) |
| 0.1 | 5.2 | GO:0030669 | clathrin-coated endocytic vesicle membrane(GO:0030669) |
| 0.1 | 4.1 | GO:0005791 | rough endoplasmic reticulum(GO:0005791) |
| 0.0 | 1.7 | GO:0030660 | Golgi-associated vesicle membrane(GO:0030660) |
| 0.0 | 4.0 | GO:0031514 | motile cilium(GO:0031514) |
| 0.0 | 2.6 | GO:0000777 | condensed chromosome kinetochore(GO:0000777) |
| 0.0 | 1.1 | GO:0098636 | protein complex involved in cell adhesion(GO:0098636) |
| 0.0 | 6.4 | GO:0005578 | proteinaceous extracellular matrix(GO:0005578) |
| 0.0 | 1.2 | GO:0031093 | platelet alpha granule lumen(GO:0031093) |
| 0.0 | 1.4 | GO:0005901 | caveola(GO:0005901) |
Gene overrepresentation in molecular function category:
| Log-likelihood per target | Total log-likelihood | Term | Description |
|---|---|---|---|
| 3.9 | 23.2 | GO:0008420 | CTD phosphatase activity(GO:0008420) |
| 1.4 | 5.5 | GO:0004906 | interferon-gamma receptor activity(GO:0004906) |
| 1.0 | 2.9 | GO:0004584 | dolichyl-phosphate-mannose-glycolipid alpha-mannosyltransferase activity(GO:0004584) |
| 0.8 | 12.9 | GO:0003680 | AT DNA binding(GO:0003680) |
| 0.5 | 1.9 | GO:0019797 | procollagen-proline 3-dioxygenase activity(GO:0019797) |
| 0.5 | 1.4 | GO:0004937 | alpha1-adrenergic receptor activity(GO:0004937) |
| 0.5 | 3.3 | GO:0015166 | polyol transmembrane transporter activity(GO:0015166) |
| 0.4 | 1.8 | GO:0032810 | sterol response element binding(GO:0032810) |
| 0.3 | 6.9 | GO:0042813 | Wnt-activated receptor activity(GO:0042813) |
| 0.3 | 7.9 | GO:0070003 | threonine-type endopeptidase activity(GO:0004298) threonine-type peptidase activity(GO:0070003) |
| 0.3 | 4.7 | GO:0004143 | diacylglycerol kinase activity(GO:0004143) |
| 0.2 | 6.2 | GO:0005024 | transforming growth factor beta-activated receptor activity(GO:0005024) |
| 0.2 | 6.3 | GO:0005092 | GDP-dissociation inhibitor activity(GO:0005092) |
| 0.2 | 1.2 | GO:0034714 | type III transforming growth factor beta receptor binding(GO:0034714) |
| 0.1 | 2.4 | GO:0043047 | single-stranded telomeric DNA binding(GO:0043047) |
| 0.1 | 5.4 | GO:0044183 | protein binding involved in protein folding(GO:0044183) |
| 0.1 | 2.6 | GO:0032454 | histone demethylase activity (H3-K9 specific)(GO:0032454) |
| 0.1 | 15.7 | GO:0003730 | mRNA 3'-UTR binding(GO:0003730) |
| 0.1 | 1.7 | GO:0015095 | magnesium ion transmembrane transporter activity(GO:0015095) |
| 0.1 | 2.2 | GO:0070742 | C2H2 zinc finger domain binding(GO:0070742) |
| 0.1 | 1.2 | GO:0097602 | cullin family protein binding(GO:0097602) |
| 0.1 | 16.3 | GO:0051015 | actin filament binding(GO:0051015) |
| 0.0 | 3.5 | GO:0008307 | structural constituent of muscle(GO:0008307) |
| 0.0 | 4.0 | GO:0051287 | NAD binding(GO:0051287) |
| 0.0 | 0.4 | GO:0017147 | Wnt-protein binding(GO:0017147) |
| 0.0 | 1.4 | GO:0051539 | 4 iron, 4 sulfur cluster binding(GO:0051539) |
| 0.0 | 3.3 | GO:0016651 | oxidoreductase activity, acting on NAD(P)H(GO:0016651) |
| 0.0 | 1.2 | GO:0016831 | carboxy-lyase activity(GO:0016831) |
| 0.0 | 1.1 | GO:0015026 | coreceptor activity(GO:0015026) |
| 0.0 | 4.1 | GO:0003735 | structural constituent of ribosome(GO:0003735) |
Gene overrepresentation in curated gene sets: canonical pathways category:
| Log-likelihood per target | Total log-likelihood | Term | Description |
|---|---|---|---|
| 0.6 | 23.2 | PID SMAD2 3PATHWAY | Regulation of cytoplasmic and nuclear SMAD2/3 signaling |
| 0.3 | 11.9 | PID ECADHERIN KERATINOCYTE PATHWAY | E-cadherin signaling in keratinocytes |
| 0.2 | 6.9 | PID WNT SIGNALING PATHWAY | Wnt signaling network |
| 0.0 | 1.2 | PID HEDGEHOG 2PATHWAY | Signaling events mediated by the Hedgehog family |
| 0.0 | 1.8 | PID RXR VDR PATHWAY | RXR and RAR heterodimerization with other nuclear receptor |
| 0.0 | 6.2 | NABA ECM GLYCOPROTEINS | Genes encoding structural ECM glycoproteins |
| 0.0 | 1.1 | PID IL12 STAT4 PATHWAY | IL12 signaling mediated by STAT4 |
| 0.0 | 1.4 | PID LYSOPHOSPHOLIPID PATHWAY | LPA receptor mediated events |
Gene overrepresentation in curated gene sets: REACTOME pathways category:
| Log-likelihood per target | Total log-likelihood | Term | Description |
|---|---|---|---|
| 0.2 | 5.5 | REACTOME REGULATION OF IFNG SIGNALING | Genes involved in Regulation of IFNG signaling |
| 0.2 | 12.9 | REACTOME ACTIVATION OF CHAPERONE GENES BY XBP1S | Genes involved in Activation of Chaperone Genes by XBP1(S) |
| 0.2 | 5.4 | REACTOME FORMATION OF TUBULIN FOLDING INTERMEDIATES BY CCT TRIC | Genes involved in Formation of tubulin folding intermediates by CCT/TriC |
| 0.1 | 2.9 | REACTOME SYNTHESIS OF GLYCOSYLPHOSPHATIDYLINOSITOL GPI | Genes involved in Synthesis of glycosylphosphatidylinositol (GPI) |
| 0.1 | 10.9 | REACTOME DESTABILIZATION OF MRNA BY AUF1 HNRNP D0 | Genes involved in Destabilization of mRNA by AUF1 (hnRNP D0) |
| 0.1 | 4.7 | REACTOME EFFECTS OF PIP2 HYDROLYSIS | Genes involved in Effects of PIP2 hydrolysis |
| 0.1 | 13.6 | REACTOME RESPONSE TO ELEVATED PLATELET CYTOSOLIC CA2 | Genes involved in Response to elevated platelet cytosolic Ca2+ |
| 0.1 | 6.9 | REACTOME CLASS B 2 SECRETIN FAMILY RECEPTORS | Genes involved in Class B/2 (Secretin family receptors) |
| 0.0 | 5.3 | REACTOME MITOTIC PROMETAPHASE | Genes involved in Mitotic Prometaphase |
| 0.0 | 2.2 | REACTOME MEIOTIC SYNAPSIS | Genes involved in Meiotic Synapsis |
| 0.0 | 1.1 | REACTOME CD28 DEPENDENT VAV1 PATHWAY | Genes involved in CD28 dependent Vav1 pathway |
| 0.0 | 1.4 | REACTOME AMINE LIGAND BINDING RECEPTORS | Genes involved in Amine ligand-binding receptors |
| 0.0 | 3.4 | REACTOME TRANSPORT OF GLUCOSE AND OTHER SUGARS BILE SALTS AND ORGANIC ACIDS METAL IONS AND AMINE COMPOUNDS | Genes involved in Transport of glucose and other sugars, bile salts and organic acids, metal ions and amine compounds |
| 0.0 | 3.3 | REACTOME TRAF6 MEDIATED INDUCTION OF NFKB AND MAP KINASES UPON TLR7 8 OR 9 ACTIVATION | Genes involved in TRAF6 mediated induction of NFkB and MAP kinases upon TLR7/8 or 9 activation |
| 0.0 | 4.1 | REACTOME PEPTIDE CHAIN ELONGATION | Genes involved in Peptide chain elongation |