Project
GNF SymAtlas + NCI-60 cancer cell lines, human (Su, 2004; Ross, 2000)
Navigation
Downloads
Results for RAD21_SMC3
Z-value: 0.89
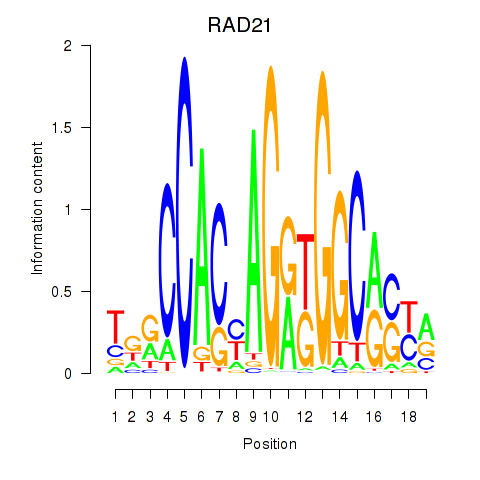
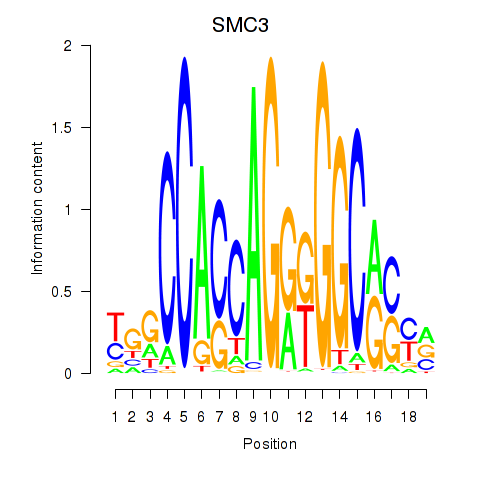
Motif logo
Transcription factors associated with RAD21_SMC3
| Gene Symbol | Gene ID | Gene Info |
|---|---|---|
|
RAD21
|
ENSG00000164754.15 | RAD21 |
|
SMC3
|
ENSG00000108055.10 | SMC3 |
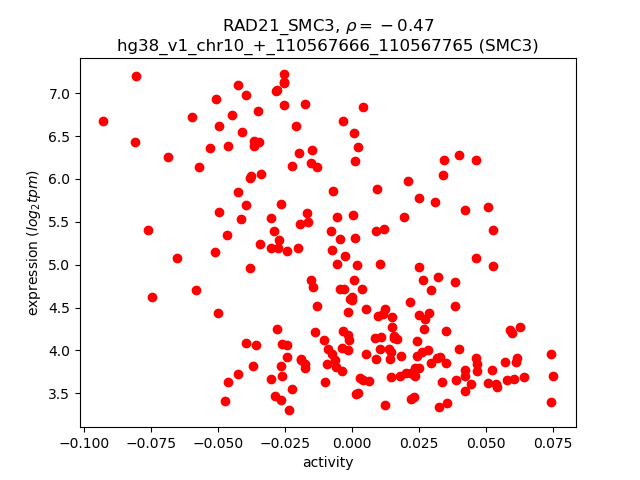
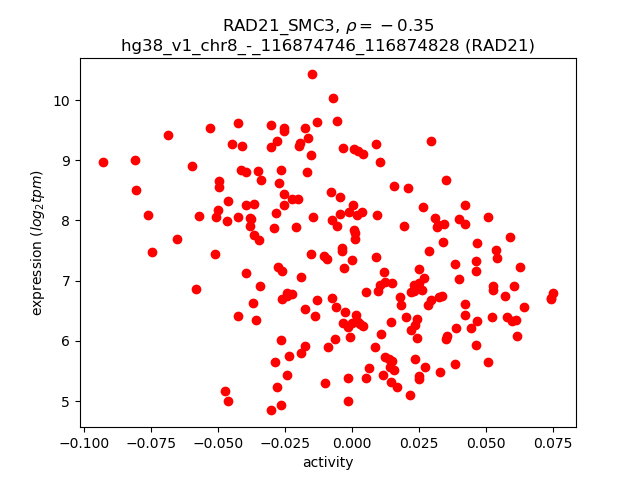
Activity-expression correlation:
| Gene | Promoter | Pearson corr. coef. | P-value | Plot |
|---|---|---|---|---|
| SMC3 | hg38_v1_chr10_+_110567666_110567765 | -0.47 | 1.4e-13 | Click! |
| RAD21 | hg38_v1_chr8_-_116874746_116874828 | -0.35 | 1.4e-07 | Click! |
Activity profile of RAD21_SMC3 motif
Sorted Z-values of RAD21_SMC3 motif
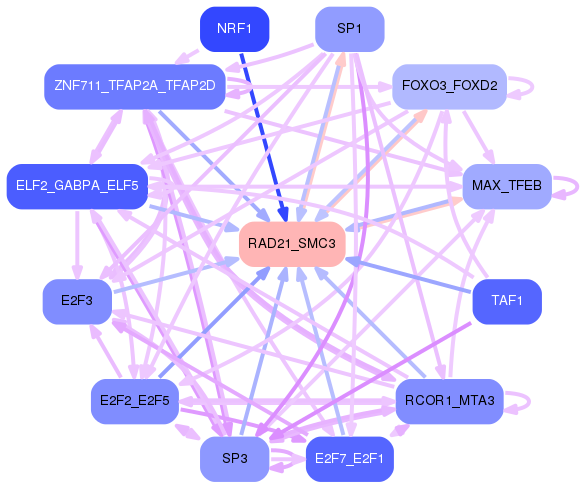
Network of associatons between targets according to the STRING database.

First level regulatory network of RAD21_SMC3
Gene Ontology Analysis
Gene overrepresentation in biological process category:
| Log-likelihood per target | Total log-likelihood | Term | Description |
|---|---|---|---|
| 13.2 | 39.6 | GO:0016185 | synaptic vesicle budding from presynaptic endocytic zone membrane(GO:0016185) |
| 5.8 | 23.4 | GO:0033693 | neurofilament bundle assembly(GO:0033693) |
| 5.1 | 15.3 | GO:0016256 | N-glycan processing to lysosome(GO:0016256) |
| 4.3 | 26.1 | GO:0032380 | regulation of intracellular lipid transport(GO:0032377) regulation of intracellular sterol transport(GO:0032380) regulation of intracellular cholesterol transport(GO:0032383) |
| 2.7 | 8.2 | GO:0046586 | regulation of calcium-dependent cell-cell adhesion(GO:0046586) |
| 2.7 | 19.0 | GO:0070127 | tRNA aminoacylation for mitochondrial protein translation(GO:0070127) |
| 2.5 | 10.1 | GO:0034628 | nicotinamide nucleotide biosynthetic process from aspartate(GO:0019355) 'de novo' NAD biosynthetic process(GO:0034627) 'de novo' NAD biosynthetic process from aspartate(GO:0034628) |
| 2.2 | 10.8 | GO:0090258 | negative regulation of mitochondrial fission(GO:0090258) |
| 2.0 | 12.1 | GO:0045819 | positive regulation of glycogen catabolic process(GO:0045819) |
| 1.9 | 7.8 | GO:0043314 | negative regulation of neutrophil degranulation(GO:0043314) |
| 1.9 | 5.8 | GO:0036090 | cleavage furrow ingression(GO:0036090) |
| 1.7 | 10.0 | GO:0006398 | mRNA 3'-end processing by stem-loop binding and cleavage(GO:0006398) |
| 1.5 | 9.2 | GO:0032252 | secretory granule localization(GO:0032252) |
| 1.3 | 3.9 | GO:2000819 | regulation of nucleotide-excision repair(GO:2000819) |
| 1.3 | 3.9 | GO:0099557 | trans-synaptic signaling by trans-synaptic complex, modulating synaptic transmission(GO:0099557) |
| 1.2 | 13.1 | GO:0097116 | gephyrin clustering involved in postsynaptic density assembly(GO:0097116) |
| 1.2 | 4.8 | GO:1900019 | regulation of protein kinase C activity(GO:1900019) positive regulation of protein kinase C activity(GO:1900020) |
| 1.2 | 4.7 | GO:0099550 | trans-synaptic signalling, modulating synaptic transmission(GO:0099550) |
| 1.1 | 3.3 | GO:0072573 | regulation of toll-like receptor 5 signaling pathway(GO:0034147) negative regulation of toll-like receptor 5 signaling pathway(GO:0034148) negative regulation of nucleotide-binding oligomerization domain containing 1 signaling pathway(GO:0070429) tolerance induction to lipopolysaccharide(GO:0072573) |
| 1.1 | 4.2 | GO:1990502 | dense core granule maturation(GO:1990502) |
| 1.1 | 6.3 | GO:0021707 | cerebellar granular layer formation(GO:0021684) cerebellar granule cell differentiation(GO:0021707) positive regulation of long term synaptic depression(GO:1900454) |
| 1.0 | 12.8 | GO:0008627 | intrinsic apoptotic signaling pathway in response to osmotic stress(GO:0008627) |
| 1.0 | 3.9 | GO:1990637 | response to prolactin(GO:1990637) |
| 0.9 | 9.3 | GO:0010593 | negative regulation of lamellipodium assembly(GO:0010593) |
| 0.9 | 6.4 | GO:1904100 | regulation of protein O-linked glycosylation(GO:1904098) positive regulation of protein O-linked glycosylation(GO:1904100) |
| 0.9 | 2.7 | GO:0098974 | postsynaptic actin cytoskeleton organization(GO:0098974) |
| 0.9 | 3.6 | GO:1904020 | regulation of G-protein coupled receptor internalization(GO:1904020) negative regulation of G-protein coupled receptor internalization(GO:1904021) |
| 0.9 | 16.7 | GO:0060907 | positive regulation of macrophage cytokine production(GO:0060907) |
| 0.9 | 2.6 | GO:1903028 | positive regulation of opsonization(GO:1903028) |
| 0.8 | 6.7 | GO:0070236 | regulation of activation-induced cell death of T cells(GO:0070235) negative regulation of activation-induced cell death of T cells(GO:0070236) |
| 0.8 | 2.5 | GO:1901492 | positive regulation of lymphangiogenesis(GO:1901492) |
| 0.8 | 5.7 | GO:0021798 | forebrain dorsal/ventral pattern formation(GO:0021798) |
| 0.8 | 7.1 | GO:0007217 | tachykinin receptor signaling pathway(GO:0007217) |
| 0.8 | 2.3 | GO:0002503 | peptide antigen assembly with MHC class II protein complex(GO:0002503) |
| 0.8 | 3.1 | GO:0090290 | positive regulation of osteoclast proliferation(GO:0090290) |
| 0.8 | 6.1 | GO:0071907 | determination of digestive tract left/right asymmetry(GO:0071907) |
| 0.7 | 9.7 | GO:0044387 | negative regulation of protein kinase activity by regulation of protein phosphorylation(GO:0044387) |
| 0.7 | 2.8 | GO:0030037 | actin filament reorganization involved in cell cycle(GO:0030037) |
| 0.7 | 14.8 | GO:0021756 | striatum development(GO:0021756) |
| 0.7 | 2.7 | GO:0031627 | telomeric loop formation(GO:0031627) |
| 0.7 | 2.6 | GO:1903347 | negative regulation of bicellular tight junction assembly(GO:1903347) |
| 0.6 | 18.6 | GO:0034643 | establishment of mitochondrion localization, microtubule-mediated(GO:0034643) mitochondrion transport along microtubule(GO:0047497) |
| 0.6 | 2.5 | GO:0050893 | sensory processing(GO:0050893) |
| 0.6 | 4.3 | GO:0010961 | cellular magnesium ion homeostasis(GO:0010961) |
| 0.6 | 7.9 | GO:0033617 | mitochondrial respiratory chain complex IV assembly(GO:0033617) |
| 0.6 | 10.6 | GO:2000291 | regulation of myoblast proliferation(GO:2000291) |
| 0.6 | 5.8 | GO:0006390 | transcription from mitochondrial promoter(GO:0006390) |
| 0.6 | 14.0 | GO:0046339 | diacylglycerol metabolic process(GO:0046339) |
| 0.6 | 2.9 | GO:1990164 | histone H3-S28 phosphorylation(GO:0043988) histone H2A phosphorylation(GO:1990164) |
| 0.6 | 4.6 | GO:0034454 | microtubule anchoring at centrosome(GO:0034454) positive regulation of microtubule nucleation(GO:0090063) |
| 0.6 | 2.9 | GO:1902255 | positive regulation of intrinsic apoptotic signaling pathway by p53 class mediator(GO:1902255) |
| 0.6 | 2.3 | GO:0016095 | polyprenol catabolic process(GO:0016095) dolichol metabolic process(GO:0019348) |
| 0.6 | 5.7 | GO:1990504 | dense core granule exocytosis(GO:1990504) |
| 0.6 | 1.7 | GO:0071529 | cementum mineralization(GO:0071529) |
| 0.6 | 3.9 | GO:0045163 | clustering of voltage-gated potassium channels(GO:0045163) |
| 0.6 | 1.7 | GO:2000722 | mineralocorticoid receptor signaling pathway(GO:0031959) regulation of cardiac vascular smooth muscle cell differentiation(GO:2000722) |
| 0.6 | 6.6 | GO:0034472 | snRNA 3'-end processing(GO:0034472) |
| 0.5 | 7.7 | GO:0098719 | sodium ion import across plasma membrane(GO:0098719) sodium ion import into cell(GO:1990118) |
| 0.5 | 3.3 | GO:0045084 | positive regulation of interleukin-12 biosynthetic process(GO:0045084) |
| 0.5 | 3.2 | GO:2000418 | positive regulation of eosinophil migration(GO:2000418) |
| 0.5 | 3.6 | GO:0033353 | S-adenosylmethionine cycle(GO:0033353) |
| 0.5 | 3.9 | GO:0000160 | phosphorelay signal transduction system(GO:0000160) |
| 0.5 | 2.0 | GO:0035948 | positive regulation of gluconeogenesis by positive regulation of transcription from RNA polymerase II promoter(GO:0035948) |
| 0.5 | 7.7 | GO:0048304 | positive regulation of isotype switching to IgG isotypes(GO:0048304) |
| 0.5 | 13.0 | GO:0048820 | hair follicle maturation(GO:0048820) |
| 0.5 | 1.4 | GO:0044313 | protein K6-linked deubiquitination(GO:0044313) |
| 0.5 | 1.8 | GO:0002268 | follicular dendritic cell differentiation(GO:0002268) |
| 0.4 | 5.9 | GO:0035372 | protein localization to microtubule(GO:0035372) |
| 0.4 | 3.3 | GO:0051122 | hepoxilin metabolic process(GO:0051121) hepoxilin biosynthetic process(GO:0051122) |
| 0.4 | 2.5 | GO:0032483 | regulation of Rab protein signal transduction(GO:0032483) |
| 0.4 | 1.2 | GO:0045897 | positive regulation of transcription during mitosis(GO:0045897) |
| 0.4 | 1.2 | GO:0010587 | miRNA catabolic process(GO:0010587) |
| 0.4 | 6.0 | GO:0006703 | estrogen biosynthetic process(GO:0006703) |
| 0.4 | 4.0 | GO:0032286 | central nervous system myelin maintenance(GO:0032286) |
| 0.4 | 1.2 | GO:0036166 | phenotypic switching(GO:0036166) regulation of phenotypic switching(GO:1900239) |
| 0.4 | 6.1 | GO:0032957 | inositol trisphosphate metabolic process(GO:0032957) |
| 0.4 | 5.7 | GO:0031293 | membrane protein intracellular domain proteolysis(GO:0031293) |
| 0.4 | 1.9 | GO:0007198 | adenylate cyclase-inhibiting serotonin receptor signaling pathway(GO:0007198) |
| 0.4 | 2.6 | GO:0010890 | positive regulation of sequestering of triglyceride(GO:0010890) |
| 0.4 | 16.0 | GO:0048791 | calcium ion-regulated exocytosis of neurotransmitter(GO:0048791) |
| 0.4 | 7.1 | GO:0038180 | nerve growth factor signaling pathway(GO:0038180) |
| 0.3 | 1.0 | GO:0002588 | positive regulation of antigen processing and presentation of peptide or polysaccharide antigen via MHC class II(GO:0002582) positive regulation of antigen processing and presentation of peptide antigen(GO:0002585) positive regulation of antigen processing and presentation of peptide antigen via MHC class II(GO:0002588) |
| 0.3 | 2.0 | GO:0071351 | interleukin-18-mediated signaling pathway(GO:0035655) cellular response to interleukin-18(GO:0071351) |
| 0.3 | 3.9 | GO:0030213 | hyaluronan biosynthetic process(GO:0030213) |
| 0.3 | 2.9 | GO:0090649 | response to oxygen-glucose deprivation(GO:0090649) cellular response to oxygen-glucose deprivation(GO:0090650) |
| 0.3 | 3.6 | GO:1904424 | regulation of GTP binding(GO:1904424) |
| 0.3 | 3.6 | GO:0042985 | negative regulation of amyloid precursor protein biosynthetic process(GO:0042985) |
| 0.3 | 3.5 | GO:0032594 | protein transport within lipid bilayer(GO:0032594) |
| 0.3 | 1.6 | GO:0035990 | tendon cell differentiation(GO:0035990) tendon formation(GO:0035992) |
| 0.3 | 5.3 | GO:0060973 | cell migration involved in heart development(GO:0060973) |
| 0.3 | 6.3 | GO:1903861 | positive regulation of dendrite extension(GO:1903861) |
| 0.3 | 4.4 | GO:0050966 | detection of mechanical stimulus involved in sensory perception of pain(GO:0050966) |
| 0.3 | 0.9 | GO:0043652 | engulfment of apoptotic cell(GO:0043652) |
| 0.3 | 3.0 | GO:0048386 | positive regulation of retinoic acid receptor signaling pathway(GO:0048386) |
| 0.3 | 3.3 | GO:1904263 | positive regulation of TORC1 signaling(GO:1904263) |
| 0.3 | 2.7 | GO:0036066 | protein O-linked fucosylation(GO:0036066) |
| 0.3 | 3.2 | GO:0033327 | Leydig cell differentiation(GO:0033327) |
| 0.3 | 2.3 | GO:0045023 | G0 to G1 transition(GO:0045023) |
| 0.3 | 2.8 | GO:1902857 | positive regulation of nonmotile primary cilium assembly(GO:1902857) |
| 0.3 | 0.8 | GO:2000832 | negative regulation of steroid hormone secretion(GO:2000832) negative regulation of corticosteroid hormone secretion(GO:2000847) negative regulation of glucocorticoid secretion(GO:2000850) |
| 0.3 | 4.1 | GO:0009642 | response to light intensity(GO:0009642) |
| 0.3 | 1.6 | GO:0051694 | pointed-end actin filament capping(GO:0051694) |
| 0.3 | 2.2 | GO:0034625 | fatty acid elongation, saturated fatty acid(GO:0019367) fatty acid elongation, unsaturated fatty acid(GO:0019368) fatty acid elongation, monounsaturated fatty acid(GO:0034625) fatty acid elongation, polyunsaturated fatty acid(GO:0034626) |
| 0.3 | 3.2 | GO:0030321 | transepithelial chloride transport(GO:0030321) |
| 0.3 | 0.8 | GO:0046967 | antigen processing and presentation of peptide antigen via MHC class Ib(GO:0002428) cytosol to ER transport(GO:0046967) |
| 0.3 | 1.6 | GO:0042997 | negative regulation of low-density lipoprotein particle clearance(GO:0010989) negative regulation of Golgi to plasma membrane protein transport(GO:0042997) |
| 0.3 | 9.2 | GO:0042994 | cytoplasmic sequestering of transcription factor(GO:0042994) |
| 0.3 | 3.3 | GO:2000574 | regulation of microtubule motor activity(GO:2000574) |
| 0.2 | 12.2 | GO:0032728 | positive regulation of interferon-beta production(GO:0032728) |
| 0.2 | 0.7 | GO:0002019 | regulation of renal output by angiotensin(GO:0002019) |
| 0.2 | 3.0 | GO:0071318 | cellular response to ATP(GO:0071318) |
| 0.2 | 1.3 | GO:0090116 | C-5 methylation of cytosine(GO:0090116) |
| 0.2 | 0.9 | GO:0006408 | snRNA export from nucleus(GO:0006408) |
| 0.2 | 2.3 | GO:0030050 | vesicle transport along actin filament(GO:0030050) |
| 0.2 | 1.1 | GO:2000143 | negative regulation of DNA-templated transcription, initiation(GO:2000143) |
| 0.2 | 2.7 | GO:0035878 | nail development(GO:0035878) |
| 0.2 | 8.2 | GO:2000114 | regulation of establishment of cell polarity(GO:2000114) |
| 0.2 | 1.6 | GO:0007185 | transmembrane receptor protein tyrosine phosphatase signaling pathway(GO:0007185) |
| 0.2 | 2.0 | GO:0036159 | inner dynein arm assembly(GO:0036159) |
| 0.2 | 4.5 | GO:0032802 | low-density lipoprotein particle receptor catabolic process(GO:0032802) |
| 0.2 | 1.2 | GO:0002865 | negative regulation of acute inflammatory response to antigenic stimulus(GO:0002865) |
| 0.2 | 3.0 | GO:0040032 | post-embryonic body morphogenesis(GO:0040032) |
| 0.2 | 3.1 | GO:0048266 | behavioral response to pain(GO:0048266) |
| 0.2 | 5.1 | GO:0040020 | regulation of meiotic nuclear division(GO:0040020) |
| 0.2 | 0.5 | GO:0001994 | norepinephrine-epinephrine vasoconstriction involved in regulation of systemic arterial blood pressure(GO:0001994) |
| 0.2 | 5.7 | GO:0007202 | activation of phospholipase C activity(GO:0007202) |
| 0.2 | 5.6 | GO:0006337 | nucleosome disassembly(GO:0006337) |
| 0.2 | 14.1 | GO:0010812 | negative regulation of cell-substrate adhesion(GO:0010812) |
| 0.2 | 5.9 | GO:0008045 | motor neuron axon guidance(GO:0008045) |
| 0.2 | 9.2 | GO:0019228 | neuronal action potential(GO:0019228) |
| 0.2 | 2.6 | GO:0043517 | positive regulation of DNA damage response, signal transduction by p53 class mediator(GO:0043517) |
| 0.2 | 5.4 | GO:0090140 | regulation of mitochondrial fission(GO:0090140) |
| 0.2 | 2.3 | GO:0006020 | inositol metabolic process(GO:0006020) |
| 0.2 | 0.8 | GO:0060363 | cranial suture morphogenesis(GO:0060363) |
| 0.1 | 4.9 | GO:0045746 | negative regulation of Notch signaling pathway(GO:0045746) |
| 0.1 | 7.3 | GO:0051058 | negative regulation of Ras protein signal transduction(GO:0046580) negative regulation of small GTPase mediated signal transduction(GO:0051058) |
| 0.1 | 7.9 | GO:0015701 | bicarbonate transport(GO:0015701) |
| 0.1 | 0.6 | GO:0010533 | regulation of activation of Janus kinase activity(GO:0010533) |
| 0.1 | 2.4 | GO:0015671 | oxygen transport(GO:0015671) |
| 0.1 | 7.4 | GO:0034260 | negative regulation of GTPase activity(GO:0034260) |
| 0.1 | 0.4 | GO:0033499 | galactose catabolic process via UDP-galactose(GO:0033499) |
| 0.1 | 6.7 | GO:0007257 | activation of JUN kinase activity(GO:0007257) |
| 0.1 | 2.6 | GO:0030575 | nuclear body organization(GO:0030575) |
| 0.1 | 9.0 | GO:0051865 | protein autoubiquitination(GO:0051865) |
| 0.1 | 0.8 | GO:0061624 | fructose catabolic process(GO:0006001) fructose catabolic process to hydroxyacetone phosphate and glyceraldehyde-3-phosphate(GO:0061624) |
| 0.1 | 5.5 | GO:0035735 | intraciliary transport involved in cilium morphogenesis(GO:0035735) |
| 0.1 | 3.0 | GO:0002089 | lens morphogenesis in camera-type eye(GO:0002089) |
| 0.1 | 6.0 | GO:0016486 | peptide hormone processing(GO:0016486) |
| 0.1 | 2.4 | GO:0032515 | negative regulation of phosphoprotein phosphatase activity(GO:0032515) |
| 0.1 | 12.5 | GO:1903955 | positive regulation of protein targeting to mitochondrion(GO:1903955) |
| 0.1 | 1.8 | GO:0014850 | response to muscle activity(GO:0014850) |
| 0.1 | 1.2 | GO:0045945 | positive regulation of transcription from RNA polymerase III promoter(GO:0045945) |
| 0.1 | 3.5 | GO:0014002 | astrocyte development(GO:0014002) |
| 0.1 | 3.2 | GO:0050919 | negative chemotaxis(GO:0050919) |
| 0.1 | 1.9 | GO:0022038 | corpus callosum development(GO:0022038) |
| 0.1 | 1.3 | GO:0042346 | positive regulation of NF-kappaB import into nucleus(GO:0042346) |
| 0.1 | 4.9 | GO:0042982 | amyloid precursor protein metabolic process(GO:0042982) |
| 0.1 | 11.2 | GO:0050728 | negative regulation of inflammatory response(GO:0050728) |
| 0.1 | 2.3 | GO:0048745 | smooth muscle tissue development(GO:0048745) |
| 0.1 | 8.0 | GO:0032418 | lysosome localization(GO:0032418) |
| 0.1 | 0.4 | GO:0006049 | UDP-N-acetylglucosamine catabolic process(GO:0006049) |
| 0.1 | 4.2 | GO:1904590 | negative regulation of protein import into nucleus(GO:0042308) negative regulation of protein import(GO:1904590) |
| 0.1 | 0.8 | GO:0018344 | protein geranylgeranylation(GO:0018344) |
| 0.1 | 1.7 | GO:0000185 | activation of MAPKKK activity(GO:0000185) |
| 0.1 | 5.8 | GO:0021510 | spinal cord development(GO:0021510) |
| 0.1 | 2.4 | GO:0089711 | L-glutamate transmembrane transport(GO:0089711) |
| 0.1 | 4.3 | GO:0007212 | dopamine receptor signaling pathway(GO:0007212) |
| 0.1 | 1.7 | GO:0006853 | carnitine shuttle(GO:0006853) |
| 0.1 | 3.1 | GO:0043551 | regulation of phosphatidylinositol 3-kinase activity(GO:0043551) |
| 0.1 | 6.0 | GO:0007193 | adenylate cyclase-inhibiting G-protein coupled receptor signaling pathway(GO:0007193) |
| 0.1 | 0.3 | GO:1904588 | cellular response to glycoprotein(GO:1904588) cellular response to thyrotropin-releasing hormone(GO:1905229) |
| 0.1 | 0.5 | GO:0006572 | tyrosine catabolic process(GO:0006572) |
| 0.1 | 1.3 | GO:0014029 | neural crest formation(GO:0014029) |
| 0.1 | 12.3 | GO:0051384 | response to glucocorticoid(GO:0051384) |
| 0.1 | 0.5 | GO:0060267 | positive regulation of respiratory burst(GO:0060267) |
| 0.1 | 2.1 | GO:0043949 | regulation of cAMP-mediated signaling(GO:0043949) |
| 0.1 | 1.1 | GO:0036295 | cellular response to increased oxygen levels(GO:0036295) |
| 0.1 | 0.9 | GO:0000244 | spliceosomal tri-snRNP complex assembly(GO:0000244) |
| 0.1 | 2.2 | GO:0019933 | cAMP-mediated signaling(GO:0019933) |
| 0.1 | 0.7 | GO:0032510 | endosome to lysosome transport via multivesicular body sorting pathway(GO:0032510) |
| 0.1 | 1.0 | GO:0034389 | lipid particle organization(GO:0034389) |
| 0.1 | 1.2 | GO:0048934 | peripheral nervous system neuron differentiation(GO:0048934) peripheral nervous system neuron development(GO:0048935) |
| 0.1 | 0.8 | GO:0015732 | prostaglandin transport(GO:0015732) |
| 0.1 | 0.2 | GO:0061668 | mitochondrial ribosome assembly(GO:0061668) mitochondrial large ribosomal subunit assembly(GO:1902775) |
| 0.1 | 2.5 | GO:0001954 | positive regulation of cell-matrix adhesion(GO:0001954) |
| 0.1 | 3.2 | GO:1902017 | regulation of cilium assembly(GO:1902017) |
| 0.1 | 0.2 | GO:0030241 | skeletal muscle myosin thick filament assembly(GO:0030241) |
| 0.1 | 3.7 | GO:0006970 | response to osmotic stress(GO:0006970) |
| 0.1 | 3.4 | GO:0032436 | positive regulation of proteasomal ubiquitin-dependent protein catabolic process(GO:0032436) |
| 0.0 | 0.0 | GO:0071284 | cellular response to lead ion(GO:0071284) |
| 0.0 | 4.2 | GO:0036498 | IRE1-mediated unfolded protein response(GO:0036498) |
| 0.0 | 0.9 | GO:0070932 | histone H3 deacetylation(GO:0070932) |
| 0.0 | 2.7 | GO:0007218 | neuropeptide signaling pathway(GO:0007218) |
| 0.0 | 1.8 | GO:0010107 | potassium ion import(GO:0010107) |
| 0.0 | 1.3 | GO:0043984 | histone H4-K16 acetylation(GO:0043984) |
| 0.0 | 4.1 | GO:0060333 | interferon-gamma-mediated signaling pathway(GO:0060333) |
| 0.0 | 0.7 | GO:0033141 | positive regulation of peptidyl-serine phosphorylation of STAT protein(GO:0033141) |
| 0.0 | 3.4 | GO:0006890 | retrograde vesicle-mediated transport, Golgi to ER(GO:0006890) |
| 0.0 | 0.7 | GO:0042737 | drug catabolic process(GO:0042737) |
| 0.0 | 0.6 | GO:0006488 | dolichol-linked oligosaccharide biosynthetic process(GO:0006488) |
| 0.0 | 5.4 | GO:0002433 | immune response-regulating cell surface receptor signaling pathway involved in phagocytosis(GO:0002433) Fc-gamma receptor signaling pathway involved in phagocytosis(GO:0038096) |
| 0.0 | 1.0 | GO:0035235 | ionotropic glutamate receptor signaling pathway(GO:0035235) |
| 0.0 | 0.2 | GO:0035791 | platelet-derived growth factor receptor-beta signaling pathway(GO:0035791) |
| 0.0 | 0.7 | GO:0034204 | lipid translocation(GO:0034204) phospholipid translocation(GO:0045332) |
| 0.0 | 2.2 | GO:0006687 | glycosphingolipid metabolic process(GO:0006687) |
| 0.0 | 1.3 | GO:0010923 | negative regulation of phosphatase activity(GO:0010923) |
| 0.0 | 0.1 | GO:0048280 | vesicle fusion with Golgi apparatus(GO:0048280) |
| 0.0 | 1.7 | GO:0010508 | positive regulation of autophagy(GO:0010508) |
| 0.0 | 0.8 | GO:0051973 | positive regulation of telomerase activity(GO:0051973) |
| 0.0 | 2.5 | GO:0035335 | peptidyl-tyrosine dephosphorylation(GO:0035335) |
| 0.0 | 0.4 | GO:0002042 | cell migration involved in sprouting angiogenesis(GO:0002042) |
| 0.0 | 0.1 | GO:0032020 | ISG15-protein conjugation(GO:0032020) |
| 0.0 | 0.3 | GO:0034380 | high-density lipoprotein particle assembly(GO:0034380) |
| 0.0 | 0.6 | GO:0016339 | calcium-dependent cell-cell adhesion via plasma membrane cell adhesion molecules(GO:0016339) |
| 0.0 | 2.2 | GO:0071804 | cellular potassium ion transport(GO:0071804) potassium ion transmembrane transport(GO:0071805) |
| 0.0 | 0.6 | GO:0007187 | G-protein coupled receptor signaling pathway, coupled to cyclic nucleotide second messenger(GO:0007187) |
| 0.0 | 0.3 | GO:0033120 | positive regulation of RNA splicing(GO:0033120) |
| 0.0 | 2.5 | GO:0051480 | regulation of cytosolic calcium ion concentration(GO:0051480) |
| 0.0 | 0.6 | GO:0016266 | O-glycan processing(GO:0016266) |
Gene overrepresentation in cellular component category:
| Log-likelihood per target | Total log-likelihood | Term | Description |
|---|---|---|---|
| 2.7 | 8.2 | GO:0016939 | kinesin II complex(GO:0016939) |
| 2.6 | 26.1 | GO:0043190 | ATP-binding cassette (ABC) transporter complex(GO:0043190) |
| 2.3 | 34.1 | GO:0097418 | neurofibrillary tangle(GO:0097418) |
| 1.2 | 30.4 | GO:0001518 | voltage-gated sodium channel complex(GO:0001518) |
| 1.2 | 12.1 | GO:0005964 | phosphorylase kinase complex(GO:0005964) |
| 1.1 | 5.7 | GO:0071458 | integral component of cytoplasmic side of endoplasmic reticulum membrane(GO:0071458) |
| 1.1 | 3.4 | GO:0016938 | kinesin I complex(GO:0016938) |
| 1.1 | 9.5 | GO:0097208 | alveolar lamellar body(GO:0097208) |
| 1.0 | 3.1 | GO:0005944 | phosphatidylinositol 3-kinase complex, class IB(GO:0005944) |
| 0.9 | 10.0 | GO:0071204 | histone pre-mRNA 3'end processing complex(GO:0071204) |
| 0.8 | 46.9 | GO:0001917 | photoreceptor inner segment(GO:0001917) |
| 0.8 | 5.7 | GO:0030991 | intraciliary transport particle A(GO:0030991) |
| 0.7 | 2.0 | GO:0000125 | PCAF complex(GO:0000125) |
| 0.6 | 8.4 | GO:0035253 | ciliary rootlet(GO:0035253) |
| 0.6 | 2.5 | GO:0000308 | cytoplasmic cyclin-dependent protein kinase holoenzyme complex(GO:0000308) |
| 0.6 | 6.6 | GO:0032039 | integrator complex(GO:0032039) |
| 0.6 | 2.3 | GO:0034678 | integrin alpha8-beta1 complex(GO:0034678) |
| 0.6 | 3.3 | GO:1990131 | EGO complex(GO:0034448) Gtr1-Gtr2 GTPase complex(GO:1990131) |
| 0.5 | 5.8 | GO:0070938 | contractile ring(GO:0070938) |
| 0.5 | 6.0 | GO:0042555 | MCM complex(GO:0042555) |
| 0.5 | 1.8 | GO:0033257 | Bcl3/NF-kappaB2 complex(GO:0033257) |
| 0.4 | 3.6 | GO:0000322 | storage vacuole(GO:0000322) |
| 0.4 | 8.0 | GO:0031235 | intrinsic component of the cytoplasmic side of the plasma membrane(GO:0031235) |
| 0.4 | 14.7 | GO:0033268 | node of Ranvier(GO:0033268) |
| 0.4 | 20.3 | GO:0005871 | kinesin complex(GO:0005871) |
| 0.4 | 5.6 | GO:0030914 | STAGA complex(GO:0030914) |
| 0.3 | 12.3 | GO:0042629 | mast cell granule(GO:0042629) |
| 0.3 | 2.7 | GO:0072487 | MSL complex(GO:0072487) |
| 0.3 | 4.6 | GO:0005869 | dynactin complex(GO:0005869) |
| 0.3 | 3.0 | GO:0033391 | chromatoid body(GO:0033391) |
| 0.3 | 5.9 | GO:0035631 | CD40 receptor complex(GO:0035631) |
| 0.3 | 0.6 | GO:0043541 | UDP-N-acetylglucosamine transferase complex(GO:0043541) |
| 0.3 | 3.1 | GO:0005614 | interstitial matrix(GO:0005614) |
| 0.3 | 0.9 | GO:0034272 | phosphatidylinositol 3-kinase complex, class III, type I(GO:0034271) phosphatidylinositol 3-kinase complex, class III, type II(GO:0034272) |
| 0.3 | 6.7 | GO:0005666 | DNA-directed RNA polymerase III complex(GO:0005666) |
| 0.3 | 8.0 | GO:0071437 | invadopodium(GO:0071437) |
| 0.3 | 2.8 | GO:0046581 | intercellular canaliculus(GO:0046581) |
| 0.3 | 3.2 | GO:0042788 | polysomal ribosome(GO:0042788) |
| 0.3 | 1.6 | GO:1990316 | ATG1/ULK1 kinase complex(GO:1990316) |
| 0.3 | 1.5 | GO:0005879 | axonemal microtubule(GO:0005879) |
| 0.3 | 4.5 | GO:0030122 | AP-2 adaptor complex(GO:0030122) |
| 0.2 | 5.5 | GO:0030992 | intraciliary transport particle B(GO:0030992) |
| 0.2 | 4.9 | GO:0031588 | nucleotide-activated protein kinase complex(GO:0031588) |
| 0.2 | 1.7 | GO:0065010 | extracellular membrane-bounded organelle(GO:0065010) |
| 0.2 | 2.7 | GO:0097433 | dense body(GO:0097433) |
| 0.2 | 1.7 | GO:0044327 | dendritic spine head(GO:0044327) |
| 0.2 | 5.8 | GO:0051233 | spindle midzone(GO:0051233) |
| 0.2 | 1.0 | GO:0072558 | NLRP1 inflammasome complex(GO:0072558) AIM2 inflammasome complex(GO:0097169) |
| 0.2 | 0.8 | GO:0005968 | Rab-protein geranylgeranyltransferase complex(GO:0005968) |
| 0.2 | 7.3 | GO:0000159 | protein phosphatase type 2A complex(GO:0000159) |
| 0.2 | 1.2 | GO:0042406 | extrinsic component of endoplasmic reticulum membrane(GO:0042406) |
| 0.2 | 5.6 | GO:0016514 | SWI/SNF complex(GO:0016514) npBAF complex(GO:0071564) |
| 0.2 | 6.0 | GO:0030173 | integral component of Golgi membrane(GO:0030173) |
| 0.2 | 2.4 | GO:0005833 | hemoglobin complex(GO:0005833) |
| 0.2 | 0.8 | GO:0042825 | TAP complex(GO:0042825) |
| 0.1 | 2.3 | GO:0000145 | exocyst(GO:0000145) |
| 0.1 | 5.7 | GO:0030119 | AP-type membrane coat adaptor complex(GO:0030119) |
| 0.1 | 2.3 | GO:0042613 | MHC class II protein complex(GO:0042613) |
| 0.1 | 2.3 | GO:0030669 | clathrin-coated endocytic vesicle membrane(GO:0030669) |
| 0.1 | 15.7 | GO:0031901 | early endosome membrane(GO:0031901) |
| 0.1 | 1.3 | GO:0001741 | XY body(GO:0001741) |
| 0.1 | 6.2 | GO:0005834 | heterotrimeric G-protein complex(GO:0005834) |
| 0.1 | 2.5 | GO:0005921 | gap junction(GO:0005921) |
| 0.1 | 15.3 | GO:0032587 | ruffle membrane(GO:0032587) |
| 0.1 | 3.1 | GO:0031233 | intrinsic component of external side of plasma membrane(GO:0031233) |
| 0.1 | 32.5 | GO:0016323 | basolateral plasma membrane(GO:0016323) |
| 0.1 | 7.9 | GO:0030672 | synaptic vesicle membrane(GO:0030672) exocytic vesicle membrane(GO:0099501) |
| 0.1 | 2.5 | GO:0005892 | acetylcholine-gated channel complex(GO:0005892) |
| 0.1 | 1.0 | GO:0034098 | VCP-NPL4-UFD1 AAA ATPase complex(GO:0034098) |
| 0.1 | 6.6 | GO:0016459 | myosin complex(GO:0016459) |
| 0.1 | 1.0 | GO:0032809 | neuronal cell body membrane(GO:0032809) cell body membrane(GO:0044298) |
| 0.1 | 1.1 | GO:0033177 | proton-transporting two-sector ATPase complex, proton-transporting domain(GO:0033177) proton-transporting V-type ATPase, V0 domain(GO:0033179) |
| 0.1 | 5.6 | GO:0030136 | clathrin-coated vesicle(GO:0030136) |
| 0.1 | 6.7 | GO:0042734 | presynaptic membrane(GO:0042734) |
| 0.1 | 1.1 | GO:0097440 | apical dendrite(GO:0097440) |
| 0.1 | 4.5 | GO:0097014 | axoneme(GO:0005930) ciliary plasm(GO:0097014) |
| 0.1 | 6.1 | GO:0008076 | voltage-gated potassium channel complex(GO:0008076) potassium channel complex(GO:0034705) |
| 0.1 | 0.6 | GO:0032045 | guanyl-nucleotide exchange factor complex(GO:0032045) |
| 0.1 | 2.5 | GO:0005581 | collagen trimer(GO:0005581) |
| 0.1 | 3.5 | GO:0005604 | basement membrane(GO:0005604) |
| 0.1 | 3.8 | GO:0001725 | stress fiber(GO:0001725) contractile actin filament bundle(GO:0097517) |
| 0.0 | 3.2 | GO:0005776 | autophagosome(GO:0005776) |
| 0.0 | 4.0 | GO:0005758 | mitochondrial intermembrane space(GO:0005758) |
| 0.0 | 1.6 | GO:0008180 | COP9 signalosome(GO:0008180) |
| 0.0 | 5.7 | GO:0030176 | integral component of endoplasmic reticulum membrane(GO:0030176) |
| 0.0 | 0.6 | GO:0046658 | anchored component of plasma membrane(GO:0046658) |
| 0.0 | 0.6 | GO:0031528 | microvillus membrane(GO:0031528) |
| 0.0 | 12.6 | GO:0005788 | endoplasmic reticulum lumen(GO:0005788) |
| 0.0 | 5.2 | GO:0031674 | I band(GO:0031674) |
| 0.0 | 3.6 | GO:0035579 | specific granule membrane(GO:0035579) |
| 0.0 | 5.7 | GO:0005769 | early endosome(GO:0005769) |
| 0.0 | 1.1 | GO:0016235 | aggresome(GO:0016235) |
| 0.0 | 5.1 | GO:0098793 | presynapse(GO:0098793) |
| 0.0 | 7.0 | GO:0043235 | receptor complex(GO:0043235) |
| 0.0 | 5.7 | GO:0016324 | apical plasma membrane(GO:0016324) |
| 0.0 | 1.9 | GO:0005814 | centriole(GO:0005814) |
| 0.0 | 5.4 | GO:0019867 | outer membrane(GO:0019867) |
| 0.0 | 1.6 | GO:0036064 | ciliary basal body(GO:0036064) |
| 0.0 | 4.8 | GO:0005929 | cilium(GO:0005929) |
| 0.0 | 3.8 | GO:0005938 | cell cortex(GO:0005938) |
| 0.0 | 1.6 | GO:0031234 | extrinsic component of cytoplasmic side of plasma membrane(GO:0031234) |
| 0.0 | 0.6 | GO:0009295 | nucleoid(GO:0009295) mitochondrial nucleoid(GO:0042645) |
| 0.0 | 0.6 | GO:0001726 | ruffle(GO:0001726) |
| 0.0 | 1.0 | GO:0030027 | lamellipodium(GO:0030027) |
| 0.0 | 0.6 | GO:0000307 | cyclin-dependent protein kinase holoenzyme complex(GO:0000307) |
| 0.0 | 36.7 | GO:0016021 | integral component of membrane(GO:0016021) |
Gene overrepresentation in molecular function category:
| Log-likelihood per target | Total log-likelihood | Term | Description |
|---|---|---|---|
| 3.8 | 15.3 | GO:0003976 | UDP-N-acetylglucosamine-lysosomal-enzyme N-acetylglucosaminephosphotransferase activity(GO:0003976) |
| 3.7 | 11.2 | GO:0031862 | prostanoid receptor binding(GO:0031862) |
| 2.7 | 10.8 | GO:0099609 | microtubule lateral binding(GO:0099609) |
| 2.5 | 10.1 | GO:0000309 | nicotinamide-nucleotide adenylyltransferase activity(GO:0000309) |
| 2.1 | 6.3 | GO:0031755 | endothelial differentiation G-protein coupled receptor binding(GO:0031753) Edg-2 lysophosphatidic acid receptor binding(GO:0031755) |
| 2.0 | 6.1 | GO:0052825 | inositol tetrakisphosphate 1-kinase activity(GO:0047325) inositol tetrakisphosphate kinase activity(GO:0051765) inositol-1,3,4-trisphosphate 6-kinase activity(GO:0052725) inositol-1,3,4-trisphosphate 5-kinase activity(GO:0052726) inositol-1,3,4,5,6-pentakisphosphate 1-phosphatase activity(GO:0052825) inositol-1,3,4,6-tetrakisphosphate 6-phosphatase activity(GO:0052830) inositol-1,3,4,6-tetrakisphosphate 1-phosphatase activity(GO:0052831) inositol-3,4,6-trisphosphate 1-kinase activity(GO:0052835) |
| 1.8 | 5.5 | GO:0061629 | RNA polymerase II sequence-specific DNA binding transcription factor binding(GO:0061629) |
| 1.7 | 5.1 | GO:0004144 | diacylglycerol O-acyltransferase activity(GO:0004144) |
| 1.5 | 4.6 | GO:0008969 | phosphohistidine phosphatase activity(GO:0008969) |
| 1.3 | 9.3 | GO:0051021 | GDP-dissociation inhibitor binding(GO:0051021) Rho GDP-dissociation inhibitor binding(GO:0051022) |
| 1.2 | 12.1 | GO:0004689 | phosphorylase kinase activity(GO:0004689) |
| 1.2 | 3.6 | GO:0031687 | A2A adenosine receptor binding(GO:0031687) |
| 1.2 | 4.7 | GO:0048403 | brain-derived neurotrophic factor binding(GO:0048403) |
| 1.1 | 3.3 | GO:0001601 | peptide YY receptor activity(GO:0001601) |
| 1.1 | 9.7 | GO:0033192 | calmodulin-dependent protein phosphatase activity(GO:0033192) |
| 1.0 | 7.3 | GO:0035368 | selenocysteine insertion sequence binding(GO:0035368) |
| 1.0 | 5.0 | GO:0001888 | glucuronyl-galactosyl-proteoglycan 4-alpha-N-acetylglucosaminyltransferase activity(GO:0001888) |
| 0.9 | 6.4 | GO:0004169 | dolichyl-phosphate-mannose-protein mannosyltransferase activity(GO:0004169) |
| 0.9 | 2.7 | GO:0098973 | structural constituent of synapse(GO:0098918) structural constituent of postsynaptic actin cytoskeleton(GO:0098973) |
| 0.9 | 6.2 | GO:0047045 | testosterone 17-beta-dehydrogenase (NADP+) activity(GO:0047045) |
| 0.9 | 2.6 | GO:0008384 | IkappaB kinase activity(GO:0008384) |
| 0.8 | 19.0 | GO:0004812 | aminoacyl-tRNA ligase activity(GO:0004812) ligase activity, forming carbon-oxygen bonds(GO:0016875) ligase activity, forming aminoacyl-tRNA and related compounds(GO:0016876) |
| 0.8 | 5.7 | GO:0042500 | aspartic endopeptidase activity, intramembrane cleaving(GO:0042500) |
| 0.8 | 2.4 | GO:0008321 | Ral guanyl-nucleotide exchange factor activity(GO:0008321) |
| 0.8 | 2.4 | GO:0005280 | hydrogen:amino acid symporter activity(GO:0005280) |
| 0.8 | 26.3 | GO:1905030 | voltage-gated sodium channel activity(GO:0005248) voltage-gated ion channel activity involved in regulation of postsynaptic membrane potential(GO:1905030) |
| 0.8 | 2.3 | GO:0033765 | 3-oxo-5-alpha-steroid 4-dehydrogenase activity(GO:0003865) steroid dehydrogenase activity, acting on the CH-CH group of donors(GO:0033765) cholestenone 5-alpha-reductase activity(GO:0047751) |
| 0.8 | 7.7 | GO:0015385 | sodium:proton antiporter activity(GO:0015385) potassium:proton antiporter activity(GO:0015386) |
| 0.7 | 6.7 | GO:0043426 | MRF binding(GO:0043426) |
| 0.7 | 4.3 | GO:0031708 | endothelin B receptor binding(GO:0031708) |
| 0.7 | 4.1 | GO:0022821 | calcium, potassium:sodium antiporter activity(GO:0008273) potassium ion antiporter activity(GO:0022821) |
| 0.7 | 4.8 | GO:1904929 | coreceptor activity involved in Wnt signaling pathway, planar cell polarity pathway(GO:1904929) |
| 0.7 | 14.7 | GO:0008191 | metalloendopeptidase inhibitor activity(GO:0008191) |
| 0.7 | 3.3 | GO:0004052 | arachidonate 12-lipoxygenase activity(GO:0004052) |
| 0.7 | 2.0 | GO:0042008 | interleukin-18 receptor activity(GO:0042008) |
| 0.6 | 9.7 | GO:0004143 | diacylglycerol kinase activity(GO:0004143) |
| 0.6 | 8.9 | GO:0005078 | MAP-kinase scaffold activity(GO:0005078) |
| 0.6 | 27.5 | GO:1990939 | ATP-dependent microtubule motor activity(GO:1990939) |
| 0.6 | 10.9 | GO:0004089 | carbonate dehydratase activity(GO:0004089) |
| 0.6 | 3.6 | GO:0004013 | adenosylhomocysteinase activity(GO:0004013) trialkylsulfonium hydrolase activity(GO:0016802) |
| 0.6 | 12.5 | GO:0019992 | diacylglycerol binding(GO:0019992) |
| 0.6 | 2.9 | GO:0036312 | phosphatidylinositol 3-kinase regulatory subunit binding(GO:0036312) |
| 0.6 | 3.9 | GO:0000155 | phosphorelay sensor kinase activity(GO:0000155) |
| 0.6 | 6.1 | GO:0017034 | Rap guanyl-nucleotide exchange factor activity(GO:0017034) |
| 0.6 | 2.2 | GO:0022865 | transmembrane electron transfer carrier(GO:0022865) |
| 0.5 | 3.2 | GO:0045029 | UDP-activated nucleotide receptor activity(GO:0045029) |
| 0.5 | 3.9 | GO:0005250 | A-type (transient outward) potassium channel activity(GO:0005250) |
| 0.5 | 3.9 | GO:0008046 | axon guidance receptor activity(GO:0008046) |
| 0.5 | 3.8 | GO:0060002 | plus-end directed microfilament motor activity(GO:0060002) |
| 0.5 | 13.1 | GO:0097109 | neuroligin family protein binding(GO:0097109) |
| 0.5 | 2.3 | GO:0033857 | diphosphoinositol-pentakisphosphate kinase activity(GO:0033857) |
| 0.4 | 6.5 | GO:0043225 | anion transmembrane-transporting ATPase activity(GO:0043225) |
| 0.4 | 7.9 | GO:0008510 | sodium:bicarbonate symporter activity(GO:0008510) |
| 0.4 | 7.8 | GO:0043014 | alpha-tubulin binding(GO:0043014) |
| 0.4 | 42.2 | GO:0042626 | ATPase activity, coupled to transmembrane movement of substances(GO:0042626) |
| 0.4 | 4.9 | GO:0004679 | AMP-activated protein kinase activity(GO:0004679) |
| 0.3 | 3.1 | GO:0046935 | 1-phosphatidylinositol-3-kinase regulator activity(GO:0046935) |
| 0.3 | 1.0 | GO:0032090 | Pyrin domain binding(GO:0032090) |
| 0.3 | 3.4 | GO:0003777 | microtubule motor activity(GO:0003777) |
| 0.3 | 2.0 | GO:0004468 | lysine N-acetyltransferase activity, acting on acetyl phosphate as donor(GO:0004468) |
| 0.3 | 6.7 | GO:0001056 | RNA polymerase III activity(GO:0001056) |
| 0.3 | 2.7 | GO:0035312 | 5'-3' exodeoxyribonuclease activity(GO:0035312) |
| 0.3 | 2.6 | GO:0097322 | 7SK snRNA binding(GO:0097322) |
| 0.3 | 1.7 | GO:0004035 | alkaline phosphatase activity(GO:0004035) |
| 0.3 | 6.0 | GO:0000062 | fatty-acyl-CoA binding(GO:0000062) |
| 0.3 | 2.2 | GO:0102337 | fatty acid elongase activity(GO:0009922) 3-oxo-arachidoyl-CoA synthase activity(GO:0102336) 3-oxo-cerotoyl-CoA synthase activity(GO:0102337) 3-oxo-lignoceronyl-CoA synthase activity(GO:0102338) |
| 0.3 | 0.8 | GO:0004663 | Rab geranylgeranyltransferase activity(GO:0004663) |
| 0.3 | 0.8 | GO:0050501 | hyaluronan synthase activity(GO:0050501) |
| 0.3 | 16.0 | GO:0005544 | calcium-dependent phospholipid binding(GO:0005544) |
| 0.2 | 1.0 | GO:0035473 | lipase binding(GO:0035473) |
| 0.2 | 3.3 | GO:0061578 | Lys63-specific deubiquitinase activity(GO:0061578) |
| 0.2 | 3.5 | GO:0051959 | dynein light intermediate chain binding(GO:0051959) |
| 0.2 | 7.5 | GO:0004602 | glutathione peroxidase activity(GO:0004602) |
| 0.2 | 3.3 | GO:0031435 | mitogen-activated protein kinase kinase kinase binding(GO:0031435) |
| 0.2 | 1.4 | GO:0008853 | exodeoxyribonuclease III activity(GO:0008853) |
| 0.2 | 8.2 | GO:0019894 | kinesin binding(GO:0019894) |
| 0.2 | 3.3 | GO:0015643 | toxic substance binding(GO:0015643) |
| 0.2 | 10.0 | GO:0017069 | snRNA binding(GO:0017069) |
| 0.2 | 2.6 | GO:0043176 | amine binding(GO:0043176) serotonin binding(GO:0051378) |
| 0.2 | 65.7 | GO:0008017 | microtubule binding(GO:0008017) |
| 0.2 | 3.0 | GO:0008409 | 5'-3' exonuclease activity(GO:0008409) |
| 0.2 | 1.3 | GO:0003886 | DNA (cytosine-5-)-methyltransferase activity(GO:0003886) |
| 0.2 | 0.6 | GO:0004577 | N-acetylglucosaminyldiphosphodolichol N-acetylglucosaminyltransferase activity(GO:0004577) |
| 0.2 | 1.7 | GO:1990239 | steroid hormone binding(GO:1990239) |
| 0.2 | 4.5 | GO:0035615 | clathrin adaptor activity(GO:0035615) endocytic adaptor activity(GO:0098748) |
| 0.2 | 3.7 | GO:0038191 | neuropilin binding(GO:0038191) |
| 0.2 | 1.0 | GO:0005166 | neurotrophin p75 receptor binding(GO:0005166) |
| 0.2 | 3.1 | GO:0031821 | G-protein coupled serotonin receptor binding(GO:0031821) |
| 0.2 | 5.1 | GO:0036041 | long-chain fatty acid binding(GO:0036041) |
| 0.2 | 0.5 | GO:0004937 | alpha1-adrenergic receptor activity(GO:0004937) |
| 0.2 | 3.9 | GO:0031748 | D1 dopamine receptor binding(GO:0031748) |
| 0.2 | 6.4 | GO:0008188 | neuropeptide receptor activity(GO:0008188) |
| 0.2 | 2.8 | GO:0031701 | angiotensin receptor binding(GO:0031701) type 1 angiotensin receptor binding(GO:0031702) |
| 0.2 | 2.4 | GO:0005344 | oxygen transporter activity(GO:0005344) |
| 0.1 | 2.2 | GO:0008140 | cAMP response element binding protein binding(GO:0008140) |
| 0.1 | 0.7 | GO:0008240 | tripeptidyl-peptidase activity(GO:0008240) peptidyl-dipeptidase activity(GO:0008241) bradykinin receptor binding(GO:0031711) metallodipeptidase activity(GO:0070573) |
| 0.1 | 1.7 | GO:0048273 | mitogen-activated protein kinase p38 binding(GO:0048273) |
| 0.1 | 4.2 | GO:0032266 | phosphatidylinositol-3-phosphate binding(GO:0032266) |
| 0.1 | 4.6 | GO:0005104 | fibroblast growth factor receptor binding(GO:0005104) |
| 0.1 | 2.3 | GO:0005003 | ephrin receptor activity(GO:0005003) |
| 0.1 | 2.5 | GO:0043325 | phosphatidylinositol-3,4-bisphosphate binding(GO:0043325) |
| 0.1 | 0.9 | GO:0004873 | asialoglycoprotein receptor activity(GO:0004873) |
| 0.1 | 0.6 | GO:0004977 | melanocortin receptor activity(GO:0004977) |
| 0.1 | 1.2 | GO:0035613 | RNA stem-loop binding(GO:0035613) |
| 0.1 | 1.0 | GO:0015277 | kainate selective glutamate receptor activity(GO:0015277) |
| 0.1 | 3.2 | GO:0031624 | ubiquitin conjugating enzyme binding(GO:0031624) |
| 0.1 | 2.5 | GO:0008239 | dipeptidyl-peptidase activity(GO:0008239) |
| 0.1 | 3.9 | GO:0017091 | AU-rich element binding(GO:0017091) |
| 0.1 | 0.4 | GO:0003827 | alpha-1,3-mannosylglycoprotein 2-beta-N-acetylglucosaminyltransferase activity(GO:0003827) |
| 0.1 | 0.7 | GO:0004499 | N,N-dimethylaniline monooxygenase activity(GO:0004499) |
| 0.1 | 4.2 | GO:0008139 | nuclear localization sequence binding(GO:0008139) |
| 0.1 | 2.3 | GO:0023026 | MHC class II protein complex binding(GO:0023026) |
| 0.1 | 5.8 | GO:0004004 | ATP-dependent RNA helicase activity(GO:0004004) |
| 0.1 | 4.1 | GO:0008408 | 3'-5' exonuclease activity(GO:0008408) |
| 0.1 | 5.6 | GO:0061733 | histone acetyltransferase activity(GO:0004402) peptide-lysine-N-acetyltransferase activity(GO:0061733) |
| 0.1 | 3.0 | GO:0030332 | cyclin binding(GO:0030332) |
| 0.1 | 0.9 | GO:0031078 | histone deacetylase activity (H3-K14 specific)(GO:0031078) NAD-dependent histone deacetylase activity (H3-K14 specific)(GO:0032041) |
| 0.1 | 0.7 | GO:0003847 | 1-alkyl-2-acetylglycerophosphocholine esterase activity(GO:0003847) |
| 0.1 | 1.6 | GO:0034236 | protein kinase A catalytic subunit binding(GO:0034236) |
| 0.1 | 4.6 | GO:0016706 | oxidoreductase activity, acting on paired donors, with incorporation or reduction of molecular oxygen, 2-oxoglutarate as one donor, and incorporation of one atom each of oxygen into both donors(GO:0016706) |
| 0.1 | 8.0 | GO:0030295 | protein kinase activator activity(GO:0030295) |
| 0.1 | 2.3 | GO:0019198 | transmembrane receptor protein tyrosine phosphatase activity(GO:0005001) transmembrane receptor protein phosphatase activity(GO:0019198) |
| 0.1 | 0.2 | GO:0005017 | platelet-derived growth factor-activated receptor activity(GO:0005017) |
| 0.1 | 2.8 | GO:0004683 | calmodulin-dependent protein kinase activity(GO:0004683) |
| 0.1 | 2.6 | GO:0030552 | cAMP binding(GO:0030552) |
| 0.1 | 0.6 | GO:0030215 | semaphorin receptor binding(GO:0030215) |
| 0.1 | 1.0 | GO:0008327 | methyl-CpG binding(GO:0008327) |
| 0.1 | 1.8 | GO:0030506 | ankyrin binding(GO:0030506) |
| 0.1 | 11.5 | GO:0005516 | calmodulin binding(GO:0005516) |
| 0.1 | 2.2 | GO:0015269 | calcium-activated potassium channel activity(GO:0015269) |
| 0.1 | 1.8 | GO:0005242 | inward rectifier potassium channel activity(GO:0005242) |
| 0.1 | 6.3 | GO:0003707 | steroid hormone receptor activity(GO:0003707) |
| 0.1 | 0.7 | GO:0003691 | double-stranded telomeric DNA binding(GO:0003691) |
| 0.1 | 2.0 | GO:0043236 | laminin binding(GO:0043236) |
| 0.1 | 0.9 | GO:0043548 | phosphatidylinositol 3-kinase binding(GO:0043548) |
| 0.1 | 3.6 | GO:0001540 | beta-amyloid binding(GO:0001540) |
| 0.1 | 3.1 | GO:0030971 | receptor tyrosine kinase binding(GO:0030971) |
| 0.0 | 2.8 | GO:0008138 | protein tyrosine/serine/threonine phosphatase activity(GO:0008138) |
| 0.0 | 0.7 | GO:0005132 | type I interferon receptor binding(GO:0005132) |
| 0.0 | 13.6 | GO:0001227 | transcriptional repressor activity, RNA polymerase II transcription regulatory region sequence-specific binding(GO:0001227) |
| 0.0 | 4.5 | GO:0008013 | beta-catenin binding(GO:0008013) |
| 0.0 | 7.8 | GO:0044325 | ion channel binding(GO:0044325) |
| 0.0 | 0.6 | GO:0004653 | polypeptide N-acetylgalactosaminyltransferase activity(GO:0004653) |
| 0.0 | 0.8 | GO:0016493 | C-C chemokine receptor activity(GO:0016493) |
| 0.0 | 0.4 | GO:0070569 | uridylyltransferase activity(GO:0070569) |
| 0.0 | 1.2 | GO:0071837 | HMG box domain binding(GO:0071837) |
| 0.0 | 0.7 | GO:0004012 | phospholipid-translocating ATPase activity(GO:0004012) |
| 0.0 | 0.3 | GO:0004996 | thyroid-stimulating hormone receptor activity(GO:0004996) |
| 0.0 | 10.1 | GO:0004252 | serine-type endopeptidase activity(GO:0004252) |
| 0.0 | 24.5 | GO:0005509 | calcium ion binding(GO:0005509) |
| 0.0 | 0.3 | GO:0043422 | protein kinase B binding(GO:0043422) |
| 0.0 | 0.6 | GO:0005159 | insulin-like growth factor receptor binding(GO:0005159) |
| 0.0 | 1.6 | GO:0005160 | transforming growth factor beta receptor binding(GO:0005160) |
| 0.0 | 2.7 | GO:0004222 | metalloendopeptidase activity(GO:0004222) |
| 0.0 | 0.1 | GO:0042296 | ISG15 transferase activity(GO:0042296) |
| 0.0 | 0.5 | GO:0005095 | GTPase inhibitor activity(GO:0005095) |
| 0.0 | 0.8 | GO:0015347 | sodium-independent organic anion transmembrane transporter activity(GO:0015347) |
| 0.0 | 1.1 | GO:0004864 | protein phosphatase inhibitor activity(GO:0004864) |
| 0.0 | 3.4 | GO:0051015 | actin filament binding(GO:0051015) |
| 0.0 | 0.9 | GO:0050681 | androgen receptor binding(GO:0050681) |
| 0.0 | 1.0 | GO:0017112 | Rab guanyl-nucleotide exchange factor activity(GO:0017112) |
| 0.0 | 0.6 | GO:0042605 | peptide antigen binding(GO:0042605) |
| 0.0 | 0.2 | GO:0017075 | syntaxin-1 binding(GO:0017075) |
Gene overrepresentation in curated gene sets: canonical pathways category:
| Log-likelihood per target | Total log-likelihood | Term | Description |
|---|---|---|---|
| 1.2 | 40.3 | PID IL8 CXCR1 PATHWAY | IL8- and CXCR1-mediated signaling events |
| 0.7 | 14.7 | PID P38 GAMMA DELTA PATHWAY | Signaling mediated by p38-gamma and p38-delta |
| 0.4 | 5.7 | ST TYPE I INTERFERON PATHWAY | Type I Interferon (alpha/beta IFN) Pathway |
| 0.4 | 17.9 | PID RAS PATHWAY | Regulation of Ras family activation |
| 0.3 | 14.7 | NABA PROTEOGLYCANS | Genes encoding proteoglycans |
| 0.3 | 17.8 | SIG CD40PATHWAYMAP | Genes related to CD40 signaling |
| 0.3 | 8.4 | PID RHODOPSIN PATHWAY | Visual signal transduction: Rods |
| 0.2 | 5.3 | PID IL23 PATHWAY | IL23-mediated signaling events |
| 0.2 | 2.0 | PID RETINOIC ACID PATHWAY | Retinoic acid receptors-mediated signaling |
| 0.2 | 3.1 | PID S1P S1P4 PATHWAY | S1P4 pathway |
| 0.2 | 16.9 | PID TRKR PATHWAY | Neurotrophic factor-mediated Trk receptor signaling |
| 0.2 | 4.4 | PID IL27 PATHWAY | IL27-mediated signaling events |
| 0.1 | 5.9 | PID NFKAPPAB CANONICAL PATHWAY | Canonical NF-kappaB pathway |
| 0.1 | 3.1 | PID EPHA FWDPATHWAY | EPHA forward signaling |
| 0.1 | 4.4 | PID WNT SIGNALING PATHWAY | Wnt signaling network |
| 0.1 | 1.3 | PID WNT CANONICAL PATHWAY | Canonical Wnt signaling pathway |
| 0.1 | 6.6 | PID AURORA A PATHWAY | Aurora A signaling |
| 0.1 | 2.9 | PID LPA4 PATHWAY | LPA4-mediated signaling events |
| 0.1 | 12.1 | PID ERA GENOMIC PATHWAY | Validated nuclear estrogen receptor alpha network |
| 0.1 | 20.3 | NABA ECM AFFILIATED | Genes encoding proteins affiliated structurally or functionally to extracellular matrix proteins |
| 0.1 | 9.0 | PID TGFBR PATHWAY | TGF-beta receptor signaling |
| 0.1 | 4.3 | PID EPHRINB REV PATHWAY | Ephrin B reverse signaling |
| 0.1 | 4.3 | PID ENDOTHELIN PATHWAY | Endothelins |
| 0.1 | 5.1 | PID RXR VDR PATHWAY | RXR and RAR heterodimerization with other nuclear receptor |
| 0.1 | 0.3 | PID PDGFRA PATHWAY | PDGFR-alpha signaling pathway |
| 0.1 | 4.5 | PID RHOA PATHWAY | RhoA signaling pathway |
| 0.1 | 3.8 | PID NCADHERIN PATHWAY | N-cadherin signaling events |
| 0.1 | 3.5 | NABA BASEMENT MEMBRANES | Genes encoding structural components of basement membranes |
| 0.1 | 2.8 | PID PDGFRB PATHWAY | PDGFR-beta signaling pathway |
| 0.1 | 3.4 | PID TCR CALCIUM PATHWAY | Calcium signaling in the CD4+ TCR pathway |
| 0.1 | 1.0 | PID AJDISS 2PATHWAY | Posttranslational regulation of adherens junction stability and dissassembly |
| 0.1 | 5.6 | PID REG GR PATHWAY | Glucocorticoid receptor regulatory network |
| 0.1 | 21.4 | NABA SECRETED FACTORS | Genes encoding secreted soluble factors |
| 0.1 | 1.6 | ST B CELL ANTIGEN RECEPTOR | B Cell Antigen Receptor |
| 0.1 | 2.5 | PID PI3KCI PATHWAY | Class I PI3K signaling events |
| 0.1 | 1.9 | PID INTEGRIN CS PATHWAY | Integrin family cell surface interactions |
| 0.0 | 0.6 | SIG IL4RECEPTOR IN B LYPHOCYTES | Genes related to IL4 rceptor signaling in B lymphocytes |
| 0.0 | 2.2 | PID MTOR 4PATHWAY | mTOR signaling pathway |
| 0.0 | 0.8 | PID PRL SIGNALING EVENTS PATHWAY | Signaling events mediated by PRL |
| 0.0 | 2.2 | PID CERAMIDE PATHWAY | Ceramide signaling pathway |
| 0.0 | 3.7 | PID MYC REPRESS PATHWAY | Validated targets of C-MYC transcriptional repression |
| 0.0 | 0.7 | SA MMP CYTOKINE CONNECTION | Cytokines can induce activation of matrix metalloproteinases, which degrade extracellular matrix. |
| 0.0 | 0.7 | PID EPHB FWD PATHWAY | EPHB forward signaling |
| 0.0 | 1.9 | PID E2F PATHWAY | E2F transcription factor network |
| 0.0 | 1.2 | PID SMAD2 3NUCLEAR PATHWAY | Regulation of nuclear SMAD2/3 signaling |
| 0.0 | 2.2 | NABA ECM GLYCOPROTEINS | Genes encoding structural ECM glycoproteins |
| 0.0 | 0.6 | PID HDAC CLASSI PATHWAY | Signaling events mediated by HDAC Class I |
| 0.0 | 0.9 | WNT SIGNALING | Genes related to Wnt-mediated signal transduction |
| 0.0 | 0.3 | PID ARF6 PATHWAY | Arf6 signaling events |
Gene overrepresentation in curated gene sets: REACTOME pathways category:
| Log-likelihood per target | Total log-likelihood | Term | Description |
|---|---|---|---|
| 1.9 | 39.6 | REACTOME GAP JUNCTION DEGRADATION | Genes involved in Gap junction degradation |
| 1.8 | 40.4 | REACTOME ABCA TRANSPORTERS IN LIPID HOMEOSTASIS | Genes involved in ABCA transporters in lipid homeostasis |
| 0.7 | 5.9 | REACTOME IRAK1 RECRUITS IKK COMPLEX | Genes involved in IRAK1 recruits IKK complex |
| 0.5 | 7.6 | REACTOME MITOCHONDRIAL TRNA AMINOACYLATION | Genes involved in Mitochondrial tRNA aminoacylation |
| 0.4 | 12.1 | REACTOME GLYCOGEN BREAKDOWN GLYCOGENOLYSIS | Genes involved in Glycogen breakdown (glycogenolysis) |
| 0.4 | 6.6 | REACTOME INHIBITION OF REPLICATION INITIATION OF DAMAGED DNA BY RB1 E2F1 | Genes involved in Inhibition of replication initiation of damaged DNA by RB1/E2F1 |
| 0.4 | 5.5 | REACTOME RETROGRADE NEUROTROPHIN SIGNALLING | Genes involved in Retrograde neurotrophin signalling |
| 0.4 | 10.0 | REACTOME KINESINS | Genes involved in Kinesins |
| 0.4 | 15.1 | REACTOME INTERACTION BETWEEN L1 AND ANKYRINS | Genes involved in Interaction between L1 and Ankyrins |
| 0.3 | 6.1 | REACTOME ARMS MEDIATED ACTIVATION | Genes involved in ARMS-mediated activation |
| 0.3 | 10.8 | REACTOME CASPASE MEDIATED CLEAVAGE OF CYTOSKELETAL PROTEINS | Genes involved in Caspase-mediated cleavage of cytoskeletal proteins |
| 0.3 | 6.5 | REACTOME ABC FAMILY PROTEINS MEDIATED TRANSPORT | Genes involved in ABC-family proteins mediated transport |
| 0.3 | 6.7 | REACTOME RNA POL III CHAIN ELONGATION | Genes involved in RNA Polymerase III Chain Elongation |
| 0.3 | 12.0 | REACTOME RAP1 SIGNALLING | Genes involved in Rap1 signalling |
| 0.3 | 1.7 | REACTOME IRAK2 MEDIATED ACTIVATION OF TAK1 COMPLEX UPON TLR7 8 OR 9 STIMULATION | Genes involved in IRAK2 mediated activation of TAK1 complex upon TLR7/8 or 9 stimulation |
| 0.3 | 4.9 | REACTOME REGULATION OF RHEB GTPASE ACTIVITY BY AMPK | Genes involved in Regulation of Rheb GTPase activity by AMPK |
| 0.3 | 6.3 | REACTOME OTHER SEMAPHORIN INTERACTIONS | Genes involved in Other semaphorin interactions |
| 0.2 | 2.9 | REACTOME SPRY REGULATION OF FGF SIGNALING | Genes involved in Spry regulation of FGF signaling |
| 0.2 | 3.2 | REACTOME ROLE OF DCC IN REGULATING APOPTOSIS | Genes involved in Role of DCC in regulating apoptosis |
| 0.2 | 5.1 | REACTOME P38MAPK EVENTS | Genes involved in p38MAPK events |
| 0.2 | 2.6 | REACTOME SEROTONIN RECEPTORS | Genes involved in Serotonin receptors |
| 0.2 | 3.0 | REACTOME PROSTACYCLIN SIGNALLING THROUGH PROSTACYCLIN RECEPTOR | Genes involved in Prostacyclin signalling through prostacyclin receptor |
| 0.2 | 3.2 | REACTOME P2Y RECEPTORS | Genes involved in P2Y receptors |
| 0.2 | 4.9 | REACTOME DCC MEDIATED ATTRACTIVE SIGNALING | Genes involved in DCC mediated attractive signaling |
| 0.2 | 2.3 | REACTOME ANDROGEN BIOSYNTHESIS | Genes involved in Androgen biosynthesis |
| 0.2 | 3.3 | REACTOME NOD1 2 SIGNALING PATHWAY | Genes involved in NOD1/2 Signaling Pathway |
| 0.1 | 10.8 | REACTOME ACTIVATION OF CHAPERONE GENES BY XBP1S | Genes involved in Activation of Chaperone Genes by XBP1(S) |
| 0.1 | 3.1 | REACTOME G PROTEIN ACTIVATION | Genes involved in G-protein activation |
| 0.1 | 10.1 | REACTOME METABOLISM OF VITAMINS AND COFACTORS | Genes involved in Metabolism of vitamins and cofactors |
| 0.1 | 4.9 | REACTOME SIGNAL TRANSDUCTION BY L1 | Genes involved in Signal transduction by L1 |
| 0.1 | 2.0 | REACTOME NOTCH HLH TRANSCRIPTION PATHWAY | Genes involved in Notch-HLH transcription pathway |
| 0.1 | 2.5 | REACTOME HIGHLY CALCIUM PERMEABLE POSTSYNAPTIC NICOTINIC ACETYLCHOLINE RECEPTORS | Genes involved in Highly calcium permeable postsynaptic nicotinic acetylcholine receptors |
| 0.1 | 6.8 | REACTOME TRIGLYCERIDE BIOSYNTHESIS | Genes involved in Triglyceride Biosynthesis |
| 0.1 | 1.7 | REACTOME MTORC1 MEDIATED SIGNALLING | Genes involved in mTORC1-mediated signalling |
| 0.1 | 1.6 | REACTOME INTEGRIN ALPHAIIB BETA3 SIGNALING | Genes involved in Integrin alphaIIb beta3 signaling |
| 0.1 | 15.6 | REACTOME TRANSPORT OF INORGANIC CATIONS ANIONS AND AMINO ACIDS OLIGOPEPTIDES | Genes involved in Transport of inorganic cations/anions and amino acids/oligopeptides |
| 0.1 | 3.1 | REACTOME G BETA GAMMA SIGNALLING THROUGH PI3KGAMMA | Genes involved in G beta:gamma signalling through PI3Kgamma |
| 0.1 | 2.8 | REACTOME SIGNALING BY FGFR1 FUSION MUTANTS | Genes involved in Signaling by FGFR1 fusion mutants |
| 0.1 | 1.8 | REACTOME TAK1 ACTIVATES NFKB BY PHOSPHORYLATION AND ACTIVATION OF IKKS COMPLEX | Genes involved in TAK1 activates NFkB by phosphorylation and activation of IKKs complex |
| 0.1 | 8.3 | REACTOME NUCLEAR RECEPTOR TRANSCRIPTION PATHWAY | Genes involved in Nuclear Receptor transcription pathway |
| 0.1 | 1.0 | REACTOME THE NLRP3 INFLAMMASOME | Genes involved in The NLRP3 inflammasome |
| 0.1 | 3.9 | REACTOME VOLTAGE GATED POTASSIUM CHANNELS | Genes involved in Voltage gated Potassium channels |
| 0.1 | 2.4 | REACTOME FRS2 MEDIATED CASCADE | Genes involved in FRS2-mediated cascade |
| 0.1 | 2.7 | REACTOME PREFOLDIN MEDIATED TRANSFER OF SUBSTRATE TO CCT TRIC | Genes involved in Prefoldin mediated transfer of substrate to CCT/TriC |
| 0.1 | 0.8 | REACTOME ANTIGEN PRESENTATION FOLDING ASSEMBLY AND PEPTIDE LOADING OF CLASS I MHC | Genes involved in Antigen Presentation: Folding, assembly and peptide loading of class I MHC |
| 0.1 | 0.9 | REACTOME METABOLISM OF NON CODING RNA | Genes involved in Metabolism of non-coding RNA |
| 0.1 | 12.9 | REACTOME PEPTIDE LIGAND BINDING RECEPTORS | Genes involved in Peptide ligand-binding receptors |
| 0.1 | 0.8 | REACTOME HYALURONAN UPTAKE AND DEGRADATION | Genes involved in Hyaluronan uptake and degradation |
| 0.1 | 0.9 | REACTOME MRNA SPLICING MINOR PATHWAY | Genes involved in mRNA Splicing - Minor Pathway |
| 0.0 | 0.7 | REACTOME REGULATION OF KIT SIGNALING | Genes involved in Regulation of KIT signaling |
| 0.0 | 4.7 | REACTOME NGF SIGNALLING VIA TRKA FROM THE PLASMA MEMBRANE | Genes involved in NGF signalling via TRKA from the plasma membrane |
| 0.0 | 0.8 | REACTOME TRANSPORT OF ORGANIC ANIONS | Genes involved in Transport of organic anions |
| 0.0 | 4.1 | REACTOME INTERFERON GAMMA SIGNALING | Genes involved in Interferon gamma signaling |
| 0.0 | 1.0 | REACTOME IONOTROPIC ACTIVITY OF KAINATE RECEPTORS | Genes involved in Ionotropic activity of Kainate Receptors |
| 0.0 | 0.5 | REACTOME AMINE LIGAND BINDING RECEPTORS | Genes involved in Amine ligand-binding receptors |
| 0.0 | 2.4 | REACTOME G ALPHA I SIGNALLING EVENTS | Genes involved in G alpha (i) signalling events |
| 0.0 | 0.3 | REACTOME HORMONE LIGAND BINDING RECEPTORS | Genes involved in Hormone ligand-binding receptors |
| 0.0 | 1.2 | REACTOME SMAD2 SMAD3 SMAD4 HETEROTRIMER REGULATES TRANSCRIPTION | Genes involved in SMAD2/SMAD3:SMAD4 heterotrimer regulates transcription |
| 0.0 | 0.9 | REACTOME NOTCH1 INTRACELLULAR DOMAIN REGULATES TRANSCRIPTION | Genes involved in NOTCH1 Intracellular Domain Regulates Transcription |
| 0.0 | 0.3 | REACTOME HDL MEDIATED LIPID TRANSPORT | Genes involved in HDL-mediated lipid transport |
| 0.0 | 0.8 | REACTOME ION TRANSPORT BY P TYPE ATPASES | Genes involved in Ion transport by P-type ATPases |