Project
GNF SymAtlas + NCI-60 cancer cell lines, human (Su, 2004; Ross, 2000)
Navigation
Downloads
Results for RELB
Z-value: 0.79
Motif logo
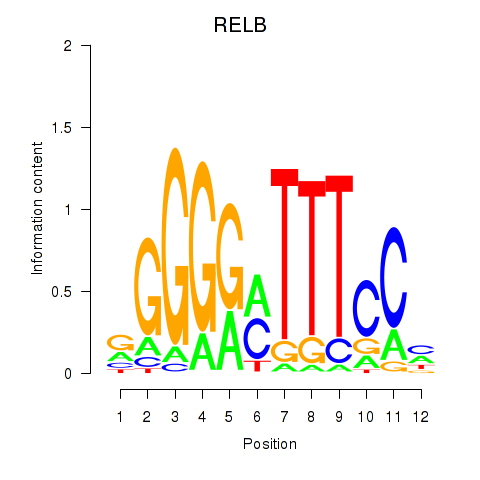
Transcription factors associated with RELB
| Gene Symbol | Gene ID | Gene Info |
|---|---|---|
|
RELB
|
ENSG00000104856.14 | RELB |
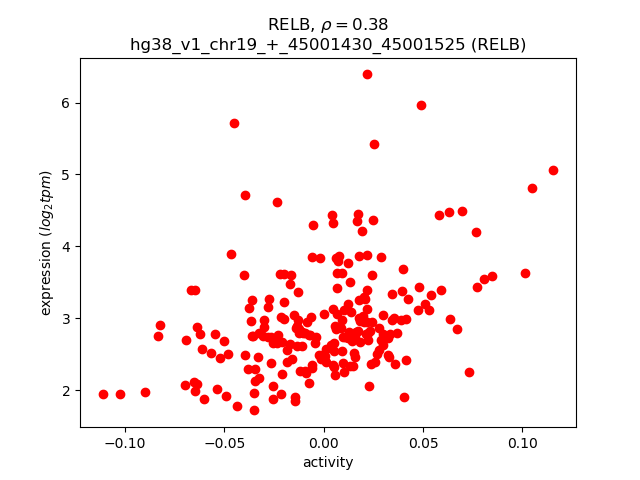
Activity-expression correlation:
| Gene | Promoter | Pearson corr. coef. | P-value | Plot |
|---|---|---|---|---|
| RELB | hg38_v1_chr19_+_45001430_45001525 | 0.38 | 7.3e-09 | Click! |
Activity profile of RELB motif
Sorted Z-values of RELB motif
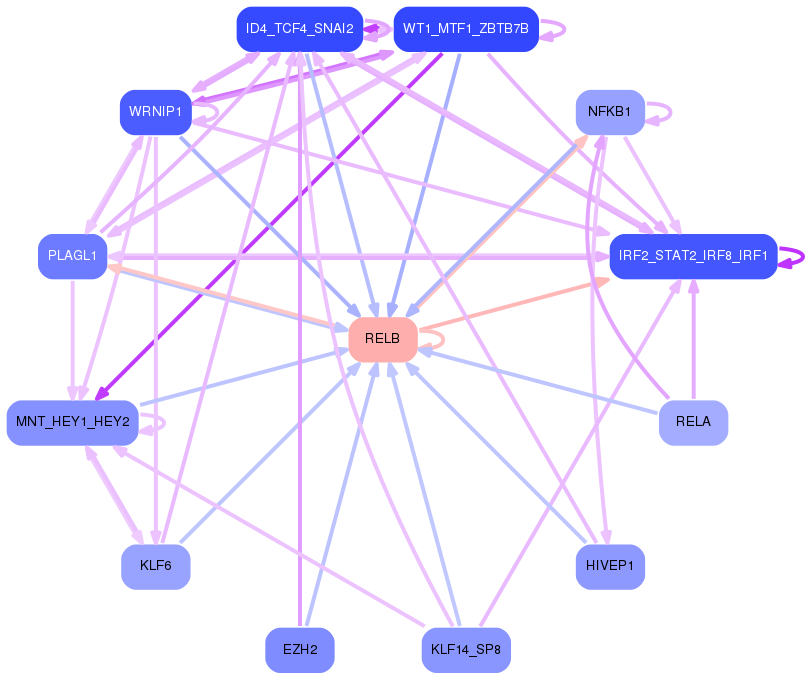
Network of associatons between targets according to the STRING database.

First level regulatory network of RELB
Gene Ontology Analysis
Gene overrepresentation in biological process category:
| Log-likelihood per target | Total log-likelihood | Term | Description |
|---|---|---|---|
| 4.2 | 12.6 | GO:0070429 | regulation of toll-like receptor 5 signaling pathway(GO:0034147) negative regulation of toll-like receptor 5 signaling pathway(GO:0034148) negative regulation of nucleotide-binding oligomerization domain containing 1 signaling pathway(GO:0070429) tolerance induction to lipopolysaccharide(GO:0072573) |
| 3.6 | 10.9 | GO:0035691 | macrophage migration inhibitory factor signaling pathway(GO:0035691) |
| 2.3 | 9.2 | GO:1900169 | regulation of glucocorticoid mediated signaling pathway(GO:1900169) |
| 2.0 | 20.0 | GO:0002480 | antigen processing and presentation of exogenous peptide antigen via MHC class I, TAP-independent(GO:0002480) |
| 1.7 | 5.0 | GO:2000777 | positive regulation of oocyte maturation(GO:1900195) negative regulation of NLRP3 inflammasome complex assembly(GO:1900226) positive regulation of proteasomal ubiquitin-dependent protein catabolic process involved in cellular response to hypoxia(GO:2000777) |
| 1.6 | 4.7 | GO:1902728 | negative regulation of hydrogen peroxide biosynthetic process(GO:0010730) positive regulation of skeletal muscle satellite cell proliferation(GO:1902724) positive regulation of growth factor dependent skeletal muscle satellite cell proliferation(GO:1902728) |
| 1.4 | 5.7 | GO:0070427 | nucleotide-binding oligomerization domain containing 1 signaling pathway(GO:0070427) |
| 1.4 | 4.2 | GO:0030241 | skeletal muscle myosin thick filament assembly(GO:0030241) sarcomerogenesis(GO:0048769) |
| 1.3 | 3.8 | GO:0010587 | miRNA catabolic process(GO:0010587) |
| 1.3 | 5.1 | GO:1904428 | negative regulation of tubulin deacetylation(GO:1904428) |
| 1.2 | 3.7 | GO:0031550 | positive regulation of brain-derived neurotrophic factor receptor signaling pathway(GO:0031550) |
| 1.2 | 1.2 | GO:0031548 | regulation of brain-derived neurotrophic factor receptor signaling pathway(GO:0031548) |
| 1.1 | 2.1 | GO:0090291 | negative regulation of osteoclast proliferation(GO:0090291) |
| 1.0 | 3.1 | GO:1902595 | regulation of DNA replication origin binding(GO:1902595) |
| 1.0 | 2.9 | GO:2001153 | regulation of renal water transport(GO:2001151) positive regulation of renal water transport(GO:2001153) |
| 0.9 | 2.8 | GO:0033277 | abortive mitotic cell cycle(GO:0033277) |
| 0.9 | 3.6 | GO:0033634 | positive regulation of cell-cell adhesion mediated by integrin(GO:0033634) negative regulation of endothelial cell chemotaxis(GO:2001027) |
| 0.9 | 2.7 | GO:0000103 | sulfate assimilation(GO:0000103) |
| 0.8 | 3.1 | GO:1990637 | hepatic immune response(GO:0002384) response to prolactin(GO:1990637) |
| 0.7 | 8.6 | GO:0070424 | regulation of nucleotide-binding oligomerization domain containing signaling pathway(GO:0070424) |
| 0.7 | 2.2 | GO:0099526 | presynaptic signal transduction(GO:0098928) presynapse to nucleus signaling pathway(GO:0099526) |
| 0.7 | 5.7 | GO:0070842 | aggresome assembly(GO:0070842) |
| 0.7 | 2.1 | GO:0021555 | midbrain-hindbrain boundary morphogenesis(GO:0021555) fourth ventricle development(GO:0021592) third ventricle development(GO:0021678) |
| 0.7 | 2.1 | GO:0060448 | dichotomous subdivision of terminal units involved in lung branching(GO:0060448) |
| 0.7 | 2.6 | GO:2001280 | positive regulation of prostaglandin biosynthetic process(GO:0031394) positive regulation of unsaturated fatty acid biosynthetic process(GO:2001280) |
| 0.7 | 5.9 | GO:1903142 | positive regulation of endothelial cell development(GO:1901552) positive regulation of establishment of endothelial barrier(GO:1903142) |
| 0.6 | 2.3 | GO:0035610 | protein side chain deglutamylation(GO:0035610) |
| 0.6 | 6.3 | GO:0060753 | regulation of mast cell chemotaxis(GO:0060753) |
| 0.6 | 7.3 | GO:0060020 | Bergmann glial cell differentiation(GO:0060020) |
| 0.6 | 5.0 | GO:0032713 | negative regulation of interleukin-4 production(GO:0032713) |
| 0.5 | 2.2 | GO:0002268 | follicular dendritic cell differentiation(GO:0002268) |
| 0.5 | 2.7 | GO:1900127 | positive regulation of hyaluronan biosynthetic process(GO:1900127) |
| 0.5 | 1.6 | GO:0045957 | regulation of complement activation, alternative pathway(GO:0030451) negative regulation of complement activation, alternative pathway(GO:0045957) |
| 0.5 | 4.6 | GO:1903898 | negative regulation of PERK-mediated unfolded protein response(GO:1903898) negative regulation of endoplasmic reticulum stress-induced eIF2 alpha phosphorylation(GO:1903912) |
| 0.5 | 2.4 | GO:0060718 | chorionic trophoblast cell differentiation(GO:0060718) |
| 0.5 | 8.6 | GO:0032688 | negative regulation of interferon-beta production(GO:0032688) |
| 0.5 | 1.4 | GO:0015860 | purine nucleoside transmembrane transport(GO:0015860) |
| 0.5 | 2.8 | GO:0006651 | diacylglycerol biosynthetic process(GO:0006651) |
| 0.5 | 1.8 | GO:1900085 | negative regulation of peptidyl-tyrosine autophosphorylation(GO:1900085) negative regulation of inward rectifier potassium channel activity(GO:1903609) |
| 0.5 | 1.4 | GO:2000176 | regulation of pro-T cell differentiation(GO:2000174) positive regulation of pro-T cell differentiation(GO:2000176) |
| 0.5 | 2.3 | GO:0006957 | complement activation, alternative pathway(GO:0006957) |
| 0.4 | 1.3 | GO:0045626 | negative regulation of T-helper 1 cell differentiation(GO:0045626) |
| 0.4 | 3.1 | GO:0030885 | regulation of myeloid dendritic cell activation(GO:0030885) positive regulation of interferon-gamma secretion(GO:1902715) |
| 0.4 | 8.2 | GO:0070208 | protein heterotrimerization(GO:0070208) |
| 0.4 | 2.1 | GO:0008063 | Toll signaling pathway(GO:0008063) |
| 0.4 | 2.4 | GO:1903232 | melanosome assembly(GO:1903232) |
| 0.4 | 1.2 | GO:0051182 | coenzyme transport(GO:0051182) |
| 0.4 | 3.6 | GO:1902856 | negative regulation of nonmotile primary cilium assembly(GO:1902856) |
| 0.4 | 1.1 | GO:1901842 | negative regulation of high voltage-gated calcium channel activity(GO:1901842) |
| 0.4 | 1.1 | GO:0051365 | cellular response to potassium ion starvation(GO:0051365) |
| 0.4 | 7.0 | GO:0042832 | defense response to protozoan(GO:0042832) |
| 0.3 | 10.9 | GO:0090023 | positive regulation of neutrophil chemotaxis(GO:0090023) |
| 0.3 | 1.0 | GO:0036071 | N-glycan fucosylation(GO:0036071) |
| 0.3 | 2.8 | GO:0002827 | positive regulation of T-helper 1 type immune response(GO:0002827) |
| 0.3 | 40.5 | GO:2000257 | regulation of protein activation cascade(GO:2000257) |
| 0.3 | 3.9 | GO:2000271 | positive regulation of fibroblast apoptotic process(GO:2000271) |
| 0.3 | 1.1 | GO:0036269 | swimming behavior(GO:0036269) |
| 0.3 | 32.2 | GO:0031295 | T cell costimulation(GO:0031295) |
| 0.3 | 0.8 | GO:0070409 | carbamoyl phosphate metabolic process(GO:0070408) carbamoyl phosphate biosynthetic process(GO:0070409) cellular response to oleic acid(GO:0071400) response to ammonia(GO:1903717) cellular response to ammonia(GO:1903718) |
| 0.3 | 3.8 | GO:0038063 | collagen-activated tyrosine kinase receptor signaling pathway(GO:0038063) |
| 0.3 | 0.3 | GO:0033632 | regulation of cell-cell adhesion mediated by integrin(GO:0033632) |
| 0.3 | 1.3 | GO:0051935 | amino acid neurotransmitter reuptake(GO:0051933) glutamate reuptake(GO:0051935) |
| 0.3 | 2.1 | GO:1903003 | positive regulation of protein deubiquitination(GO:1903003) |
| 0.3 | 2.3 | GO:0072513 | positive regulation of secondary heart field cardioblast proliferation(GO:0072513) |
| 0.3 | 1.3 | GO:1902774 | late endosome to lysosome transport(GO:1902774) |
| 0.2 | 2.2 | GO:0000101 | sulfur amino acid transport(GO:0000101) |
| 0.2 | 0.9 | GO:0097325 | melanocyte proliferation(GO:0097325) |
| 0.2 | 2.3 | GO:0051601 | exocyst localization(GO:0051601) |
| 0.2 | 0.6 | GO:0071921 | establishment of sister chromatid cohesion(GO:0034085) cohesin loading(GO:0071921) regulation of cohesin loading(GO:0071922) |
| 0.2 | 5.5 | GO:0097150 | neuronal stem cell population maintenance(GO:0097150) |
| 0.2 | 0.6 | GO:0014022 | neural plate elongation(GO:0014022) convergent extension involved in neural plate elongation(GO:0022007) |
| 0.2 | 1.6 | GO:0003172 | primary heart field specification(GO:0003138) sinoatrial valve development(GO:0003172) sinoatrial valve morphogenesis(GO:0003185) |
| 0.2 | 0.6 | GO:0038043 | interleukin-5-mediated signaling pathway(GO:0038043) |
| 0.2 | 1.2 | GO:0006196 | AMP catabolic process(GO:0006196) |
| 0.2 | 2.3 | GO:0001833 | inner cell mass cell proliferation(GO:0001833) |
| 0.2 | 0.6 | GO:0071206 | establishment of protein localization to juxtaparanode region of axon(GO:0071206) |
| 0.2 | 0.6 | GO:0031587 | positive regulation of inositol 1,4,5-trisphosphate-sensitive calcium-release channel activity(GO:0031587) |
| 0.2 | 3.2 | GO:0055003 | cardiac myofibril assembly(GO:0055003) |
| 0.2 | 2.2 | GO:0021670 | lateral ventricle development(GO:0021670) |
| 0.2 | 1.9 | GO:0098912 | membrane depolarization during atrial cardiac muscle cell action potential(GO:0098912) |
| 0.1 | 4.5 | GO:0030207 | chondroitin sulfate catabolic process(GO:0030207) |
| 0.1 | 1.9 | GO:1901223 | negative regulation of NIK/NF-kappaB signaling(GO:1901223) |
| 0.1 | 1.9 | GO:0045063 | T-helper 1 cell differentiation(GO:0045063) |
| 0.1 | 0.3 | GO:0048852 | hypophysis morphogenesis(GO:0048850) diencephalon morphogenesis(GO:0048852) |
| 0.1 | 0.7 | GO:0033216 | ferric iron import(GO:0033216) ferric iron import into cell(GO:0097461) ferric iron import across plasma membrane(GO:0098706) |
| 0.1 | 1.2 | GO:0001865 | NK T cell differentiation(GO:0001865) |
| 0.1 | 0.9 | GO:0048133 | germ-line stem cell division(GO:0042078) male germ-line stem cell asymmetric division(GO:0048133) germline stem cell asymmetric division(GO:0098728) |
| 0.1 | 0.8 | GO:1902261 | positive regulation of delayed rectifier potassium channel activity(GO:1902261) |
| 0.1 | 1.8 | GO:0006559 | L-phenylalanine metabolic process(GO:0006558) L-phenylalanine catabolic process(GO:0006559) erythrose 4-phosphate/phosphoenolpyruvate family amino acid metabolic process(GO:1902221) erythrose 4-phosphate/phosphoenolpyruvate family amino acid catabolic process(GO:1902222) |
| 0.1 | 5.4 | GO:0060216 | definitive hemopoiesis(GO:0060216) |
| 0.1 | 3.4 | GO:0035428 | hexose transmembrane transport(GO:0035428) glucose transmembrane transport(GO:1904659) |
| 0.1 | 1.0 | GO:0007023 | post-chaperonin tubulin folding pathway(GO:0007023) |
| 0.1 | 0.8 | GO:0070942 | neutrophil mediated cytotoxicity(GO:0070942) neutrophil mediated killing of symbiont cell(GO:0070943) neutrophil mediated killing of bacterium(GO:0070944) |
| 0.1 | 0.8 | GO:2000389 | regulation of neutrophil extravasation(GO:2000389) |
| 0.1 | 1.4 | GO:0014824 | artery smooth muscle contraction(GO:0014824) |
| 0.1 | 0.6 | GO:0006065 | UDP-glucuronate biosynthetic process(GO:0006065) |
| 0.1 | 1.4 | GO:0010668 | ectodermal cell differentiation(GO:0010668) |
| 0.1 | 11.4 | GO:0005977 | glycogen metabolic process(GO:0005977) |
| 0.1 | 2.4 | GO:0006895 | Golgi to endosome transport(GO:0006895) |
| 0.1 | 3.2 | GO:0035455 | response to interferon-alpha(GO:0035455) |
| 0.1 | 0.4 | GO:0042488 | positive regulation of odontogenesis of dentin-containing tooth(GO:0042488) mammary gland fat development(GO:0060611) positive regulation of macrophage colony-stimulating factor signaling pathway(GO:1902228) positive regulation of response to macrophage colony-stimulating factor(GO:1903971) positive regulation of cellular response to macrophage colony-stimulating factor stimulus(GO:1903974) positive regulation of microglial cell migration(GO:1904141) |
| 0.1 | 1.0 | GO:0043950 | positive regulation of cAMP-mediated signaling(GO:0043950) |
| 0.1 | 0.3 | GO:0033512 | lysine biosynthetic process(GO:0009085) lysine biosynthetic process via aminoadipic acid(GO:0019878) L-lysine catabolic process to acetyl-CoA via saccharopine(GO:0033512) |
| 0.1 | 0.7 | GO:0016098 | monoterpenoid metabolic process(GO:0016098) |
| 0.1 | 1.5 | GO:0015884 | folic acid transport(GO:0015884) |
| 0.1 | 0.8 | GO:0031580 | membrane raft polarization(GO:0001766) membrane raft distribution(GO:0031580) |
| 0.1 | 1.8 | GO:0006590 | thyroid hormone generation(GO:0006590) |
| 0.1 | 1.2 | GO:0007220 | Notch receptor processing(GO:0007220) |
| 0.1 | 3.1 | GO:0051491 | positive regulation of filopodium assembly(GO:0051491) |
| 0.1 | 0.9 | GO:0036309 | protein localization to M-band(GO:0036309) protein localization to T-tubule(GO:0036371) |
| 0.1 | 7.4 | GO:0050853 | B cell receptor signaling pathway(GO:0050853) |
| 0.1 | 1.7 | GO:0045730 | respiratory burst(GO:0045730) |
| 0.1 | 3.3 | GO:0048247 | lymphocyte chemotaxis(GO:0048247) |
| 0.1 | 1.4 | GO:0036149 | phosphatidylinositol acyl-chain remodeling(GO:0036149) |
| 0.1 | 1.0 | GO:0006069 | ethanol oxidation(GO:0006069) |
| 0.1 | 0.7 | GO:0071352 | interleukin-2-mediated signaling pathway(GO:0038110) cellular response to interleukin-2(GO:0071352) |
| 0.1 | 0.2 | GO:0016999 | antibiotic metabolic process(GO:0016999) cellular amide catabolic process(GO:0043605) |
| 0.1 | 1.4 | GO:0050860 | negative regulation of antigen receptor-mediated signaling pathway(GO:0050858) negative regulation of T cell receptor signaling pathway(GO:0050860) |
| 0.1 | 0.5 | GO:0006451 | selenocysteine incorporation(GO:0001514) translational readthrough(GO:0006451) |
| 0.1 | 1.5 | GO:0048026 | positive regulation of mRNA splicing, via spliceosome(GO:0048026) |
| 0.1 | 0.5 | GO:0061709 | reticulophagy(GO:0061709) |
| 0.1 | 1.6 | GO:0021895 | cerebral cortex neuron differentiation(GO:0021895) |
| 0.1 | 1.5 | GO:0007202 | activation of phospholipase C activity(GO:0007202) |
| 0.1 | 0.6 | GO:0071799 | response to prostaglandin D(GO:0071798) cellular response to prostaglandin D stimulus(GO:0071799) |
| 0.1 | 1.9 | GO:0060334 | regulation of interferon-gamma-mediated signaling pathway(GO:0060334) |
| 0.1 | 3.7 | GO:0070098 | chemokine-mediated signaling pathway(GO:0070098) |
| 0.1 | 0.8 | GO:0098719 | sodium ion import across plasma membrane(GO:0098719) sodium ion import into cell(GO:1990118) |
| 0.1 | 0.3 | GO:0030854 | positive regulation of granulocyte differentiation(GO:0030854) |
| 0.1 | 1.6 | GO:0002026 | regulation of the force of heart contraction(GO:0002026) |
| 0.1 | 0.8 | GO:0043117 | positive regulation of vascular permeability(GO:0043117) |
| 0.1 | 7.9 | GO:0002377 | immunoglobulin production(GO:0002377) |
| 0.1 | 1.1 | GO:0051895 | negative regulation of focal adhesion assembly(GO:0051895) negative regulation of adherens junction organization(GO:1903392) |
| 0.1 | 0.6 | GO:0034380 | high-density lipoprotein particle assembly(GO:0034380) |
| 0.1 | 0.3 | GO:2001184 | positive regulation of interleukin-12 secretion(GO:2001184) |
| 0.0 | 0.7 | GO:0006853 | carnitine shuttle(GO:0006853) |
| 0.0 | 2.8 | GO:0034260 | negative regulation of GTPase activity(GO:0034260) |
| 0.0 | 0.2 | GO:2000400 | positive regulation of T cell differentiation in thymus(GO:0033089) positive regulation of thymocyte aggregation(GO:2000400) |
| 0.0 | 1.2 | GO:0051560 | mitochondrial calcium ion homeostasis(GO:0051560) |
| 0.0 | 0.4 | GO:0097084 | vascular smooth muscle cell development(GO:0097084) |
| 0.0 | 0.4 | GO:0051599 | response to hydrostatic pressure(GO:0051599) positive regulation of endothelial cell apoptotic process(GO:2000353) |
| 0.0 | 0.2 | GO:0006432 | phenylalanyl-tRNA aminoacylation(GO:0006432) |
| 0.0 | 1.5 | GO:0022400 | regulation of rhodopsin mediated signaling pathway(GO:0022400) |
| 0.0 | 0.8 | GO:0009312 | oligosaccharide biosynthetic process(GO:0009312) |
| 0.0 | 0.4 | GO:0086023 | adrenergic receptor signaling pathway involved in heart process(GO:0086023) |
| 0.0 | 1.9 | GO:0007274 | neuromuscular synaptic transmission(GO:0007274) |
| 0.0 | 0.8 | GO:0006833 | water transport(GO:0006833) |
| 0.0 | 3.9 | GO:0051436 | negative regulation of ubiquitin-protein ligase activity involved in mitotic cell cycle(GO:0051436) |
| 0.0 | 0.5 | GO:0006702 | androgen biosynthetic process(GO:0006702) progesterone metabolic process(GO:0042448) |
| 0.0 | 1.6 | GO:0071377 | cellular response to glucagon stimulus(GO:0071377) |
| 0.0 | 0.3 | GO:0048003 | antigen processing and presentation of lipid antigen via MHC class Ib(GO:0048003) antigen processing and presentation, exogenous lipid antigen via MHC class Ib(GO:0048007) |
| 0.0 | 1.4 | GO:0006198 | cAMP catabolic process(GO:0006198) |
| 0.0 | 0.6 | GO:0031915 | positive regulation of synaptic plasticity(GO:0031915) |
| 0.0 | 0.4 | GO:0031987 | locomotion involved in locomotory behavior(GO:0031987) |
| 0.0 | 1.6 | GO:0000413 | protein peptidyl-prolyl isomerization(GO:0000413) |
| 0.0 | 0.2 | GO:0021591 | ventricular system development(GO:0021591) |
| 0.0 | 0.7 | GO:0032012 | regulation of ARF protein signal transduction(GO:0032012) |
| 0.0 | 0.8 | GO:0032008 | positive regulation of TOR signaling(GO:0032008) |
| 0.0 | 0.5 | GO:0006228 | UTP biosynthetic process(GO:0006228) |
| 0.0 | 1.1 | GO:0015949 | nucleobase-containing small molecule interconversion(GO:0015949) |
| 0.0 | 0.9 | GO:1900048 | positive regulation of blood coagulation(GO:0030194) positive regulation of coagulation(GO:0050820) positive regulation of hemostasis(GO:1900048) |
| 0.0 | 0.7 | GO:0008053 | mitochondrial fusion(GO:0008053) |
| 0.0 | 0.2 | GO:2000507 | positive regulation of energy homeostasis(GO:2000507) |
| 0.0 | 0.5 | GO:0005513 | detection of calcium ion(GO:0005513) |
| 0.0 | 1.8 | GO:0016525 | negative regulation of angiogenesis(GO:0016525) |
| 0.0 | 1.1 | GO:0018279 | protein N-linked glycosylation via asparagine(GO:0018279) |
| 0.0 | 0.4 | GO:0060736 | prostate gland growth(GO:0060736) |
| 0.0 | 2.2 | GO:0035335 | peptidyl-tyrosine dephosphorylation(GO:0035335) |
| 0.0 | 0.8 | GO:0007212 | dopamine receptor signaling pathway(GO:0007212) |
| 0.0 | 0.6 | GO:0072661 | protein targeting to plasma membrane(GO:0072661) |
| 0.0 | 0.2 | GO:0046951 | ketone body biosynthetic process(GO:0046951) |
| 0.0 | 0.7 | GO:0019933 | cAMP-mediated signaling(GO:0019933) |
| 0.0 | 0.8 | GO:0035116 | embryonic hindlimb morphogenesis(GO:0035116) |
| 0.0 | 1.0 | GO:0035914 | skeletal muscle cell differentiation(GO:0035914) |
| 0.0 | 0.6 | GO:0043928 | exonucleolytic nuclear-transcribed mRNA catabolic process involved in deadenylation-dependent decay(GO:0043928) |
| 0.0 | 1.0 | GO:0010923 | negative regulation of phosphatase activity(GO:0010923) |
| 0.0 | 0.6 | GO:0045214 | sarcomere organization(GO:0045214) |
| 0.0 | 0.6 | GO:0038083 | peptidyl-tyrosine autophosphorylation(GO:0038083) |
| 0.0 | 0.2 | GO:0052697 | flavonoid glucuronidation(GO:0052696) xenobiotic glucuronidation(GO:0052697) |
| 0.0 | 0.1 | GO:0014050 | negative regulation of glutamate secretion(GO:0014050) |
| 0.0 | 2.4 | GO:0006941 | striated muscle contraction(GO:0006941) |
| 0.0 | 1.9 | GO:0042787 | protein ubiquitination involved in ubiquitin-dependent protein catabolic process(GO:0042787) |
Gene overrepresentation in cellular component category:
| Log-likelihood per target | Total log-likelihood | Term | Description |
|---|---|---|---|
| 2.3 | 42.9 | GO:0042613 | MHC class II protein complex(GO:0042613) |
| 1.8 | 20.0 | GO:0042611 | MHC protein complex(GO:0042611) |
| 1.5 | 19.1 | GO:0033256 | I-kappaB/NF-kappaB complex(GO:0033256) |
| 1.3 | 6.4 | GO:0019815 | B cell receptor complex(GO:0019815) |
| 1.0 | 6.0 | GO:0005927 | muscle tendon junction(GO:0005927) |
| 0.8 | 2.4 | GO:0031085 | BLOC-3 complex(GO:0031085) |
| 0.7 | 2.2 | GO:0098831 | cytoskeleton of presynaptic active zone(GO:0048788) presynaptic active zone cytoplasmic component(GO:0098831) presynaptic cytoskeleton(GO:0099569) |
| 0.6 | 8.2 | GO:0098643 | fibrillar collagen trimer(GO:0005583) banded collagen fibril(GO:0098643) |
| 0.6 | 3.1 | GO:0005896 | interleukin-6 receptor complex(GO:0005896) |
| 0.6 | 4.7 | GO:0005587 | collagen type IV trimer(GO:0005587) |
| 0.6 | 5.0 | GO:0072687 | meiotic spindle(GO:0072687) |
| 0.5 | 3.8 | GO:0042406 | extrinsic component of endoplasmic reticulum membrane(GO:0042406) |
| 0.5 | 3.8 | GO:1990111 | spermatoproteasome complex(GO:1990111) |
| 0.5 | 10.0 | GO:0043205 | microfibril(GO:0001527) fibril(GO:0043205) |
| 0.5 | 5.5 | GO:0043240 | Fanconi anaemia nuclear complex(GO:0043240) |
| 0.4 | 1.1 | GO:0030485 | smooth muscle contractile fiber(GO:0030485) |
| 0.4 | 2.2 | GO:0005879 | axonemal microtubule(GO:0005879) |
| 0.3 | 1.0 | GO:1990075 | periciliary membrane compartment(GO:1990075) |
| 0.3 | 4.3 | GO:0000164 | protein phosphatase type 1 complex(GO:0000164) |
| 0.3 | 2.8 | GO:0042105 | alpha-beta T cell receptor complex(GO:0042105) |
| 0.2 | 2.8 | GO:0097486 | multivesicular body lumen(GO:0097486) |
| 0.2 | 0.6 | GO:0035189 | Rb-E2F complex(GO:0035189) |
| 0.2 | 0.6 | GO:0055087 | Ski complex(GO:0055087) |
| 0.2 | 1.7 | GO:0032010 | phagolysosome(GO:0032010) |
| 0.2 | 5.9 | GO:0016327 | apicolateral plasma membrane(GO:0016327) |
| 0.2 | 2.8 | GO:0031235 | intrinsic component of the cytoplasmic side of the plasma membrane(GO:0031235) |
| 0.1 | 5.7 | GO:0005859 | muscle myosin complex(GO:0005859) |
| 0.1 | 1.2 | GO:0070765 | gamma-secretase complex(GO:0070765) |
| 0.1 | 2.3 | GO:0000145 | exocyst(GO:0000145) |
| 0.1 | 6.3 | GO:0016235 | aggresome(GO:0016235) |
| 0.1 | 3.2 | GO:0036379 | striated muscle thin filament(GO:0005865) myofilament(GO:0036379) |
| 0.1 | 2.1 | GO:0035631 | CD40 receptor complex(GO:0035631) |
| 0.1 | 25.6 | GO:0072562 | blood microparticle(GO:0072562) |
| 0.1 | 1.8 | GO:0034098 | VCP-NPL4-UFD1 AAA ATPase complex(GO:0034098) |
| 0.1 | 0.8 | GO:0061700 | GATOR2 complex(GO:0061700) |
| 0.1 | 1.3 | GO:0030897 | HOPS complex(GO:0030897) |
| 0.1 | 15.8 | GO:0005884 | actin filament(GO:0005884) |
| 0.1 | 1.9 | GO:1990454 | L-type voltage-gated calcium channel complex(GO:1990454) |
| 0.1 | 0.6 | GO:0070554 | synaptobrevin 2-SNAP-25-syntaxin-3-complexin complex(GO:0070554) |
| 0.1 | 3.6 | GO:0016592 | mediator complex(GO:0016592) |
| 0.1 | 1.5 | GO:0031045 | dense core granule(GO:0031045) |
| 0.1 | 4.4 | GO:0001917 | photoreceptor inner segment(GO:0001917) |
| 0.1 | 1.6 | GO:0036038 | MKS complex(GO:0036038) |
| 0.1 | 2.2 | GO:0005680 | anaphase-promoting complex(GO:0005680) |
| 0.1 | 0.9 | GO:0016602 | CCAAT-binding factor complex(GO:0016602) |
| 0.1 | 3.1 | GO:0046658 | anchored component of plasma membrane(GO:0046658) |
| 0.1 | 0.6 | GO:0014701 | junctional sarcoplasmic reticulum membrane(GO:0014701) |
| 0.1 | 0.4 | GO:1990682 | CSF1-CSF1R complex(GO:1990682) |
| 0.1 | 0.9 | GO:0071438 | invadopodium membrane(GO:0071438) |
| 0.1 | 7.3 | GO:0005882 | intermediate filament(GO:0005882) |
| 0.1 | 0.2 | GO:1990578 | perinuclear endoplasmic reticulum membrane(GO:1990578) |
| 0.0 | 0.6 | GO:0016013 | syntrophin complex(GO:0016013) |
| 0.0 | 0.4 | GO:0016012 | sarcoglycan complex(GO:0016012) |
| 0.0 | 3.1 | GO:0005581 | collagen trimer(GO:0005581) |
| 0.0 | 4.4 | GO:0031902 | late endosome membrane(GO:0031902) |
| 0.0 | 0.6 | GO:0031143 | pseudopodium(GO:0031143) |
| 0.0 | 3.3 | GO:0101003 | ficolin-1-rich granule membrane(GO:0101003) |
| 0.0 | 9.0 | GO:0009898 | cytoplasmic side of plasma membrane(GO:0009898) |
| 0.0 | 0.8 | GO:0043218 | compact myelin(GO:0043218) |
| 0.0 | 0.6 | GO:0031588 | nucleotide-activated protein kinase complex(GO:0031588) |
| 0.0 | 5.2 | GO:0030427 | site of polarized growth(GO:0030427) |
| 0.0 | 2.6 | GO:0005901 | caveola(GO:0005901) |
| 0.0 | 4.5 | GO:0009897 | external side of plasma membrane(GO:0009897) |
| 0.0 | 0.7 | GO:0031307 | integral component of mitochondrial outer membrane(GO:0031307) |
| 0.0 | 0.1 | GO:0032279 | asymmetric synapse(GO:0032279) |
| 0.0 | 2.4 | GO:0032587 | ruffle membrane(GO:0032587) |
| 0.0 | 2.7 | GO:0031225 | anchored component of membrane(GO:0031225) |
| 0.0 | 0.6 | GO:0044298 | neuronal cell body membrane(GO:0032809) cell body membrane(GO:0044298) |
| 0.0 | 0.9 | GO:0031430 | M band(GO:0031430) |
| 0.0 | 1.8 | GO:0030666 | endocytic vesicle membrane(GO:0030666) |
| 0.0 | 26.0 | GO:0005615 | extracellular space(GO:0005615) |
| 0.0 | 2.0 | GO:0055037 | recycling endosome(GO:0055037) |
| 0.0 | 9.0 | GO:0000323 | lytic vacuole(GO:0000323) lysosome(GO:0005764) |
| 0.0 | 0.5 | GO:0097546 | ciliary base(GO:0097546) |
| 0.0 | 1.4 | GO:0019898 | extrinsic component of membrane(GO:0019898) |
| 0.0 | 0.4 | GO:0005891 | voltage-gated calcium channel complex(GO:0005891) |
Gene overrepresentation in molecular function category:
| Log-likelihood per target | Total log-likelihood | Term | Description |
|---|---|---|---|
| 2.3 | 32.0 | GO:0032395 | MHC class II receptor activity(GO:0032395) |
| 2.3 | 13.6 | GO:0046979 | TAP2 binding(GO:0046979) |
| 2.2 | 10.9 | GO:0042289 | MHC class II protein binding(GO:0042289) |
| 1.7 | 5.0 | GO:0034739 | histone deacetylase activity (H4-K16 specific)(GO:0034739) |
| 1.5 | 11.7 | GO:0004865 | protein serine/threonine phosphatase inhibitor activity(GO:0004865) |
| 1.5 | 7.3 | GO:1990254 | keratin filament binding(GO:1990254) |
| 1.0 | 14.8 | GO:0045236 | CXCR chemokine receptor binding(GO:0045236) |
| 0.9 | 3.7 | GO:0005169 | neurotrophin TRKB receptor binding(GO:0005169) |
| 0.9 | 12.6 | GO:0061578 | Lys63-specific deubiquitinase activity(GO:0061578) |
| 0.8 | 3.1 | GO:0035033 | histone deacetylase regulator activity(GO:0035033) |
| 0.7 | 8.2 | GO:0048407 | platelet-derived growth factor binding(GO:0048407) |
| 0.7 | 2.2 | GO:0031862 | prostanoid receptor binding(GO:0031862) |
| 0.7 | 9.9 | GO:0005078 | MAP-kinase scaffold activity(GO:0005078) |
| 0.7 | 2.6 | GO:0050473 | arachidonate 15-lipoxygenase activity(GO:0050473) |
| 0.6 | 5.3 | GO:0031730 | CCR5 chemokine receptor binding(GO:0031730) |
| 0.6 | 1.1 | GO:0015180 | L-alanine transmembrane transporter activity(GO:0015180) alanine transmembrane transporter activity(GO:0022858) |
| 0.5 | 1.6 | GO:0004877 | complement component C4b receptor activity(GO:0001861) complement component C3b receptor activity(GO:0004877) |
| 0.5 | 1.9 | GO:0004906 | interferon-gamma receptor activity(GO:0004906) |
| 0.5 | 1.8 | GO:0070320 | inward rectifier potassium channel inhibitor activity(GO:0070320) |
| 0.4 | 1.8 | GO:0004505 | phenylalanine 4-monooxygenase activity(GO:0004505) |
| 0.4 | 2.6 | GO:0030023 | extracellular matrix constituent conferring elasticity(GO:0030023) |
| 0.4 | 1.7 | GO:0048403 | brain-derived neurotrophic factor binding(GO:0048403) |
| 0.4 | 2.8 | GO:0030368 | interleukin-17 receptor activity(GO:0030368) |
| 0.4 | 3.5 | GO:0008597 | calcium-dependent protein serine/threonine phosphatase regulator activity(GO:0008597) |
| 0.4 | 6.7 | GO:0030881 | beta-2-microglobulin binding(GO:0030881) |
| 0.4 | 1.1 | GO:0004833 | tryptophan 2,3-dioxygenase activity(GO:0004833) |
| 0.4 | 4.2 | GO:0031433 | telethonin binding(GO:0031433) |
| 0.4 | 2.9 | GO:0005000 | vasopressin receptor activity(GO:0005000) |
| 0.4 | 1.8 | GO:0004800 | thyroxine 5'-deiodinase activity(GO:0004800) |
| 0.3 | 3.1 | GO:0005138 | interleukin-6 receptor binding(GO:0005138) |
| 0.3 | 1.0 | GO:0046921 | glycoprotein 6-alpha-L-fucosyltransferase activity(GO:0008424) alpha-(1->6)-fucosyltransferase activity(GO:0046921) |
| 0.3 | 3.1 | GO:0035374 | chondroitin sulfate binding(GO:0035374) |
| 0.3 | 0.9 | GO:0035650 | AP-1 adaptor complex binding(GO:0035650) |
| 0.3 | 1.6 | GO:0032038 | myosin II heavy chain binding(GO:0032038) |
| 0.3 | 1.0 | GO:0003846 | 2-acylglycerol O-acyltransferase activity(GO:0003846) |
| 0.2 | 3.7 | GO:0019957 | C-C chemokine binding(GO:0019957) |
| 0.2 | 1.7 | GO:0016176 | superoxide-generating NADPH oxidase activator activity(GO:0016176) |
| 0.2 | 3.4 | GO:0055056 | D-glucose transmembrane transporter activity(GO:0055056) |
| 0.2 | 1.0 | GO:0005415 | nucleoside:sodium symporter activity(GO:0005415) |
| 0.2 | 2.1 | GO:0016015 | morphogen activity(GO:0016015) |
| 0.2 | 1.4 | GO:0031708 | endothelin B receptor binding(GO:0031708) |
| 0.2 | 2.2 | GO:0000099 | sulfur amino acid transmembrane transporter activity(GO:0000099) |
| 0.2 | 5.7 | GO:0070628 | proteasome binding(GO:0070628) |
| 0.2 | 44.5 | GO:0003823 | antigen binding(GO:0003823) |
| 0.2 | 3.8 | GO:0035925 | mRNA 3'-UTR AU-rich region binding(GO:0035925) |
| 0.2 | 0.8 | GO:0004087 | carbamoyl-phosphate synthase (ammonia) activity(GO:0004087) carbamoyl-phosphate synthase (glutamine-hydrolyzing) activity(GO:0004088) |
| 0.2 | 2.5 | GO:0004065 | arylsulfatase activity(GO:0004065) |
| 0.2 | 0.6 | GO:0004914 | interleukin-5 receptor activity(GO:0004914) |
| 0.2 | 16.7 | GO:0005201 | extracellular matrix structural constituent(GO:0005201) |
| 0.2 | 10.1 | GO:0001205 | transcriptional activator activity, RNA polymerase II distal enhancer sequence-specific binding(GO:0001205) |
| 0.2 | 0.7 | GO:0008823 | cupric reductase activity(GO:0008823) ferric-chelate reductase (NADPH) activity(GO:0052851) |
| 0.2 | 1.7 | GO:0004415 | hyalurononglucosaminidase activity(GO:0004415) |
| 0.2 | 1.1 | GO:0004873 | asialoglycoprotein receptor activity(GO:0004873) |
| 0.2 | 2.1 | GO:0070324 | thyroid hormone binding(GO:0070324) |
| 0.2 | 3.8 | GO:0070003 | threonine-type endopeptidase activity(GO:0004298) threonine-type peptidase activity(GO:0070003) |
| 0.2 | 0.8 | GO:0047273 | galactosylgalactosylglucosylceramide beta-D-acetylgalactosaminyltransferase activity(GO:0047273) |
| 0.2 | 4.6 | GO:0004181 | metallocarboxypeptidase activity(GO:0004181) |
| 0.2 | 2.1 | GO:0051864 | histone demethylase activity (H3-K36 specific)(GO:0051864) |
| 0.1 | 5.7 | GO:0051059 | NF-kappaB binding(GO:0051059) |
| 0.1 | 1.9 | GO:0086056 | voltage-gated calcium channel activity involved in AV node cell action potential(GO:0086056) |
| 0.1 | 1.3 | GO:0015272 | ATP-activated inward rectifier potassium channel activity(GO:0015272) |
| 0.1 | 6.6 | GO:0043027 | cysteine-type endopeptidase inhibitor activity involved in apoptotic process(GO:0043027) |
| 0.1 | 1.2 | GO:0047623 | AMP deaminase activity(GO:0003876) adenosine-phosphate deaminase activity(GO:0047623) |
| 0.1 | 0.6 | GO:0061676 | importin-alpha family protein binding(GO:0061676) |
| 0.1 | 2.2 | GO:0031996 | thioesterase binding(GO:0031996) |
| 0.1 | 3.3 | GO:0004435 | phosphatidylinositol phospholipase C activity(GO:0004435) |
| 0.1 | 2.2 | GO:0038191 | neuropilin binding(GO:0038191) |
| 0.1 | 0.7 | GO:0004301 | epoxide hydrolase activity(GO:0004301) |
| 0.1 | 1.7 | GO:0004551 | nucleotide diphosphatase activity(GO:0004551) |
| 0.1 | 2.2 | GO:0005522 | profilin binding(GO:0005522) |
| 0.1 | 1.6 | GO:0051184 | cofactor transporter activity(GO:0051184) |
| 0.1 | 2.8 | GO:0005001 | transmembrane receptor protein tyrosine phosphatase activity(GO:0005001) transmembrane receptor protein phosphatase activity(GO:0019198) |
| 0.1 | 0.8 | GO:0015385 | sodium:proton antiporter activity(GO:0015385) potassium:proton antiporter activity(GO:0015386) |
| 0.1 | 2.7 | GO:0070566 | adenylyltransferase activity(GO:0070566) |
| 0.1 | 0.6 | GO:0015165 | pyrimidine nucleotide-sugar transmembrane transporter activity(GO:0015165) |
| 0.1 | 0.4 | GO:0005157 | macrophage colony-stimulating factor receptor binding(GO:0005157) |
| 0.1 | 1.8 | GO:0005540 | hyaluronic acid binding(GO:0005540) |
| 0.1 | 2.2 | GO:0005520 | insulin-like growth factor binding(GO:0005520) |
| 0.1 | 1.6 | GO:0004955 | prostaglandin receptor activity(GO:0004955) |
| 0.1 | 1.5 | GO:0005542 | folic acid binding(GO:0005542) |
| 0.1 | 4.4 | GO:0015485 | cholesterol binding(GO:0015485) |
| 0.1 | 2.6 | GO:0005164 | tumor necrosis factor receptor binding(GO:0005164) |
| 0.1 | 1.1 | GO:0004017 | adenylate kinase activity(GO:0004017) |
| 0.1 | 0.5 | GO:0035368 | selenocysteine insertion sequence binding(GO:0035368) |
| 0.1 | 1.6 | GO:0005527 | macrolide binding(GO:0005527) FK506 binding(GO:0005528) |
| 0.1 | 0.8 | GO:0015250 | water channel activity(GO:0015250) |
| 0.1 | 0.2 | GO:0004421 | hydroxymethylglutaryl-CoA synthase activity(GO:0004421) |
| 0.1 | 2.1 | GO:0051019 | mitogen-activated protein kinase binding(GO:0051019) |
| 0.1 | 0.7 | GO:0004679 | AMP-activated protein kinase activity(GO:0004679) |
| 0.1 | 1.6 | GO:0042056 | chemoattractant activity(GO:0042056) |
| 0.1 | 1.6 | GO:0008009 | chemokine activity(GO:0008009) |
| 0.0 | 0.2 | GO:0032422 | purine-rich negative regulatory element binding(GO:0032422) |
| 0.0 | 1.4 | GO:0004622 | lysophospholipase activity(GO:0004622) |
| 0.0 | 2.1 | GO:0000049 | tRNA binding(GO:0000049) |
| 0.0 | 3.4 | GO:0050840 | extracellular matrix binding(GO:0050840) |
| 0.0 | 0.3 | GO:0004563 | beta-N-acetylhexosaminidase activity(GO:0004563) |
| 0.0 | 5.3 | GO:0004725 | protein tyrosine phosphatase activity(GO:0004725) |
| 0.0 | 4.3 | GO:0019888 | protein phosphatase regulator activity(GO:0019888) |
| 0.0 | 0.8 | GO:0008179 | adenylate cyclase binding(GO:0008179) |
| 0.0 | 1.6 | GO:0043015 | gamma-tubulin binding(GO:0043015) |
| 0.0 | 1.2 | GO:0005035 | tumor necrosis factor-activated receptor activity(GO:0005031) death receptor activity(GO:0005035) |
| 0.0 | 1.7 | GO:0004115 | 3',5'-cyclic-AMP phosphodiesterase activity(GO:0004115) |
| 0.0 | 0.9 | GO:0008239 | dipeptidyl-peptidase activity(GO:0008239) |
| 0.0 | 0.3 | GO:0008440 | inositol-1,4,5-trisphosphate 3-kinase activity(GO:0008440) |
| 0.0 | 0.3 | GO:0019212 | phosphatase inhibitor activity(GO:0019212) |
| 0.0 | 1.2 | GO:0008395 | steroid hydroxylase activity(GO:0008395) |
| 0.0 | 3.1 | GO:0004715 | non-membrane spanning protein tyrosine kinase activity(GO:0004715) |
| 0.0 | 0.2 | GO:0001515 | opioid peptide activity(GO:0001515) |
| 0.0 | 0.2 | GO:0005168 | neurotrophin TRKA receptor binding(GO:0005168) |
| 0.0 | 0.5 | GO:0004550 | nucleoside diphosphate kinase activity(GO:0004550) |
| 0.0 | 0.8 | GO:0070001 | aspartic-type endopeptidase activity(GO:0004190) aspartic-type peptidase activity(GO:0070001) |
| 0.0 | 1.0 | GO:0005158 | insulin receptor binding(GO:0005158) |
| 0.0 | 0.2 | GO:0030215 | semaphorin receptor binding(GO:0030215) |
| 0.0 | 0.6 | GO:0005251 | delayed rectifier potassium channel activity(GO:0005251) |
| 0.0 | 0.1 | GO:0070905 | serine binding(GO:0070905) |
| 0.0 | 0.6 | GO:0005003 | ephrin receptor activity(GO:0005003) |
| 0.0 | 2.7 | GO:0019887 | protein kinase regulator activity(GO:0019887) |
| 0.0 | 0.7 | GO:0005086 | ARF guanyl-nucleotide exchange factor activity(GO:0005086) |
| 0.0 | 2.8 | GO:0000149 | SNARE binding(GO:0000149) |
| 0.0 | 1.5 | GO:0016279 | lysine N-methyltransferase activity(GO:0016278) protein-lysine N-methyltransferase activity(GO:0016279) |
| 0.0 | 0.6 | GO:0005109 | frizzled binding(GO:0005109) |
| 0.0 | 0.3 | GO:0042809 | vitamin D receptor binding(GO:0042809) |
| 0.0 | 0.3 | GO:0004000 | adenosine deaminase activity(GO:0004000) |
| 0.0 | 6.2 | GO:0004857 | enzyme inhibitor activity(GO:0004857) |
| 0.0 | 1.1 | GO:0005070 | SH3/SH2 adaptor activity(GO:0005070) |
| 0.0 | 1.3 | GO:0000979 | RNA polymerase II core promoter sequence-specific DNA binding(GO:0000979) |
| 0.0 | 0.7 | GO:0004364 | glutathione transferase activity(GO:0004364) |
| 0.0 | 0.6 | GO:0005080 | protein kinase C binding(GO:0005080) |
| 0.0 | 0.9 | GO:0035064 | methylated histone binding(GO:0035064) |
| 0.0 | 0.1 | GO:0008479 | queuine tRNA-ribosyltransferase activity(GO:0008479) |
| 0.0 | 0.3 | GO:0004707 | MAP kinase activity(GO:0004707) |
| 0.0 | 0.3 | GO:0016646 | oxidoreductase activity, acting on the CH-NH group of donors, NAD or NADP as acceptor(GO:0016646) |
| 0.0 | 3.3 | GO:0001227 | transcriptional repressor activity, RNA polymerase II transcription regulatory region sequence-specific binding(GO:0001227) |
Gene overrepresentation in curated gene sets: canonical pathways category:
| Log-likelihood per target | Total log-likelihood | Term | Description |
|---|---|---|---|
| 0.5 | 32.5 | ST TUMOR NECROSIS FACTOR PATHWAY | Tumor Necrosis Factor Pathway. |
| 0.5 | 9.7 | ST STAT3 PATHWAY | STAT3 Pathway |
| 0.3 | 13.4 | NABA COLLAGENS | Genes encoding collagen proteins |
| 0.2 | 3.1 | PID TCR JNK PATHWAY | JNK signaling in the CD4+ TCR pathway |
| 0.2 | 4.1 | PID TCR RAS PATHWAY | Ras signaling in the CD4+ TCR pathway |
| 0.2 | 9.2 | PID THROMBIN PAR1 PATHWAY | PAR1-mediated thrombin signaling events |
| 0.2 | 5.7 | PID NFKAPPAB ATYPICAL PATHWAY | Atypical NF-kappaB pathway |
| 0.2 | 7.9 | PID IL8 CXCR2 PATHWAY | IL8- and CXCR2-mediated signaling events |
| 0.2 | 1.8 | PID PDGFRA PATHWAY | PDGFR-alpha signaling pathway |
| 0.1 | 2.6 | PID S1P S1P1 PATHWAY | S1P1 pathway |
| 0.1 | 9.2 | PID CD8 TCR PATHWAY | TCR signaling in naïve CD8+ T cells |
| 0.1 | 6.4 | PID BCR 5PATHWAY | BCR signaling pathway |
| 0.1 | 7.3 | PID AURORA B PATHWAY | Aurora B signaling |
| 0.1 | 3.9 | PID CXCR3 PATHWAY | CXCR3-mediated signaling events |
| 0.1 | 11.0 | PID NOTCH PATHWAY | Notch signaling pathway |
| 0.1 | 0.6 | PID IL5 PATHWAY | IL5-mediated signaling events |
| 0.1 | 5.5 | PID FANCONI PATHWAY | Fanconi anemia pathway |
| 0.1 | 3.1 | PID RAS PATHWAY | Regulation of Ras family activation |
| 0.1 | 0.7 | ST IL 13 PATHWAY | Interleukin 13 (IL-13) Pathway |
| 0.1 | 3.2 | PID HDAC CLASSIII PATHWAY | Signaling events mediated by HDAC Class III |
| 0.1 | 1.9 | PID IL27 PATHWAY | IL27-mediated signaling events |
| 0.1 | 4.8 | PID SHP2 PATHWAY | SHP2 signaling |
| 0.1 | 1.7 | PID GMCSF PATHWAY | GMCSF-mediated signaling events |
| 0.1 | 2.7 | PID IL12 2PATHWAY | IL12-mediated signaling events |
| 0.1 | 2.2 | PID CD40 PATHWAY | CD40/CD40L signaling |
| 0.1 | 1.6 | PID TXA2PATHWAY | Thromboxane A2 receptor signaling |
| 0.1 | 0.7 | PID IL23 PATHWAY | IL23-mediated signaling events |
| 0.1 | 1.9 | ST GRANULE CELL SURVIVAL PATHWAY | Granule Cell Survival Pathway is a specific case of more general PAC1 Receptor Pathway. |
| 0.0 | 1.3 | PID TOLL ENDOGENOUS PATHWAY | Endogenous TLR signaling |
| 0.0 | 1.6 | PID MAPK TRK PATHWAY | Trk receptor signaling mediated by the MAPK pathway |
| 0.0 | 1.9 | NABA PROTEOGLYCANS | Genes encoding proteoglycans |
| 0.0 | 6.8 | NABA ECM AFFILIATED | Genes encoding proteins affiliated structurally or functionally to extracellular matrix proteins |
| 0.0 | 0.8 | PID CONE PATHWAY | Visual signal transduction: Cones |
| 0.0 | 8.9 | NABA ECM REGULATORS | Genes encoding enzymes and their regulators involved in the remodeling of the extracellular matrix |
| 0.0 | 1.2 | PID ANGIOPOIETIN RECEPTOR PATHWAY | Angiopoietin receptor Tie2-mediated signaling |
| 0.0 | 0.6 | PID BETA CATENIN DEG PATHWAY | Degradation of beta catenin |
| 0.0 | 1.4 | PID DELTA NP63 PATHWAY | Validated transcriptional targets of deltaNp63 isoforms |
| 0.0 | 0.6 | PID RAC1 PATHWAY | RAC1 signaling pathway |
| 0.0 | 0.6 | PID ENDOTHELIN PATHWAY | Endothelins |
| 0.0 | 0.7 | PID REG GR PATHWAY | Glucocorticoid receptor regulatory network |
| 0.0 | 0.6 | PID FOXM1 PATHWAY | FOXM1 transcription factor network |
| 0.0 | 0.4 | PID AVB3 INTEGRIN PATHWAY | Integrins in angiogenesis |
| 0.0 | 1.4 | PID AR PATHWAY | Coregulation of Androgen receptor activity |
Gene overrepresentation in curated gene sets: REACTOME pathways category:
| Log-likelihood per target | Total log-likelihood | Term | Description |
|---|---|---|---|
| 1.8 | 20.0 | REACTOME ENDOSOMAL VACUOLAR PATHWAY | Genes involved in Endosomal/Vacuolar pathway |
| 1.3 | 27.2 | REACTOME TRANSLOCATION OF ZAP 70 TO IMMUNOLOGICAL SYNAPSE | Genes involved in Translocation of ZAP-70 to Immunological synapse |
| 0.5 | 5.7 | REACTOME NFKB IS ACTIVATED AND SIGNALS SURVIVAL | Genes involved in NF-kB is activated and signals survival |
| 0.5 | 8.4 | REACTOME IL 6 SIGNALING | Genes involved in Interleukin-6 signaling |
| 0.5 | 8.2 | REACTOME PLATELET ADHESION TO EXPOSED COLLAGEN | Genes involved in Platelet Adhesion to exposed collagen |
| 0.4 | 20.8 | REACTOME NOD1 2 SIGNALING PATHWAY | Genes involved in NOD1/2 Signaling Pathway |
| 0.4 | 2.8 | REACTOME PD1 SIGNALING | Genes involved in PD-1 signaling |
| 0.4 | 4.4 | REACTOME NRIF SIGNALS CELL DEATH FROM THE NUCLEUS | Genes involved in NRIF signals cell death from the nucleus |
| 0.3 | 5.5 | REACTOME FANCONI ANEMIA PATHWAY | Genes involved in Fanconi Anemia pathway |
| 0.2 | 4.5 | REACTOME TAK1 ACTIVATES NFKB BY PHOSPHORYLATION AND ACTIVATION OF IKKS COMPLEX | Genes involved in TAK1 activates NFkB by phosphorylation and activation of IKKs complex |
| 0.2 | 16.4 | REACTOME CHEMOKINE RECEPTORS BIND CHEMOKINES | Genes involved in Chemokine receptors bind chemokines |
| 0.2 | 7.3 | REACTOME CASPASE MEDIATED CLEAVAGE OF CYTOSKELETAL PROTEINS | Genes involved in Caspase-mediated cleavage of cytoskeletal proteins |
| 0.2 | 2.5 | REACTOME THE ACTIVATION OF ARYLSULFATASES | Genes involved in The activation of arylsulfatases |
| 0.2 | 1.1 | REACTOME TRYPTOPHAN CATABOLISM | Genes involved in Tryptophan catabolism |
| 0.2 | 6.3 | REACTOME GPVI MEDIATED ACTIVATION CASCADE | Genes involved in GPVI-mediated activation cascade |
| 0.2 | 1.9 | REACTOME REGULATION OF IFNG SIGNALING | Genes involved in Regulation of IFNG signaling |
| 0.2 | 3.4 | REACTOME FACILITATIVE NA INDEPENDENT GLUCOSE TRANSPORTERS | Genes involved in Facilitative Na+-independent glucose transporters |
| 0.2 | 6.6 | REACTOME ANTIGEN ACTIVATES B CELL RECEPTOR LEADING TO GENERATION OF SECOND MESSENGERS | Genes involved in Antigen Activates B Cell Receptor Leading to Generation of Second Messengers |
| 0.2 | 5.9 | REACTOME TIGHT JUNCTION INTERACTIONS | Genes involved in Tight junction interactions |
| 0.1 | 1.8 | REACTOME ACTIVATION OF IRF3 IRF7 MEDIATED BY TBK1 IKK EPSILON | Genes involved in Activation of IRF3/IRF7 mediated by TBK1/IKK epsilon |
| 0.1 | 3.3 | REACTOME G BETA GAMMA SIGNALLING THROUGH PLC BETA | Genes involved in G beta:gamma signalling through PLC beta |
| 0.1 | 3.1 | REACTOME CRMPS IN SEMA3A SIGNALING | Genes involved in CRMPs in Sema3A signaling |
| 0.1 | 1.6 | REACTOME PROSTANOID LIGAND RECEPTORS | Genes involved in Prostanoid ligand receptors |
| 0.1 | 2.5 | REACTOME OTHER SEMAPHORIN INTERACTIONS | Genes involved in Other semaphorin interactions |
| 0.1 | 9.3 | REACTOME ACTIVATION OF NF KAPPAB IN B CELLS | Genes involved in Activation of NF-kappaB in B Cells |
| 0.1 | 2.7 | REACTOME CYTOSOLIC SULFONATION OF SMALL MOLECULES | Genes involved in Cytosolic sulfonation of small molecules |
| 0.1 | 2.8 | REACTOME CS DS DEGRADATION | Genes involved in CS/DS degradation |
| 0.1 | 9.0 | REACTOME INTERFERON ALPHA BETA SIGNALING | Genes involved in Interferon alpha/beta signaling |
| 0.1 | 3.3 | REACTOME TRANSCRIPTIONAL REGULATION OF WHITE ADIPOCYTE DIFFERENTIATION | Genes involved in Transcriptional Regulation of White Adipocyte Differentiation |
| 0.1 | 1.9 | REACTOME IL RECEPTOR SHC SIGNALING | Genes involved in Interleukin receptor SHC signaling |
| 0.1 | 11.3 | REACTOME MHC CLASS II ANTIGEN PRESENTATION | Genes involved in MHC class II antigen presentation |
| 0.1 | 6.3 | REACTOME G ALPHA1213 SIGNALLING EVENTS | Genes involved in G alpha (12/13) signalling events |
| 0.1 | 2.9 | REACTOME SYNTHESIS OF PIPS AT THE PLASMA MEMBRANE | Genes involved in Synthesis of PIPs at the plasma membrane |
| 0.1 | 1.8 | REACTOME AMINE DERIVED HORMONES | Genes involved in Amine-derived hormones |
| 0.1 | 5.4 | REACTOME COLLAGEN FORMATION | Genes involved in Collagen formation |
| 0.1 | 1.4 | REACTOME ACYL CHAIN REMODELLING OF PI | Genes involved in Acyl chain remodelling of PI |
| 0.1 | 1.8 | REACTOME ENOS ACTIVATION AND REGULATION | Genes involved in eNOS activation and regulation |
| 0.1 | 2.2 | REACTOME GLUTAMATE NEUROTRANSMITTER RELEASE CYCLE | Genes involved in Glutamate Neurotransmitter Release Cycle |
| 0.1 | 2.8 | REACTOME TRANSPORT OF VITAMINS NUCLEOSIDES AND RELATED MOLECULES | Genes involved in Transport of vitamins, nucleosides, and related molecules |
| 0.1 | 0.8 | REACTOME PASSIVE TRANSPORT BY AQUAPORINS | Genes involved in Passive Transport by Aquaporins |
| 0.1 | 1.6 | REACTOME REGULATION OF COMPLEMENT CASCADE | Genes involved in Regulation of Complement cascade |
| 0.1 | 1.3 | REACTOME INHIBITION OF VOLTAGE GATED CA2 CHANNELS VIA GBETA GAMMA SUBUNITS | Genes involved in Inhibition of voltage gated Ca2+ channels via Gbeta/gamma subunits |
| 0.1 | 1.7 | REACTOME ANTIGEN PROCESSING CROSS PRESENTATION | Genes involved in Antigen processing-Cross presentation |
| 0.0 | 0.4 | REACTOME COMMON PATHWAY | Genes involved in Common Pathway |
| 0.0 | 0.5 | REACTOME ANDROGEN BIOSYNTHESIS | Genes involved in Androgen biosynthesis |
| 0.0 | 0.7 | REACTOME REGULATION OF RHEB GTPASE ACTIVITY BY AMPK | Genes involved in Regulation of Rheb GTPase activity by AMPK |
| 0.0 | 0.6 | REACTOME INHIBITION OF REPLICATION INITIATION OF DAMAGED DNA BY RB1 E2F1 | Genes involved in Inhibition of replication initiation of damaged DNA by RB1/E2F1 |
| 0.0 | 0.9 | REACTOME PURINE SALVAGE | Genes involved in Purine salvage |
| 0.0 | 0.7 | REACTOME XENOBIOTICS | Genes involved in Xenobiotics |
| 0.0 | 1.1 | REACTOME AMINO ACID TRANSPORT ACROSS THE PLASMA MEMBRANE | Genes involved in Amino acid transport across the plasma membrane |
| 0.0 | 0.8 | REACTOME REGULATION OF INSULIN LIKE GROWTH FACTOR IGF ACTIVITY BY INSULIN LIKE GROWTH FACTOR BINDING PROTEINS IGFBPS | Genes involved in Regulation of Insulin-like Growth Factor (IGF) Activity by Insulin-like Growth Factor Binding Proteins (IGFBPs) |
| 0.0 | 1.0 | REACTOME N GLYCAN ANTENNAE ELONGATION IN THE MEDIAL TRANS GOLGI | Genes involved in N-glycan antennae elongation in the medial/trans-Golgi |
| 0.0 | 3.1 | REACTOME CELL SURFACE INTERACTIONS AT THE VASCULAR WALL | Genes involved in Cell surface interactions at the vascular wall |
| 0.0 | 1.2 | REACTOME APOPTOTIC CLEAVAGE OF CELLULAR PROTEINS | Genes involved in Apoptotic cleavage of cellular proteins |
| 0.0 | 1.6 | REACTOME MYOGENESIS | Genes involved in Myogenesis |
| 0.0 | 1.8 | REACTOME PHASE1 FUNCTIONALIZATION OF COMPOUNDS | Genes involved in Phase 1 - Functionalization of compounds |
| 0.0 | 1.6 | REACTOME STRIATED MUSCLE CONTRACTION | Genes involved in Striated Muscle Contraction |
| 0.0 | 0.6 | REACTOME SIGNALING BY HIPPO | Genes involved in Signaling by Hippo |
| 0.0 | 0.3 | REACTOME G ALPHA Z SIGNALLING EVENTS | Genes involved in G alpha (z) signalling events |
| 0.0 | 0.2 | REACTOME G PROTEIN ACTIVATION | Genes involved in G-protein activation |
| 0.0 | 0.4 | REACTOME PEROXISOMAL LIPID METABOLISM | Genes involved in Peroxisomal lipid metabolism |
| 0.0 | 0.2 | REACTOME MITOCHONDRIAL TRNA AMINOACYLATION | Genes involved in Mitochondrial tRNA aminoacylation |
| 0.0 | 0.6 | REACTOME NCAM1 INTERACTIONS | Genes involved in NCAM1 interactions |
| 0.0 | 1.1 | REACTOME POTASSIUM CHANNELS | Genes involved in Potassium Channels |
| 0.0 | 1.7 | REACTOME G ALPHA S SIGNALLING EVENTS | Genes involved in G alpha (s) signalling events |
| 0.0 | 0.6 | REACTOME PEPTIDE LIGAND BINDING RECEPTORS | Genes involved in Peptide ligand-binding receptors |