Project
GNF SymAtlas + NCI-60 cancer cell lines, human (Su, 2004; Ross, 2000)
Navigation
Downloads
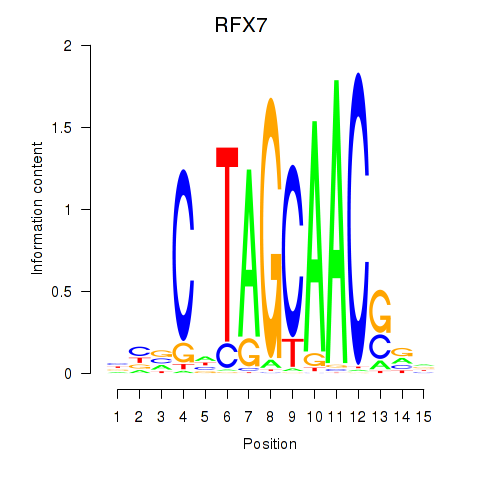
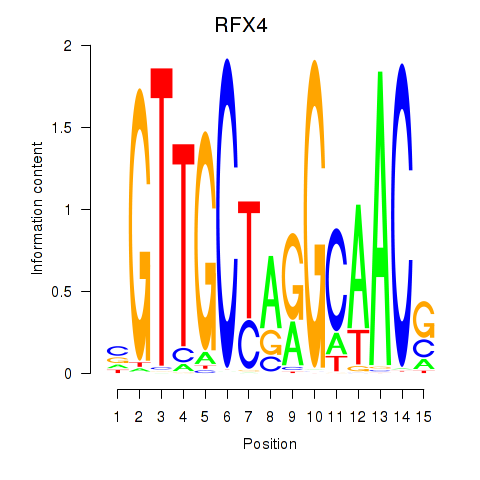
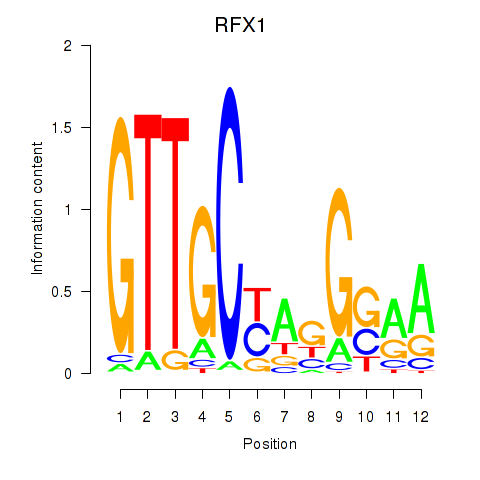
Results for RFX7_RFX4_RFX1
Z-value: 2.90
Motif logo
Transcription factors associated with RFX7_RFX4_RFX1
| Gene Symbol | Gene ID | Gene Info |
|---|---|---|
|
RFX7
|
ENSG00000181827.16 | RFX7 |
|
RFX4
|
ENSG00000111783.13 | RFX4 |
|
RFX1
|
ENSG00000132005.9 | RFX1 |
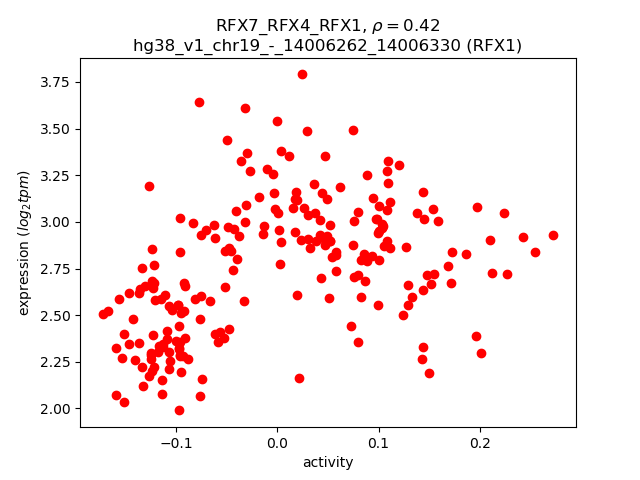
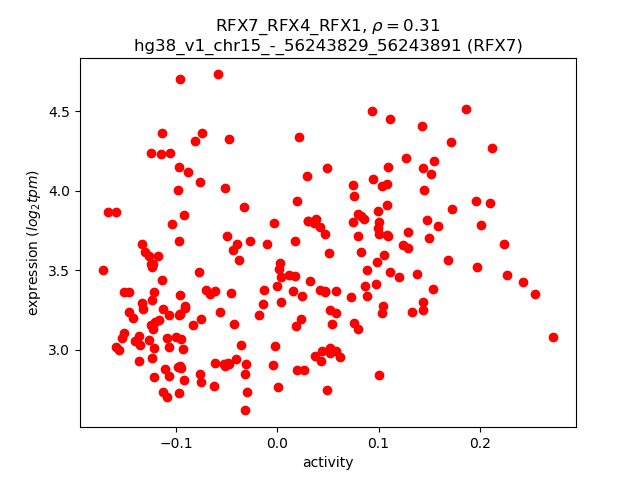
Activity-expression correlation:
| Gene | Promoter | Pearson corr. coef. | P-value | Plot |
|---|---|---|---|---|
| RFX1 | hg38_v1_chr19_-_14006262_14006330 | 0.42 | 9.6e-11 | Click! |
| RFX7 | hg38_v1_chr15_-_56243829_56243891, hg38_v1_chr15_-_56245074_56245088 | 0.31 | 2.2e-06 | Click! |
Activity profile of RFX7_RFX4_RFX1 motif
Sorted Z-values of RFX7_RFX4_RFX1 motif
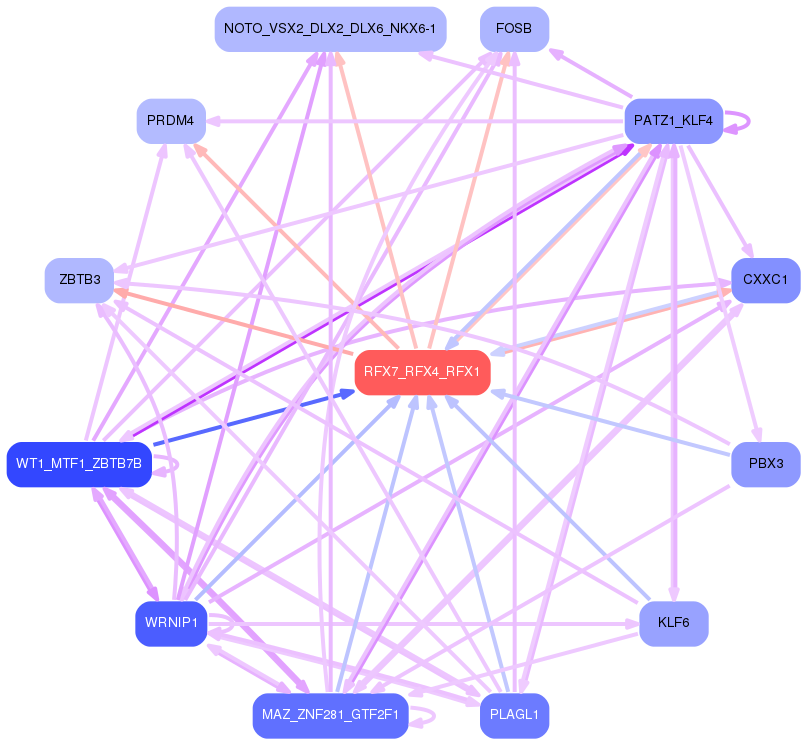
Network of associatons between targets according to the STRING database.

First level regulatory network of RFX7_RFX4_RFX1
Gene Ontology Analysis
Gene overrepresentation in biological process category:
| Log-likelihood per target | Total log-likelihood | Term | Description |
|---|---|---|---|
| 81.3 | 325.3 | GO:0060825 | fibroblast growth factor receptor signaling pathway involved in neural plate anterior/posterior pattern formation(GO:0060825) regulation of neural crest formation(GO:0090299) negative regulation of neural crest formation(GO:0090301) regulation of fibroblast growth factor receptor signaling pathway involved in neural plate anterior/posterior pattern formation(GO:2000313) negative regulation of fibroblast growth factor receptor signaling pathway involved in neural plate anterior/posterior pattern formation(GO:2000314) |
| 19.0 | 114.2 | GO:0035617 | stress granule disassembly(GO:0035617) |
| 17.8 | 71.2 | GO:0080154 | regulation of fertilization(GO:0080154) |
| 15.5 | 294.5 | GO:0019614 | catechol-containing compound catabolic process(GO:0019614) catecholamine catabolic process(GO:0042424) |
| 14.0 | 83.9 | GO:0070829 | response to vitamin B2(GO:0033274) heterochromatin maintenance(GO:0070829) |
| 13.7 | 41.2 | GO:0018307 | tRNA wobble position uridine thiolation(GO:0002143) enzyme active site formation(GO:0018307) |
| 13.5 | 40.4 | GO:1990168 | protein K33-linked deubiquitination(GO:1990168) |
| 13.2 | 39.7 | GO:2000777 | positive regulation of oocyte maturation(GO:1900195) negative regulation of NLRP3 inflammasome complex assembly(GO:1900226) positive regulation of proteasomal ubiquitin-dependent protein catabolic process involved in cellular response to hypoxia(GO:2000777) |
| 13.2 | 263.4 | GO:0043485 | endosome to melanosome transport(GO:0035646) endosome to pigment granule transport(GO:0043485) pigment granule maturation(GO:0048757) |
| 11.4 | 45.7 | GO:1900169 | regulation of glucocorticoid mediated signaling pathway(GO:1900169) |
| 11.2 | 33.5 | GO:0055048 | regulation of spindle elongation(GO:0032887) regulation of mitotic spindle elongation(GO:0032888) anastral spindle assembly(GO:0055048) protein localization to spindle pole body(GO:0071988) regulation of protein localization to spindle pole body(GO:1902363) positive regulation of protein localization to spindle pole body(GO:1902365) positive regulation of mitotic spindle elongation(GO:1902846) |
| 11.1 | 33.2 | GO:1904049 | negative regulation of spontaneous neurotransmitter secretion(GO:1904049) |
| 10.9 | 32.6 | GO:0016476 | regulation of embryonic cell shape(GO:0016476) glomerular visceral epithelial cell migration(GO:0090521) |
| 10.5 | 31.4 | GO:0006683 | galactosylceramide catabolic process(GO:0006683) |
| 10.3 | 31.0 | GO:0050760 | negative regulation of thymidylate synthase biosynthetic process(GO:0050760) |
| 9.6 | 48.0 | GO:0008063 | Toll signaling pathway(GO:0008063) |
| 8.4 | 33.6 | GO:0035610 | protein side chain deglutamylation(GO:0035610) |
| 7.9 | 165.5 | GO:0070286 | axonemal dynein complex assembly(GO:0070286) |
| 7.5 | 52.7 | GO:0051013 | microtubule severing(GO:0051013) |
| 7.2 | 21.5 | GO:1904491 | protein localization to ciliary transition zone(GO:1904491) |
| 7.0 | 20.9 | GO:0098937 | dendritic transport(GO:0098935) anterograde dendritic transport(GO:0098937) |
| 6.9 | 41.4 | GO:0033133 | positive regulation of glucokinase activity(GO:0033133) |
| 6.8 | 121.7 | GO:0010826 | negative regulation of centrosome duplication(GO:0010826) |
| 6.4 | 19.1 | GO:0051040 | regulation of calcium-independent cell-cell adhesion(GO:0051040) |
| 5.9 | 71.0 | GO:0003351 | epithelial cilium movement(GO:0003351) |
| 5.8 | 58.2 | GO:1901538 | DNA methylation involved in embryo development(GO:0043045) changes to DNA methylation involved in embryo development(GO:1901538) |
| 5.1 | 46.1 | GO:2000286 | receptor internalization involved in canonical Wnt signaling pathway(GO:2000286) |
| 4.8 | 14.5 | GO:1903568 | negative regulation of protein localization to cilium(GO:1903565) regulation of protein localization to ciliary membrane(GO:1903567) negative regulation of protein localization to ciliary membrane(GO:1903568) |
| 4.8 | 19.3 | GO:0018095 | protein polyglutamylation(GO:0018095) |
| 4.6 | 18.4 | GO:0061511 | centriole elongation(GO:0061511) |
| 4.0 | 12.1 | GO:0044565 | dendritic cell proliferation(GO:0044565) |
| 3.9 | 35.5 | GO:1904903 | ESCRT complex disassembly(GO:1904896) ESCRT III complex disassembly(GO:1904903) |
| 3.8 | 3.8 | GO:0061551 | trigeminal ganglion development(GO:0061551) |
| 3.6 | 14.3 | GO:1905224 | clathrin-coated pit assembly(GO:1905224) |
| 3.6 | 10.7 | GO:0045643 | regulation of eosinophil differentiation(GO:0045643) positive regulation of eosinophil differentiation(GO:0045645) |
| 3.3 | 9.9 | GO:1905154 | negative regulation of synaptic vesicle recycling(GO:1903422) negative regulation of membrane invagination(GO:1905154) |
| 3.3 | 9.8 | GO:1903538 | meiotic spindle elongation(GO:0051232) meiotic cell cycle process involved in oocyte maturation(GO:1903537) regulation of meiotic cell cycle process involved in oocyte maturation(GO:1903538) |
| 3.1 | 9.4 | GO:1903033 | regulation of microtubule plus-end binding(GO:1903031) positive regulation of microtubule plus-end binding(GO:1903033) |
| 2.8 | 8.3 | GO:0002581 | negative regulation of antigen processing and presentation of peptide or polysaccharide antigen via MHC class II(GO:0002581) |
| 2.7 | 27.1 | GO:0048102 | autophagic cell death(GO:0048102) |
| 2.7 | 37.6 | GO:0007175 | negative regulation of epidermal growth factor-activated receptor activity(GO:0007175) |
| 2.6 | 15.3 | GO:0016926 | protein desumoylation(GO:0016926) |
| 2.5 | 39.5 | GO:0035020 | regulation of Rac protein signal transduction(GO:0035020) |
| 2.4 | 7.3 | GO:0071883 | activation of MAPK activity by adrenergic receptor signaling pathway(GO:0071883) |
| 2.4 | 7.1 | GO:0006106 | fumarate metabolic process(GO:0006106) aspartate catabolic process(GO:0006533) |
| 2.3 | 27.6 | GO:0051581 | negative regulation of neurotransmitter uptake(GO:0051581) regulation of serotonin uptake(GO:0051611) negative regulation of serotonin uptake(GO:0051612) |
| 2.2 | 11.2 | GO:2001181 | positive regulation of interleukin-10 secretion(GO:2001181) |
| 2.2 | 6.7 | GO:1904580 | regulation of intracellular mRNA localization(GO:1904580) positive regulation of intracellular mRNA localization(GO:1904582) |
| 2.2 | 6.6 | GO:1900425 | negative regulation of defense response to bacterium(GO:1900425) |
| 2.1 | 6.4 | GO:0039023 | pronephric nephron morphogenesis(GO:0039007) pronephric nephron tubule morphogenesis(GO:0039008) pronephric duct development(GO:0039022) pronephric duct morphogenesis(GO:0039023) Kupffer's vesicle development(GO:0070121) |
| 2.1 | 8.4 | GO:2000639 | regulation of SREBP signaling pathway(GO:2000638) negative regulation of SREBP signaling pathway(GO:2000639) |
| 2.0 | 14.2 | GO:0042797 | 5S class rRNA transcription from RNA polymerase III type 1 promoter(GO:0042791) tRNA transcription from RNA polymerase III promoter(GO:0042797) |
| 2.0 | 24.0 | GO:0097113 | AMPA glutamate receptor clustering(GO:0097113) glutamate receptor clustering(GO:0097688) |
| 2.0 | 7.9 | GO:0071918 | urea transmembrane transport(GO:0071918) |
| 1.9 | 13.5 | GO:0035845 | photoreceptor cell outer segment organization(GO:0035845) |
| 1.9 | 15.4 | GO:0006659 | phosphatidylserine biosynthetic process(GO:0006659) |
| 1.9 | 28.4 | GO:0035082 | axoneme assembly(GO:0035082) |
| 1.8 | 5.5 | GO:0090038 | negative regulation of protein kinase C signaling(GO:0090038) |
| 1.8 | 14.5 | GO:1902412 | regulation of mitotic cytokinesis(GO:1902412) |
| 1.8 | 19.8 | GO:0034983 | peptidyl-lysine deacetylation(GO:0034983) |
| 1.8 | 22.8 | GO:0090043 | regulation of tubulin deacetylation(GO:0090043) |
| 1.7 | 15.6 | GO:0098535 | de novo centriole assembly(GO:0098535) |
| 1.7 | 6.9 | GO:0098904 | regulation of AV node cell action potential(GO:0098904) |
| 1.7 | 39.0 | GO:0031293 | membrane protein intracellular domain proteolysis(GO:0031293) |
| 1.7 | 16.9 | GO:2001106 | regulation of Rho guanyl-nucleotide exchange factor activity(GO:2001106) |
| 1.6 | 4.9 | GO:0043553 | negative regulation of phosphatidylinositol 3-kinase activity(GO:0043553) |
| 1.6 | 14.5 | GO:0021888 | hypothalamus gonadotrophin-releasing hormone neuron differentiation(GO:0021886) hypothalamus gonadotrophin-releasing hormone neuron development(GO:0021888) fat pad development(GO:0060613) positive regulation of intrinsic apoptotic signaling pathway by p53 class mediator(GO:1902255) |
| 1.6 | 71.3 | GO:0035735 | intraciliary transport involved in cilium morphogenesis(GO:0035735) |
| 1.6 | 9.4 | GO:0060414 | aorta smooth muscle tissue morphogenesis(GO:0060414) |
| 1.6 | 43.8 | GO:0032012 | regulation of ARF protein signal transduction(GO:0032012) |
| 1.6 | 63.9 | GO:0007019 | microtubule depolymerization(GO:0007019) |
| 1.5 | 6.1 | GO:0072092 | ureteric bud invasion(GO:0072092) |
| 1.5 | 43.7 | GO:0035428 | hexose transmembrane transport(GO:0035428) glucose transmembrane transport(GO:1904659) |
| 1.5 | 4.5 | GO:0061074 | regulation of neural retina development(GO:0061074) regulation of retina development in camera-type eye(GO:1902866) |
| 1.5 | 4.5 | GO:0036304 | umbilical cord morphogenesis(GO:0036304) umbilical cord development(GO:0061027) |
| 1.4 | 15.4 | GO:0098789 | pre-mRNA cleavage required for polyadenylation(GO:0098789) |
| 1.4 | 4.1 | GO:0030573 | bile acid catabolic process(GO:0030573) |
| 1.4 | 1.4 | GO:0003341 | cilium movement(GO:0003341) |
| 1.4 | 4.1 | GO:1903644 | regulation of chaperone-mediated protein folding(GO:1903644) |
| 1.4 | 9.5 | GO:0001539 | cilium or flagellum-dependent cell motility(GO:0001539) |
| 1.3 | 24.9 | GO:1901663 | ubiquinone biosynthetic process(GO:0006744) quinone biosynthetic process(GO:1901663) |
| 1.3 | 10.4 | GO:2000601 | positive regulation of Arp2/3 complex-mediated actin nucleation(GO:2000601) |
| 1.3 | 3.9 | GO:0038162 | erythropoietin-mediated signaling pathway(GO:0038162) |
| 1.3 | 3.8 | GO:0006391 | transcription initiation from mitochondrial promoter(GO:0006391) |
| 1.2 | 48.0 | GO:0060612 | adipose tissue development(GO:0060612) |
| 1.2 | 8.4 | GO:0043985 | histone H4-R3 methylation(GO:0043985) |
| 1.2 | 18.9 | GO:0010839 | negative regulation of keratinocyte proliferation(GO:0010839) |
| 1.2 | 4.7 | GO:0006287 | base-excision repair, gap-filling(GO:0006287) |
| 1.1 | 14.0 | GO:1901978 | positive regulation of cell cycle checkpoint(GO:1901978) |
| 1.0 | 11.5 | GO:0071372 | cellular response to follicle-stimulating hormone stimulus(GO:0071372) |
| 1.0 | 11.4 | GO:0032074 | negative regulation of nuclease activity(GO:0032074) |
| 1.0 | 11.3 | GO:0010499 | proteasomal ubiquitin-independent protein catabolic process(GO:0010499) |
| 1.0 | 38.0 | GO:0097120 | receptor localization to synapse(GO:0097120) |
| 1.0 | 16.4 | GO:0099517 | anterograde synaptic vesicle transport(GO:0048490) synaptic vesicle cytoskeletal transport(GO:0099514) synaptic vesicle transport along microtubule(GO:0099517) |
| 1.0 | 8.1 | GO:1903546 | protein localization to photoreceptor outer segment(GO:1903546) |
| 1.0 | 8.1 | GO:1902474 | positive regulation of protein localization to synapse(GO:1902474) |
| 1.0 | 4.0 | GO:0050893 | sensory processing(GO:0050893) |
| 1.0 | 16.7 | GO:2001241 | positive regulation of extrinsic apoptotic signaling pathway in absence of ligand(GO:2001241) |
| 0.9 | 3.7 | GO:0008626 | granzyme-mediated apoptotic signaling pathway(GO:0008626) |
| 0.9 | 2.7 | GO:0014740 | negative regulation of muscle hyperplasia(GO:0014740) |
| 0.9 | 5.4 | GO:0007341 | penetration of zona pellucida(GO:0007341) spermatogenesis, exchange of chromosomal proteins(GO:0035093) |
| 0.9 | 24.1 | GO:0006884 | cell volume homeostasis(GO:0006884) |
| 0.9 | 4.4 | GO:0070092 | regulation of glucagon secretion(GO:0070092) |
| 0.9 | 3.5 | GO:0006288 | base-excision repair, DNA ligation(GO:0006288) negative regulation of protein ADP-ribosylation(GO:0010836) |
| 0.9 | 30.6 | GO:0030517 | negative regulation of axon extension(GO:0030517) |
| 0.9 | 13.8 | GO:0035563 | positive regulation of chromatin binding(GO:0035563) |
| 0.9 | 2.6 | GO:0044805 | late nucleophagy(GO:0044805) |
| 0.9 | 3.4 | GO:0010793 | regulation of mRNA export from nucleus(GO:0010793) |
| 0.8 | 10.1 | GO:1900227 | positive regulation of NLRP3 inflammasome complex assembly(GO:1900227) |
| 0.8 | 8.3 | GO:0015871 | choline transport(GO:0015871) |
| 0.8 | 21.4 | GO:0045662 | negative regulation of myoblast differentiation(GO:0045662) |
| 0.8 | 3.2 | GO:0038098 | sequestering of BMP from receptor via BMP binding(GO:0038098) |
| 0.8 | 7.2 | GO:1905232 | cellular response to L-glutamate(GO:1905232) |
| 0.8 | 2.4 | GO:0051026 | chiasma assembly(GO:0051026) |
| 0.8 | 2.3 | GO:0090187 | positive regulation of pancreatic juice secretion(GO:0090187) |
| 0.8 | 6.1 | GO:0032510 | endosome to lysosome transport via multivesicular body sorting pathway(GO:0032510) |
| 0.7 | 0.7 | GO:0019918 | peptidyl-arginine methylation, to symmetrical-dimethyl arginine(GO:0019918) |
| 0.7 | 10.0 | GO:0007258 | JUN phosphorylation(GO:0007258) |
| 0.7 | 4.0 | GO:0051533 | positive regulation of NFAT protein import into nucleus(GO:0051533) |
| 0.6 | 6.8 | GO:0030321 | transepithelial chloride transport(GO:0030321) |
| 0.6 | 6.8 | GO:0051967 | negative regulation of synaptic transmission, glutamatergic(GO:0051967) |
| 0.6 | 10.4 | GO:0007196 | adenylate cyclase-inhibiting G-protein coupled glutamate receptor signaling pathway(GO:0007196) |
| 0.6 | 38.8 | GO:0043268 | positive regulation of potassium ion transport(GO:0043268) |
| 0.6 | 21.9 | GO:0010738 | regulation of protein kinase A signaling(GO:0010738) |
| 0.6 | 8.8 | GO:0035970 | peptidyl-threonine dephosphorylation(GO:0035970) |
| 0.6 | 3.5 | GO:0051958 | methotrexate transport(GO:0051958) reduced folate transmembrane transport(GO:0098838) |
| 0.6 | 1.7 | GO:0099404 | negative regulation of maintenance of sister chromatid cohesion(GO:0034092) negative regulation of maintenance of mitotic sister chromatid cohesion(GO:0034183) maintenance of mitotic sister chromatid cohesion, telomeric(GO:0099403) mitotic sister chromatid cohesion, telomeric(GO:0099404) regulation of maintenance of mitotic sister chromatid cohesion, telomeric(GO:1904907) negative regulation of maintenance of mitotic sister chromatid cohesion, telomeric(GO:1904908) |
| 0.6 | 17.9 | GO:0015695 | organic cation transport(GO:0015695) |
| 0.6 | 6.3 | GO:0007099 | centriole replication(GO:0007099) centriole assembly(GO:0098534) |
| 0.6 | 4.0 | GO:1902731 | ovarian cumulus expansion(GO:0001550) fused antrum stage(GO:0048165) negative regulation of chondrocyte proliferation(GO:1902731) |
| 0.6 | 2.8 | GO:0051835 | positive regulation of synapse structural plasticity(GO:0051835) |
| 0.5 | 3.2 | GO:0006548 | histamine metabolic process(GO:0001692) histidine catabolic process(GO:0006548) imidazole-containing compound catabolic process(GO:0052805) |
| 0.5 | 2.2 | GO:0009957 | epidermal cell fate specification(GO:0009957) |
| 0.5 | 3.2 | GO:0036101 | leukotriene catabolic process(GO:0036100) leukotriene B4 catabolic process(GO:0036101) leukotriene B4 metabolic process(GO:0036102) icosanoid catabolic process(GO:1901523) fatty acid derivative catabolic process(GO:1901569) |
| 0.5 | 2.1 | GO:0045144 | meiotic sister chromatid segregation(GO:0045144) |
| 0.5 | 1.6 | GO:0043605 | antibiotic metabolic process(GO:0016999) cellular amide catabolic process(GO:0043605) |
| 0.5 | 9.3 | GO:0045724 | positive regulation of cilium assembly(GO:0045724) |
| 0.5 | 3.6 | GO:0061088 | regulation of sequestering of zinc ion(GO:0061088) |
| 0.5 | 1.5 | GO:0002314 | germinal center B cell differentiation(GO:0002314) |
| 0.5 | 13.6 | GO:0008045 | motor neuron axon guidance(GO:0008045) |
| 0.5 | 20.8 | GO:1904031 | positive regulation of cyclin-dependent protein kinase activity(GO:1904031) |
| 0.5 | 20.6 | GO:0045839 | negative regulation of mitotic nuclear division(GO:0045839) |
| 0.5 | 1.4 | GO:1900220 | semaphorin-plexin signaling pathway involved in bone trabecula morphogenesis(GO:1900220) |
| 0.5 | 18.5 | GO:0042059 | negative regulation of epidermal growth factor receptor signaling pathway(GO:0042059) |
| 0.5 | 6.8 | GO:0045475 | locomotor rhythm(GO:0045475) |
| 0.5 | 8.1 | GO:0097264 | self proteolysis(GO:0097264) |
| 0.4 | 26.8 | GO:0051865 | protein autoubiquitination(GO:0051865) |
| 0.4 | 7.4 | GO:0006004 | fucose metabolic process(GO:0006004) |
| 0.4 | 7.4 | GO:0090344 | negative regulation of cell aging(GO:0090344) |
| 0.4 | 3.9 | GO:0060267 | positive regulation of respiratory burst(GO:0060267) |
| 0.4 | 22.9 | GO:0071377 | cellular response to glucagon stimulus(GO:0071377) |
| 0.4 | 4.5 | GO:0030916 | otic vesicle formation(GO:0030916) |
| 0.4 | 7.8 | GO:0043508 | negative regulation of JUN kinase activity(GO:0043508) |
| 0.4 | 45.6 | GO:0007286 | spermatid development(GO:0007286) |
| 0.4 | 5.1 | GO:1901750 | leukotriene D4 metabolic process(GO:1901748) leukotriene D4 biosynthetic process(GO:1901750) |
| 0.4 | 5.8 | GO:0002021 | response to dietary excess(GO:0002021) |
| 0.4 | 2.3 | GO:0060154 | cellular process regulating host cell cycle in response to virus(GO:0060154) |
| 0.4 | 8.6 | GO:0031468 | nuclear envelope reassembly(GO:0031468) |
| 0.4 | 2.9 | GO:0043654 | recognition of apoptotic cell(GO:0043654) |
| 0.4 | 1.4 | GO:0044240 | activation of phospholipase A2 activity(GO:0032431) multicellular organism lipid catabolic process(GO:0044240) |
| 0.3 | 6.3 | GO:0001573 | ganglioside metabolic process(GO:0001573) |
| 0.3 | 52.0 | GO:0060271 | cilium morphogenesis(GO:0060271) |
| 0.3 | 4.1 | GO:0042340 | keratan sulfate catabolic process(GO:0042340) |
| 0.3 | 8.8 | GO:0045898 | regulation of RNA polymerase II transcriptional preinitiation complex assembly(GO:0045898) |
| 0.3 | 17.1 | GO:0046949 | fatty-acyl-CoA biosynthetic process(GO:0046949) |
| 0.3 | 8.2 | GO:0030207 | chondroitin sulfate catabolic process(GO:0030207) |
| 0.3 | 10.7 | GO:0048488 | synaptic vesicle endocytosis(GO:0048488) |
| 0.3 | 5.6 | GO:0006688 | glycosphingolipid biosynthetic process(GO:0006688) |
| 0.3 | 3.1 | GO:0015074 | DNA integration(GO:0015074) |
| 0.3 | 1.9 | GO:0002638 | negative regulation of immunoglobulin production(GO:0002638) |
| 0.3 | 11.6 | GO:2000300 | regulation of synaptic vesicle exocytosis(GO:2000300) |
| 0.3 | 1.6 | GO:0009732 | detection of carbohydrate stimulus(GO:0009730) detection of hexose stimulus(GO:0009732) detection of monosaccharide stimulus(GO:0034287) detection of glucose(GO:0051594) |
| 0.3 | 1.6 | GO:1902715 | positive regulation of interferon-gamma secretion(GO:1902715) |
| 0.3 | 24.1 | GO:0038083 | peptidyl-tyrosine autophosphorylation(GO:0038083) |
| 0.3 | 10.6 | GO:0030513 | positive regulation of BMP signaling pathway(GO:0030513) |
| 0.2 | 7.2 | GO:0009083 | branched-chain amino acid catabolic process(GO:0009083) |
| 0.2 | 4.2 | GO:0035411 | catenin import into nucleus(GO:0035411) |
| 0.2 | 2.4 | GO:0031111 | negative regulation of microtubule polymerization or depolymerization(GO:0031111) negative regulation of microtubule polymerization(GO:0031115) |
| 0.2 | 25.2 | GO:0051897 | positive regulation of protein kinase B signaling(GO:0051897) |
| 0.2 | 12.4 | GO:0051568 | histone H3-K4 methylation(GO:0051568) |
| 0.2 | 11.3 | GO:0043666 | regulation of phosphoprotein phosphatase activity(GO:0043666) |
| 0.2 | 4.6 | GO:0051412 | response to corticosterone(GO:0051412) |
| 0.2 | 3.8 | GO:1901889 | negative regulation of focal adhesion assembly(GO:0051895) negative regulation of cell junction assembly(GO:1901889) |
| 0.2 | 2.9 | GO:0050774 | negative regulation of dendrite morphogenesis(GO:0050774) |
| 0.2 | 3.2 | GO:0001759 | organ induction(GO:0001759) |
| 0.2 | 0.6 | GO:0035811 | negative regulation of urine volume(GO:0035811) |
| 0.2 | 13.1 | GO:0051703 | social behavior(GO:0035176) intraspecies interaction between organisms(GO:0051703) |
| 0.2 | 7.4 | GO:0018149 | peptide cross-linking(GO:0018149) |
| 0.2 | 9.6 | GO:0000186 | activation of MAPKK activity(GO:0000186) |
| 0.2 | 2.2 | GO:1903025 | regulation of RNA polymerase II regulatory region sequence-specific DNA binding(GO:1903025) |
| 0.2 | 1.3 | GO:0023021 | termination of signal transduction(GO:0023021) |
| 0.2 | 2.8 | GO:0038092 | nodal signaling pathway(GO:0038092) |
| 0.2 | 5.0 | GO:0048268 | clathrin coat assembly(GO:0048268) |
| 0.2 | 0.2 | GO:0035425 | autocrine signaling(GO:0035425) |
| 0.1 | 4.2 | GO:0031581 | hemidesmosome assembly(GO:0031581) |
| 0.1 | 7.8 | GO:2000649 | regulation of sodium ion transmembrane transporter activity(GO:2000649) |
| 0.1 | 8.5 | GO:1901379 | regulation of potassium ion transmembrane transport(GO:1901379) |
| 0.1 | 6.2 | GO:0006904 | vesicle docking involved in exocytosis(GO:0006904) |
| 0.1 | 3.5 | GO:0007597 | blood coagulation, intrinsic pathway(GO:0007597) |
| 0.1 | 3.7 | GO:0030317 | sperm motility(GO:0030317) |
| 0.1 | 2.4 | GO:0097503 | sialylation(GO:0097503) |
| 0.1 | 2.1 | GO:0003094 | glomerular filtration(GO:0003094) |
| 0.1 | 6.8 | GO:0086010 | membrane depolarization during action potential(GO:0086010) |
| 0.1 | 3.3 | GO:0050855 | regulation of B cell receptor signaling pathway(GO:0050855) |
| 0.1 | 13.6 | GO:0007200 | phospholipase C-activating G-protein coupled receptor signaling pathway(GO:0007200) |
| 0.1 | 12.4 | GO:0050911 | detection of chemical stimulus involved in sensory perception of smell(GO:0050911) |
| 0.1 | 2.9 | GO:0034776 | response to histamine(GO:0034776) cellular response to histamine(GO:0071420) |
| 0.1 | 7.3 | GO:0090630 | activation of GTPase activity(GO:0090630) |
| 0.1 | 2.5 | GO:0042953 | lipoprotein transport(GO:0042953) lipoprotein localization(GO:0044872) |
| 0.1 | 0.4 | GO:0071630 | nucleus-associated proteasomal ubiquitin-dependent protein catabolic process(GO:0071630) |
| 0.1 | 8.1 | GO:0030282 | bone mineralization(GO:0030282) |
| 0.1 | 4.3 | GO:0007193 | adenylate cyclase-inhibiting G-protein coupled receptor signaling pathway(GO:0007193) |
| 0.1 | 3.0 | GO:0045026 | plasma membrane fusion(GO:0045026) |
| 0.1 | 1.3 | GO:0090154 | positive regulation of sphingolipid biosynthetic process(GO:0090154) positive regulation of ceramide biosynthetic process(GO:2000304) |
| 0.1 | 5.3 | GO:0016486 | peptide hormone processing(GO:0016486) |
| 0.1 | 2.5 | GO:0045124 | regulation of bone resorption(GO:0045124) |
| 0.1 | 4.5 | GO:1904837 | beta-catenin-TCF complex assembly(GO:1904837) |
| 0.1 | 0.2 | GO:0031914 | negative regulation of synaptic plasticity(GO:0031914) |
| 0.1 | 3.6 | GO:0007274 | neuromuscular synaptic transmission(GO:0007274) |
| 0.1 | 0.2 | GO:0061051 | positive regulation of cell growth involved in cardiac muscle cell development(GO:0061051) positive regulation of cardiac muscle cell differentiation(GO:2000727) |
| 0.1 | 0.2 | GO:0038043 | interleukin-5-mediated signaling pathway(GO:0038043) |
| 0.1 | 3.0 | GO:0030279 | negative regulation of ossification(GO:0030279) |
| 0.1 | 3.0 | GO:0032418 | lysosome localization(GO:0032418) |
| 0.1 | 8.6 | GO:0007219 | Notch signaling pathway(GO:0007219) |
| 0.1 | 4.9 | GO:0000245 | spliceosomal complex assembly(GO:0000245) |
| 0.1 | 5.0 | GO:0060996 | dendritic spine development(GO:0060996) |
| 0.1 | 3.4 | GO:0008156 | negative regulation of DNA replication(GO:0008156) |
| 0.1 | 4.0 | GO:0071349 | interleukin-12-mediated signaling pathway(GO:0035722) cellular response to interleukin-12(GO:0071349) |
| 0.1 | 1.1 | GO:0050930 | induction of positive chemotaxis(GO:0050930) |
| 0.1 | 2.9 | GO:0048384 | retinoic acid receptor signaling pathway(GO:0048384) |
| 0.0 | 1.7 | GO:0008214 | protein demethylation(GO:0006482) protein dealkylation(GO:0008214) |
| 0.0 | 1.2 | GO:0050919 | negative chemotaxis(GO:0050919) |
| 0.0 | 1.4 | GO:0010107 | potassium ion import(GO:0010107) |
| 0.0 | 4.9 | GO:0019827 | stem cell population maintenance(GO:0019827) maintenance of cell number(GO:0098727) |
| 0.0 | 2.9 | GO:1903955 | positive regulation of protein targeting to mitochondrion(GO:1903955) |
| 0.0 | 0.4 | GO:0070050 | neuron cellular homeostasis(GO:0070050) |
| 0.0 | 0.7 | GO:0032620 | interleukin-17 production(GO:0032620) |
| 0.0 | 3.1 | GO:0070268 | cornification(GO:0070268) |
| 0.0 | 1.7 | GO:0070830 | epithelial cell morphogenesis(GO:0003382) bicellular tight junction assembly(GO:0070830) |
| 0.0 | 0.4 | GO:0090023 | positive regulation of neutrophil chemotaxis(GO:0090023) |
| 0.0 | 1.5 | GO:0051492 | regulation of stress fiber assembly(GO:0051492) |
| 0.0 | 0.1 | GO:0045586 | regulation of gamma-delta T cell differentiation(GO:0045586) |
| 0.0 | 5.7 | GO:0007601 | visual perception(GO:0007601) |
| 0.0 | 1.1 | GO:0018022 | peptidyl-lysine methylation(GO:0018022) |
| 0.0 | 1.2 | GO:0014047 | glutamate secretion(GO:0014047) |
| 0.0 | 2.0 | GO:0044243 | multicellular organism catabolic process(GO:0044243) |
| 0.0 | 19.9 | GO:0000122 | negative regulation of transcription from RNA polymerase II promoter(GO:0000122) |
| 0.0 | 2.7 | GO:0030449 | regulation of complement activation(GO:0030449) regulation of protein activation cascade(GO:2000257) |
| 0.0 | 0.8 | GO:0010923 | negative regulation of phosphatase activity(GO:0010923) |
| 0.0 | 1.2 | GO:0009060 | aerobic respiration(GO:0009060) |
| 0.0 | 1.4 | GO:0006937 | regulation of muscle contraction(GO:0006937) |
| 0.0 | 0.2 | GO:0002437 | inflammatory response to antigenic stimulus(GO:0002437) |
Gene overrepresentation in cellular component category:
| Log-likelihood per target | Total log-likelihood | Term | Description |
|---|---|---|---|
| 12.5 | 150.0 | GO:0005858 | axonemal dynein complex(GO:0005858) |
| 11.2 | 33.5 | GO:0061673 | cortical microtubule(GO:0055028) mitotic spindle astral microtubule(GO:0061673) |
| 8.7 | 164.4 | GO:0036038 | MKS complex(GO:0036038) |
| 7.8 | 39.0 | GO:0071458 | integral component of cytoplasmic side of endoplasmic reticulum membrane(GO:0071458) |
| 5.9 | 41.6 | GO:1990452 | Parkin-FBXW7-Cul1 ubiquitin ligase complex(GO:1990452) |
| 5.5 | 279.8 | GO:0030131 | clathrin adaptor complex(GO:0030131) |
| 5.5 | 32.8 | GO:0002177 | manchette(GO:0002177) |
| 5.2 | 15.6 | GO:0098536 | deuterosome(GO:0098536) |
| 4.7 | 14.0 | GO:0044609 | DBIRD complex(GO:0044609) |
| 4.5 | 27.1 | GO:0097129 | cyclin D2-CDK4 complex(GO:0097129) |
| 4.5 | 13.5 | GO:0017071 | intracellular cyclic nucleotide activated cation channel complex(GO:0017071) |
| 4.4 | 39.7 | GO:0072687 | meiotic spindle(GO:0072687) |
| 3.7 | 47.9 | GO:0060077 | inhibitory synapse(GO:0060077) |
| 3.5 | 31.3 | GO:0044447 | axoneme part(GO:0044447) |
| 3.4 | 31.0 | GO:1990761 | growth cone lamellipodium(GO:1990761) |
| 3.4 | 78.8 | GO:0030992 | intraciliary transport particle B(GO:0030992) |
| 3.3 | 10.0 | GO:0016939 | kinesin II complex(GO:0016939) |
| 2.9 | 214.7 | GO:0036126 | sperm flagellum(GO:0036126) |
| 2.7 | 48.0 | GO:0035631 | CD40 receptor complex(GO:0035631) |
| 2.3 | 11.3 | GO:0005854 | nascent polypeptide-associated complex(GO:0005854) |
| 2.1 | 52.5 | GO:0032391 | photoreceptor connecting cilium(GO:0032391) |
| 2.1 | 6.3 | GO:0034686 | integrin alphav-beta8 complex(GO:0034686) |
| 2.1 | 14.5 | GO:0000235 | astral microtubule(GO:0000235) aster(GO:0005818) |
| 2.0 | 14.2 | GO:0000127 | transcription factor TFIIIC complex(GO:0000127) |
| 2.0 | 79.0 | GO:0034451 | centriolar satellite(GO:0034451) |
| 1.9 | 95.0 | GO:0016235 | aggresome(GO:0016235) |
| 1.8 | 10.7 | GO:1990769 | proximal neuron projection(GO:1990769) |
| 1.8 | 8.9 | GO:0070847 | core mediator complex(GO:0070847) |
| 1.7 | 24.0 | GO:0098839 | postsynaptic density membrane(GO:0098839) |
| 1.5 | 21.2 | GO:0048188 | Set1C/COMPASS complex(GO:0048188) |
| 1.4 | 110.3 | GO:0010494 | cytoplasmic stress granule(GO:0010494) |
| 1.4 | 11.2 | GO:0045179 | apical cortex(GO:0045179) |
| 1.3 | 3.8 | GO:0034464 | BBSome(GO:0034464) |
| 1.3 | 18.8 | GO:0005847 | mRNA cleavage and polyadenylation specificity factor complex(GO:0005847) |
| 1.1 | 10.1 | GO:0097427 | microtubule bundle(GO:0097427) |
| 1.1 | 29.2 | GO:0005682 | U5 snRNP(GO:0005682) |
| 1.0 | 17.0 | GO:0016461 | unconventional myosin complex(GO:0016461) |
| 0.9 | 5.5 | GO:0009331 | glycerol-3-phosphate dehydrogenase complex(GO:0009331) |
| 0.9 | 44.3 | GO:0097014 | axoneme(GO:0005930) ciliary plasm(GO:0097014) |
| 0.9 | 13.9 | GO:0031045 | dense core granule(GO:0031045) |
| 0.8 | 11.8 | GO:0001673 | male germ cell nucleus(GO:0001673) |
| 0.8 | 10.4 | GO:0031209 | SCAR complex(GO:0031209) |
| 0.7 | 8.9 | GO:0031464 | Cul4A-RING E3 ubiquitin ligase complex(GO:0031464) |
| 0.7 | 36.6 | GO:0036064 | ciliary basal body(GO:0036064) |
| 0.7 | 2.1 | GO:0000939 | condensed chromosome inner kinetochore(GO:0000939) |
| 0.6 | 1.7 | GO:0031933 | telomeric heterochromatin(GO:0031933) |
| 0.6 | 7.3 | GO:0016600 | flotillin complex(GO:0016600) |
| 0.5 | 17.3 | GO:0016592 | mediator complex(GO:0016592) |
| 0.5 | 2.5 | GO:0000835 | ER ubiquitin ligase complex(GO:0000835) Hrd1p ubiquitin ligase complex(GO:0000836) |
| 0.5 | 4.0 | GO:0017146 | NMDA selective glutamate receptor complex(GO:0017146) |
| 0.5 | 32.6 | GO:0005834 | heterotrimeric G-protein complex(GO:0005834) |
| 0.5 | 10.2 | GO:0005798 | Golgi-associated vesicle(GO:0005798) |
| 0.4 | 5.3 | GO:0000242 | pericentriolar material(GO:0000242) |
| 0.4 | 3.5 | GO:0070522 | ERCC4-ERCC1 complex(GO:0070522) |
| 0.4 | 77.2 | GO:0030426 | growth cone(GO:0030426) |
| 0.4 | 56.0 | GO:0005884 | actin filament(GO:0005884) |
| 0.4 | 3.4 | GO:0008290 | F-actin capping protein complex(GO:0008290) |
| 0.3 | 5.0 | GO:0033010 | paranodal junction(GO:0033010) |
| 0.3 | 13.2 | GO:0000159 | protein phosphatase type 2A complex(GO:0000159) |
| 0.3 | 22.9 | GO:0008021 | synaptic vesicle(GO:0008021) |
| 0.3 | 71.9 | GO:0005929 | cilium(GO:0005929) |
| 0.3 | 18.3 | GO:0005902 | microvillus(GO:0005902) |
| 0.3 | 87.6 | GO:0045202 | synapse(GO:0045202) |
| 0.3 | 3.5 | GO:0031362 | anchored component of external side of plasma membrane(GO:0031362) |
| 0.3 | 20.0 | GO:0005905 | clathrin-coated pit(GO:0005905) |
| 0.3 | 6.8 | GO:0034707 | chloride channel complex(GO:0034707) |
| 0.3 | 7.4 | GO:0005680 | anaphase-promoting complex(GO:0005680) |
| 0.3 | 26.3 | GO:0031234 | extrinsic component of cytoplasmic side of plasma membrane(GO:0031234) |
| 0.3 | 6.8 | GO:0032839 | dendrite cytoplasm(GO:0032839) |
| 0.3 | 58.2 | GO:0016324 | apical plasma membrane(GO:0016324) |
| 0.2 | 0.7 | GO:0042611 | MHC protein complex(GO:0042611) |
| 0.2 | 119.3 | GO:0010008 | endosome membrane(GO:0010008) |
| 0.2 | 35.3 | GO:0043202 | lysosomal lumen(GO:0043202) |
| 0.2 | 7.2 | GO:0016514 | SWI/SNF complex(GO:0016514) |
| 0.2 | 4.6 | GO:0035371 | microtubule plus-end(GO:0035371) |
| 0.2 | 1.4 | GO:0002116 | semaphorin receptor complex(GO:0002116) |
| 0.2 | 8.7 | GO:0001533 | cornified envelope(GO:0001533) |
| 0.2 | 2.3 | GO:0097136 | Bcl-2 family protein complex(GO:0097136) |
| 0.2 | 302.1 | GO:0042995 | cell projection(GO:0042995) |
| 0.2 | 12.1 | GO:0034705 | voltage-gated potassium channel complex(GO:0008076) potassium channel complex(GO:0034705) |
| 0.2 | 2.4 | GO:0032300 | mismatch repair complex(GO:0032300) |
| 0.1 | 5.0 | GO:0030173 | integral component of Golgi membrane(GO:0030173) |
| 0.1 | 7.8 | GO:0022627 | cytosolic small ribosomal subunit(GO:0022627) |
| 0.1 | 4.2 | GO:0045095 | keratin filament(GO:0045095) |
| 0.1 | 4.1 | GO:0032588 | trans-Golgi network membrane(GO:0032588) |
| 0.1 | 1.7 | GO:0005913 | cell-cell adherens junction(GO:0005913) |
| 0.1 | 1.1 | GO:0033588 | Elongator holoenzyme complex(GO:0033588) |
| 0.1 | 6.1 | GO:0009986 | cell surface(GO:0009986) |
| 0.1 | 6.8 | GO:0036477 | somatodendritic compartment(GO:0036477) |
| 0.1 | 1.4 | GO:0071782 | endoplasmic reticulum tubular network(GO:0071782) |
| 0.1 | 9.1 | GO:0031225 | anchored component of membrane(GO:0031225) |
| 0.1 | 100.3 | GO:0005615 | extracellular space(GO:0005615) |
| 0.1 | 7.3 | GO:0016323 | basolateral plasma membrane(GO:0016323) |
| 0.0 | 0.4 | GO:0098799 | outer mitochondrial membrane protein complex(GO:0098799) |
| 0.0 | 1.4 | GO:0031672 | A band(GO:0031672) |
| 0.0 | 0.6 | GO:0030665 | clathrin-coated vesicle membrane(GO:0030665) |
| 0.0 | 81.0 | GO:0005886 | plasma membrane(GO:0005886) |
| 0.0 | 3.5 | GO:0001650 | fibrillar center(GO:0001650) |
| 0.0 | 2.3 | GO:0005643 | nuclear pore(GO:0005643) |
Gene overrepresentation in molecular function category:
| Log-likelihood per target | Total log-likelihood | Term | Description |
|---|---|---|---|
| 32.7 | 294.5 | GO:0016206 | catechol O-methyltransferase activity(GO:0016206) |
| 14.0 | 83.9 | GO:0004489 | methylenetetrahydrofolate reductase (NAD(P)H) activity(GO:0004489) |
| 13.5 | 40.4 | GO:1904455 | ubiquitin-specific protease activity involved in negative regulation of ERAD pathway(GO:1904455) |
| 13.2 | 39.7 | GO:0034739 | histone deacetylase activity (H4-K16 specific)(GO:0034739) |
| 10.5 | 31.4 | GO:0004336 | galactosylceramidase activity(GO:0004336) |
| 9.8 | 88.0 | GO:0004565 | beta-galactosidase activity(GO:0004565) |
| 8.2 | 41.2 | GO:0004792 | thiosulfate sulfurtransferase activity(GO:0004792) |
| 7.9 | 39.5 | GO:0019912 | cyclin-dependent protein kinase activating kinase activity(GO:0019912) |
| 7.5 | 52.7 | GO:0008568 | microtubule-severing ATPase activity(GO:0008568) |
| 7.1 | 21.2 | GO:0045322 | unmethylated CpG binding(GO:0045322) |
| 6.9 | 41.4 | GO:0003873 | 6-phosphofructo-2-kinase activity(GO:0003873) |
| 6.6 | 132.3 | GO:0045503 | dynein light chain binding(GO:0045503) |
| 5.8 | 29.1 | GO:0070740 | tubulin-glutamic acid ligase activity(GO:0070740) |
| 5.6 | 39.0 | GO:0042500 | aspartic endopeptidase activity, intramembrane cleaving(GO:0042500) |
| 5.4 | 43.0 | GO:0071933 | Arp2/3 complex binding(GO:0071933) |
| 5.3 | 121.7 | GO:0031005 | filamin binding(GO:0031005) |
| 4.2 | 21.1 | GO:0004045 | aminoacyl-tRNA hydrolase activity(GO:0004045) |
| 3.8 | 11.5 | GO:0004421 | hydroxymethylglutaryl-CoA synthase activity(GO:0004421) |
| 3.8 | 38.1 | GO:0051011 | microtubule minus-end binding(GO:0051011) |
| 3.6 | 10.7 | GO:0005137 | interleukin-5 receptor binding(GO:0005137) |
| 3.5 | 10.4 | GO:0001641 | group II metabotropic glutamate receptor activity(GO:0001641) |
| 3.3 | 10.0 | GO:0004618 | phosphoglycerate kinase activity(GO:0004618) |
| 3.3 | 45.7 | GO:0005078 | MAP-kinase scaffold activity(GO:0005078) |
| 3.1 | 40.0 | GO:0070679 | inositol 1,4,5 trisphosphate binding(GO:0070679) |
| 3.0 | 24.0 | GO:0031812 | G-protein coupled nucleotide receptor binding(GO:0031811) P2Y1 nucleotide receptor binding(GO:0031812) |
| 2.9 | 17.3 | GO:0045504 | dynein heavy chain binding(GO:0045504) |
| 2.7 | 13.5 | GO:0005222 | intracellular cAMP activated cation channel activity(GO:0005222) |
| 2.6 | 7.7 | GO:0008321 | Ral guanyl-nucleotide exchange factor activity(GO:0008321) |
| 2.6 | 15.3 | GO:0016929 | SUMO-specific protease activity(GO:0016929) |
| 2.4 | 7.3 | GO:0004938 | alpha2-adrenergic receptor activity(GO:0004938) alpha-2C adrenergic receptor binding(GO:0031696) |
| 2.4 | 9.4 | GO:0004687 | myosin light chain kinase activity(GO:0004687) |
| 2.4 | 7.1 | GO:0080130 | L-phenylalanine:2-oxoglutarate aminotransferase activity(GO:0080130) |
| 2.2 | 2.2 | GO:0097108 | hedgehog family protein binding(GO:0097108) |
| 2.1 | 35.8 | GO:0031996 | thioesterase binding(GO:0031996) |
| 2.1 | 178.6 | GO:0004712 | protein serine/threonine/tyrosine kinase activity(GO:0004712) |
| 2.0 | 10.1 | GO:0004468 | lysine N-acetyltransferase activity, acting on acetyl phosphate as donor(GO:0004468) |
| 2.0 | 35.8 | GO:1990381 | ubiquitin-specific protease binding(GO:1990381) |
| 2.0 | 7.9 | GO:0015204 | urea transmembrane transporter activity(GO:0015204) |
| 1.9 | 27.1 | GO:0004861 | cyclin-dependent protein serine/threonine kinase inhibitor activity(GO:0004861) |
| 1.8 | 5.3 | GO:0005128 | erythropoietin receptor binding(GO:0005128) |
| 1.7 | 15.4 | GO:0017169 | CDP-alcohol phosphatidyltransferase activity(GO:0017169) |
| 1.7 | 5.0 | GO:0001010 | transcription factor activity, sequence-specific DNA binding transcription factor recruiting(GO:0001010) |
| 1.6 | 6.3 | GO:1990430 | extracellular matrix protein binding(GO:1990430) |
| 1.5 | 30.9 | GO:0008574 | ATP-dependent microtubule motor activity, plus-end-directed(GO:0008574) |
| 1.5 | 43.7 | GO:0005355 | glucose transmembrane transporter activity(GO:0005355) |
| 1.4 | 5.7 | GO:0016230 | sphingomyelin phosphodiesterase activator activity(GO:0016230) |
| 1.4 | 8.3 | GO:0039552 | RIG-I binding(GO:0039552) |
| 1.4 | 4.1 | GO:0003943 | N-acetylgalactosamine-4-sulfatase activity(GO:0003943) |
| 1.3 | 15.8 | GO:0097027 | ubiquitin-protein transferase activator activity(GO:0097027) |
| 1.2 | 7.4 | GO:0070568 | guanylyltransferase activity(GO:0070568) |
| 1.2 | 20.8 | GO:0048156 | tau protein binding(GO:0048156) |
| 1.2 | 8.5 | GO:0000182 | rDNA binding(GO:0000182) |
| 1.2 | 19.8 | GO:0017136 | NAD-dependent histone deacetylase activity(GO:0017136) |
| 1.1 | 47.6 | GO:0048487 | beta-tubulin binding(GO:0048487) |
| 1.1 | 33.6 | GO:0004181 | metallocarboxypeptidase activity(GO:0004181) |
| 1.1 | 4.5 | GO:0035939 | microsatellite binding(GO:0035939) |
| 1.1 | 3.2 | GO:0052871 | tocopherol omega-hydroxylase activity(GO:0052870) alpha-tocopherol omega-hydroxylase activity(GO:0052871) 20-hydroxy-leukotriene B4 omega oxidase activity(GO:0097258) 20-aldehyde-leukotriene B4 20-monooxygenase activity(GO:0097259) |
| 1.1 | 10.5 | GO:0005549 | odorant binding(GO:0005549) |
| 1.0 | 9.2 | GO:0036312 | phosphatidylinositol 3-kinase regulatory subunit binding(GO:0036312) |
| 1.0 | 26.8 | GO:0004859 | phospholipase inhibitor activity(GO:0004859) |
| 1.0 | 20.8 | GO:0001965 | G-protein alpha-subunit binding(GO:0001965) |
| 1.0 | 20.7 | GO:0005247 | voltage-gated chloride channel activity(GO:0005247) |
| 0.9 | 8.4 | GO:1990226 | histone methyltransferase binding(GO:1990226) |
| 0.9 | 5.6 | GO:0042285 | UDP-xylosyltransferase activity(GO:0035252) xylosyltransferase activity(GO:0042285) |
| 0.9 | 19.2 | GO:0019206 | nucleoside kinase activity(GO:0019206) |
| 0.9 | 3.5 | GO:0015057 | thrombin receptor activity(GO:0015057) |
| 0.9 | 6.9 | GO:0071253 | connexin binding(GO:0071253) |
| 0.8 | 5.4 | GO:0031681 | G-protein beta-subunit binding(GO:0031681) |
| 0.8 | 6.8 | GO:0015277 | kainate selective glutamate receptor activity(GO:0015277) |
| 0.7 | 11.2 | GO:0043560 | insulin receptor substrate binding(GO:0043560) |
| 0.7 | 13.6 | GO:0070008 | serine-type exopeptidase activity(GO:0070008) |
| 0.7 | 7.1 | GO:0004415 | hyalurononglucosaminidase activity(GO:0004415) |
| 0.7 | 17.6 | GO:0008093 | cytoskeletal adaptor activity(GO:0008093) |
| 0.6 | 2.5 | GO:0042954 | lipoprotein transporter activity(GO:0042954) |
| 0.6 | 11.4 | GO:0003906 | DNA-(apurinic or apyrimidinic site) lyase activity(GO:0003906) |
| 0.6 | 2.5 | GO:0042015 | interleukin-20 binding(GO:0042015) |
| 0.6 | 30.3 | GO:0001784 | phosphotyrosine binding(GO:0001784) |
| 0.6 | 8.8 | GO:0017017 | MAP kinase tyrosine/serine/threonine phosphatase activity(GO:0017017) |
| 0.6 | 21.2 | GO:0030332 | cyclin binding(GO:0030332) |
| 0.6 | 3.5 | GO:0008518 | reduced folate carrier activity(GO:0008518) methotrexate transporter activity(GO:0015350) |
| 0.6 | 14.5 | GO:0102391 | decanoate--CoA ligase activity(GO:0102391) |
| 0.6 | 1.7 | GO:0015616 | DNA translocase activity(GO:0015616) |
| 0.6 | 3.4 | GO:0097506 | uracil DNA N-glycosylase activity(GO:0004844) deaminated base DNA N-glycosylase activity(GO:0097506) |
| 0.6 | 17.9 | GO:0008519 | ammonium transmembrane transporter activity(GO:0008519) |
| 0.6 | 34.3 | GO:0004715 | non-membrane spanning protein tyrosine kinase activity(GO:0004715) |
| 0.5 | 15.4 | GO:0071949 | FAD binding(GO:0071949) |
| 0.5 | 6.8 | GO:0005229 | intracellular calcium activated chloride channel activity(GO:0005229) |
| 0.5 | 10.5 | GO:0008239 | dipeptidyl-peptidase activity(GO:0008239) |
| 0.5 | 8.9 | GO:0042809 | vitamin D receptor binding(GO:0042809) |
| 0.5 | 26.9 | GO:0005246 | calcium channel regulator activity(GO:0005246) |
| 0.5 | 19.1 | GO:0048020 | CCR chemokine receptor binding(GO:0048020) |
| 0.5 | 7.2 | GO:0003995 | acyl-CoA dehydrogenase activity(GO:0003995) |
| 0.5 | 15.1 | GO:0000993 | RNA polymerase II core binding(GO:0000993) |
| 0.5 | 5.0 | GO:0032051 | clathrin light chain binding(GO:0032051) |
| 0.4 | 3.1 | GO:0030160 | GKAP/Homer scaffold activity(GO:0030160) |
| 0.4 | 29.5 | GO:0030276 | clathrin binding(GO:0030276) |
| 0.4 | 3.5 | GO:1990599 | 3' overhang single-stranded DNA endodeoxyribonuclease activity(GO:1990599) |
| 0.4 | 5.1 | GO:0036374 | glutathione hydrolase activity(GO:0036374) |
| 0.4 | 13.6 | GO:0008188 | neuropeptide receptor activity(GO:0008188) |
| 0.4 | 128.9 | GO:0015631 | tubulin binding(GO:0015631) |
| 0.4 | 13.6 | GO:0008157 | protein phosphatase 1 binding(GO:0008157) |
| 0.4 | 9.8 | GO:0031434 | mitogen-activated protein kinase kinase binding(GO:0031434) |
| 0.4 | 3.2 | GO:0016015 | morphogen activity(GO:0016015) |
| 0.4 | 6.8 | GO:0099604 | calcium-release channel activity(GO:0015278) ligand-gated calcium channel activity(GO:0099604) |
| 0.3 | 4.0 | GO:0005025 | transforming growth factor beta receptor activity, type I(GO:0005025) |
| 0.3 | 38.9 | GO:0004222 | metalloendopeptidase activity(GO:0004222) |
| 0.3 | 8.5 | GO:0046875 | ephrin receptor binding(GO:0046875) |
| 0.3 | 8.4 | GO:0046965 | retinoid X receptor binding(GO:0046965) |
| 0.3 | 4.3 | GO:0031821 | G-protein coupled serotonin receptor binding(GO:0031821) |
| 0.3 | 3.5 | GO:0034450 | ubiquitin-ubiquitin ligase activity(GO:0034450) |
| 0.2 | 4.6 | GO:0070273 | phosphatidylinositol-4-phosphate binding(GO:0070273) |
| 0.2 | 5.2 | GO:0004550 | nucleoside diphosphate kinase activity(GO:0004550) |
| 0.2 | 6.5 | GO:0031210 | phosphatidylcholine binding(GO:0031210) |
| 0.2 | 10.6 | GO:0061631 | ubiquitin conjugating enzyme activity(GO:0061631) |
| 0.2 | 2.9 | GO:0022851 | GABA-gated chloride ion channel activity(GO:0022851) |
| 0.2 | 15.8 | GO:0048365 | Rac GTPase binding(GO:0048365) |
| 0.2 | 7.7 | GO:0004693 | cyclin-dependent protein serine/threonine kinase activity(GO:0004693) |
| 0.2 | 6.7 | GO:0070063 | RNA polymerase binding(GO:0070063) |
| 0.2 | 8.9 | GO:0030331 | estrogen receptor binding(GO:0030331) |
| 0.2 | 8.3 | GO:0004115 | 3',5'-cyclic-AMP phosphodiesterase activity(GO:0004115) |
| 0.2 | 2.9 | GO:0001871 | pattern binding(GO:0001871) polysaccharide binding(GO:0030247) |
| 0.2 | 2.3 | GO:0051434 | BH3 domain binding(GO:0051434) |
| 0.2 | 1.3 | GO:0051575 | 5'-deoxyribose-5-phosphate lyase activity(GO:0051575) |
| 0.2 | 0.7 | GO:0035243 | protein-arginine omega-N symmetric methyltransferase activity(GO:0035243) |
| 0.2 | 3.8 | GO:0032266 | phosphatidylinositol-3-phosphate binding(GO:0032266) |
| 0.2 | 27.4 | GO:0044325 | ion channel binding(GO:0044325) |
| 0.2 | 3.8 | GO:0001223 | transcription coactivator binding(GO:0001223) |
| 0.2 | 2.4 | GO:0003836 | beta-galactoside (CMP) alpha-2,3-sialyltransferase activity(GO:0003836) |
| 0.2 | 1.6 | GO:0001135 | transcription factor activity, RNA polymerase II transcription factor recruiting(GO:0001135) |
| 0.2 | 2.1 | GO:0032395 | MHC class II receptor activity(GO:0032395) |
| 0.1 | 1.3 | GO:0003691 | double-stranded telomeric DNA binding(GO:0003691) |
| 0.1 | 1.4 | GO:0047498 | calcium-dependent phospholipase A2 activity(GO:0047498) |
| 0.1 | 1.4 | GO:0032794 | GTPase activating protein binding(GO:0032794) |
| 0.1 | 6.2 | GO:0030145 | manganese ion binding(GO:0030145) |
| 0.1 | 0.4 | GO:0019150 | D-ribulokinase activity(GO:0019150) |
| 0.1 | 4.1 | GO:0008395 | steroid hydroxylase activity(GO:0008395) |
| 0.1 | 13.8 | GO:0001104 | RNA polymerase II transcription cofactor activity(GO:0001104) |
| 0.1 | 1.4 | GO:0043548 | phosphatidylinositol 3-kinase binding(GO:0043548) |
| 0.1 | 2.4 | GO:0030983 | mismatched DNA binding(GO:0030983) |
| 0.1 | 9.1 | GO:0001618 | virus receptor activity(GO:0001618) |
| 0.1 | 2.3 | GO:0005388 | calcium-transporting ATPase activity(GO:0005388) |
| 0.1 | 0.7 | GO:0032393 | MHC class I receptor activity(GO:0032393) |
| 0.1 | 3.4 | GO:0030507 | spectrin binding(GO:0030507) |
| 0.1 | 8.2 | GO:0004867 | serine-type endopeptidase inhibitor activity(GO:0004867) |
| 0.1 | 2.6 | GO:0003950 | NAD+ ADP-ribosyltransferase activity(GO:0003950) |
| 0.1 | 13.3 | GO:0035091 | phosphatidylinositol binding(GO:0035091) |
| 0.1 | 19.9 | GO:0008236 | serine-type peptidase activity(GO:0008236) |
| 0.1 | 1.4 | GO:0015467 | G-protein activated inward rectifier potassium channel activity(GO:0015467) |
| 0.1 | 2.0 | GO:0005086 | ARF guanyl-nucleotide exchange factor activity(GO:0005086) |
| 0.1 | 0.2 | GO:0004914 | interleukin-5 receptor activity(GO:0004914) |
| 0.1 | 1.8 | GO:0017080 | sodium channel regulator activity(GO:0017080) |
| 0.1 | 0.6 | GO:0005000 | vasopressin receptor activity(GO:0005000) |
| 0.1 | 1.1 | GO:0042609 | CD4 receptor binding(GO:0042609) |
| 0.1 | 2.3 | GO:0050681 | androgen receptor binding(GO:0050681) |
| 0.1 | 3.7 | GO:0097110 | scaffold protein binding(GO:0097110) |
| 0.1 | 1.2 | GO:0038191 | neuropilin binding(GO:0038191) |
| 0.1 | 3.2 | GO:0016831 | carboxy-lyase activity(GO:0016831) |
| 0.1 | 18.9 | GO:0005096 | GTPase activator activity(GO:0005096) |
| 0.1 | 4.5 | GO:0070491 | repressing transcription factor binding(GO:0070491) |
| 0.1 | 3.6 | GO:0030165 | PDZ domain binding(GO:0030165) |
| 0.1 | 8.3 | GO:0003823 | antigen binding(GO:0003823) |
| 0.0 | 1.7 | GO:0004864 | protein phosphatase inhibitor activity(GO:0004864) |
| 0.0 | 3.2 | GO:0005249 | voltage-gated potassium channel activity(GO:0005249) |
| 0.0 | 1.6 | GO:0005487 | nucleocytoplasmic transporter activity(GO:0005487) |
| 0.0 | 9.6 | GO:0008022 | protein C-terminus binding(GO:0008022) |
| 0.0 | 1.5 | GO:0051393 | alpha-actinin binding(GO:0051393) |
| 0.0 | 2.6 | GO:0004497 | monooxygenase activity(GO:0004497) |
| 0.0 | 3.0 | GO:0004714 | transmembrane receptor protein tyrosine kinase activity(GO:0004714) |
| 0.0 | 10.5 | GO:0001227 | transcriptional repressor activity, RNA polymerase II transcription regulatory region sequence-specific binding(GO:0001227) |
| 0.0 | 0.4 | GO:0045236 | CXCR chemokine receptor binding(GO:0045236) |
| 0.0 | 0.9 | GO:0001671 | ATPase activator activity(GO:0001671) |
| 0.0 | 4.6 | GO:0051015 | actin filament binding(GO:0051015) |
| 0.0 | 1.9 | GO:0004984 | olfactory receptor activity(GO:0004984) |
| 0.0 | 5.3 | GO:0003779 | actin binding(GO:0003779) |
| 0.0 | 0.2 | GO:0008865 | glucokinase activity(GO:0004340) hexokinase activity(GO:0004396) fructokinase activity(GO:0008865) mannokinase activity(GO:0019158) |
| 0.0 | 1.1 | GO:0016278 | lysine N-methyltransferase activity(GO:0016278) protein-lysine N-methyltransferase activity(GO:0016279) |
| 0.0 | 1.1 | GO:0005201 | extracellular matrix structural constituent(GO:0005201) |
Gene overrepresentation in curated gene sets: canonical pathways category:
| Log-likelihood per target | Total log-likelihood | Term | Description |
|---|---|---|---|
| 3.0 | 244.7 | PID ECADHERIN NASCENT AJ PATHWAY | E-cadherin signaling in the nascent adherens junction |
| 1.7 | 54.5 | PID WNT CANONICAL PATHWAY | Canonical Wnt signaling pathway |
| 1.4 | 36.6 | PID ARF 3PATHWAY | Arf1 pathway |
| 1.4 | 90.6 | PID CD40 PATHWAY | CD40/CD40L signaling |
| 1.2 | 18.4 | PID HEDGEHOG GLI PATHWAY | Hedgehog signaling events mediated by Gli proteins |
| 1.1 | 42.3 | PID HDAC CLASSIII PATHWAY | Signaling events mediated by HDAC Class III |
| 1.1 | 5.3 | SA G2 AND M PHASES | Cdc25 activates the cdc2/cyclin B complex to induce the G2/M transition. |
| 0.9 | 10.4 | PID RAC1 PATHWAY | RAC1 signaling pathway |
| 0.7 | 48.3 | PID THROMBIN PAR1 PATHWAY | PAR1-mediated thrombin signaling events |
| 0.6 | 10.9 | PID IL5 PATHWAY | IL5-mediated signaling events |
| 0.6 | 24.0 | ST GA12 PATHWAY | G alpha 12 Pathway |
| 0.6 | 17.0 | PID IL8 CXCR2 PATHWAY | IL8- and CXCR2-mediated signaling events |
| 0.6 | 7.4 | PID ECADHERIN KERATINOCYTE PATHWAY | E-cadherin signaling in keratinocytes |
| 0.5 | 11.2 | PID NEPHRIN NEPH1 PATHWAY | Nephrin/Neph1 signaling in the kidney podocyte |
| 0.5 | 32.7 | PID PLK1 PATHWAY | PLK1 signaling events |
| 0.5 | 23.2 | SIG REGULATION OF THE ACTIN CYTOSKELETON BY RHO GTPASES | Genes related to regulation of the actin cytoskeleton |
| 0.5 | 20.4 | PID ERBB1 INTERNALIZATION PATHWAY | Internalization of ErbB1 |
| 0.4 | 26.6 | PID KIT PATHWAY | Signaling events mediated by Stem cell factor receptor (c-Kit) |
| 0.4 | 13.5 | PID RHODOPSIN PATHWAY | Visual signal transduction: Rods |
| 0.4 | 33.7 | PID CASPASE PATHWAY | Caspase cascade in apoptosis |
| 0.3 | 16.7 | PID ERBB4 PATHWAY | ErbB4 signaling events |
| 0.3 | 9.6 | PID P38 MKK3 6PATHWAY | p38 MAPK signaling pathway |
| 0.3 | 8.7 | PID WNT SIGNALING PATHWAY | Wnt signaling network |
| 0.3 | 4.7 | PID DNA PK PATHWAY | DNA-PK pathway in nonhomologous end joining |
| 0.3 | 6.3 | PID INTEGRIN5 PATHWAY | Beta5 beta6 beta7 and beta8 integrin cell surface interactions |
| 0.3 | 13.6 | PID RAC1 REG PATHWAY | Regulation of RAC1 activity |
| 0.2 | 12.1 | PID DELTA NP63 PATHWAY | Validated transcriptional targets of deltaNp63 isoforms |
| 0.2 | 8.5 | PID INTEGRIN2 PATHWAY | Beta2 integrin cell surface interactions |
| 0.2 | 1.9 | ST IL 13 PATHWAY | Interleukin 13 (IL-13) Pathway |
| 0.2 | 7.0 | PID CERAMIDE PATHWAY | Ceramide signaling pathway |
| 0.2 | 4.0 | PID IL27 PATHWAY | IL27-mediated signaling events |
| 0.1 | 2.8 | PID SMAD2 3NUCLEAR PATHWAY | Regulation of nuclear SMAD2/3 signaling |
| 0.1 | 7.3 | PID NFAT TFPATHWAY | Calcineurin-regulated NFAT-dependent transcription in lymphocytes |
| 0.1 | 2.2 | PID HEDGEHOG 2PATHWAY | Signaling events mediated by the Hedgehog family |
| 0.1 | 3.8 | PID ANGIOPOIETIN RECEPTOR PATHWAY | Angiopoietin receptor Tie2-mediated signaling |
| 0.1 | 3.1 | ST PHOSPHOINOSITIDE 3 KINASE PATHWAY | PI3K Pathway |
| 0.1 | 0.8 | ST GAQ PATHWAY | G alpha q Pathway |
| 0.1 | 4.5 | PID HES HEY PATHWAY | Notch-mediated HES/HEY network |
| 0.1 | 3.4 | PID FCER1 PATHWAY | Fc-epsilon receptor I signaling in mast cells |
| 0.1 | 4.0 | PID BMP PATHWAY | BMP receptor signaling |
| 0.1 | 1.6 | ST JNK MAPK PATHWAY | JNK MAPK Pathway |
| 0.1 | 3.8 | PID AP1 PATHWAY | AP-1 transcription factor network |
| 0.1 | 2.0 | PID ARF6 PATHWAY | Arf6 signaling events |
| 0.1 | 18.6 | NABA SECRETED FACTORS | Genes encoding secreted soluble factors |
| 0.1 | 14.5 | NABA ECM REGULATORS | Genes encoding enzymes and their regulators involved in the remodeling of the extracellular matrix |
| 0.1 | 1.4 | ST ADRENERGIC | Adrenergic Pathway |
| 0.0 | 1.1 | PID TOLL ENDOGENOUS PATHWAY | Endogenous TLR signaling |
| 0.0 | 5.5 | NABA ECM AFFILIATED | Genes encoding proteins affiliated structurally or functionally to extracellular matrix proteins |
| 0.0 | 2.7 | PID BETA CATENIN NUC PATHWAY | Regulation of nuclear beta catenin signaling and target gene transcription |
| 0.0 | 0.2 | PID ERBB2 ERBB3 PATHWAY | ErbB2/ErbB3 signaling events |
| 0.0 | 0.6 | PID ARF6 TRAFFICKING PATHWAY | Arf6 trafficking events |
Gene overrepresentation in curated gene sets: REACTOME pathways category:
| Log-likelihood per target | Total log-likelihood | Term | Description |
|---|---|---|---|
| 18.8 | 263.4 | REACTOME NEF MEDIATED DOWNREGULATION OF MHC CLASS I COMPLEX CELL SURFACE EXPRESSION | Genes involved in Nef mediated downregulation of MHC class I complex cell surface expression |
| 2.6 | 33.5 | REACTOME RECRUITMENT OF NUMA TO MITOTIC CENTROSOMES | Genes involved in Recruitment of NuMA to mitotic centrosomes |
| 2.2 | 58.2 | REACTOME TRAFFICKING OF GLUR2 CONTAINING AMPA RECEPTORS | Genes involved in Trafficking of GluR2-containing AMPA receptors |
| 2.2 | 48.0 | REACTOME TRAF3 DEPENDENT IRF ACTIVATION PATHWAY | Genes involved in TRAF3-dependent IRF activation pathway |
| 1.9 | 40.3 | REACTOME ENDOSOMAL SORTING COMPLEX REQUIRED FOR TRANSPORT ESCRT | Genes involved in Endosomal Sorting Complex Required For Transport (ESCRT) |
| 1.6 | 125.4 | REACTOME METABOLISM OF VITAMINS AND COFACTORS | Genes involved in Metabolism of vitamins and cofactors |
| 1.5 | 4.6 | REACTOME MITOTIC M M G1 PHASES | Genes involved in Mitotic M-M/G1 phases |
| 1.2 | 27.7 | REACTOME EGFR DOWNREGULATION | Genes involved in EGFR downregulation |
| 1.0 | 22.9 | REACTOME G BETA GAMMA SIGNALLING THROUGH PLC BETA | Genes involved in G beta:gamma signalling through PLC beta |
| 0.9 | 51.1 | REACTOME GLYCOLYSIS | Genes involved in Glycolysis |
| 0.8 | 15.8 | REACTOME ACTIVATION OF RAC | Genes involved in Activation of Rac |
| 0.8 | 10.7 | REACTOME REGULATION OF INSULIN SECRETION | Genes involved in Regulation of Insulin Secretion |
| 0.8 | 31.6 | REACTOME ANTIGEN ACTIVATES B CELL RECEPTOR LEADING TO GENERATION OF SECOND MESSENGERS | Genes involved in Antigen Activates B Cell Receptor Leading to Generation of Second Messengers |
| 0.6 | 11.2 | REACTOME TGF BETA RECEPTOR SIGNALING IN EMT EPITHELIAL TO MESENCHYMAL TRANSITION | Genes involved in TGF-beta receptor signaling in EMT (epithelial to mesenchymal transition) |
| 0.5 | 28.2 | REACTOME GLYCOSPHINGOLIPID METABOLISM | Genes involved in Glycosphingolipid metabolism |
| 0.5 | 10.4 | REACTOME CLASS C 3 METABOTROPIC GLUTAMATE PHEROMONE RECEPTORS | Genes involved in Class C/3 (Metabotropic glutamate/pheromone receptors) |
| 0.5 | 14.5 | REACTOME SYNTHESIS OF VERY LONG CHAIN FATTY ACYL COAS | Genes involved in Synthesis of very long-chain fatty acyl-CoAs |
| 0.4 | 8.4 | REACTOME P75 NTR RECEPTOR MEDIATED SIGNALLING | Genes involved in p75 NTR receptor-mediated signalling |
| 0.4 | 10.0 | REACTOME ACTIVATION OF THE AP1 FAMILY OF TRANSCRIPTION FACTORS | Genes involved in Activation of the AP-1 family of transcription factors |
| 0.4 | 7.1 | REACTOME METABOLISM OF POLYAMINES | Genes involved in Metabolism of polyamines |
| 0.3 | 3.5 | REACTOME PLATELET ADHESION TO EXPOSED COLLAGEN | Genes involved in Platelet Adhesion to exposed collagen |
| 0.3 | 4.1 | REACTOME SYNTHESIS OF BILE ACIDS AND BILE SALTS VIA 24 HYDROXYCHOLESTEROL | Genes involved in Synthesis of bile acids and bile salts via 24-hydroxycholesterol |
| 0.3 | 6.7 | REACTOME DESTABILIZATION OF MRNA BY TRISTETRAPROLIN TTP | Genes involved in Destabilization of mRNA by Tristetraprolin (TTP) |
| 0.3 | 51.4 | REACTOME PPARA ACTIVATES GENE EXPRESSION | Genes involved in PPARA Activates Gene Expression |
| 0.3 | 7.3 | REACTOME INHIBITION OF INSULIN SECRETION BY ADRENALINE NORADRENALINE | Genes involved in Inhibition of Insulin Secretion by Adrenaline/Noradrenaline |
| 0.3 | 4.3 | REACTOME G PROTEIN ACTIVATION | Genes involved in G-protein activation |
| 0.3 | 6.9 | REACTOME RESOLUTION OF AP SITES VIA THE SINGLE NUCLEOTIDE REPLACEMENT PATHWAY | Genes involved in Resolution of AP sites via the single-nucleotide replacement pathway |
| 0.3 | 10.9 | REACTOME IL RECEPTOR SHC SIGNALING | Genes involved in Interleukin receptor SHC signaling |
| 0.3 | 12.1 | REACTOME SIGNAL TRANSDUCTION BY L1 | Genes involved in Signal transduction by L1 |
| 0.3 | 7.1 | REACTOME CRMPS IN SEMA3A SIGNALING | Genes involved in CRMPs in Sema3A signaling |
| 0.3 | 17.3 | REACTOME NOTCH1 INTRACELLULAR DOMAIN REGULATES TRANSCRIPTION | Genes involved in NOTCH1 Intracellular Domain Regulates Transcription |
| 0.3 | 8.9 | REACTOME FORMATION OF TRANSCRIPTION COUPLED NER TC NER REPAIR COMPLEX | Genes involved in Formation of transcription-coupled NER (TC-NER) repair complex |
| 0.3 | 6.3 | REACTOME INTEGRIN CELL SURFACE INTERACTIONS | Genes involved in Integrin cell surface interactions |
| 0.2 | 7.2 | REACTOME BRANCHED CHAIN AMINO ACID CATABOLISM | Genes involved in Branched-chain amino acid catabolism |
| 0.2 | 16.7 | REACTOME NUCLEAR SIGNALING BY ERBB4 | Genes involved in Nuclear signaling by ERBB4 |
| 0.2 | 6.8 | REACTOME ACTIVATION OF KAINATE RECEPTORS UPON GLUTAMATE BINDING | Genes involved in Activation of Kainate Receptors upon glutamate binding |
| 0.2 | 6.5 | REACTOME RNA POL III TRANSCRIPTION INITIATION FROM TYPE 2 PROMOTER | Genes involved in RNA Polymerase III Transcription Initiation From Type 2 Promoter |
| 0.2 | 13.9 | REACTOME GOLGI ASSOCIATED VESICLE BIOGENESIS | Genes involved in Golgi Associated Vesicle Biogenesis |
| 0.2 | 3.9 | REACTOME REGULATION OF HYPOXIA INDUCIBLE FACTOR HIF BY OXYGEN | Genes involved in Regulation of Hypoxia-inducible Factor (HIF) by Oxygen |
| 0.2 | 1.4 | REACTOME G ALPHA1213 SIGNALLING EVENTS | Genes involved in G alpha (12/13) signalling events |
| 0.2 | 6.7 | REACTOME AMINE COMPOUND SLC TRANSPORTERS | Genes involved in Amine compound SLC transporters |
| 0.2 | 10.3 | REACTOME NRAGE SIGNALS DEATH THROUGH JNK | Genes involved in NRAGE signals death through JNK |
| 0.2 | 4.0 | REACTOME SIGNALING BY BMP | Genes involved in Signaling by BMP |
| 0.2 | 58.4 | REACTOME GENERIC TRANSCRIPTION PATHWAY | Genes involved in Generic Transcription Pathway |
| 0.2 | 10.6 | REACTOME CHEMOKINE RECEPTORS BIND CHEMOKINES | Genes involved in Chemokine receptors bind chemokines |
| 0.2 | 3.6 | REACTOME INSULIN SYNTHESIS AND PROCESSING | Genes involved in Insulin Synthesis and Processing |
| 0.1 | 12.4 | REACTOME OLFACTORY SIGNALING PATHWAY | Genes involved in Olfactory Signaling Pathway |
| 0.1 | 6.7 | REACTOME SMOOTH MUSCLE CONTRACTION | Genes involved in Smooth Muscle Contraction |
| 0.1 | 14.2 | REACTOME PEPTIDE LIGAND BINDING RECEPTORS | Genes involved in Peptide ligand-binding receptors |
| 0.1 | 2.4 | REACTOME TERMINATION OF O GLYCAN BIOSYNTHESIS | Genes involved in Termination of O-glycan biosynthesis |
| 0.1 | 3.4 | REACTOME CASPASE MEDIATED CLEAVAGE OF CYTOSKELETAL PROTEINS | Genes involved in Caspase-mediated cleavage of cytoskeletal proteins |
| 0.1 | 2.4 | REACTOME MEIOSIS | Genes involved in Meiosis |
| 0.1 | 1.4 | REACTOME ACYL CHAIN REMODELLING OF PS | Genes involved in Acyl chain remodelling of PS |
| 0.1 | 3.8 | REACTOME RNA POL I RNA POL III AND MITOCHONDRIAL TRANSCRIPTION | Genes involved in RNA Polymerase I, RNA Polymerase III, and Mitochondrial Transcription |
| 0.1 | 2.9 | REACTOME GABA A RECEPTOR ACTIVATION | Genes involved in GABA A receptor activation |
| 0.1 | 5.0 | REACTOME MHC CLASS II ANTIGEN PRESENTATION | Genes involved in MHC class II antigen presentation |
| 0.1 | 2.3 | REACTOME INFLAMMASOMES | Genes involved in Inflammasomes |
| 0.1 | 6.9 | REACTOME IMMUNOREGULATORY INTERACTIONS BETWEEN A LYMPHOID AND A NON LYMPHOID CELL | Genes involved in Immunoregulatory interactions between a Lymphoid and a non-Lymphoid cell |
| 0.1 | 8.4 | REACTOME SIGNALING BY ERBB2 | Genes involved in Signaling by ERBB2 |
| 0.1 | 1.4 | REACTOME GABA B RECEPTOR ACTIVATION | Genes involved in GABA B receptor activation |
| 0.1 | 1.7 | REACTOME KINESINS | Genes involved in Kinesins |
| 0.1 | 3.2 | REACTOME CYTOCHROME P450 ARRANGED BY SUBSTRATE TYPE | Genes involved in Cytochrome P450 - arranged by substrate type |
| 0.1 | 5.4 | REACTOME G ALPHA I SIGNALLING EVENTS | Genes involved in G alpha (i) signalling events |
| 0.1 | 1.6 | REACTOME REGULATION OF GENE EXPRESSION IN BETA CELLS | Genes involved in Regulation of gene expression in beta cells |
| 0.1 | 1.1 | REACTOME CS DS DEGRADATION | Genes involved in CS/DS degradation |
| 0.0 | 2.7 | REACTOME VOLTAGE GATED POTASSIUM CHANNELS | Genes involved in Voltage gated Potassium channels |
| 0.0 | 2.3 | REACTOME ION TRANSPORT BY P TYPE ATPASES | Genes involved in Ion transport by P-type ATPases |
| 0.0 | 0.8 | REACTOME TRAF6 MEDIATED NFKB ACTIVATION | Genes involved in TRAF6 mediated NF-kB activation |
| 0.0 | 0.4 | REACTOME COMMON PATHWAY | Genes involved in Common Pathway |
| 0.0 | 2.2 | REACTOME CLASS B 2 SECRETIN FAMILY RECEPTORS | Genes involved in Class B/2 (Secretin family receptors) |
| 0.0 | 3.2 | REACTOME METABOLISM OF AMINO ACIDS AND DERIVATIVES | Genes involved in Metabolism of amino acids and derivatives |