Project
GNF SymAtlas + NCI-60 cancer cell lines, human (Su, 2004; Ross, 2000)
Navigation
Downloads
Results for RUNX1_RUNX2
Z-value: 2.12
Motif logo
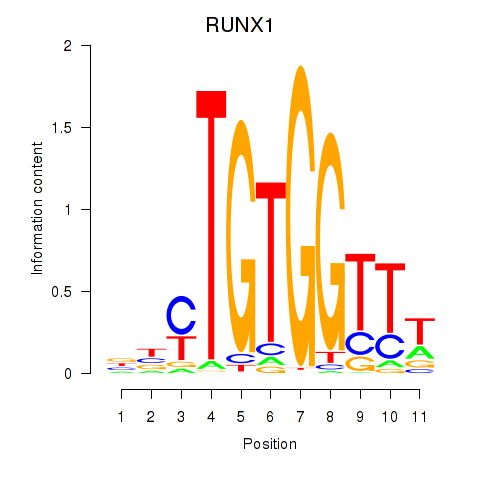
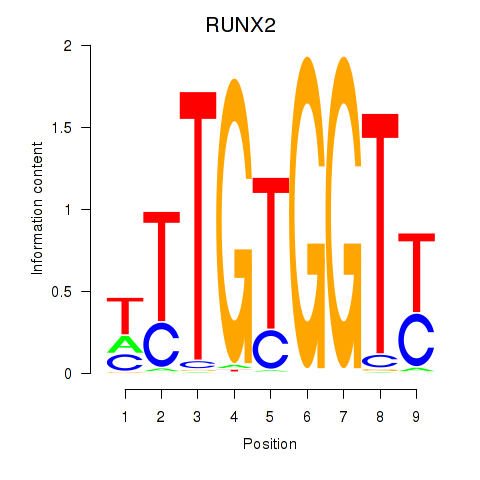
Transcription factors associated with RUNX1_RUNX2
| Gene Symbol | Gene ID | Gene Info |
|---|---|---|
|
RUNX1
|
ENSG00000159216.19 | RUNX1 |
|
RUNX2
|
ENSG00000124813.23 | RUNX2 |
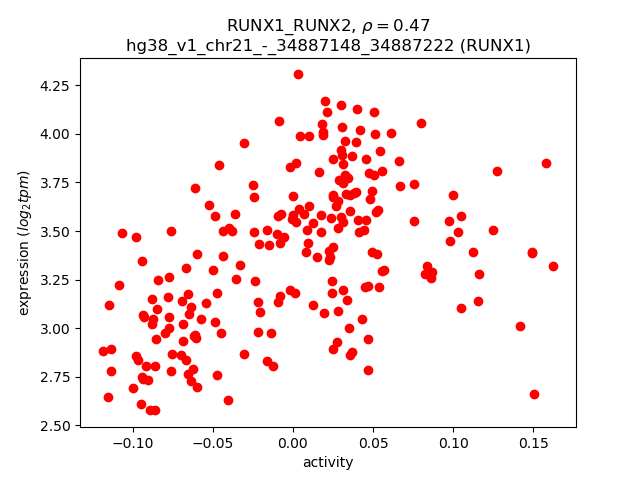
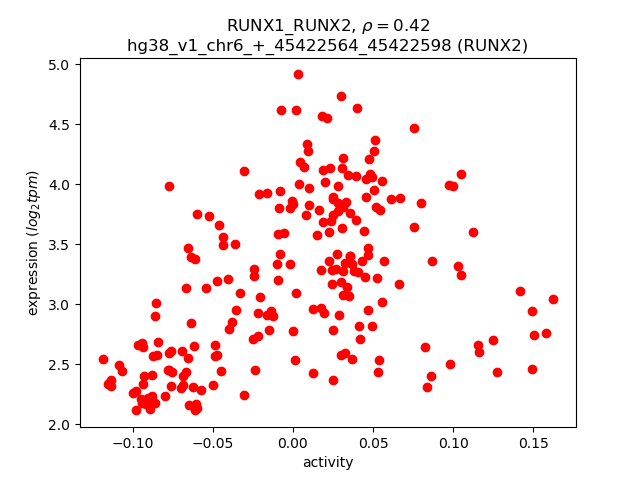
Activity-expression correlation:
| Gene | Promoter | Pearson corr. coef. | P-value | Plot |
|---|---|---|---|---|
| RUNX1 | hg38_v1_chr21_-_34887148_34887222 | 0.47 | 2.7e-13 | Click! |
| RUNX2 | hg38_v1_chr6_+_45422564_45422598 | 0.42 | 1.2e-10 | Click! |
Activity profile of RUNX1_RUNX2 motif
Sorted Z-values of RUNX1_RUNX2 motif
Network of associatons between targets according to the STRING database.

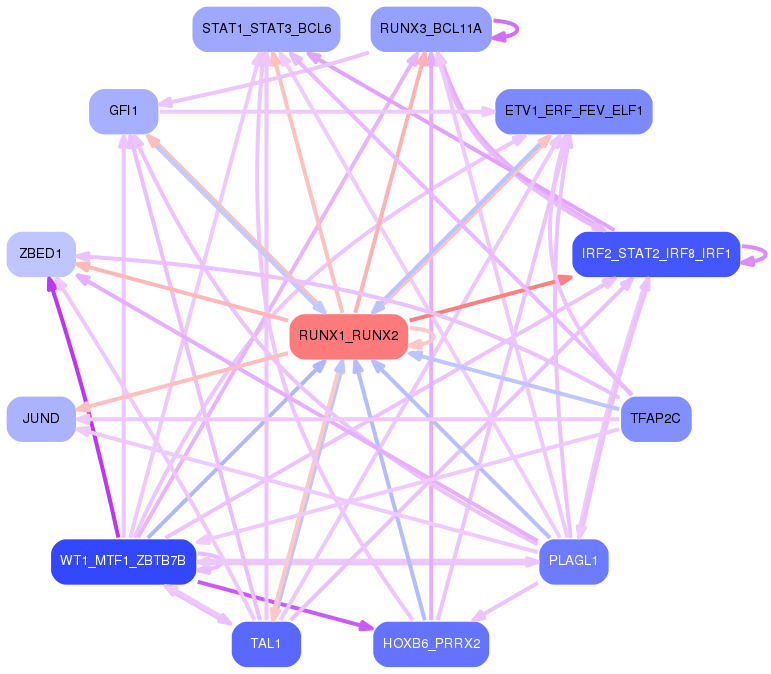
First level regulatory network of RUNX1_RUNX2
Gene Ontology Analysis
Gene overrepresentation in biological process category:
| Log-likelihood per target | Total log-likelihood | Term | Description |
|---|---|---|---|
| 16.7 | 50.0 | GO:0002378 | immunoglobulin biosynthetic process(GO:0002378) |
| 9.6 | 9.6 | GO:1905154 | negative regulation of membrane invagination(GO:1905154) |
| 9.1 | 27.3 | GO:0001796 | type IIa hypersensitivity(GO:0001794) regulation of type IIa hypersensitivity(GO:0001796) type II hypersensitivity(GO:0002445) regulation of type II hypersensitivity(GO:0002892) |
| 9.1 | 27.3 | GO:1902997 | regulation of choline O-acetyltransferase activity(GO:1902769) positive regulation of choline O-acetyltransferase activity(GO:1902771) negative regulation of tau-protein kinase activity(GO:1902948) positive regulation of early endosome to recycling endosome transport(GO:1902955) negative regulation of aspartic-type endopeptidase activity involved in amyloid precursor protein catabolic process(GO:1902960) negative regulation of neurofibrillary tangle assembly(GO:1902997) negative regulation of aspartic-type peptidase activity(GO:1905246) |
| 9.0 | 27.1 | GO:2000537 | regulation of B cell chemotaxis(GO:2000537) positive regulation of B cell chemotaxis(GO:2000538) |
| 7.8 | 23.3 | GO:0002818 | intracellular defense response(GO:0002818) |
| 7.5 | 22.4 | GO:0061502 | early endosome to recycling endosome transport(GO:0061502) |
| 7.4 | 29.5 | GO:0003366 | cell-matrix adhesion involved in ameboidal cell migration(GO:0003366) |
| 6.8 | 20.3 | GO:0030185 | nitric oxide transport(GO:0030185) |
| 6.7 | 53.6 | GO:0008626 | granzyme-mediated apoptotic signaling pathway(GO:0008626) |
| 6.7 | 33.4 | GO:0050861 | positive regulation of B cell receptor signaling pathway(GO:0050861) |
| 5.3 | 42.1 | GO:0070235 | regulation of activation-induced cell death of T cells(GO:0070235) negative regulation of activation-induced cell death of T cells(GO:0070236) |
| 5.1 | 40.4 | GO:0050859 | negative regulation of B cell receptor signaling pathway(GO:0050859) |
| 4.9 | 14.7 | GO:0002625 | regulation of T cell antigen processing and presentation(GO:0002625) |
| 4.8 | 9.7 | GO:1901624 | negative regulation of lymphocyte chemotaxis(GO:1901624) |
| 4.8 | 19.0 | GO:0050902 | leukocyte adhesive activation(GO:0050902) |
| 4.7 | 14.1 | GO:0035759 | mesangial cell-matrix adhesion(GO:0035759) dendritic cell dendrite assembly(GO:0097026) regulation of dendritic cell dendrite assembly(GO:2000547) |
| 4.6 | 13.8 | GO:0070078 | peptidyl-lysine hydroxylation to 5-hydroxy-L-lysine(GO:0018395) histone arginine demethylation(GO:0070077) histone H3-R2 demethylation(GO:0070078) histone H4-R3 demethylation(GO:0070079) |
| 4.5 | 31.8 | GO:0002774 | Fc receptor mediated inhibitory signaling pathway(GO:0002774) |
| 4.5 | 40.8 | GO:0045217 | cell-cell junction maintenance(GO:0045217) |
| 4.3 | 17.1 | GO:0030821 | negative regulation of cyclic nucleotide catabolic process(GO:0030806) negative regulation of cAMP catabolic process(GO:0030821) |
| 4.1 | 8.2 | GO:2000562 | negative regulation of CD4-positive, alpha-beta T cell proliferation(GO:2000562) |
| 4.0 | 40.5 | GO:2000427 | positive regulation of apoptotic cell clearance(GO:2000427) |
| 4.0 | 12.1 | GO:0072434 | signal transduction involved in G2 DNA damage checkpoint(GO:0072425) signal transduction involved in mitotic G2 DNA damage checkpoint(GO:0072434) telomerase catalytic core complex assembly(GO:1904868) regulation of telomerase catalytic core complex assembly(GO:1904882) positive regulation of telomerase catalytic core complex assembly(GO:1904884) |
| 4.0 | 12.0 | GO:0002503 | peptide antigen assembly with MHC class II protein complex(GO:0002503) |
| 4.0 | 15.9 | GO:0002904 | positive regulation of B cell apoptotic process(GO:0002904) |
| 4.0 | 11.9 | GO:0002752 | cell surface pattern recognition receptor signaling pathway(GO:0002752) |
| 4.0 | 7.9 | GO:0002884 | negative regulation of hypersensitivity(GO:0002884) |
| 3.7 | 18.7 | GO:1904565 | response to 1-oleoyl-sn-glycerol 3-phosphate(GO:1904565) cellular response to 1-oleoyl-sn-glycerol 3-phosphate(GO:1904566) |
| 3.5 | 24.5 | GO:1990822 | regulation of arginine metabolic process(GO:0000821) basic amino acid transmembrane transport(GO:1990822) |
| 3.4 | 10.1 | GO:0006683 | galactosylceramide catabolic process(GO:0006683) |
| 3.4 | 16.8 | GO:2001107 | negative regulation of establishment of T cell polarity(GO:1903904) negative regulation of Rho guanyl-nucleotide exchange factor activity(GO:2001107) |
| 3.4 | 23.5 | GO:0035633 | maintenance of blood-brain barrier(GO:0035633) |
| 3.3 | 10.0 | GO:0070340 | detection of bacterial lipoprotein(GO:0042494) detection of triacyl bacterial lipopeptide(GO:0042495) detection of bacterial lipopeptide(GO:0070340) |
| 3.3 | 9.9 | GO:0050653 | chondroitin sulfate proteoglycan biosynthetic process, polysaccharide chain biosynthetic process(GO:0050653) |
| 3.2 | 9.7 | GO:0038178 | complement component C5a signaling pathway(GO:0038178) |
| 3.2 | 9.7 | GO:1904845 | response to L-glutamine(GO:1904844) cellular response to L-glutamine(GO:1904845) |
| 3.2 | 9.7 | GO:0042412 | taurine biosynthetic process(GO:0042412) |
| 3.2 | 9.5 | GO:0070105 | positive regulation of interleukin-6-mediated signaling pathway(GO:0070105) |
| 3.2 | 9.5 | GO:0097156 | fasciculation of motor neuron axon(GO:0097156) |
| 3.2 | 22.1 | GO:0030885 | regulation of myeloid dendritic cell activation(GO:0030885) |
| 3.1 | 3.1 | GO:0045799 | positive regulation of chromatin assembly or disassembly(GO:0045799) |
| 3.1 | 15.6 | GO:0015891 | iron chelate transport(GO:0015688) siderophore transport(GO:0015891) |
| 3.1 | 56.1 | GO:0015671 | oxygen transport(GO:0015671) |
| 3.1 | 12.2 | GO:0071673 | positive regulation of smooth muscle cell chemotaxis(GO:0071673) |
| 2.9 | 8.7 | GO:0001915 | negative regulation of T cell mediated cytotoxicity(GO:0001915) |
| 2.9 | 8.7 | GO:0000350 | generation of catalytic spliceosome for second transesterification step(GO:0000350) |
| 2.8 | 8.4 | GO:0043553 | negative regulation of phosphatidylinositol 3-kinase activity(GO:0043553) |
| 2.8 | 11.2 | GO:0032764 | negative regulation of mast cell cytokine production(GO:0032764) |
| 2.6 | 29.0 | GO:0006030 | chitin metabolic process(GO:0006030) chitin catabolic process(GO:0006032) |
| 2.6 | 7.9 | GO:1902309 | negative regulation of peptidyl-serine dephosphorylation(GO:1902309) |
| 2.6 | 2.6 | GO:1900227 | positive regulation of NLRP3 inflammasome complex assembly(GO:1900227) |
| 2.6 | 15.6 | GO:0033625 | positive regulation of integrin activation(GO:0033625) |
| 2.6 | 13.0 | GO:0006154 | adenosine catabolic process(GO:0006154) inosine biosynthetic process(GO:0046103) |
| 2.6 | 7.8 | GO:0060448 | dichotomous subdivision of terminal units involved in lung branching(GO:0060448) |
| 2.5 | 7.5 | GO:2000296 | negative regulation of hydrogen peroxide catabolic process(GO:2000296) |
| 2.5 | 7.5 | GO:0036414 | protein citrullination(GO:0018101) histone citrullination(GO:0036414) |
| 2.5 | 7.4 | GO:1904017 | cellular response to Thyroglobulin triiodothyronine(GO:1904017) |
| 2.4 | 14.4 | GO:0051138 | positive regulation of NK T cell differentiation(GO:0051138) |
| 2.4 | 4.8 | GO:0002032 | desensitization of G-protein coupled receptor protein signaling pathway by arrestin(GO:0002032) |
| 2.4 | 7.2 | GO:1904204 | regulation of skeletal muscle hypertrophy(GO:1904204) |
| 2.3 | 7.0 | GO:1904760 | myofibroblast differentiation(GO:0036446) regulation of myofibroblast differentiation(GO:1904760) |
| 2.3 | 22.7 | GO:0006957 | complement activation, alternative pathway(GO:0006957) |
| 2.2 | 2.2 | GO:1900106 | hyaluranon cable assembly(GO:0036118) regulation of hyaluranon cable assembly(GO:1900104) positive regulation of hyaluranon cable assembly(GO:1900106) |
| 2.2 | 21.7 | GO:1903416 | response to glycoside(GO:1903416) |
| 2.2 | 10.8 | GO:2000870 | regulation of progesterone secretion(GO:2000870) |
| 2.2 | 51.7 | GO:0044130 | negative regulation of growth of symbiont in host(GO:0044130) |
| 2.2 | 6.5 | GO:1900226 | negative regulation of NLRP3 inflammasome complex assembly(GO:1900226) |
| 2.1 | 12.7 | GO:0001865 | NK T cell differentiation(GO:0001865) |
| 2.1 | 17.0 | GO:1902525 | regulation of protein monoubiquitination(GO:1902525) |
| 2.1 | 8.3 | GO:0002317 | plasma cell differentiation(GO:0002317) |
| 2.1 | 18.6 | GO:0048003 | antigen processing and presentation of lipid antigen via MHC class Ib(GO:0048003) antigen processing and presentation, exogenous lipid antigen via MHC class Ib(GO:0048007) |
| 2.0 | 2.0 | GO:1902232 | regulation of positive thymic T cell selection(GO:1902232) |
| 2.0 | 6.0 | GO:0046271 | phenylpropanoid catabolic process(GO:0046271) |
| 2.0 | 7.9 | GO:1904428 | negative regulation of tubulin deacetylation(GO:1904428) |
| 1.9 | 19.5 | GO:0002430 | complement receptor mediated signaling pathway(GO:0002430) |
| 1.9 | 5.8 | GO:1905071 | occluding junction disassembly(GO:1905071) regulation of occluding junction disassembly(GO:1905073) positive regulation of occluding junction disassembly(GO:1905075) |
| 1.9 | 9.5 | GO:0071895 | odontoblast differentiation(GO:0071895) |
| 1.9 | 9.5 | GO:2000503 | regulation of natural killer cell chemotaxis(GO:2000501) positive regulation of natural killer cell chemotaxis(GO:2000503) |
| 1.9 | 9.3 | GO:1902523 | negative regulation of nucleotide-binding oligomerization domain containing signaling pathway(GO:0070425) negative regulation of nucleotide-binding oligomerization domain containing 2 signaling pathway(GO:0070433) positive regulation of protein K63-linked ubiquitination(GO:1902523) |
| 1.8 | 24.0 | GO:1900017 | positive regulation of cytokine production involved in inflammatory response(GO:1900017) |
| 1.8 | 3.6 | GO:0001810 | regulation of type I hypersensitivity(GO:0001810) positive regulation of type I hypersensitivity(GO:0001812) type I hypersensitivity(GO:0016068) |
| 1.8 | 5.3 | GO:0007343 | egg activation(GO:0007343) |
| 1.7 | 12.1 | GO:0015705 | iodide transport(GO:0015705) |
| 1.7 | 5.2 | GO:0098582 | innate vocalization behavior(GO:0098582) |
| 1.7 | 8.5 | GO:0051673 | membrane disruption in other organism(GO:0051673) |
| 1.7 | 10.1 | GO:0061737 | leukotriene signaling pathway(GO:0061737) |
| 1.6 | 4.9 | GO:0018242 | protein O-linked glycosylation via serine(GO:0018242) |
| 1.6 | 4.9 | GO:1904529 | regulation of actin filament binding(GO:1904529) regulation of actin binding(GO:1904616) |
| 1.6 | 22.7 | GO:0047484 | regulation of response to osmotic stress(GO:0047484) |
| 1.6 | 9.5 | GO:0060267 | positive regulation of respiratory burst(GO:0060267) |
| 1.6 | 14.1 | GO:0007217 | tachykinin receptor signaling pathway(GO:0007217) |
| 1.6 | 9.4 | GO:0010793 | regulation of mRNA export from nucleus(GO:0010793) |
| 1.6 | 28.2 | GO:0040015 | negative regulation of multicellular organism growth(GO:0040015) |
| 1.6 | 1.6 | GO:0032714 | negative regulation of interleukin-5 production(GO:0032714) |
| 1.6 | 48.2 | GO:0071800 | podosome assembly(GO:0071800) |
| 1.5 | 13.9 | GO:1904262 | negative regulation of TORC1 signaling(GO:1904262) |
| 1.5 | 4.6 | GO:1903028 | positive regulation of opsonization(GO:1903028) |
| 1.5 | 4.6 | GO:0070845 | misfolded protein transport(GO:0070843) polyubiquitinated protein transport(GO:0070844) polyubiquitinated misfolded protein transport(GO:0070845) Hsp90 deacetylation(GO:0070846) |
| 1.5 | 12.1 | GO:0035771 | interleukin-4-mediated signaling pathway(GO:0035771) |
| 1.5 | 3.0 | GO:0071225 | cellular response to muramyl dipeptide(GO:0071225) |
| 1.5 | 4.5 | GO:1905204 | regulation of connective tissue replacement involved in inflammatory response wound healing(GO:1904596) negative regulation of connective tissue replacement involved in inflammatory response wound healing(GO:1904597) regulation of advanced glycation end-product receptor activity(GO:1904603) negative regulation of advanced glycation end-product receptor activity(GO:1904604) negative regulation of connective tissue replacement(GO:1905204) |
| 1.5 | 11.9 | GO:2001268 | negative regulation of cysteine-type endopeptidase activity involved in apoptotic signaling pathway(GO:2001268) |
| 1.5 | 7.4 | GO:1904501 | glial cell fate determination(GO:0007403) canonical Wnt signaling pathway involved in positive regulation of cardiac outflow tract cell proliferation(GO:0061324) regulation of chromatin-mediated maintenance of transcription(GO:1904499) positive regulation of chromatin-mediated maintenance of transcription(GO:1904501) regulation of euchromatin binding(GO:1904793) |
| 1.5 | 13.2 | GO:1901552 | positive regulation of endothelial cell development(GO:1901552) positive regulation of establishment of endothelial barrier(GO:1903142) |
| 1.4 | 17.0 | GO:1900028 | negative regulation of ruffle assembly(GO:1900028) |
| 1.4 | 5.5 | GO:0060335 | positive regulation of response to interferon-gamma(GO:0060332) positive regulation of interferon-gamma-mediated signaling pathway(GO:0060335) |
| 1.4 | 5.4 | GO:1904640 | response to methionine(GO:1904640) |
| 1.3 | 15.8 | GO:0030321 | transepithelial chloride transport(GO:0030321) |
| 1.3 | 177.5 | GO:0006958 | complement activation, classical pathway(GO:0006958) |
| 1.3 | 53.9 | GO:0048247 | lymphocyte chemotaxis(GO:0048247) |
| 1.3 | 3.9 | GO:0019046 | release from viral latency(GO:0019046) |
| 1.3 | 10.4 | GO:0036444 | calcium ion transmembrane import into mitochondrion(GO:0036444) |
| 1.3 | 1.3 | GO:0045829 | negative regulation of isotype switching(GO:0045829) |
| 1.3 | 9.0 | GO:0097577 | intracellular sequestering of iron ion(GO:0006880) sequestering of iron ion(GO:0097577) |
| 1.3 | 9.0 | GO:0045007 | depurination(GO:0045007) |
| 1.3 | 3.8 | GO:0003430 | growth plate cartilage chondrocyte growth(GO:0003430) growth plate cartilage chondrocyte development(GO:0003431) |
| 1.3 | 10.2 | GO:0001887 | selenium compound metabolic process(GO:0001887) |
| 1.3 | 3.8 | GO:0009386 | translational attenuation(GO:0009386) |
| 1.3 | 5.0 | GO:0002036 | regulation of L-glutamate transport(GO:0002036) |
| 1.3 | 12.6 | GO:1902474 | positive regulation of protein localization to synapse(GO:1902474) |
| 1.3 | 2.5 | GO:0070245 | positive regulation of thymocyte apoptotic process(GO:0070245) |
| 1.2 | 10.0 | GO:0006384 | transcription initiation from RNA polymerase III promoter(GO:0006384) |
| 1.2 | 99.9 | GO:0006968 | cellular defense response(GO:0006968) |
| 1.2 | 3.7 | GO:0097272 | ammonia homeostasis(GO:0097272) |
| 1.2 | 7.3 | GO:1901509 | regulation of endothelial tube morphogenesis(GO:1901509) |
| 1.2 | 4.9 | GO:0048388 | endosomal lumen acidification(GO:0048388) |
| 1.2 | 3.6 | GO:0061760 | antifungal innate immune response(GO:0061760) |
| 1.2 | 3.5 | GO:0010735 | positive regulation of transcription via serum response element binding(GO:0010735) |
| 1.2 | 3.5 | GO:0007518 | myoblast fate determination(GO:0007518) |
| 1.2 | 4.7 | GO:0036135 | Schwann cell migration(GO:0036135) regulation of Schwann cell migration(GO:1900147) |
| 1.2 | 4.7 | GO:2000297 | negative regulation of synapse maturation(GO:2000297) |
| 1.2 | 4.6 | GO:0032929 | negative regulation of superoxide anion generation(GO:0032929) |
| 1.2 | 3.5 | GO:0042701 | progesterone secretion(GO:0042701) |
| 1.1 | 4.6 | GO:0032581 | ER-dependent peroxisome organization(GO:0032581) |
| 1.1 | 2.3 | GO:0033861 | negative regulation of NAD(P)H oxidase activity(GO:0033861) |
| 1.1 | 4.5 | GO:0035627 | ceramide transport(GO:0035627) |
| 1.1 | 17.9 | GO:1903071 | positive regulation of ER-associated ubiquitin-dependent protein catabolic process(GO:1903071) |
| 1.1 | 3.3 | GO:0070837 | dehydroascorbic acid transport(GO:0070837) |
| 1.1 | 7.8 | GO:0032534 | regulation of microvillus assembly(GO:0032534) |
| 1.1 | 3.3 | GO:1990764 | regulation of myofibroblast contraction(GO:1904328) myofibroblast contraction(GO:1990764) |
| 1.1 | 4.4 | GO:0043314 | negative regulation of neutrophil degranulation(GO:0043314) negative regulation of neutrophil activation(GO:1902564) |
| 1.1 | 4.4 | GO:0002266 | follicular dendritic cell activation(GO:0002266) follicular dendritic cell differentiation(GO:0002268) |
| 1.1 | 12.1 | GO:0010756 | positive regulation of plasminogen activation(GO:0010756) |
| 1.1 | 2.2 | GO:0044179 | hemolysis by symbiont of host erythrocytes(GO:0019836) hemolysis in other organism(GO:0044179) hemolysis in other organism involved in symbiotic interaction(GO:0052331) |
| 1.1 | 2.2 | GO:0070634 | transepithelial ammonium transport(GO:0070634) |
| 1.1 | 3.3 | GO:0033159 | negative regulation of protein import into nucleus, translocation(GO:0033159) |
| 1.1 | 14.0 | GO:2001300 | lipoxin metabolic process(GO:2001300) |
| 1.1 | 8.5 | GO:0003172 | primary heart field specification(GO:0003138) sinoatrial valve development(GO:0003172) sinoatrial valve morphogenesis(GO:0003185) |
| 1.1 | 3.2 | GO:0021555 | midbrain-hindbrain boundary morphogenesis(GO:0021555) |
| 1.1 | 14.8 | GO:0042738 | exogenous drug catabolic process(GO:0042738) |
| 1.0 | 5.2 | GO:1904059 | regulation of locomotor rhythm(GO:1904059) |
| 1.0 | 6.3 | GO:0045730 | respiratory burst(GO:0045730) |
| 1.0 | 5.2 | GO:0072757 | cellular response to camptothecin(GO:0072757) |
| 1.0 | 3.1 | GO:0099558 | maintenance of synapse structure(GO:0099558) |
| 1.0 | 15.3 | GO:0010991 | regulation of SMAD protein complex assembly(GO:0010990) negative regulation of SMAD protein complex assembly(GO:0010991) |
| 1.0 | 3.0 | GO:0002361 | CD4-positive, CD25-positive, alpha-beta regulatory T cell differentiation(GO:0002361) |
| 1.0 | 2.0 | GO:0051097 | negative regulation of helicase activity(GO:0051097) |
| 1.0 | 17.0 | GO:0048172 | regulation of short-term neuronal synaptic plasticity(GO:0048172) |
| 1.0 | 4.9 | GO:1902037 | negative regulation of hematopoietic stem cell differentiation(GO:1902037) |
| 1.0 | 2.9 | GO:0034183 | negative regulation of maintenance of sister chromatid cohesion(GO:0034092) negative regulation of maintenance of mitotic sister chromatid cohesion(GO:0034183) maintenance of mitotic sister chromatid cohesion, telomeric(GO:0099403) mitotic sister chromatid cohesion, telomeric(GO:0099404) regulation of maintenance of mitotic sister chromatid cohesion, telomeric(GO:1904907) negative regulation of maintenance of mitotic sister chromatid cohesion, telomeric(GO:1904908) |
| 1.0 | 13.6 | GO:1901741 | positive regulation of myoblast fusion(GO:1901741) |
| 1.0 | 4.8 | GO:1903690 | negative regulation of wound healing, spreading of epidermal cells(GO:1903690) |
| 1.0 | 15.4 | GO:0090361 | platelet-derived growth factor production(GO:0090360) regulation of platelet-derived growth factor production(GO:0090361) |
| 1.0 | 11.5 | GO:0043031 | negative regulation of macrophage activation(GO:0043031) |
| 0.9 | 3.8 | GO:0007538 | primary sex determination(GO:0007538) |
| 0.9 | 5.6 | GO:0044336 | canonical Wnt signaling pathway involved in negative regulation of apoptotic process(GO:0044336) |
| 0.9 | 0.9 | GO:0045085 | negative regulation of interleukin-2 biosynthetic process(GO:0045085) |
| 0.9 | 4.6 | GO:0016998 | cell wall macromolecule catabolic process(GO:0016998) |
| 0.9 | 2.8 | GO:0030997 | regulation of centriole-centriole cohesion(GO:0030997) |
| 0.9 | 3.7 | GO:2001181 | positive regulation of interleukin-10 secretion(GO:2001181) |
| 0.9 | 1.8 | GO:1903336 | negative regulation of vacuolar transport(GO:1903336) |
| 0.9 | 4.5 | GO:0006546 | glycine catabolic process(GO:0006546) glycine decarboxylation via glycine cleavage system(GO:0019464) |
| 0.9 | 7.2 | GO:0050882 | voluntary musculoskeletal movement(GO:0050882) |
| 0.9 | 1.8 | GO:1900228 | biofilm formation(GO:0042710) single-species biofilm formation(GO:0044010) single-species biofilm formation in or on host organism(GO:0044407) regulation of single-species biofilm formation(GO:1900190) negative regulation of single-species biofilm formation(GO:1900191) regulation of single-species biofilm formation in or on host organism(GO:1900228) negative regulation of single-species biofilm formation in or on host organism(GO:1900229) |
| 0.9 | 5.4 | GO:1901673 | regulation of mitotic spindle assembly(GO:1901673) |
| 0.9 | 2.7 | GO:1990418 | response to insulin-like growth factor stimulus(GO:1990418) |
| 0.9 | 1.7 | GO:0002329 | pre-B cell differentiation(GO:0002329) pre-B cell allelic exclusion(GO:0002331) |
| 0.9 | 5.2 | GO:0035616 | histone H2B conserved C-terminal lysine deubiquitination(GO:0035616) |
| 0.9 | 2.6 | GO:0035625 | epidermal growth factor-activated receptor transactivation by G-protein coupled receptor signaling pathway(GO:0035625) |
| 0.9 | 2.6 | GO:0014063 | negative regulation of serotonin secretion(GO:0014063) |
| 0.9 | 11.2 | GO:0001973 | adenosine receptor signaling pathway(GO:0001973) |
| 0.9 | 2.6 | GO:0051919 | positive regulation of fibrinolysis(GO:0051919) |
| 0.9 | 3.4 | GO:0019470 | 4-hydroxyproline catabolic process(GO:0019470) |
| 0.9 | 6.9 | GO:0035726 | myeloid progenitor cell differentiation(GO:0002318) pro-B cell differentiation(GO:0002328) common myeloid progenitor cell proliferation(GO:0035726) |
| 0.8 | 14.1 | GO:0022010 | central nervous system myelination(GO:0022010) axon ensheathment in central nervous system(GO:0032291) |
| 0.8 | 3.3 | GO:0039516 | modulation by virus of host molecular function(GO:0039506) suppression by virus of host molecular function(GO:0039507) suppression by virus of host catalytic activity(GO:0039513) modulation by virus of host catalytic activity(GO:0039516) suppression by virus of host cysteine-type endopeptidase activity involved in apoptotic process(GO:0039650) negative regulation by symbiont of host catalytic activity(GO:0052053) negative regulation by symbiont of host molecular function(GO:0052056) modulation by symbiont of host catalytic activity(GO:0052148) |
| 0.8 | 9.9 | GO:1904896 | ESCRT complex disassembly(GO:1904896) ESCRT III complex disassembly(GO:1904903) |
| 0.8 | 9.8 | GO:0098912 | membrane depolarization during atrial cardiac muscle cell action potential(GO:0098912) |
| 0.8 | 6.4 | GO:0034625 | fatty acid elongation, saturated fatty acid(GO:0019367) fatty acid elongation, unsaturated fatty acid(GO:0019368) fatty acid elongation, monounsaturated fatty acid(GO:0034625) fatty acid elongation, polyunsaturated fatty acid(GO:0034626) |
| 0.8 | 16.4 | GO:0006044 | N-acetylglucosamine metabolic process(GO:0006044) |
| 0.8 | 3.1 | GO:0070269 | pyroptosis(GO:0070269) |
| 0.8 | 4.6 | GO:2001206 | positive regulation of osteoclast development(GO:2001206) |
| 0.8 | 23.7 | GO:0071108 | protein K48-linked deubiquitination(GO:0071108) |
| 0.8 | 9.9 | GO:1900103 | positive regulation of endoplasmic reticulum unfolded protein response(GO:1900103) |
| 0.7 | 2.2 | GO:1903644 | regulation of chaperone-mediated protein folding(GO:1903644) |
| 0.7 | 6.7 | GO:0034058 | endosomal vesicle fusion(GO:0034058) |
| 0.7 | 17.0 | GO:0016180 | snRNA processing(GO:0016180) |
| 0.7 | 26.4 | GO:2000300 | regulation of synaptic vesicle exocytosis(GO:2000300) |
| 0.7 | 5.1 | GO:0002710 | negative regulation of T cell mediated immunity(GO:0002710) |
| 0.7 | 7.9 | GO:0097116 | postsynaptic density organization(GO:0097106) postsynaptic density assembly(GO:0097107) gephyrin clustering involved in postsynaptic density assembly(GO:0097116) |
| 0.7 | 6.4 | GO:0031087 | deadenylation-independent decapping of nuclear-transcribed mRNA(GO:0031087) |
| 0.7 | 2.1 | GO:0050760 | negative regulation of thymidylate synthase biosynthetic process(GO:0050760) |
| 0.7 | 5.6 | GO:0006685 | sphingomyelin catabolic process(GO:0006685) |
| 0.7 | 4.2 | GO:0031665 | negative regulation of lipopolysaccharide-mediated signaling pathway(GO:0031665) |
| 0.7 | 4.9 | GO:0010890 | positive regulation of sequestering of triglyceride(GO:0010890) |
| 0.7 | 4.2 | GO:0032483 | regulation of Rab protein signal transduction(GO:0032483) |
| 0.7 | 2.1 | GO:1903347 | negative regulation of bicellular tight junction assembly(GO:1903347) |
| 0.7 | 22.8 | GO:0007616 | long-term memory(GO:0007616) |
| 0.7 | 3.4 | GO:0032049 | cardiolipin biosynthetic process(GO:0032049) |
| 0.7 | 9.6 | GO:0043508 | negative regulation of JUN kinase activity(GO:0043508) |
| 0.7 | 3.4 | GO:0051029 | rRNA transport(GO:0051029) |
| 0.7 | 2.0 | GO:0032713 | negative regulation of interleukin-4 production(GO:0032713) |
| 0.7 | 2.0 | GO:1990086 | lens fiber cell apoptotic process(GO:1990086) |
| 0.7 | 4.7 | GO:0070294 | renal sodium ion absorption(GO:0070294) |
| 0.7 | 20.0 | GO:0019430 | removal of superoxide radicals(GO:0019430) |
| 0.7 | 11.3 | GO:0051597 | response to methylmercury(GO:0051597) |
| 0.7 | 1.3 | GO:0002678 | positive regulation of chronic inflammatory response(GO:0002678) |
| 0.7 | 7.8 | GO:0035434 | copper ion transmembrane transport(GO:0035434) |
| 0.6 | 3.2 | GO:0051573 | negative regulation of histone H3-K9 methylation(GO:0051573) |
| 0.6 | 9.7 | GO:0042574 | retinal metabolic process(GO:0042574) |
| 0.6 | 1.3 | GO:1903413 | cellular response to bile acid(GO:1903413) |
| 0.6 | 2.5 | GO:1904924 | negative regulation of mitophagy in response to mitochondrial depolarization(GO:1904924) |
| 0.6 | 5.7 | GO:0006054 | N-acetylneuraminate metabolic process(GO:0006054) |
| 0.6 | 1.3 | GO:2000977 | regulation of forebrain neuron differentiation(GO:2000977) |
| 0.6 | 5.1 | GO:2000467 | positive regulation of glycogen (starch) synthase activity(GO:2000467) |
| 0.6 | 2.5 | GO:0070309 | lens fiber cell morphogenesis(GO:0070309) |
| 0.6 | 5.5 | GO:0098735 | positive regulation of the force of heart contraction(GO:0098735) |
| 0.6 | 8.6 | GO:0007258 | JUN phosphorylation(GO:0007258) |
| 0.6 | 2.4 | GO:0032792 | negative regulation of CREB transcription factor activity(GO:0032792) |
| 0.6 | 16.9 | GO:0032012 | regulation of ARF protein signal transduction(GO:0032012) |
| 0.6 | 4.2 | GO:1904996 | positive regulation of leukocyte adhesion to vascular endothelial cell(GO:1904996) |
| 0.6 | 3.6 | GO:0006701 | progesterone biosynthetic process(GO:0006701) |
| 0.6 | 3.6 | GO:0009595 | detection of biotic stimulus(GO:0009595) |
| 0.6 | 4.1 | GO:1905232 | cellular response to L-glutamate(GO:1905232) |
| 0.6 | 4.1 | GO:0034088 | maintenance of sister chromatid cohesion(GO:0034086) maintenance of mitotic sister chromatid cohesion(GO:0034088) |
| 0.6 | 0.6 | GO:0033076 | isoquinoline alkaloid metabolic process(GO:0033076) |
| 0.6 | 2.3 | GO:0032690 | negative regulation of interleukin-1 alpha production(GO:0032690) negative regulation of interleukin-1 alpha secretion(GO:0050712) |
| 0.6 | 17.2 | GO:0060334 | regulation of interferon-gamma-mediated signaling pathway(GO:0060334) |
| 0.6 | 1.7 | GO:0021658 | rhombomere morphogenesis(GO:0021593) rhombomere 3 morphogenesis(GO:0021658) |
| 0.6 | 25.2 | GO:0071377 | cellular response to glucagon stimulus(GO:0071377) |
| 0.6 | 1.7 | GO:0030573 | bile acid catabolic process(GO:0030573) |
| 0.6 | 9.7 | GO:0050832 | defense response to fungus(GO:0050832) |
| 0.6 | 53.4 | GO:0002433 | immune response-regulating cell surface receptor signaling pathway involved in phagocytosis(GO:0002433) Fc-gamma receptor signaling pathway involved in phagocytosis(GO:0038096) |
| 0.6 | 5.0 | GO:0071265 | L-methionine biosynthetic process(GO:0071265) |
| 0.6 | 14.0 | GO:0098743 | cell aggregation(GO:0098743) |
| 0.6 | 1.7 | GO:0002865 | negative regulation of acute inflammatory response to antigenic stimulus(GO:0002865) |
| 0.6 | 0.6 | GO:0060005 | vestibular reflex(GO:0060005) |
| 0.5 | 15.9 | GO:0046627 | negative regulation of insulin receptor signaling pathway(GO:0046627) |
| 0.5 | 5.5 | GO:0033227 | dsRNA transport(GO:0033227) |
| 0.5 | 4.9 | GO:0048096 | chromatin-mediated maintenance of transcription(GO:0048096) |
| 0.5 | 5.5 | GO:0097688 | AMPA glutamate receptor clustering(GO:0097113) glutamate receptor clustering(GO:0097688) |
| 0.5 | 2.7 | GO:0061088 | sequestering of zinc ion(GO:0032119) regulation of sequestering of zinc ion(GO:0061088) |
| 0.5 | 5.4 | GO:0043619 | regulation of transcription from RNA polymerase II promoter in response to oxidative stress(GO:0043619) |
| 0.5 | 10.3 | GO:0072643 | interferon-gamma secretion(GO:0072643) |
| 0.5 | 5.4 | GO:0050862 | positive regulation of T cell receptor signaling pathway(GO:0050862) |
| 0.5 | 2.7 | GO:0034721 | histone H3-K4 demethylation, trimethyl-H3-K4-specific(GO:0034721) |
| 0.5 | 4.3 | GO:0021513 | spinal cord dorsal/ventral patterning(GO:0021513) |
| 0.5 | 41.6 | GO:0050672 | negative regulation of mononuclear cell proliferation(GO:0032945) negative regulation of lymphocyte proliferation(GO:0050672) |
| 0.5 | 4.3 | GO:0045023 | G0 to G1 transition(GO:0045023) |
| 0.5 | 2.6 | GO:0034959 | neuropeptide catabolic process(GO:0010813) substance P catabolic process(GO:0010814) calcitonin catabolic process(GO:0010816) endothelin maturation(GO:0034959) |
| 0.5 | 2.6 | GO:1903587 | regulation of blood vessel endothelial cell proliferation involved in sprouting angiogenesis(GO:1903587) |
| 0.5 | 11.3 | GO:0090200 | positive regulation of release of cytochrome c from mitochondria(GO:0090200) |
| 0.5 | 5.2 | GO:0010248 | establishment or maintenance of transmembrane electrochemical gradient(GO:0010248) |
| 0.5 | 8.7 | GO:0035090 | maintenance of apical/basal cell polarity(GO:0035090) maintenance of epithelial cell apical/basal polarity(GO:0045199) |
| 0.5 | 31.0 | GO:0031295 | T cell costimulation(GO:0031295) |
| 0.5 | 5.1 | GO:0032264 | IMP salvage(GO:0032264) |
| 0.5 | 4.0 | GO:1900112 | regulation of histone H3-K9 trimethylation(GO:1900112) |
| 0.5 | 19.3 | GO:0048665 | neuron fate specification(GO:0048665) |
| 0.5 | 4.9 | GO:0043152 | induction of bacterial agglutination(GO:0043152) |
| 0.5 | 2.0 | GO:0051697 | protein delipidation(GO:0051697) |
| 0.5 | 4.9 | GO:0043951 | negative regulation of cAMP-mediated signaling(GO:0043951) |
| 0.5 | 2.0 | GO:2000504 | positive regulation of blood vessel remodeling(GO:2000504) |
| 0.5 | 4.4 | GO:2000124 | regulation of endocannabinoid signaling pathway(GO:2000124) |
| 0.5 | 2.9 | GO:0043456 | regulation of pentose-phosphate shunt(GO:0043456) |
| 0.5 | 3.4 | GO:0045110 | intermediate filament bundle assembly(GO:0045110) |
| 0.5 | 8.7 | GO:0070493 | thrombin receptor signaling pathway(GO:0070493) |
| 0.5 | 2.4 | GO:0006741 | NADP biosynthetic process(GO:0006741) |
| 0.5 | 1.9 | GO:0002674 | negative regulation of acute inflammatory response(GO:0002674) |
| 0.5 | 12.3 | GO:0019835 | cytolysis(GO:0019835) |
| 0.5 | 2.3 | GO:0010886 | positive regulation of cholesterol storage(GO:0010886) |
| 0.5 | 6.1 | GO:2000353 | positive regulation of endothelial cell apoptotic process(GO:2000353) |
| 0.5 | 3.3 | GO:0002051 | osteoblast fate commitment(GO:0002051) |
| 0.5 | 5.1 | GO:0021702 | cerebellar Purkinje cell layer formation(GO:0021694) cerebellar Purkinje cell differentiation(GO:0021702) |
| 0.5 | 0.5 | GO:0032687 | negative regulation of interferon-alpha production(GO:0032687) |
| 0.5 | 4.6 | GO:0046600 | negative regulation of centriole replication(GO:0046600) |
| 0.5 | 1.8 | GO:1905224 | clathrin-coated pit assembly(GO:1905224) |
| 0.5 | 9.5 | GO:0051923 | sulfation(GO:0051923) |
| 0.5 | 3.6 | GO:0071569 | protein ufmylation(GO:0071569) |
| 0.4 | 1.8 | GO:0019086 | late viral transcription(GO:0019086) |
| 0.4 | 6.2 | GO:0030050 | vesicle transport along actin filament(GO:0030050) |
| 0.4 | 3.1 | GO:0046851 | negative regulation of bone resorption(GO:0045779) negative regulation of bone remodeling(GO:0046851) |
| 0.4 | 3.9 | GO:0035589 | G-protein coupled purinergic nucleotide receptor signaling pathway(GO:0035589) |
| 0.4 | 6.0 | GO:0015884 | folic acid transport(GO:0015884) |
| 0.4 | 3.0 | GO:0006776 | vitamin A metabolic process(GO:0006776) |
| 0.4 | 1.7 | GO:0010430 | fatty acid omega-oxidation(GO:0010430) |
| 0.4 | 8.3 | GO:0042036 | negative regulation of cytokine biosynthetic process(GO:0042036) |
| 0.4 | 54.9 | GO:0002377 | immunoglobulin production(GO:0002377) |
| 0.4 | 4.6 | GO:1904152 | regulation of retrograde protein transport, ER to cytosol(GO:1904152) |
| 0.4 | 1.7 | GO:0042636 | negative regulation of hair cycle(GO:0042636) |
| 0.4 | 3.7 | GO:0097646 | calcitonin family receptor signaling pathway(GO:0097646) amylin receptor signaling pathway(GO:0097647) |
| 0.4 | 12.6 | GO:0030206 | chondroitin sulfate biosynthetic process(GO:0030206) |
| 0.4 | 4.5 | GO:0035988 | chondrocyte proliferation(GO:0035988) |
| 0.4 | 4.5 | GO:0045725 | positive regulation of glycogen biosynthetic process(GO:0045725) |
| 0.4 | 1.6 | GO:0019082 | viral protein processing(GO:0019082) negative regulation of neurotrophin production(GO:0032900) regulation of nerve growth factor production(GO:0032903) negative regulation of nerve growth factor production(GO:0032904) dibasic protein processing(GO:0090472) |
| 0.4 | 3.2 | GO:0046684 | response to pyrethroid(GO:0046684) |
| 0.4 | 2.8 | GO:0006824 | cobalt ion transport(GO:0006824) |
| 0.4 | 2.8 | GO:0002315 | marginal zone B cell differentiation(GO:0002315) |
| 0.4 | 3.9 | GO:1902592 | viral budding via host ESCRT complex(GO:0039702) viral budding(GO:0046755) multi-organism organelle organization(GO:1902590) multi-organism membrane budding(GO:1902592) |
| 0.4 | 4.2 | GO:0046951 | ketone body biosynthetic process(GO:0046951) |
| 0.4 | 1.9 | GO:0030240 | skeletal muscle thin filament assembly(GO:0030240) mesenchyme migration(GO:0090131) |
| 0.4 | 2.3 | GO:0061343 | cell adhesion involved in heart morphogenesis(GO:0061343) |
| 0.4 | 6.4 | GO:0034497 | protein localization to pre-autophagosomal structure(GO:0034497) |
| 0.4 | 4.1 | GO:0070444 | oligodendrocyte progenitor proliferation(GO:0070444) regulation of oligodendrocyte progenitor proliferation(GO:0070445) |
| 0.4 | 9.0 | GO:0007202 | activation of phospholipase C activity(GO:0007202) |
| 0.4 | 1.9 | GO:2001270 | regulation of cysteine-type endopeptidase activity involved in execution phase of apoptosis(GO:2001270) negative regulation of cysteine-type endopeptidase activity involved in execution phase of apoptosis(GO:2001271) |
| 0.4 | 8.5 | GO:0010669 | epithelial structure maintenance(GO:0010669) |
| 0.4 | 9.2 | GO:0001945 | lymph vessel development(GO:0001945) |
| 0.4 | 1.5 | GO:0006542 | glutamine biosynthetic process(GO:0006542) |
| 0.4 | 1.8 | GO:0033133 | positive regulation of glucokinase activity(GO:0033133) positive regulation of hexokinase activity(GO:1903301) |
| 0.4 | 3.3 | GO:0045721 | negative regulation of gluconeogenesis(GO:0045721) |
| 0.4 | 4.0 | GO:0051775 | response to redox state(GO:0051775) |
| 0.4 | 1.1 | GO:0036233 | glycine import(GO:0036233) |
| 0.4 | 6.5 | GO:0003374 | dynamin polymerization involved in membrane fission(GO:0003373) dynamin polymerization involved in mitochondrial fission(GO:0003374) |
| 0.4 | 6.1 | GO:0043928 | exonucleolytic nuclear-transcribed mRNA catabolic process involved in deadenylation-dependent decay(GO:0043928) |
| 0.4 | 1.8 | GO:0060800 | regulation of cell differentiation involved in embryonic placenta development(GO:0060800) |
| 0.4 | 3.5 | GO:0097094 | craniofacial suture morphogenesis(GO:0097094) |
| 0.4 | 1.8 | GO:0033058 | directional locomotion(GO:0033058) |
| 0.4 | 1.4 | GO:2000480 | negative regulation of cAMP-dependent protein kinase activity(GO:2000480) |
| 0.4 | 1.1 | GO:0042357 | thiamine diphosphate metabolic process(GO:0042357) |
| 0.4 | 1.1 | GO:1990451 | cellular stress response to acidic pH(GO:1990451) |
| 0.4 | 1.1 | GO:0071486 | response to high light intensity(GO:0009644) cellular response to light intensity(GO:0071484) cellular response to high light intensity(GO:0071486) retinal rod cell apoptotic process(GO:0097473) retinal cell apoptotic process(GO:1990009) |
| 0.3 | 3.5 | GO:0010459 | negative regulation of heart rate(GO:0010459) |
| 0.3 | 10.8 | GO:0048268 | clathrin coat assembly(GO:0048268) |
| 0.3 | 0.7 | GO:0033326 | cerebrospinal fluid secretion(GO:0033326) |
| 0.3 | 28.6 | GO:0038083 | peptidyl-tyrosine autophosphorylation(GO:0038083) |
| 0.3 | 2.1 | GO:1902410 | mitotic cytokinetic process(GO:1902410) |
| 0.3 | 3.4 | GO:0030322 | stabilization of membrane potential(GO:0030322) |
| 0.3 | 3.1 | GO:0045072 | regulation of interferon-gamma biosynthetic process(GO:0045072) |
| 0.3 | 1.9 | GO:0001692 | histamine metabolic process(GO:0001692) histidine catabolic process(GO:0006548) imidazole-containing compound catabolic process(GO:0052805) |
| 0.3 | 2.3 | GO:0048793 | pronephros development(GO:0048793) |
| 0.3 | 1.0 | GO:0090283 | regulation of protein glycosylation in Golgi(GO:0090283) negative regulation of protein glycosylation in Golgi(GO:0090285) |
| 0.3 | 2.9 | GO:1990035 | calcium ion import across plasma membrane(GO:0098703) calcium ion import into cell(GO:1990035) |
| 0.3 | 3.8 | GO:0044381 | glucose import in response to insulin stimulus(GO:0044381) |
| 0.3 | 4.2 | GO:0034447 | very-low-density lipoprotein particle clearance(GO:0034447) |
| 0.3 | 6.6 | GO:0019432 | triglyceride biosynthetic process(GO:0019432) |
| 0.3 | 1.6 | GO:0060040 | retinal bipolar neuron differentiation(GO:0060040) |
| 0.3 | 1.9 | GO:0018343 | protein farnesylation(GO:0018343) |
| 0.3 | 5.5 | GO:0060539 | diaphragm development(GO:0060539) |
| 0.3 | 10.1 | GO:0090503 | RNA phosphodiester bond hydrolysis, exonucleolytic(GO:0090503) |
| 0.3 | 1.8 | GO:0061087 | regulation of histone H3-K27 methylation(GO:0061085) positive regulation of histone H3-K27 methylation(GO:0061087) |
| 0.3 | 3.6 | GO:1901078 | negative regulation of relaxation of muscle(GO:1901078) negative regulation of relaxation of cardiac muscle(GO:1901898) |
| 0.3 | 2.7 | GO:0090527 | actin filament reorganization(GO:0090527) |
| 0.3 | 0.9 | GO:1904491 | protein localization to ciliary transition zone(GO:1904491) |
| 0.3 | 2.9 | GO:0007635 | chemosensory behavior(GO:0007635) |
| 0.3 | 5.6 | GO:0033539 | fatty acid beta-oxidation using acyl-CoA dehydrogenase(GO:0033539) |
| 0.3 | 5.8 | GO:0046597 | negative regulation of viral entry into host cell(GO:0046597) |
| 0.3 | 4.6 | GO:0033540 | fatty acid beta-oxidation using acyl-CoA oxidase(GO:0033540) |
| 0.3 | 3.7 | GO:0007196 | adenylate cyclase-inhibiting G-protein coupled glutamate receptor signaling pathway(GO:0007196) |
| 0.3 | 10.9 | GO:0042417 | dopamine metabolic process(GO:0042417) |
| 0.3 | 1.1 | GO:0071896 | protein localization to adherens junction(GO:0071896) |
| 0.3 | 1.1 | GO:0098957 | anterograde axonal transport of mitochondrion(GO:0098957) |
| 0.3 | 1.7 | GO:0021633 | optic nerve structural organization(GO:0021633) |
| 0.3 | 2.5 | GO:0050942 | positive regulation of pigment cell differentiation(GO:0050942) |
| 0.3 | 3.0 | GO:0006268 | DNA unwinding involved in DNA replication(GO:0006268) |
| 0.3 | 2.4 | GO:0048266 | behavioral response to pain(GO:0048266) |
| 0.3 | 7.1 | GO:0021762 | substantia nigra development(GO:0021762) |
| 0.3 | 8.6 | GO:0022400 | regulation of rhodopsin mediated signaling pathway(GO:0022400) |
| 0.3 | 3.2 | GO:0031642 | negative regulation of myelination(GO:0031642) |
| 0.3 | 1.3 | GO:0071651 | positive regulation of chemokine (C-C motif) ligand 5 production(GO:0071651) |
| 0.3 | 12.8 | GO:0030101 | natural killer cell activation(GO:0030101) |
| 0.3 | 1.1 | GO:0071918 | urea transmembrane transport(GO:0071918) |
| 0.3 | 6.6 | GO:0006768 | biotin metabolic process(GO:0006768) |
| 0.3 | 5.5 | GO:0035640 | exploration behavior(GO:0035640) |
| 0.3 | 5.5 | GO:0048873 | homeostasis of number of cells within a tissue(GO:0048873) |
| 0.3 | 3.1 | GO:0008053 | mitochondrial fusion(GO:0008053) |
| 0.3 | 3.6 | GO:0032506 | cytokinetic process(GO:0032506) |
| 0.3 | 17.6 | GO:0016079 | synaptic vesicle exocytosis(GO:0016079) |
| 0.3 | 1.5 | GO:0048630 | skeletal muscle tissue growth(GO:0048630) |
| 0.3 | 6.5 | GO:0051931 | regulation of sensory perception of pain(GO:0051930) regulation of sensory perception(GO:0051931) |
| 0.2 | 1.0 | GO:0072369 | regulation of lipid transport by positive regulation of transcription from RNA polymerase II promoter(GO:0072369) |
| 0.2 | 3.5 | GO:0090110 | cargo loading into COPII-coated vesicle(GO:0090110) |
| 0.2 | 1.5 | GO:1900027 | regulation of ruffle assembly(GO:1900027) |
| 0.2 | 11.1 | GO:1902475 | L-alpha-amino acid transmembrane transport(GO:1902475) |
| 0.2 | 3.6 | GO:0051560 | mitochondrial calcium ion homeostasis(GO:0051560) |
| 0.2 | 1.9 | GO:0070995 | NADPH oxidation(GO:0070995) |
| 0.2 | 2.6 | GO:0060081 | membrane hyperpolarization(GO:0060081) |
| 0.2 | 6.8 | GO:0035338 | long-chain fatty-acyl-CoA biosynthetic process(GO:0035338) |
| 0.2 | 1.4 | GO:0050955 | thermoception(GO:0050955) |
| 0.2 | 11.6 | GO:0034260 | negative regulation of GTPase activity(GO:0034260) |
| 0.2 | 1.4 | GO:0071104 | response to interleukin-9(GO:0071104) |
| 0.2 | 0.7 | GO:0015842 | aminergic neurotransmitter loading into synaptic vesicle(GO:0015842) neurotransmitter loading into synaptic vesicle(GO:0098700) |
| 0.2 | 1.2 | GO:0061084 | regulation of protein refolding(GO:0061083) negative regulation of protein refolding(GO:0061084) regulation of protein folding(GO:1903332) negative regulation of protein folding(GO:1903333) |
| 0.2 | 1.1 | GO:0042487 | regulation of odontogenesis of dentin-containing tooth(GO:0042487) |
| 0.2 | 0.9 | GO:0031987 | locomotion involved in locomotory behavior(GO:0031987) |
| 0.2 | 5.4 | GO:0060561 | apoptotic process involved in morphogenesis(GO:0060561) |
| 0.2 | 0.9 | GO:0035385 | Roundabout signaling pathway(GO:0035385) |
| 0.2 | 4.8 | GO:0090314 | positive regulation of protein targeting to membrane(GO:0090314) |
| 0.2 | 5.2 | GO:0033198 | response to ATP(GO:0033198) |
| 0.2 | 70.1 | GO:0051056 | regulation of small GTPase mediated signal transduction(GO:0051056) |
| 0.2 | 2.8 | GO:0070914 | UV-damage excision repair(GO:0070914) |
| 0.2 | 0.2 | GO:2000015 | regulation of determination of dorsal identity(GO:2000015) |
| 0.2 | 0.6 | GO:0016256 | N-glycan processing to lysosome(GO:0016256) |
| 0.2 | 3.4 | GO:0090140 | regulation of mitochondrial fission(GO:0090140) |
| 0.2 | 1.7 | GO:0030207 | chondroitin sulfate catabolic process(GO:0030207) |
| 0.2 | 5.7 | GO:0060384 | innervation(GO:0060384) |
| 0.2 | 1.5 | GO:0043569 | negative regulation of insulin-like growth factor receptor signaling pathway(GO:0043569) |
| 0.2 | 2.1 | GO:0007320 | insemination(GO:0007320) |
| 0.2 | 0.8 | GO:0007603 | phototransduction, visible light(GO:0007603) |
| 0.2 | 0.8 | GO:0034392 | negative regulation of smooth muscle cell apoptotic process(GO:0034392) |
| 0.2 | 7.8 | GO:0070098 | chemokine-mediated signaling pathway(GO:0070098) |
| 0.2 | 8.5 | GO:0045600 | positive regulation of fat cell differentiation(GO:0045600) |
| 0.2 | 0.8 | GO:0014827 | intestine smooth muscle contraction(GO:0014827) gastro-intestinal system smooth muscle contraction(GO:0014831) |
| 0.2 | 1.0 | GO:0086043 | bundle of His cell to Purkinje myocyte signaling(GO:0086028) bundle of His cell action potential(GO:0086043) |
| 0.2 | 4.4 | GO:0015695 | organic cation transport(GO:0015695) |
| 0.2 | 2.5 | GO:0007016 | cytoskeletal anchoring at plasma membrane(GO:0007016) |
| 0.2 | 9.2 | GO:0021510 | spinal cord development(GO:0021510) |
| 0.2 | 2.4 | GO:0010569 | regulation of double-strand break repair via homologous recombination(GO:0010569) |
| 0.2 | 2.8 | GO:0031935 | regulation of chromatin silencing(GO:0031935) |
| 0.2 | 2.9 | GO:0006895 | Golgi to endosome transport(GO:0006895) |
| 0.2 | 6.9 | GO:0086010 | membrane depolarization during action potential(GO:0086010) |
| 0.2 | 1.5 | GO:0001514 | selenocysteine incorporation(GO:0001514) translational readthrough(GO:0006451) |
| 0.2 | 1.5 | GO:0044241 | lipid digestion(GO:0044241) |
| 0.2 | 2.0 | GO:0010801 | negative regulation of peptidyl-threonine phosphorylation(GO:0010801) |
| 0.2 | 12.5 | GO:0030183 | B cell differentiation(GO:0030183) |
| 0.2 | 6.0 | GO:0000083 | regulation of transcription involved in G1/S transition of mitotic cell cycle(GO:0000083) |
| 0.2 | 0.9 | GO:0014894 | response to muscle inactivity involved in regulation of muscle adaptation(GO:0014877) response to denervation involved in regulation of muscle adaptation(GO:0014894) |
| 0.2 | 0.3 | GO:0006524 | alanine metabolic process(GO:0006522) alanine catabolic process(GO:0006524) pyruvate family amino acid metabolic process(GO:0009078) pyruvate family amino acid catabolic process(GO:0009080) |
| 0.2 | 7.1 | GO:1901385 | regulation of voltage-gated calcium channel activity(GO:1901385) |
| 0.2 | 1.5 | GO:0044341 | sodium-dependent phosphate transport(GO:0044341) |
| 0.2 | 0.5 | GO:0071395 | response to jasmonic acid(GO:0009753) cellular response to jasmonic acid stimulus(GO:0071395) |
| 0.2 | 13.0 | GO:0010508 | positive regulation of autophagy(GO:0010508) |
| 0.2 | 5.4 | GO:0032456 | endocytic recycling(GO:0032456) |
| 0.2 | 2.2 | GO:0006751 | glutathione catabolic process(GO:0006751) |
| 0.2 | 3.2 | GO:0018345 | protein palmitoylation(GO:0018345) |
| 0.2 | 23.8 | GO:0006614 | SRP-dependent cotranslational protein targeting to membrane(GO:0006614) |
| 0.1 | 6.1 | GO:0006376 | mRNA splice site selection(GO:0006376) |
| 0.1 | 0.3 | GO:0048739 | cardiac muscle fiber development(GO:0048739) |
| 0.1 | 7.3 | GO:0018279 | protein N-linked glycosylation via asparagine(GO:0018279) |
| 0.1 | 0.4 | GO:0000266 | mitochondrial fission(GO:0000266) |
| 0.1 | 1.9 | GO:0033617 | mitochondrial respiratory chain complex IV assembly(GO:0033617) mitochondrial respiratory chain complex IV biogenesis(GO:0097034) |
| 0.1 | 5.7 | GO:0000245 | spliceosomal complex assembly(GO:0000245) |
| 0.1 | 2.0 | GO:0036159 | outer dynein arm assembly(GO:0036158) inner dynein arm assembly(GO:0036159) |
| 0.1 | 1.0 | GO:0035864 | response to potassium ion(GO:0035864) |
| 0.1 | 1.5 | GO:0051256 | mitotic spindle midzone assembly(GO:0051256) |
| 0.1 | 4.9 | GO:0006198 | cAMP catabolic process(GO:0006198) |
| 0.1 | 0.5 | GO:0015677 | copper ion import(GO:0015677) ferric iron import into cell(GO:0097461) ferric iron import across plasma membrane(GO:0098706) |
| 0.1 | 0.5 | GO:0019441 | tryptophan catabolic process to kynurenine(GO:0019441) |
| 0.1 | 0.4 | GO:0038193 | thromboxane A2 signaling pathway(GO:0038193) |
| 0.1 | 3.8 | GO:0033344 | cholesterol efflux(GO:0033344) |
| 0.1 | 0.9 | GO:0035583 | sequestering of TGFbeta in extracellular matrix(GO:0035583) |
| 0.1 | 2.9 | GO:0007205 | protein kinase C-activating G-protein coupled receptor signaling pathway(GO:0007205) |
| 0.1 | 0.6 | GO:0045056 | transcytosis(GO:0045056) |
| 0.1 | 0.5 | GO:0090394 | negative regulation of excitatory postsynaptic potential(GO:0090394) |
| 0.1 | 2.8 | GO:0035411 | catenin import into nucleus(GO:0035411) |
| 0.1 | 0.7 | GO:0070829 | response to vitamin B2(GO:0033274) heterochromatin maintenance(GO:0070829) |
| 0.1 | 0.6 | GO:0015742 | alpha-ketoglutarate transport(GO:0015742) |
| 0.1 | 1.6 | GO:0009584 | detection of visible light(GO:0009584) |
| 0.1 | 1.7 | GO:0006700 | C21-steroid hormone biosynthetic process(GO:0006700) |
| 0.1 | 2.3 | GO:0071526 | semaphorin-plexin signaling pathway(GO:0071526) |
| 0.1 | 1.5 | GO:0048147 | negative regulation of fibroblast proliferation(GO:0048147) |
| 0.1 | 0.2 | GO:0003160 | endocardium morphogenesis(GO:0003160) endocardium formation(GO:0060214) |
| 0.1 | 4.2 | GO:0007223 | Wnt signaling pathway, calcium modulating pathway(GO:0007223) |
| 0.1 | 1.4 | GO:0090278 | negative regulation of peptide hormone secretion(GO:0090278) |
| 0.1 | 1.5 | GO:0045161 | neuronal ion channel clustering(GO:0045161) |
| 0.1 | 1.5 | GO:0007413 | axonal fasciculation(GO:0007413) |
| 0.1 | 1.0 | GO:0005979 | regulation of glycogen biosynthetic process(GO:0005979) regulation of glucan biosynthetic process(GO:0010962) |
| 0.1 | 0.3 | GO:1904528 | regulation of microtubule plus-end binding(GO:1903031) positive regulation of microtubule plus-end binding(GO:1903033) positive regulation of microtubule binding(GO:1904528) |
| 0.1 | 1.6 | GO:0061436 | regulation of water loss via skin(GO:0033561) establishment of skin barrier(GO:0061436) |
| 0.1 | 1.0 | GO:0070932 | histone H3 deacetylation(GO:0070932) |
| 0.1 | 1.0 | GO:0010663 | positive regulation of striated muscle cell apoptotic process(GO:0010663) positive regulation of cardiac muscle cell apoptotic process(GO:0010666) |
| 0.1 | 1.6 | GO:0003197 | endocardial cushion development(GO:0003197) |
| 0.1 | 6.7 | GO:0019722 | calcium-mediated signaling(GO:0019722) |
| 0.1 | 0.7 | GO:0043300 | regulation of leukocyte degranulation(GO:0043300) |
| 0.1 | 2.4 | GO:0006622 | protein targeting to lysosome(GO:0006622) |
| 0.1 | 0.2 | GO:0048023 | positive regulation of melanin biosynthetic process(GO:0048023) positive regulation of secondary metabolite biosynthetic process(GO:1900378) |
| 0.1 | 0.4 | GO:0042908 | xenobiotic transport(GO:0042908) |
| 0.1 | 4.9 | GO:0010923 | negative regulation of phosphatase activity(GO:0010923) |
| 0.1 | 3.8 | GO:0071277 | cellular response to calcium ion(GO:0071277) |
| 0.1 | 1.3 | GO:0035082 | axoneme assembly(GO:0035082) |
| 0.1 | 2.2 | GO:0003333 | amino acid transmembrane transport(GO:0003333) |
| 0.1 | 2.6 | GO:0030512 | negative regulation of transforming growth factor beta receptor signaling pathway(GO:0030512) |
| 0.1 | 0.2 | GO:1900383 | regulation of synaptic plasticity by receptor localization to synapse(GO:1900383) |
| 0.1 | 2.9 | GO:1901216 | positive regulation of neuron death(GO:1901216) |
| 0.1 | 2.9 | GO:0032092 | positive regulation of protein binding(GO:0032092) |
| 0.1 | 1.7 | GO:0005980 | glycogen catabolic process(GO:0005980) |
| 0.1 | 2.4 | GO:0007157 | heterophilic cell-cell adhesion via plasma membrane cell adhesion molecules(GO:0007157) |
| 0.1 | 2.5 | GO:0000045 | autophagosome assembly(GO:0000045) |
| 0.1 | 0.2 | GO:1904354 | negative regulation of telomere capping(GO:1904354) |
| 0.1 | 0.2 | GO:0016255 | attachment of GPI anchor to protein(GO:0016255) |
| 0.1 | 0.3 | GO:0016973 | poly(A)+ mRNA export from nucleus(GO:0016973) |
| 0.1 | 0.9 | GO:0046949 | fatty-acyl-CoA biosynthetic process(GO:0046949) |
| 0.1 | 0.4 | GO:1901475 | pyruvate transport(GO:0006848) pyruvate transmembrane transport(GO:1901475) |
| 0.1 | 1.3 | GO:0032024 | positive regulation of insulin secretion(GO:0032024) |
| 0.1 | 5.8 | GO:0007608 | sensory perception of smell(GO:0007608) |
| 0.1 | 2.0 | GO:0030490 | maturation of SSU-rRNA(GO:0030490) |
| 0.0 | 3.7 | GO:0006369 | termination of RNA polymerase II transcription(GO:0006369) |
| 0.0 | 5.7 | GO:0007605 | sensory perception of sound(GO:0007605) |
| 0.0 | 1.9 | GO:0071391 | cellular response to estrogen stimulus(GO:0071391) |
| 0.0 | 0.4 | GO:0007379 | segment specification(GO:0007379) |
| 0.0 | 0.9 | GO:0006228 | UTP biosynthetic process(GO:0006228) |
| 0.0 | 1.3 | GO:0010107 | potassium ion import(GO:0010107) |
| 0.0 | 0.4 | GO:0071492 | cellular response to UV-A(GO:0071492) |
| 0.0 | 0.4 | GO:0017182 | peptidyl-diphthamide metabolic process(GO:0017182) peptidyl-diphthamide biosynthetic process from peptidyl-histidine(GO:0017183) |
| 0.0 | 0.4 | GO:0050746 | regulation of lipoprotein metabolic process(GO:0050746) |
| 0.0 | 0.6 | GO:0007158 | neuron cell-cell adhesion(GO:0007158) |
| 0.0 | 0.7 | GO:0009235 | cobalamin metabolic process(GO:0009235) |
| 0.0 | 0.2 | GO:0034344 | type III interferon production(GO:0034343) regulation of type III interferon production(GO:0034344) |
| 0.0 | 0.4 | GO:0007250 | activation of NF-kappaB-inducing kinase activity(GO:0007250) |
| 0.0 | 0.1 | GO:0051414 | response to cortisol(GO:0051414) |
| 0.0 | 0.3 | GO:2000811 | negative regulation of anoikis(GO:2000811) |
| 0.0 | 0.6 | GO:0001756 | somitogenesis(GO:0001756) |
| 0.0 | 0.5 | GO:0006884 | cell volume homeostasis(GO:0006884) |
| 0.0 | 0.4 | GO:2000179 | positive regulation of neural precursor cell proliferation(GO:2000179) |
| 0.0 | 0.4 | GO:0035999 | tetrahydrofolate interconversion(GO:0035999) |
| 0.0 | 0.5 | GO:0072661 | protein targeting to plasma membrane(GO:0072661) |
| 0.0 | 0.1 | GO:0090675 | intermicrovillar adhesion(GO:0090675) |
| 0.0 | 0.1 | GO:0007207 | adenylate cyclase-inhibiting G-protein coupled acetylcholine receptor signaling pathway(GO:0007197) phospholipase C-activating G-protein coupled acetylcholine receptor signaling pathway(GO:0007207) |
| 0.0 | 0.7 | GO:0001707 | mesoderm formation(GO:0001707) |
| 0.0 | 0.5 | GO:0030166 | proteoglycan biosynthetic process(GO:0030166) |
| 0.0 | 0.2 | GO:0007042 | lysosomal lumen acidification(GO:0007042) |
| 0.0 | 0.4 | GO:0006833 | water transport(GO:0006833) |
| 0.0 | 0.4 | GO:0032755 | positive regulation of interleukin-6 production(GO:0032755) |
| 0.0 | 0.1 | GO:0060051 | negative regulation of protein glycosylation(GO:0060051) |
| 0.0 | 0.9 | GO:0060337 | type I interferon signaling pathway(GO:0060337) cellular response to type I interferon(GO:0071357) |
Gene overrepresentation in cellular component category:
| Log-likelihood per target | Total log-likelihood | Term | Description |
|---|---|---|---|
| 13.1 | 39.2 | GO:0071753 | IgM immunoglobulin complex(GO:0071753) IgM immunoglobulin complex, circulating(GO:0071754) pentameric IgM immunoglobulin complex(GO:0071756) |
| 12.8 | 51.2 | GO:0031838 | haptoglobin-hemoglobin complex(GO:0031838) |
| 7.4 | 29.5 | GO:0034669 | integrin alpha4-beta7 complex(GO:0034669) |
| 5.7 | 34.4 | GO:1990682 | CSF1-CSF1R complex(GO:1990682) |
| 5.7 | 22.8 | GO:0005602 | complement component C1 complex(GO:0005602) |
| 4.7 | 14.0 | GO:0090571 | RNA polymerase II transcription repressor complex(GO:0090571) |
| 4.6 | 27.4 | GO:0097013 | phagocytic vesicle lumen(GO:0097013) |
| 3.6 | 92.4 | GO:0001891 | phagocytic cup(GO:0001891) |
| 3.3 | 10.0 | GO:0035354 | Toll-like receptor 1-Toll-like receptor 2 protein complex(GO:0035354) |
| 3.0 | 18.3 | GO:0033269 | internode region of axon(GO:0033269) |
| 2.9 | 55.9 | GO:0042613 | MHC class II protein complex(GO:0042613) |
| 2.8 | 14.2 | GO:0019815 | B cell receptor complex(GO:0019815) |
| 2.6 | 10.4 | GO:1990246 | uniplex complex(GO:1990246) |
| 2.6 | 17.9 | GO:1990037 | Lewy body core(GO:1990037) |
| 2.5 | 32.7 | GO:0005833 | hemoglobin complex(GO:0005833) |
| 2.5 | 9.9 | GO:1990578 | perinuclear endoplasmic reticulum membrane(GO:1990578) |
| 2.4 | 12.1 | GO:0001652 | granular component(GO:0001652) |
| 2.4 | 7.2 | GO:0036398 | TCR signalosome(GO:0036398) |
| 2.3 | 11.6 | GO:0031232 | extrinsic component of external side of plasma membrane(GO:0031232) |
| 2.3 | 16.2 | GO:0044326 | dendritic spine neck(GO:0044326) |
| 2.3 | 9.0 | GO:0070288 | intracellular ferritin complex(GO:0008043) ferritin complex(GO:0070288) |
| 2.1 | 31.8 | GO:0005687 | U4 snRNP(GO:0005687) |
| 1.9 | 1.9 | GO:0042643 | actomyosin, actin portion(GO:0042643) |
| 1.9 | 13.0 | GO:1990130 | Iml1 complex(GO:1990130) |
| 1.8 | 24.6 | GO:0017146 | NMDA selective glutamate receptor complex(GO:0017146) |
| 1.7 | 26.6 | GO:0030130 | clathrin coat of trans-Golgi network vesicle(GO:0030130) |
| 1.7 | 5.0 | GO:0070701 | mucus layer(GO:0070701) |
| 1.6 | 8.2 | GO:0072534 | perineuronal net(GO:0072534) |
| 1.4 | 29.8 | GO:0001931 | uropod(GO:0001931) cell trailing edge(GO:0031254) |
| 1.4 | 15.4 | GO:0060171 | stereocilium membrane(GO:0060171) |
| 1.4 | 7.0 | GO:0089701 | U2AF(GO:0089701) |
| 1.4 | 4.1 | GO:0032116 | SMC loading complex(GO:0032116) |
| 1.3 | 4.0 | GO:0070931 | Golgi-associated vesicle lumen(GO:0070931) |
| 1.3 | 5.2 | GO:0016514 | SWI/SNF complex(GO:0016514) |
| 1.3 | 36.7 | GO:0042101 | T cell receptor complex(GO:0042101) |
| 1.3 | 16.3 | GO:0035749 | myelin sheath adaxonal region(GO:0035749) |
| 1.2 | 7.4 | GO:0034750 | Scrib-APC-beta-catenin complex(GO:0034750) |
| 1.2 | 4.9 | GO:0005899 | insulin receptor complex(GO:0005899) |
| 1.2 | 9.4 | GO:0035976 | AP1 complex(GO:0035976) |
| 1.2 | 21.0 | GO:0031089 | platelet dense granule lumen(GO:0031089) |
| 1.1 | 17.0 | GO:0043020 | NADPH oxidase complex(GO:0043020) |
| 1.1 | 10.0 | GO:0090576 | RNA polymerase III transcription factor complex(GO:0090576) |
| 1.1 | 4.4 | GO:0033257 | Bcl3/NF-kappaB2 complex(GO:0033257) |
| 1.1 | 3.3 | GO:0034455 | t-UTP complex(GO:0034455) |
| 1.0 | 10.1 | GO:0005964 | phosphorylase kinase complex(GO:0005964) |
| 1.0 | 4.9 | GO:0071012 | catalytic step 1 spliceosome(GO:0071012) |
| 1.0 | 2.9 | GO:0031933 | telomeric heterochromatin(GO:0031933) |
| 0.9 | 52.0 | GO:0001772 | immunological synapse(GO:0001772) |
| 0.9 | 4.7 | GO:0030314 | junctional membrane complex(GO:0030314) |
| 0.9 | 19.6 | GO:0008305 | integrin complex(GO:0008305) protein complex involved in cell adhesion(GO:0098636) |
| 0.9 | 8.4 | GO:0097208 | alveolar lamellar body(GO:0097208) |
| 0.9 | 10.9 | GO:0043240 | Fanconi anaemia nuclear complex(GO:0043240) |
| 0.9 | 3.4 | GO:0033596 | TSC1-TSC2 complex(GO:0033596) |
| 0.8 | 9.9 | GO:0046658 | anchored component of plasma membrane(GO:0046658) |
| 0.8 | 12.3 | GO:0097433 | dense body(GO:0097433) |
| 0.8 | 4.0 | GO:0044308 | axonal spine(GO:0044308) |
| 0.8 | 9.5 | GO:1990907 | beta-catenin-TCF complex(GO:1990907) |
| 0.8 | 3.8 | GO:0044754 | autolysosome(GO:0044754) |
| 0.8 | 7.7 | GO:0042567 | insulin-like growth factor ternary complex(GO:0042567) |
| 0.8 | 6.0 | GO:0097504 | Gemini of coiled bodies(GO:0097504) |
| 0.7 | 3.6 | GO:0071565 | nBAF complex(GO:0071565) |
| 0.7 | 11.4 | GO:0005890 | sodium:potassium-exchanging ATPase complex(GO:0005890) |
| 0.7 | 2.1 | GO:1990761 | growth cone lamellipodium(GO:1990761) |
| 0.7 | 29.7 | GO:0031228 | intrinsic component of Golgi membrane(GO:0031228) |
| 0.7 | 10.9 | GO:0097512 | cardiac myofibril(GO:0097512) |
| 0.7 | 64.5 | GO:0101003 | ficolin-1-rich granule membrane(GO:0101003) |
| 0.7 | 7.2 | GO:0005955 | calcineurin complex(GO:0005955) |
| 0.6 | 3.2 | GO:0010009 | cytoplasmic side of endosome membrane(GO:0010009) |
| 0.6 | 3.2 | GO:0030981 | cortical microtubule cytoskeleton(GO:0030981) |
| 0.6 | 8.8 | GO:0032045 | guanyl-nucleotide exchange factor complex(GO:0032045) |
| 0.6 | 2.5 | GO:0035363 | histone locus body(GO:0035363) |
| 0.6 | 3.7 | GO:0035748 | myelin sheath abaxonal region(GO:0035748) |
| 0.6 | 1.8 | GO:0032009 | early phagosome(GO:0032009) |
| 0.6 | 5.5 | GO:0098839 | postsynaptic density membrane(GO:0098839) |
| 0.6 | 7.1 | GO:0061702 | inflammasome complex(GO:0061702) |
| 0.6 | 4.1 | GO:1990635 | proximal dendrite(GO:1990635) |
| 0.6 | 28.9 | GO:0019814 | immunoglobulin complex(GO:0019814) |
| 0.6 | 15.4 | GO:0034362 | low-density lipoprotein particle(GO:0034362) |
| 0.6 | 3.4 | GO:0045178 | basal part of cell(GO:0045178) |
| 0.6 | 71.9 | GO:0035578 | azurophil granule lumen(GO:0035578) |
| 0.6 | 32.3 | GO:0043198 | dendritic shaft(GO:0043198) |
| 0.6 | 31.1 | GO:0048786 | presynaptic active zone(GO:0048786) |
| 0.5 | 4.9 | GO:0097197 | tetraspanin-enriched microdomain(GO:0097197) |
| 0.5 | 21.7 | GO:0000791 | euchromatin(GO:0000791) |
| 0.5 | 6.8 | GO:0000815 | ESCRT III complex(GO:0000815) |
| 0.5 | 5.2 | GO:0046581 | intercellular canaliculus(GO:0046581) |
| 0.5 | 2.6 | GO:0031302 | intrinsic component of endosome membrane(GO:0031302) |
| 0.5 | 5.4 | GO:0034366 | spherical high-density lipoprotein particle(GO:0034366) |
| 0.5 | 2.5 | GO:0032299 | ribonuclease H2 complex(GO:0032299) |
| 0.5 | 9.8 | GO:1990454 | L-type voltage-gated calcium channel complex(GO:1990454) |
| 0.5 | 6.1 | GO:0000176 | nuclear exosome (RNase complex)(GO:0000176) |
| 0.5 | 33.1 | GO:0005834 | heterotrimeric G-protein complex(GO:0005834) |
| 0.5 | 3.7 | GO:1903439 | calcitonin family receptor complex(GO:1903439) amylin receptor complex(GO:1903440) |
| 0.5 | 5.0 | GO:0032039 | integrator complex(GO:0032039) |
| 0.4 | 7.2 | GO:0031083 | BLOC-1 complex(GO:0031083) |
| 0.4 | 1.8 | GO:0090533 | cation-transporting ATPase complex(GO:0090533) |
| 0.4 | 11.2 | GO:0001518 | voltage-gated sodium channel complex(GO:0001518) |
| 0.4 | 3.1 | GO:0035253 | ciliary rootlet(GO:0035253) |
| 0.4 | 3.1 | GO:0097443 | sorting endosome(GO:0097443) |
| 0.4 | 18.3 | GO:0002102 | podosome(GO:0002102) |
| 0.4 | 1.3 | GO:0030485 | smooth muscle contractile fiber(GO:0030485) |
| 0.4 | 3.8 | GO:0030897 | HOPS complex(GO:0030897) |
| 0.4 | 2.5 | GO:0070022 | transforming growth factor beta receptor homodimeric complex(GO:0070022) |
| 0.4 | 2.9 | GO:0042627 | chylomicron(GO:0042627) |
| 0.4 | 5.4 | GO:0042599 | lamellar body(GO:0042599) |
| 0.4 | 8.6 | GO:0097381 | photoreceptor disc membrane(GO:0097381) |
| 0.4 | 54.2 | GO:0072562 | blood microparticle(GO:0072562) |
| 0.4 | 9.6 | GO:0005849 | mRNA cleavage factor complex(GO:0005849) |
| 0.4 | 9.6 | GO:1904724 | tertiary granule lumen(GO:1904724) |
| 0.4 | 2.0 | GO:0034385 | very-low-density lipoprotein particle(GO:0034361) triglyceride-rich lipoprotein particle(GO:0034385) |
| 0.4 | 5.5 | GO:0030123 | AP-3 adaptor complex(GO:0030123) |
| 0.4 | 1.9 | GO:1990031 | pinceau fiber(GO:1990031) |
| 0.4 | 77.1 | GO:0009898 | cytoplasmic side of plasma membrane(GO:0009898) |
| 0.4 | 26.6 | GO:0022627 | cytosolic small ribosomal subunit(GO:0022627) |
| 0.4 | 1.9 | GO:0071437 | invadopodium(GO:0071437) |
| 0.4 | 10.3 | GO:0005793 | endoplasmic reticulum-Golgi intermediate compartment(GO:0005793) |
| 0.4 | 2.8 | GO:0000110 | nucleotide-excision repair factor 1 complex(GO:0000110) |
| 0.3 | 3.8 | GO:0032593 | insulin-responsive compartment(GO:0032593) |
| 0.3 | 6.1 | GO:0043194 | axon initial segment(GO:0043194) |
| 0.3 | 4.0 | GO:0016281 | eukaryotic translation initiation factor 4F complex(GO:0016281) |
| 0.3 | 7.3 | GO:0032585 | multivesicular body membrane(GO:0032585) |
| 0.3 | 3.9 | GO:0048188 | Set1C/COMPASS complex(GO:0048188) |
| 0.3 | 42.7 | GO:0016605 | PML body(GO:0016605) |
| 0.3 | 43.1 | GO:0031901 | early endosome membrane(GO:0031901) |
| 0.3 | 14.5 | GO:0055038 | recycling endosome membrane(GO:0055038) |
| 0.3 | 2.7 | GO:0019907 | cyclin-dependent protein kinase activating kinase holoenzyme complex(GO:0019907) |
| 0.3 | 1.2 | GO:0000243 | commitment complex(GO:0000243) |
| 0.3 | 2.6 | GO:0097427 | microtubule bundle(GO:0097427) |
| 0.3 | 3.6 | GO:0008074 | guanylate cyclase complex, soluble(GO:0008074) |
| 0.3 | 1.9 | GO:0008282 | ATP-sensitive potassium channel complex(GO:0008282) |
| 0.3 | 5.1 | GO:0036038 | MKS complex(GO:0036038) |
| 0.3 | 1.6 | GO:0005828 | kinetochore microtubule(GO:0005828) |
| 0.3 | 5.0 | GO:0034045 | pre-autophagosomal structure membrane(GO:0034045) |
| 0.3 | 5.4 | GO:0097342 | ripoptosome(GO:0097342) |
| 0.3 | 4.9 | GO:0031092 | platelet alpha granule membrane(GO:0031092) |
| 0.3 | 21.5 | GO:0005901 | caveola(GO:0005901) |
| 0.3 | 4.6 | GO:0000242 | pericentriolar material(GO:0000242) |
| 0.3 | 1.3 | GO:0002080 | acrosomal membrane(GO:0002080) |
| 0.2 | 7.6 | GO:0034451 | centriolar satellite(GO:0034451) |
| 0.2 | 13.0 | GO:1990391 | DNA repair complex(GO:1990391) |
| 0.2 | 2.4 | GO:0005614 | interstitial matrix(GO:0005614) |
| 0.2 | 2.9 | GO:0008290 | F-actin capping protein complex(GO:0008290) |
| 0.2 | 13.8 | GO:0031463 | Cul3-RING ubiquitin ligase complex(GO:0031463) |
| 0.2 | 1.5 | GO:0060091 | kinocilium(GO:0060091) |
| 0.2 | 0.9 | GO:0034673 | inhibin-betaglycan-ActRII complex(GO:0034673) |
| 0.2 | 10.8 | GO:0030134 | ER to Golgi transport vesicle(GO:0030134) |
| 0.2 | 13.5 | GO:0031902 | late endosome membrane(GO:0031902) |
| 0.2 | 22.2 | GO:0043202 | lysosomal lumen(GO:0043202) |
| 0.2 | 1.2 | GO:0031501 | mannosyltransferase complex(GO:0031501) |
| 0.2 | 1.8 | GO:0008024 | cyclin/CDK positive transcription elongation factor complex(GO:0008024) |
| 0.2 | 5.6 | GO:0044322 | endoplasmic reticulum quality control compartment(GO:0044322) |
| 0.2 | 0.8 | GO:0043541 | UDP-N-acetylglucosamine transferase complex(GO:0043541) |
| 0.2 | 3.6 | GO:0000930 | gamma-tubulin complex(GO:0000930) |
| 0.2 | 4.4 | GO:0032839 | dendrite cytoplasm(GO:0032839) |
| 0.2 | 48.3 | GO:0009897 | external side of plasma membrane(GO:0009897) |
| 0.2 | 0.6 | GO:0032426 | stereocilium tip(GO:0032426) |
| 0.2 | 27.5 | GO:0045211 | postsynaptic membrane(GO:0045211) |
| 0.2 | 13.7 | GO:0034707 | chloride channel complex(GO:0034707) |
| 0.2 | 0.7 | GO:1990879 | CST complex(GO:1990879) |
| 0.2 | 1.2 | GO:0097486 | multivesicular body lumen(GO:0097486) |
| 0.2 | 2.1 | GO:0097440 | apical dendrite(GO:0097440) |
| 0.2 | 0.7 | GO:0070081 | clathrin-sculpted vesicle(GO:0060198) clathrin-sculpted monoamine transport vesicle(GO:0070081) clathrin-sculpted monoamine transport vesicle membrane(GO:0070083) |
| 0.2 | 1.9 | GO:0042555 | MCM complex(GO:0042555) |
| 0.2 | 32.6 | GO:0001726 | ruffle(GO:0001726) |
| 0.2 | 4.3 | GO:0031093 | platelet alpha granule lumen(GO:0031093) |
| 0.2 | 1.1 | GO:0097025 | MPP7-DLG1-LIN7 complex(GO:0097025) |
| 0.2 | 3.2 | GO:0042588 | zymogen granule(GO:0042588) |
| 0.2 | 54.7 | GO:0000790 | nuclear chromatin(GO:0000790) |
| 0.1 | 0.4 | GO:0097058 | CRLF-CLCF1 complex(GO:0097058) |
| 0.1 | 1.3 | GO:0000347 | THO complex(GO:0000347) THO complex part of transcription export complex(GO:0000445) |
| 0.1 | 1.7 | GO:0033010 | paranodal junction(GO:0033010) |
| 0.1 | 9.3 | GO:0030672 | synaptic vesicle membrane(GO:0030672) exocytic vesicle membrane(GO:0099501) |
| 0.1 | 6.7 | GO:0005902 | microvillus(GO:0005902) |
| 0.1 | 13.6 | GO:0031225 | anchored component of membrane(GO:0031225) |
| 0.1 | 3.6 | GO:0030119 | AP-type membrane coat adaptor complex(GO:0030119) |
| 0.1 | 1.2 | GO:0030126 | COPI vesicle coat(GO:0030126) |
| 0.1 | 202.2 | GO:0005887 | integral component of plasma membrane(GO:0005887) |
| 0.1 | 1.6 | GO:0005689 | U12-type spliceosomal complex(GO:0005689) |
| 0.1 | 0.2 | GO:0000333 | telomerase catalytic core complex(GO:0000333) |
| 0.1 | 5.0 | GO:0031907 | peroxisomal matrix(GO:0005782) microbody lumen(GO:0031907) |
| 0.1 | 2.5 | GO:0001917 | photoreceptor inner segment(GO:0001917) |
| 0.1 | 2.2 | GO:0005796 | Golgi lumen(GO:0005796) |
| 0.1 | 7.9 | GO:0017053 | transcriptional repressor complex(GO:0017053) |
| 0.1 | 2.0 | GO:0070971 | endoplasmic reticulum exit site(GO:0070971) |
| 0.1 | 1.0 | GO:0042587 | glycogen granule(GO:0042587) |
| 0.1 | 2.6 | GO:0005581 | collagen trimer(GO:0005581) |
| 0.1 | 4.9 | GO:0043235 | receptor complex(GO:0043235) |
| 0.1 | 229.6 | GO:0016021 | integral component of membrane(GO:0016021) |
| 0.1 | 0.3 | GO:0042272 | nuclear RNA export factor complex(GO:0042272) |
| 0.1 | 8.6 | GO:0030427 | site of polarized growth(GO:0030427) |
| 0.1 | 78.3 | GO:0005615 | extracellular space(GO:0005615) |
| 0.1 | 2.1 | GO:0005859 | muscle myosin complex(GO:0005859) |
| 0.1 | 3.5 | GO:0044306 | neuron projection terminus(GO:0044306) |
| 0.1 | 2.1 | GO:0016592 | mediator complex(GO:0016592) |
| 0.1 | 1.3 | GO:0031430 | M band(GO:0031430) |
| 0.1 | 0.7 | GO:0031903 | peroxisomal membrane(GO:0005778) microbody membrane(GO:0031903) |
| 0.0 | 1.3 | GO:0032040 | small-subunit processome(GO:0032040) |
| 0.0 | 1.1 | GO:1902555 | endoribonuclease complex(GO:1902555) |
| 0.0 | 0.5 | GO:0044615 | nuclear pore central transport channel(GO:0044613) nuclear pore nuclear basket(GO:0044615) |
| 0.0 | 0.2 | GO:0097225 | sperm midpiece(GO:0097225) |
| 0.0 | 0.0 | GO:0043291 | RAVE complex(GO:0043291) |
| 0.0 | 0.1 | GO:1905202 | 3-methylcrotonyl-CoA carboxylase complex, mitochondrial(GO:0002169) methylcrotonoyl-CoA carboxylase complex(GO:1905202) |
Gene overrepresentation in molecular function category:
| Log-likelihood per target | Total log-likelihood | Term | Description |
|---|---|---|---|
| 11.9 | 47.7 | GO:0004698 | calcium-dependent protein kinase C activity(GO:0004698) |
| 10.9 | 32.6 | GO:0005011 | macrophage colony-stimulating factor receptor activity(GO:0005011) |
| 5.7 | 28.3 | GO:0004803 | transposase activity(GO:0004803) |
| 5.5 | 22.0 | GO:0004906 | interferon-gamma receptor activity(GO:0004906) |
| 5.1 | 76.4 | GO:0005344 | oxygen transporter activity(GO:0005344) |
| 4.7 | 42.1 | GO:0043426 | MRF binding(GO:0043426) |
| 4.6 | 13.8 | GO:0033749 | histone demethylase activity (H3-R2 specific)(GO:0033746) histone demethylase activity (H4-R3 specific)(GO:0033749) |
| 4.5 | 13.4 | GO:0031755 | endothelial differentiation G-protein coupled receptor binding(GO:0031753) Edg-2 lysophosphatidic acid receptor binding(GO:0031755) |
| 4.5 | 17.8 | GO:0030107 | HLA-A specific inhibitory MHC class I receptor activity(GO:0030107) |
| 4.0 | 15.9 | GO:0042030 | ATPase inhibitor activity(GO:0042030) |
| 4.0 | 23.7 | GO:0016807 | cysteine-type carboxypeptidase activity(GO:0016807) cysteine-type exopeptidase activity(GO:0070004) |
| 3.9 | 27.1 | GO:0070891 | lipoteichoic acid binding(GO:0070891) |
| 3.6 | 10.8 | GO:0005502 | 11-cis retinal binding(GO:0005502) |
| 3.5 | 13.9 | GO:0032396 | inhibitory MHC class I receptor activity(GO:0032396) |
| 3.4 | 10.1 | GO:0004336 | galactosylceramidase activity(GO:0004336) |
| 3.3 | 10.0 | GO:0035663 | Toll-like receptor 2 binding(GO:0035663) |
| 3.3 | 13.2 | GO:0050211 | procollagen galactosyltransferase activity(GO:0050211) |
| 3.2 | 9.7 | GO:0004878 | complement component C5a receptor activity(GO:0004878) |
| 3.1 | 43.8 | GO:0032395 | MHC class II receptor activity(GO:0032395) |
| 3.0 | 12.1 | GO:0004911 | interleukin-2 receptor activity(GO:0004911) interleukin-2 binding(GO:0019976) |
| 2.8 | 11.2 | GO:0047708 | biotinidase activity(GO:0047708) |
| 2.7 | 8.2 | GO:0048030 | disaccharide binding(GO:0048030) |
| 2.6 | 29.0 | GO:0004568 | chitinase activity(GO:0004568) chitin binding(GO:0008061) |
| 2.5 | 10.0 | GO:0000995 | transcription factor activity, core RNA polymerase III binding(GO:0000995) |
| 2.5 | 24.6 | GO:0004972 | NMDA glutamate receptor activity(GO:0004972) |
| 2.5 | 7.4 | GO:0033142 | progesterone receptor binding(GO:0033142) |
| 2.4 | 19.6 | GO:0019763 | immunoglobulin receptor activity(GO:0019763) |
| 2.4 | 12.2 | GO:0004464 | leukotriene-C4 synthase activity(GO:0004464) |
| 2.4 | 12.1 | GO:0004677 | DNA-dependent protein kinase activity(GO:0004677) |
| 2.4 | 47.8 | GO:0005522 | profilin binding(GO:0005522) |
| 2.3 | 9.2 | GO:0004982 | N-formyl peptide receptor activity(GO:0004982) scavenger receptor binding(GO:0005124) |
| 2.3 | 9.0 | GO:0032408 | MutLbeta complex binding(GO:0032406) MutSbeta complex binding(GO:0032408) |
| 2.2 | 15.6 | GO:0032393 | MHC class I receptor activity(GO:0032393) |
| 2.2 | 6.6 | GO:0004144 | diacylglycerol O-acyltransferase activity(GO:0004144) |
| 2.2 | 24.0 | GO:0033691 | sialic acid binding(GO:0033691) |
| 2.2 | 2.2 | GO:0019957 | C-C chemokine binding(GO:0019957) |
| 2.1 | 27.6 | GO:0005391 | sodium:potassium-exchanging ATPase activity(GO:0005391) |
| 2.1 | 18.7 | GO:0035727 | lysophosphatidic acid binding(GO:0035727) |
| 2.1 | 18.6 | GO:0030882 | lipid antigen binding(GO:0030882) endogenous lipid antigen binding(GO:0030883) exogenous lipid antigen binding(GO:0030884) |
| 2.0 | 10.2 | GO:0004875 | complement receptor activity(GO:0004875) |
| 2.0 | 14.3 | GO:0001517 | N-acetylglucosamine 6-O-sulfotransferase activity(GO:0001517) |
| 2.0 | 24.5 | GO:0019911 | structural constituent of myelin sheath(GO:0019911) |
| 2.0 | 24.5 | GO:0015174 | basic amino acid transmembrane transporter activity(GO:0015174) |
| 2.0 | 32.5 | GO:0030306 | ADP-ribosylation factor binding(GO:0030306) |
| 2.0 | 9.9 | GO:0047238 | glucuronosyl-N-acetylgalactosaminyl-proteoglycan 4-beta-N-acetylgalactosaminyltransferase activity(GO:0047238) |
| 1.9 | 3.9 | GO:0050659 | N-acetylgalactosamine 4-sulfate 6-O-sulfotransferase activity(GO:0050659) |
| 1.9 | 7.5 | GO:0030492 | hemoglobin binding(GO:0030492) |
| 1.9 | 7.5 | GO:0004668 | protein-arginine deiminase activity(GO:0004668) |
| 1.8 | 5.5 | GO:0047756 | chondroitin sulfotransferase activity(GO:0034481) chondroitin 4-sulfotransferase activity(GO:0047756) |
| 1.8 | 5.3 | GO:0004782 | sulfinoalanine decarboxylase activity(GO:0004782) |
| 1.7 | 7.0 | GO:0030628 | pre-mRNA 3'-splice site binding(GO:0030628) |
| 1.7 | 3.4 | GO:1990254 | keratin filament binding(GO:1990254) |
| 1.7 | 10.0 | GO:0051032 | nucleic acid transmembrane transporter activity(GO:0051032) RNA transmembrane transporter activity(GO:0051033) |
| 1.7 | 53.1 | GO:0005001 | transmembrane receptor protein tyrosine phosphatase activity(GO:0005001) transmembrane receptor protein phosphatase activity(GO:0019198) |
| 1.6 | 4.9 | GO:0030158 | protein xylosyltransferase activity(GO:0030158) |
| 1.6 | 39.4 | GO:0070016 | armadillo repeat domain binding(GO:0070016) |
| 1.6 | 9.6 | GO:0047894 | flavonol 3-sulfotransferase activity(GO:0047894) |
| 1.6 | 11.3 | GO:0001849 | complement component C1q binding(GO:0001849) |
| 1.5 | 46.4 | GO:0043548 | phosphatidylinositol 3-kinase binding(GO:0043548) |
| 1.5 | 4.6 | GO:0016401 | palmitoyl-CoA oxidase activity(GO:0016401) |
| 1.5 | 4.5 | GO:0004047 | aminomethyltransferase activity(GO:0004047) |
| 1.5 | 4.5 | GO:1904599 | advanced glycation end-product binding(GO:1904599) |
| 1.5 | 7.4 | GO:0019862 | IgA binding(GO:0019862) |
| 1.5 | 7.4 | GO:0042289 | MHC class II protein binding(GO:0042289) |
| 1.4 | 13.0 | GO:0031685 | adenosine receptor binding(GO:0031685) |
| 1.4 | 15.5 | GO:0019864 | IgG binding(GO:0019864) |
| 1.4 | 24.8 | GO:0031702 | type 1 angiotensin receptor binding(GO:0031702) |
| 1.4 | 5.5 | GO:0015111 | iodide transmembrane transporter activity(GO:0015111) |
| 1.3 | 5.2 | GO:0001626 | nociceptin receptor activity(GO:0001626) |
| 1.3 | 8.9 | GO:0004652 | polynucleotide adenylyltransferase activity(GO:0004652) |
| 1.2 | 8.6 | GO:0004873 | asialoglycoprotein receptor activity(GO:0004873) |
| 1.2 | 10.9 | GO:1903136 | cuprous ion binding(GO:1903136) |
| 1.1 | 3.4 | GO:0016833 | oxo-acid-lyase activity(GO:0016833) |
| 1.1 | 5.7 | GO:0003835 | beta-galactoside alpha-2,6-sialyltransferase activity(GO:0003835) |
| 1.1 | 10.3 | GO:0004565 | beta-galactosidase activity(GO:0004565) |
| 1.1 | 4.5 | GO:0017089 | glycolipid transporter activity(GO:0017089) ceramide binding(GO:0097001) |
| 1.1 | 3.3 | GO:0033300 | dehydroascorbic acid transporter activity(GO:0033300) |
| 1.1 | 3.3 | GO:0001641 | group II metabotropic glutamate receptor activity(GO:0001641) |
| 1.1 | 13.1 | GO:0005068 | transmembrane receptor protein tyrosine kinase adaptor activity(GO:0005068) |
| 1.1 | 301.7 | GO:0004252 | serine-type endopeptidase activity(GO:0004252) |
| 1.1 | 13.7 | GO:0008199 | ferric iron binding(GO:0008199) |
| 1.0 | 3.1 | GO:0005174 | CD40 receptor binding(GO:0005174) |
| 1.0 | 5.2 | GO:0061649 | ubiquitinated histone binding(GO:0061649) |
| 1.0 | 8.3 | GO:0071933 | Arp2/3 complex binding(GO:0071933) |
| 1.0 | 10.1 | GO:0004689 | phosphorylase kinase activity(GO:0004689) |
| 1.0 | 4.0 | GO:0008798 | beta-aspartyl-peptidase activity(GO:0008798) |
| 1.0 | 3.0 | GO:0061629 | RNA polymerase II sequence-specific DNA binding transcription factor binding(GO:0061629) |
| 1.0 | 37.4 | GO:0043014 | alpha-tubulin binding(GO:0043014) |
| 1.0 | 2.9 | GO:0015616 | DNA translocase activity(GO:0015616) |
| 1.0 | 5.8 | GO:0000182 | rDNA binding(GO:0000182) |
| 1.0 | 40.4 | GO:0048020 | CCR chemokine receptor binding(GO:0048020) |
| 1.0 | 5.8 | GO:0004882 | androgen receptor activity(GO:0004882) |
| 1.0 | 9.5 | GO:0042731 | PH domain binding(GO:0042731) |
| 0.9 | 10.4 | GO:0032051 | clathrin light chain binding(GO:0032051) |
| 0.9 | 5.7 | GO:0097199 | cysteine-type endopeptidase activity involved in apoptotic signaling pathway(GO:0097199) |
| 0.9 | 18.9 | GO:0008239 | dipeptidyl-peptidase activity(GO:0008239) |
| 0.9 | 4.6 | GO:0003796 | lysozyme activity(GO:0003796) |
| 0.9 | 5.4 | GO:0017040 | ceramidase activity(GO:0017040) |
| 0.9 | 28.0 | GO:0004707 | MAP kinase activity(GO:0004707) |
| 0.9 | 6.3 | GO:0016176 | superoxide-generating NADPH oxidase activator activity(GO:0016176) |
| 0.9 | 11.6 | GO:0005229 | intracellular calcium activated chloride channel activity(GO:0005229) |
| 0.9 | 5.2 | GO:0090554 | phosphatidylcholine-translocating ATPase activity(GO:0090554) |
| 0.9 | 12.2 | GO:0005078 | MAP-kinase scaffold activity(GO:0005078) |
| 0.9 | 6.1 | GO:1990405 | protein antigen binding(GO:1990405) |
| 0.9 | 13.9 | GO:0044213 | intronic transcription regulatory region sequence-specific DNA binding(GO:0001161) intronic transcription regulatory region DNA binding(GO:0044213) |
| 0.9 | 17.3 | GO:0043274 | phospholipase binding(GO:0043274) |
| 0.9 | 2.6 | GO:0004938 | alpha2-adrenergic receptor activity(GO:0004938) |
| 0.9 | 1.7 | GO:0050294 | steroid sulfotransferase activity(GO:0050294) |
| 0.8 | 10.2 | GO:0008430 | selenium binding(GO:0008430) |
| 0.8 | 10.0 | GO:0001206 | transcriptional repressor activity, RNA polymerase II distal enhancer sequence-specific binding(GO:0001206) |
| 0.8 | 0.8 | GO:0090555 | phosphatidylethanolamine-translocating ATPase activity(GO:0090555) |
| 0.8 | 9.9 | GO:0005021 | vascular endothelial growth factor-activated receptor activity(GO:0005021) |
| 0.8 | 3.2 | GO:0043515 | kinetochore binding(GO:0043515) |
| 0.8 | 6.4 | GO:0102337 | fatty acid elongase activity(GO:0009922) 3-oxo-arachidoyl-CoA synthase activity(GO:0102336) 3-oxo-cerotoyl-CoA synthase activity(GO:0102337) 3-oxo-lignoceronyl-CoA synthase activity(GO:0102338) |
| 0.8 | 19.0 | GO:0043325 | phosphatidylinositol-3,4-bisphosphate binding(GO:0043325) |
| 0.8 | 9.3 | GO:0016494 | C-X-C chemokine receptor activity(GO:0016494) |
| 0.8 | 9.8 | GO:0086056 | voltage-gated calcium channel activity involved in AV node cell action potential(GO:0086056) |
| 0.8 | 3.0 | GO:0032422 | purine-rich negative regulatory element binding(GO:0032422) |
| 0.7 | 2.2 | GO:0050501 | hyaluronan synthase activity(GO:0050501) |
| 0.7 | 4.4 | GO:0008142 | oxysterol binding(GO:0008142) |
| 0.7 | 4.4 | GO:0004301 | epoxide hydrolase activity(GO:0004301) |
| 0.7 | 3.7 | GO:0004522 | ribonuclease A activity(GO:0004522) |
| 0.7 | 2.9 | GO:0048248 | CXCR3 chemokine receptor binding(GO:0048248) |
| 0.7 | 12.3 | GO:0004535 | poly(A)-specific ribonuclease activity(GO:0004535) |
| 0.7 | 7.8 | GO:0005375 | copper ion transmembrane transporter activity(GO:0005375) |
| 0.7 | 9.2 | GO:0005432 | calcium:sodium antiporter activity(GO:0005432) |
| 0.7 | 11.2 | GO:0070411 | I-SMAD binding(GO:0070411) |
| 0.7 | 4.1 | GO:0004525 | ribonuclease III activity(GO:0004525) double-stranded RNA-specific ribonuclease activity(GO:0032296) |
| 0.7 | 6.9 | GO:0005542 | folic acid binding(GO:0005542) |
| 0.7 | 5.5 | GO:0031811 | G-protein coupled nucleotide receptor binding(GO:0031811) P2Y1 nucleotide receptor binding(GO:0031812) |
| 0.7 | 2.0 | GO:0005173 | stem cell factor receptor binding(GO:0005173) |
| 0.7 | 12.5 | GO:0008392 | arachidonic acid monooxygenase activity(GO:0008391) arachidonic acid epoxygenase activity(GO:0008392) |
| 0.7 | 2.6 | GO:0001588 | dopamine neurotransmitter receptor activity, coupled via Gs(GO:0001588) |
| 0.6 | 26.5 | GO:0005164 | tumor necrosis factor receptor binding(GO:0005164) |
| 0.6 | 10.0 | GO:0016175 | superoxide-generating NADPH oxidase activity(GO:0016175) |
| 0.6 | 15.7 | GO:0023026 | MHC protein complex binding(GO:0023023) MHC class II protein complex binding(GO:0023026) |
| 0.6 | 5.6 | GO:0004767 | sphingomyelin phosphodiesterase activity(GO:0004767) |
| 0.6 | 3.7 | GO:0004468 | lysine N-acetyltransferase activity, acting on acetyl phosphate as donor(GO:0004468) |
| 0.6 | 1.8 | GO:0016803 | ether hydrolase activity(GO:0016803) hepoxilin-epoxide hydrolase activity(GO:0047977) |
| 0.6 | 1.8 | GO:0004833 | tryptophan 2,3-dioxygenase activity(GO:0004833) |
| 0.6 | 1.8 | GO:0016262 | protein N-acetylglucosaminyltransferase activity(GO:0016262) |
| 0.6 | 9.7 | GO:0050786 | RAGE receptor binding(GO:0050786) |
| 0.6 | 2.4 | GO:0003951 | NAD+ kinase activity(GO:0003951) |
| 0.6 | 4.8 | GO:0005220 | inositol 1,4,5-trisphosphate-sensitive calcium-release channel activity(GO:0005220) |
| 0.6 | 17.3 | GO:0004435 | phosphatidylinositol phospholipase C activity(GO:0004435) |
| 0.6 | 2.3 | GO:0035473 | lipase binding(GO:0035473) |
| 0.6 | 2.9 | GO:0046538 | bisphosphoglycerate mutase activity(GO:0004082) phosphoglycerate mutase activity(GO:0004619) 2,3-bisphosphoglycerate-dependent phosphoglycerate mutase activity(GO:0046538) |
| 0.6 | 16.9 | GO:0005086 | ARF guanyl-nucleotide exchange factor activity(GO:0005086) |
| 0.6 | 1.7 | GO:0030156 | benzodiazepine receptor binding(GO:0030156) |
| 0.6 | 4.6 | GO:1990459 | transferrin receptor binding(GO:1990459) |
| 0.6 | 4.0 | GO:0099529 | neurotransmitter receptor activity involved in regulation of postsynaptic membrane potential(GO:0099529) transmitter-gated ion channel activity involved in regulation of postsynaptic membrane potential(GO:1904315) |
| 0.6 | 5.7 | GO:0005237 | inhibitory extracellular ligand-gated ion channel activity(GO:0005237) |
| 0.6 | 8.5 | GO:0003680 | AT DNA binding(GO:0003680) |
| 0.6 | 5.1 | GO:0003876 | AMP deaminase activity(GO:0003876) adenosine-phosphate deaminase activity(GO:0047623) |
| 0.6 | 1.7 | GO:0035276 | ethanol binding(GO:0035276) |
| 0.6 | 5.0 | GO:0004396 | glucokinase activity(GO:0004340) hexokinase activity(GO:0004396) fructokinase activity(GO:0008865) mannokinase activity(GO:0019158) |
| 0.6 | 45.7 | GO:0004715 | non-membrane spanning protein tyrosine kinase activity(GO:0004715) |
| 0.6 | 11.7 | GO:0008331 | high voltage-gated calcium channel activity(GO:0008331) |
| 0.6 | 1.7 | GO:0001601 | peptide YY receptor activity(GO:0001601) |
| 0.6 | 6.6 | GO:0050700 | CARD domain binding(GO:0050700) |
| 0.5 | 18.0 | GO:0005158 | insulin receptor binding(GO:0005158) |
| 0.5 | 2.7 | GO:0034648 | histone demethylase activity (H3-trimethyl-K4 specific)(GO:0034647) histone demethylase activity (H3-dimethyl-K4 specific)(GO:0034648) |
| 0.5 | 17.6 | GO:0071889 | 14-3-3 protein binding(GO:0071889) |
| 0.5 | 16.5 | GO:0034237 | protein kinase A regulatory subunit binding(GO:0034237) |
| 0.5 | 4.2 | GO:0030229 | very-low-density lipoprotein particle receptor activity(GO:0030229) |
| 0.5 | 2.1 | GO:0050119 | N-acetylglucosamine deacetylase activity(GO:0050119) |
| 0.5 | 2.6 | GO:0004392 | heme oxygenase (decyclizing) activity(GO:0004392) |
| 0.5 | 2.5 | GO:0004427 | inorganic diphosphatase activity(GO:0004427) |
| 0.5 | 1.5 | GO:0010698 | acetyltransferase activator activity(GO:0010698) |
| 0.5 | 2.0 | GO:0042954 | lipoprotein transporter activity(GO:0042954) |
| 0.5 | 3.4 | GO:0047184 | 1-acylglycerophosphocholine O-acyltransferase activity(GO:0047184) |
| 0.5 | 4.4 | GO:0015277 | kainate selective glutamate receptor activity(GO:0015277) |
| 0.5 | 62.4 | GO:0003705 | transcription factor activity, RNA polymerase II distal enhancer sequence-specific binding(GO:0003705) |
| 0.5 | 1.9 | GO:0008281 | sulfonylurea receptor activity(GO:0008281) |
| 0.5 | 1.9 | GO:0045127 | N-acetylglucosamine kinase activity(GO:0045127) |
| 0.5 | 3.7 | GO:0097643 | amylin receptor activity(GO:0097643) |
| 0.5 | 3.3 | GO:0030911 | TPR domain binding(GO:0030911) |
| 0.5 | 2.3 | GO:0004910 | interleukin-1, Type II, blocking receptor activity(GO:0004910) |
| 0.5 | 1.4 | GO:0050254 | rhodopsin kinase activity(GO:0050254) |
| 0.5 | 5.9 | GO:0097371 | MDM2/MDM4 family protein binding(GO:0097371) |
| 0.5 | 1.8 | GO:0070095 | fructose-6-phosphate binding(GO:0070095) |
| 0.5 | 2.3 | GO:0051011 | microtubule minus-end binding(GO:0051011) |
| 0.5 | 11.3 | GO:0001965 | G-protein alpha-subunit binding(GO:0001965) |
| 0.4 | 6.6 | GO:0033130 | acetylcholine receptor binding(GO:0033130) |
| 0.4 | 3.0 | GO:0030368 | interleukin-17 receptor activity(GO:0030368) |
| 0.4 | 0.8 | GO:0060230 | lipoprotein lipase activator activity(GO:0060230) |
| 0.4 | 12.4 | GO:0003887 | DNA-directed DNA polymerase activity(GO:0003887) |
| 0.4 | 1.2 | GO:0004584 | dolichyl-phosphate-mannose-glycolipid alpha-mannosyltransferase activity(GO:0004584) |
| 0.4 | 13.1 | GO:0017075 | syntaxin-1 binding(GO:0017075) |
| 0.4 | 17.5 | GO:0030544 | Hsp70 protein binding(GO:0030544) |
| 0.4 | 8.9 | GO:0052629 | phosphatidylinositol-3,5-bisphosphate 3-phosphatase activity(GO:0052629) |
| 0.4 | 14.5 | GO:0001106 | RNA polymerase II transcription corepressor activity(GO:0001106) |
| 0.4 | 3.2 | GO:0086006 | voltage-gated sodium channel activity involved in cardiac muscle cell action potential(GO:0086006) |
| 0.4 | 5.6 | GO:0015101 | organic cation transmembrane transporter activity(GO:0015101) |
| 0.4 | 1.6 | GO:0031802 | type 5 metabotropic glutamate receptor binding(GO:0031802) |
| 0.4 | 3.1 | GO:0015232 | heme transporter activity(GO:0015232) |
| 0.4 | 3.9 | GO:0031995 | insulin-like growth factor II binding(GO:0031995) |
| 0.4 | 9.6 | GO:0015175 | neutral amino acid transmembrane transporter activity(GO:0015175) |
| 0.4 | 9.4 | GO:0016922 | ligand-dependent nuclear receptor binding(GO:0016922) |
| 0.4 | 4.5 | GO:0005007 | fibroblast growth factor-activated receptor activity(GO:0005007) |
| 0.4 | 1.5 | GO:0016880 | glutamate-ammonia ligase activity(GO:0004356) ammonia ligase activity(GO:0016211) acid-ammonia (or amide) ligase activity(GO:0016880) |
| 0.4 | 2.2 | GO:0015643 | toxic substance binding(GO:0015643) |
| 0.4 | 38.9 | GO:0001618 | virus receptor activity(GO:0001618) |
| 0.4 | 2.2 | GO:1990226 | histone methyltransferase binding(GO:1990226) |
| 0.4 | 1.1 | GO:0015265 | urea channel activity(GO:0015265) |
| 0.4 | 11.7 | GO:0043015 | gamma-tubulin binding(GO:0043015) |
| 0.4 | 6.4 | GO:0051184 | cofactor transporter activity(GO:0051184) |
| 0.3 | 3.8 | GO:0055056 | D-glucose transmembrane transporter activity(GO:0055056) |
| 0.3 | 8.3 | GO:0048487 | beta-tubulin binding(GO:0048487) |
| 0.3 | 0.7 | GO:0031716 | calcitonin receptor binding(GO:0031716) |
| 0.3 | 7.9 | GO:1905030 | voltage-gated sodium channel activity(GO:0005248) voltage-gated ion channel activity involved in regulation of postsynaptic membrane potential(GO:1905030) |
| 0.3 | 6.1 | GO:0015278 | calcium-release channel activity(GO:0015278) ligand-gated calcium channel activity(GO:0099604) |
| 0.3 | 123.1 | GO:0005096 | GTPase activator activity(GO:0005096) |
| 0.3 | 3.4 | GO:0022841 | potassium ion leak channel activity(GO:0022841) |
| 0.3 | 15.5 | GO:0030695 | GTPase regulator activity(GO:0030695) |
| 0.3 | 39.8 | GO:0003823 | antigen binding(GO:0003823) |
| 0.3 | 4.4 | GO:0034450 | ubiquitin-ubiquitin ligase activity(GO:0034450) |
| 0.3 | 1.3 | GO:0043273 | CTPase activity(GO:0043273) |
| 0.3 | 4.4 | GO:0070330 | oxidoreductase activity, acting on paired donors, with incorporation or reduction of molecular oxygen, reduced flavin or flavoprotein as one donor, and incorporation of one atom of oxygen(GO:0016712) aromatase activity(GO:0070330) |
| 0.3 | 2.8 | GO:0031419 | cobalamin binding(GO:0031419) |
| 0.3 | 5.0 | GO:0016493 | C-C chemokine receptor activity(GO:0016493) |
| 0.3 | 19.3 | GO:0001540 | beta-amyloid binding(GO:0001540) |
| 0.3 | 5.6 | GO:0003995 | acyl-CoA dehydrogenase activity(GO:0003995) |
| 0.3 | 1.2 | GO:0008422 | beta-glucosidase activity(GO:0008422) |
| 0.3 | 7.9 | GO:0005031 | tumor necrosis factor-activated receptor activity(GO:0005031) death receptor activity(GO:0005035) |
| 0.3 | 4.9 | GO:0042800 | histone methyltransferase activity (H3-K4 specific)(GO:0042800) |
| 0.3 | 1.7 | GO:0004563 | beta-N-acetylhexosaminidase activity(GO:0004563) |
| 0.3 | 7.5 | GO:0046965 | retinoid X receptor binding(GO:0046965) |
| 0.3 | 4.4 | GO:1901612 | cardiolipin binding(GO:1901612) |
| 0.3 | 6.8 | GO:0102391 | decanoate--CoA ligase activity(GO:0102391) |
| 0.3 | 2.1 | GO:0003726 | double-stranded RNA adenosine deaminase activity(GO:0003726) |
| 0.3 | 0.8 | GO:0004577 | N-acetylglucosaminyldiphosphodolichol N-acetylglucosaminyltransferase activity(GO:0004577) |
| 0.3 | 2.3 | GO:0017154 | semaphorin receptor activity(GO:0017154) |
| 0.3 | 11.4 | GO:0070412 | R-SMAD binding(GO:0070412) |
| 0.3 | 4.4 | GO:0008198 | ferrous iron binding(GO:0008198) |
| 0.2 | 1.5 | GO:0004035 | alkaline phosphatase activity(GO:0004035) |
| 0.2 | 5.6 | GO:0001784 | phosphotyrosine binding(GO:0001784) |
| 0.2 | 11.6 | GO:0031683 | G-protein beta/gamma-subunit complex binding(GO:0031683) |
| 0.2 | 3.8 | GO:0008139 | nuclear localization sequence binding(GO:0008139) |
| 0.2 | 0.7 | GO:0052798 | beta-galactoside alpha-2,3-sialyltransferase activity(GO:0052798) |
| 0.2 | 3.6 | GO:0004383 | guanylate cyclase activity(GO:0004383) |
| 0.2 | 4.2 | GO:0016405 | CoA-ligase activity(GO:0016405) |
| 0.2 | 23.6 | GO:0004725 | protein tyrosine phosphatase activity(GO:0004725) |
| 0.2 | 38.2 | GO:0005057 | receptor signaling protein activity(GO:0005057) |
| 0.2 | 0.7 | GO:0015222 | serotonin transmembrane transporter activity(GO:0015222) |
| 0.2 | 2.1 | GO:0017169 | CDP-alcohol phosphatidyltransferase activity(GO:0017169) |
| 0.2 | 5.7 | GO:0030506 | ankyrin binding(GO:0030506) |
| 0.2 | 5.9 | GO:0008093 | cytoskeletal adaptor activity(GO:0008093) |
| 0.2 | 1.8 | GO:0030346 | protein phosphatase 2B binding(GO:0030346) |
| 0.2 | 2.5 | GO:0004523 | RNA-DNA hybrid ribonuclease activity(GO:0004523) |
| 0.2 | 0.7 | GO:0000253 | 3-keto sterol reductase activity(GO:0000253) |
| 0.2 | 12.8 | GO:0032934 | sterol binding(GO:0032934) |
| 0.2 | 6.1 | GO:0004532 | exoribonuclease activity(GO:0004532) |
| 0.2 | 4.6 | GO:0050321 | tau-protein kinase activity(GO:0050321) |
| 0.2 | 0.4 | GO:0005127 | ciliary neurotrophic factor receptor binding(GO:0005127) |
| 0.2 | 0.2 | GO:0098821 | BMP receptor activity(GO:0098821) |
| 0.2 | 3.9 | GO:0001608 | G-protein coupled nucleotide receptor activity(GO:0001608) G-protein coupled purinergic nucleotide receptor activity(GO:0045028) |
| 0.2 | 2.3 | GO:0001758 | retinal dehydrogenase activity(GO:0001758) |
| 0.2 | 1.5 | GO:0035368 | selenocysteine insertion sequence binding(GO:0035368) |
| 0.2 | 1.6 | GO:0008020 | G-protein coupled photoreceptor activity(GO:0008020) |
| 0.2 | 2.7 | GO:0015501 | glutamate:sodium symporter activity(GO:0015501) |
| 0.2 | 5.0 | GO:0070566 | adenylyltransferase activity(GO:0070566) |
| 0.2 | 1.8 | GO:0097322 | 7SK snRNA binding(GO:0097322) |
| 0.2 | 2.9 | GO:0004143 | diacylglycerol kinase activity(GO:0004143) |
| 0.2 | 3.8 | GO:0051019 | mitogen-activated protein kinase binding(GO:0051019) |
| 0.2 | 0.7 | GO:0035402 | histone kinase activity (H3-T11 specific)(GO:0035402) |
| 0.2 | 0.5 | GO:0052810 | 1-phosphatidylinositol-5-kinase activity(GO:0052810) |
| 0.2 | 0.5 | GO:0050698 | proteoglycan sulfotransferase activity(GO:0050698) |
| 0.2 | 2.9 | GO:0043395 | heparan sulfate proteoglycan binding(GO:0043395) |
| 0.2 | 4.3 | GO:0001102 | RNA polymerase II activating transcription factor binding(GO:0001102) |
| 0.2 | 2.7 | GO:0001530 | lipopolysaccharide binding(GO:0001530) |
| 0.2 | 0.4 | GO:0030272 | 5-formyltetrahydrofolate cyclo-ligase activity(GO:0030272) |
| 0.2 | 1.9 | GO:0009931 | calcium-dependent protein serine/threonine kinase activity(GO:0009931) |
| 0.2 | 5.2 | GO:0005212 | structural constituent of eye lens(GO:0005212) |
| 0.2 | 7.2 | GO:0017112 | Rab guanyl-nucleotide exchange factor activity(GO:0017112) |
| 0.2 | 1.5 | GO:0017046 | peptide hormone binding(GO:0017046) |
| 0.2 | 11.9 | GO:0005089 | Rho guanyl-nucleotide exchange factor activity(GO:0005089) |
| 0.2 | 7.5 | GO:0030507 | spectrin binding(GO:0030507) |
| 0.2 | 3.2 | GO:0019707 | protein-cysteine S-palmitoyltransferase activity(GO:0019706) protein-cysteine S-acyltransferase activity(GO:0019707) |
| 0.2 | 1.5 | GO:0003831 | beta-N-acetylglucosaminylglycopeptide beta-1,4-galactosyltransferase activity(GO:0003831) |
| 0.2 | 0.6 | GO:0003976 | UDP-N-acetylglucosamine-lysosomal-enzyme N-acetylglucosaminephosphotransferase activity(GO:0003976) |
| 0.2 | 1.6 | GO:0008131 | primary amine oxidase activity(GO:0008131) |
| 0.2 | 4.4 | GO:0070888 | E-box binding(GO:0070888) |
| 0.2 | 6.1 | GO:0036002 | pre-mRNA binding(GO:0036002) |
| 0.2 | 3.5 | GO:0071949 | FAD binding(GO:0071949) |
| 0.2 | 1.1 | GO:0016778 | diphosphotransferase activity(GO:0016778) |
| 0.1 | 0.4 | GO:0005477 | pyruvate secondary active transmembrane transporter activity(GO:0005477) |
| 0.1 | 1.3 | GO:0016015 | morphogen activity(GO:0016015) |
| 0.1 | 5.2 | GO:0005246 | calcium channel regulator activity(GO:0005246) |
| 0.1 | 2.1 | GO:0047372 | acylglycerol lipase activity(GO:0047372) |
| 0.1 | 1.3 | GO:0046920 | alpha-(1->3)-fucosyltransferase activity(GO:0046920) |
| 0.1 | 2.7 | GO:0005385 | zinc ion transmembrane transporter activity(GO:0005385) |
| 0.1 | 2.4 | GO:0004089 | carbonate dehydratase activity(GO:0004089) |
| 0.1 | 0.4 | GO:0015562 | efflux transmembrane transporter activity(GO:0015562) |
| 0.1 | 0.4 | GO:0004613 | phosphoenolpyruvate carboxykinase activity(GO:0004611) phosphoenolpyruvate carboxykinase (GTP) activity(GO:0004613) |
| 0.1 | 0.5 | GO:0008823 | cupric reductase activity(GO:0008823) ferric-chelate reductase (NADPH) activity(GO:0052851) |
| 0.1 | 0.4 | GO:0004961 | thromboxane receptor activity(GO:0004960) thromboxane A2 receptor activity(GO:0004961) |
| 0.1 | 1.3 | GO:0005549 | odorant binding(GO:0005549) |
| 0.1 | 4.9 | GO:0004115 | 3',5'-cyclic-AMP phosphodiesterase activity(GO:0004115) |
| 0.1 | 2.0 | GO:0000983 | transcription factor activity, RNA polymerase II core promoter sequence-specific(GO:0000983) |
| 0.1 | 0.7 | GO:0004489 | methylenetetrahydrofolate reductase (NAD(P)H) activity(GO:0004489) |
| 0.1 | 1.3 | GO:0030215 | semaphorin receptor binding(GO:0030215) |
| 0.1 | 0.3 | GO:0015057 | thrombin receptor activity(GO:0015057) |
| 0.1 | 1.1 | GO:0005024 | transforming growth factor beta-activated receptor activity(GO:0005024) |
| 0.1 | 4.3 | GO:0043425 | bHLH transcription factor binding(GO:0043425) |
| 0.1 | 2.1 | GO:0001104 | RNA polymerase II transcription cofactor activity(GO:0001104) |
| 0.1 | 0.6 | GO:0008381 | mechanically-gated ion channel activity(GO:0008381) mechanically gated channel activity(GO:0022833) |
| 0.1 | 1.9 | GO:0005112 | Notch binding(GO:0005112) |
| 0.1 | 1.2 | GO:0043047 | single-stranded telomeric DNA binding(GO:0043047) |
| 0.1 | 3.3 | GO:0005160 | transforming growth factor beta receptor binding(GO:0005160) |
| 0.1 | 1.1 | GO:0050811 | GABA receptor binding(GO:0050811) |
| 0.1 | 2.9 | GO:0004033 | aldo-keto reductase (NADP) activity(GO:0004033) |
| 0.1 | 1.0 | GO:0019869 | chloride channel inhibitor activity(GO:0019869) |
| 0.1 | 1.7 | GO:0004012 | phospholipid-translocating ATPase activity(GO:0004012) |
| 0.1 | 0.2 | GO:0046933 | proton-transporting ATP synthase activity, rotational mechanism(GO:0046933) |
| 0.1 | 0.3 | GO:0070492 | oligosaccharide binding(GO:0070492) |
| 0.1 | 3.4 | GO:0003785 | actin monomer binding(GO:0003785) |
| 0.1 | 0.7 | GO:0008379 | thioredoxin peroxidase activity(GO:0008379) |
| 0.1 | 1.7 | GO:0005251 | delayed rectifier potassium channel activity(GO:0005251) |
| 0.1 | 1.2 | GO:0070008 | serine-type carboxypeptidase activity(GO:0004185) serine-type exopeptidase activity(GO:0070008) |
| 0.1 | 2.7 | GO:0004177 | aminopeptidase activity(GO:0004177) |
| 0.1 | 0.8 | GO:0004957 | prostaglandin E receptor activity(GO:0004957) |
| 0.1 | 5.7 | GO:0017137 | Rab GTPase binding(GO:0017137) |
| 0.1 | 0.2 | GO:0048019 | receptor antagonist activity(GO:0048019) |
| 0.1 | 12.7 | GO:0001078 | transcriptional repressor activity, RNA polymerase II core promoter proximal region sequence-specific binding(GO:0001078) |
| 0.1 | 1.2 | GO:0046875 | ephrin receptor binding(GO:0046875) |
| 0.1 | 1.0 | GO:0005149 | interleukin-1 receptor binding(GO:0005149) |
| 0.1 | 0.6 | GO:0097109 | neuroligin family protein binding(GO:0097109) |
| 0.1 | 8.2 | GO:0008565 | protein transporter activity(GO:0008565) |
| 0.1 | 10.5 | GO:0051020 | GTPase binding(GO:0051020) |
| 0.1 | 1.2 | GO:0004190 | aspartic-type endopeptidase activity(GO:0004190) aspartic-type peptidase activity(GO:0070001) |
| 0.1 | 0.1 | GO:1990763 | arrestin family protein binding(GO:1990763) |
| 0.1 | 0.3 | GO:0008048 | calcium sensitive guanylate cyclase activator activity(GO:0008048) |
| 0.1 | 1.4 | GO:0070742 | C2H2 zinc finger domain binding(GO:0070742) |
| 0.1 | 2.7 | GO:0019199 | transmembrane receptor protein kinase activity(GO:0019199) |
| 0.1 | 1.2 | GO:0005104 | fibroblast growth factor receptor binding(GO:0005104) |
| 0.1 | 0.3 | GO:0033857 | diphosphoinositol-pentakisphosphate kinase activity(GO:0033857) |
| 0.1 | 0.3 | GO:0017018 | myosin phosphatase activity(GO:0017018) |
| 0.1 | 0.2 | GO:0003923 | GPI-anchor transamidase activity(GO:0003923) |
| 0.1 | 2.9 | GO:0004879 | RNA polymerase II transcription factor activity, ligand-activated sequence-specific DNA binding(GO:0004879) transcription factor activity, direct ligand regulated sequence-specific DNA binding(GO:0098531) |
| 0.1 | 49.0 | GO:0004872 | receptor activity(GO:0004872) molecular transducer activity(GO:0060089) |
| 0.0 | 1.2 | GO:0016628 | oxidoreductase activity, acting on the CH-CH group of donors, NAD or NADP as acceptor(GO:0016628) |
| 0.0 | 0.2 | GO:0031782 | melanocortin receptor binding(GO:0031779) type 3 melanocortin receptor binding(GO:0031781) type 4 melanocortin receptor binding(GO:0031782) |
| 0.0 | 0.6 | GO:0005159 | insulin-like growth factor receptor binding(GO:0005159) |
| 0.0 | 0.3 | GO:0004740 | pyruvate dehydrogenase (acetyl-transferring) kinase activity(GO:0004740) |
| 0.0 | 4.5 | GO:0004867 | serine-type endopeptidase inhibitor activity(GO:0004867) |
| 0.0 | 4.8 | GO:0005179 | hormone activity(GO:0005179) |
| 0.0 | 0.4 | GO:0004311 | farnesyltranstransferase activity(GO:0004311) |
| 0.0 | 0.5 | GO:0022820 | potassium:chloride symporter activity(GO:0015379) potassium ion symporter activity(GO:0022820) |
| 0.0 | 0.1 | GO:0070290 | N-acylphosphatidylethanolamine-specific phospholipase D activity(GO:0070290) |
| 0.0 | 0.2 | GO:0000405 | bubble DNA binding(GO:0000405) |
| 0.0 | 0.4 | GO:0036374 | glutathione hydrolase activity(GO:0036374) |
| 0.0 | 0.2 | GO:0016714 | oxidoreductase activity, acting on paired donors, with incorporation or reduction of molecular oxygen, reduced pteridine as one donor, and incorporation of one atom of oxygen(GO:0016714) |
| 0.0 | 0.1 | GO:0098518 | polynucleotide phosphatase activity(GO:0098518) |
| 0.0 | 2.4 | GO:0001227 | transcriptional repressor activity, RNA polymerase II transcription regulatory region sequence-specific binding(GO:0001227) |
| 0.0 | 0.2 | GO:0001135 | transcription factor activity, RNA polymerase II transcription factor recruiting(GO:0001135) |
| 0.0 | 0.1 | GO:0005499 | vitamin D binding(GO:0005499) |
| 0.0 | 0.9 | GO:0004601 | peroxidase activity(GO:0004601) |
| 0.0 | 0.3 | GO:0031432 | titin binding(GO:0031432) |
| 0.0 | 0.5 | GO:0048027 | mRNA 5'-UTR binding(GO:0048027) |
| 0.0 | 0.3 | GO:0008483 | transaminase activity(GO:0008483) |
| 0.0 | 0.4 | GO:0015269 | calcium-activated potassium channel activity(GO:0015269) |
| 0.0 | 0.6 | GO:0098811 | transcriptional activator activity, RNA polymerase II transcription factor binding(GO:0001190) transcriptional repressor activity, RNA polymerase II activating transcription factor binding(GO:0098811) |
| 0.0 | 0.3 | GO:0043539 | protein serine/threonine kinase activator activity(GO:0043539) |
| 0.0 | 0.1 | GO:0004485 | methylcrotonoyl-CoA carboxylase activity(GO:0004485) |
Gene overrepresentation in curated gene sets: canonical pathways category:
| Log-likelihood per target | Total log-likelihood | Term | Description |
|---|---|---|---|
| 2.2 | 8.7 | PID TCR RAS PATHWAY | Ras signaling in the CD4+ TCR pathway |
| 2.1 | 70.7 | PID IL8 CXCR1 PATHWAY | IL8- and CXCR1-mediated signaling events |
| 1.8 | 9.2 | PID UPA UPAR PATHWAY | Urokinase-type plasminogen activator (uPA) and uPAR-mediated signaling |
| 1.4 | 10.9 | PID IL6 7 PATHWAY | IL6-mediated signaling events |
| 1.3 | 49.0 | SA CASPASE CASCADE | Apoptosis is mediated by caspases, cysteine proteases arranged in a proteolytic cascade. |
| 1.1 | 18.7 | ST INTERFERON GAMMA PATHWAY | Interferon gamma pathway. |
| 1.1 | 22.8 | SA PTEN PATHWAY | PTEN is a tumor suppressor that dephosphorylates the lipid messenger phosphatidylinositol triphosphate. |
| 1.0 | 50.2 | PID INTEGRIN2 PATHWAY | Beta2 integrin cell surface interactions |
| 1.0 | 24.8 | ST GA12 PATHWAY | G alpha 12 Pathway |
| 0.9 | 12.1 | ST INTERLEUKIN 4 PATHWAY | Interleukin 4 (IL-4) Pathway |
| 0.9 | 3.7 | PID THROMBIN PAR4 PATHWAY | PAR4-mediated thrombin signaling events |
| 0.9 | 58.1 | SIG PIP3 SIGNALING IN B LYMPHOCYTES | Genes related to PIP3 signaling in B lymphocytes |
| 0.8 | 4.9 | PID INSULIN PATHWAY | Insulin Pathway |
| 0.8 | 21.2 | PID GMCSF PATHWAY | GMCSF-mediated signaling events |
| 0.8 | 5.4 | ST PAC1 RECEPTOR PATHWAY | PAC1 Receptor Pathway |
| 0.8 | 19.0 | PID AMB2 NEUTROPHILS PATHWAY | amb2 Integrin signaling |
| 0.8 | 2.3 | ST IL 13 PATHWAY | Interleukin 13 (IL-13) Pathway |
| 0.7 | 11.5 | ST GAQ PATHWAY | G alpha q Pathway |
| 0.7 | 4.9 | PID NEPHRIN NEPH1 PATHWAY | Nephrin/Neph1 signaling in the kidney podocyte |
| 0.7 | 2.7 | ST TYPE I INTERFERON PATHWAY | Type I Interferon (alpha/beta IFN) Pathway |
| 0.7 | 39.5 | PID LYSOPHOSPHOLIPID PATHWAY | LPA receptor mediated events |
| 0.7 | 62.1 | PID FCER1 PATHWAY | Fc-epsilon receptor I signaling in mast cells |
| 0.7 | 4.0 | PID TCR JNK PATHWAY | JNK signaling in the CD4+ TCR pathway |
| 0.7 | 11.2 | PID EPHA FWDPATHWAY | EPHA forward signaling |
| 0.7 | 3.9 | PID SYNDECAN 4 PATHWAY | Syndecan-4-mediated signaling events |
| 0.7 | 46.5 | PID RAC1 REG PATHWAY | Regulation of RAC1 activity |
| 0.6 | 6.1 | ST PHOSPHOINOSITIDE 3 KINASE PATHWAY | PI3K Pathway |
| 0.6 | 33.4 | PID BCR 5PATHWAY | BCR signaling pathway |
| 0.6 | 24.1 | PID TCPTP PATHWAY | Signaling events mediated by TCPTP |
| 0.6 | 19.3 | PID IL23 PATHWAY | IL23-mediated signaling events |
| 0.6 | 61.0 | PID PDGFRB PATHWAY | PDGFR-beta signaling pathway |
| 0.6 | 21.6 | PID P38 MK2 PATHWAY | p38 signaling mediated by MAPKAP kinases |
| 0.6 | 16.3 | PID TRAIL PATHWAY | TRAIL signaling pathway |
| 0.5 | 10.9 | PID ECADHERIN KERATINOCYTE PATHWAY | E-cadherin signaling in keratinocytes |
| 0.5 | 13.3 | PID IL2 1PATHWAY | IL2-mediated signaling events |
| 0.5 | 20.5 | PID TCR PATHWAY | TCR signaling in naïve CD4+ T cells |
| 0.5 | 12.3 | PID DNA PK PATHWAY | DNA-PK pathway in nonhomologous end joining |
| 0.5 | 12.1 | PID P38 MKK3 6PATHWAY | p38 MAPK signaling pathway |
| 0.5 | 13.6 | PID FAK PATHWAY | Signaling events mediated by focal adhesion kinase |
| 0.4 | 3.1 | PID LPA4 PATHWAY | LPA4-mediated signaling events |
| 0.4 | 13.2 | PID ECADHERIN NASCENT AJ PATHWAY | E-cadherin signaling in the nascent adherens junction |
| 0.4 | 15.8 | PID IL12 2PATHWAY | IL12-mediated signaling events |
| 0.4 | 10.1 | PID CXCR4 PATHWAY | CXCR4-mediated signaling events |
| 0.4 | 67.4 | NABA ECM AFFILIATED | Genes encoding proteins affiliated structurally or functionally to extracellular matrix proteins |
| 0.4 | 4.5 | PID CXCR3 PATHWAY | CXCR3-mediated signaling events |
| 0.4 | 4.4 | PID FAS PATHWAY | FAS (CD95) signaling pathway |
| 0.3 | 3.4 | PID P38 ALPHA BETA PATHWAY | Regulation of p38-alpha and p38-beta |
| 0.3 | 11.2 | PID RETINOIC ACID PATHWAY | Retinoic acid receptors-mediated signaling |
| 0.3 | 7.4 | PID TOLL ENDOGENOUS PATHWAY | Endogenous TLR signaling |
| 0.3 | 14.2 | PID ARF6 TRAFFICKING PATHWAY | Arf6 trafficking events |
| 0.3 | 5.0 | PID EPHB FWD PATHWAY | EPHB forward signaling |
| 0.3 | 21.9 | PID ERA GENOMIC PATHWAY | Validated nuclear estrogen receptor alpha network |
| 0.2 | 3.5 | PID CD8 TCR DOWNSTREAM PATHWAY | Downstream signaling in naïve CD8+ T cells |
| 0.2 | 9.8 | PID FOXO PATHWAY | FoxO family signaling |
| 0.2 | 3.1 | ST INTEGRIN SIGNALING PATHWAY | Integrin Signaling Pathway |
| 0.2 | 2.6 | PID RET PATHWAY | Signaling events regulated by Ret tyrosine kinase |
| 0.2 | 6.1 | PID RHODOPSIN PATHWAY | Visual signal transduction: Rods |
| 0.2 | 6.0 | PID TNF PATHWAY | TNF receptor signaling pathway |
| 0.2 | 3.9 | PID SHP2 PATHWAY | SHP2 signaling |
| 0.2 | 7.6 | PID FANCONI PATHWAY | Fanconi anemia pathway |
| 0.2 | 7.3 | PID LKB1 PATHWAY | LKB1 signaling events |
| 0.2 | 3.0 | PID KIT PATHWAY | Signaling events mediated by Stem cell factor receptor (c-Kit) |
| 0.1 | 5.2 | ST FAS SIGNALING PATHWAY | Fas Signaling Pathway |
| 0.1 | 0.9 | PID ALK1 PATHWAY | ALK1 signaling events |
| 0.1 | 7.5 | PID BMP PATHWAY | BMP receptor signaling |
| 0.1 | 16.7 | PID BETA CATENIN NUC PATHWAY | Regulation of nuclear beta catenin signaling and target gene transcription |
| 0.1 | 5.5 | PID ERBB1 DOWNSTREAM PATHWAY | ErbB1 downstream signaling |
| 0.1 | 6.6 | PID P75 NTR PATHWAY | p75(NTR)-mediated signaling |
| 0.1 | 5.1 | NABA PROTEOGLYCANS | Genes encoding proteoglycans |
| 0.1 | 3.9 | PID GLYPICAN 1PATHWAY | Glypican 1 network |
| 0.1 | 1.4 | PID RAS PATHWAY | Regulation of Ras family activation |
| 0.1 | 2.0 | PID ERBB2 ERBB3 PATHWAY | ErbB2/ErbB3 signaling events |
| 0.1 | 2.6 | PID ALPHA SYNUCLEIN PATHWAY | Alpha-synuclein signaling |
| 0.1 | 0.3 | ST TUMOR NECROSIS FACTOR PATHWAY | Tumor Necrosis Factor Pathway. |
| 0.1 | 0.7 | PID ALK2 PATHWAY | ALK2 signaling events |
| 0.1 | 1.8 | PID REELIN PATHWAY | Reelin signaling pathway |
| 0.1 | 23.7 | NABA SECRETED FACTORS | Genes encoding secreted soluble factors |
| 0.1 | 0.4 | ST GA13 PATHWAY | G alpha 13 Pathway |
| 0.1 | 0.7 | PID THROMBIN PAR1 PATHWAY | PAR1-mediated thrombin signaling events |
| 0.0 | 1.7 | PID IL4 2PATHWAY | IL4-mediated signaling events |
| 0.0 | 1.1 | PID AP1 PATHWAY | AP-1 transcription factor network |
| 0.0 | 1.6 | PID HNF3A PATHWAY | FOXA1 transcription factor network |
| 0.0 | 1.2 | PID HIF2PATHWAY | HIF-2-alpha transcription factor network |
| 0.0 | 0.6 | PID SMAD2 3NUCLEAR PATHWAY | Regulation of nuclear SMAD2/3 signaling |
| 0.0 | 0.5 | PID RAC1 PATHWAY | RAC1 signaling pathway |
| 0.0 | 0.3 | PID NETRIN PATHWAY | Netrin-mediated signaling events |
Gene overrepresentation in curated gene sets: REACTOME pathways category:
| Log-likelihood per target | Total log-likelihood | Term | Description |
|---|---|---|---|
| 3.7 | 71.0 | REACTOME INITIAL TRIGGERING OF COMPLEMENT | Genes involved in Initial triggering of complement |
| 3.5 | 84.9 | REACTOME PHOSPHORYLATION OF CD3 AND TCR ZETA CHAINS | Genes involved in Phosphorylation of CD3 and TCR zeta chains |
| 2.3 | 11.3 | REACTOME PD1 SIGNALING | Genes involved in PD-1 signaling |
| 2.2 | 56.0 | REACTOME GENERATION OF SECOND MESSENGER MOLECULES | Genes involved in Generation of second messenger molecules |
| 2.0 | 55.1 | REACTOME SIGNAL REGULATORY PROTEIN SIRP FAMILY INTERACTIONS | Genes involved in Signal regulatory protein (SIRP) family interactions |
| 2.0 | 2.0 | REACTOME CDC6 ASSOCIATION WITH THE ORC ORIGIN COMPLEX | Genes involved in CDC6 association with the ORC:origin complex |
| 1.5 | 32.4 | REACTOME IL 7 SIGNALING | Genes involved in Interleukin-7 signaling |
| 1.4 | 10.0 | REACTOME BETA DEFENSINS | Genes involved in Beta defensins |
| 1.4 | 33.2 | REACTOME G BETA GAMMA SIGNALLING THROUGH PLC BETA | Genes involved in G beta:gamma signalling through PLC beta |
| 1.4 | 35.9 | REACTOME TRAFFICKING OF GLUR2 CONTAINING AMPA RECEPTORS | Genes involved in Trafficking of GluR2-containing AMPA receptors |
| 1.2 | 110.8 | REACTOME IMMUNOREGULATORY INTERACTIONS BETWEEN A LYMPHOID AND A NON LYMPHOID CELL | Genes involved in Immunoregulatory interactions between a Lymphoid and a non-Lymphoid cell |
| 1.1 | 24.4 | REACTOME DOPAMINE NEUROTRANSMITTER RELEASE CYCLE | Genes involved in Dopamine Neurotransmitter Release Cycle |
| 1.0 | 17.6 | REACTOME REGULATION OF IFNG SIGNALING | Genes involved in Regulation of IFNG signaling |
| 1.0 | 67.8 | REACTOME CHEMOKINE RECEPTORS BIND CHEMOKINES | Genes involved in Chemokine receptors bind chemokines |
| 1.0 | 47.6 | REACTOME BASIGIN INTERACTIONS | Genes involved in Basigin interactions |
| 1.0 | 13.7 | REACTOME PLATELET ADHESION TO EXPOSED COLLAGEN | Genes involved in Platelet Adhesion to exposed collagen |
| 0.9 | 31.5 | REACTOME ACTIVATION OF KAINATE RECEPTORS UPON GLUTAMATE BINDING | Genes involved in Activation of Kainate Receptors upon glutamate binding |
| 0.9 | 17.1 | REACTOME ERKS ARE INACTIVATED | Genes involved in ERKs are inactivated |
| 0.8 | 17.6 | REACTOME INHIBITION OF INSULIN SECRETION BY ADRENALINE NORADRENALINE | Genes involved in Inhibition of Insulin Secretion by Adrenaline/Noradrenaline |
| 0.8 | 9.4 | REACTOME ADENYLATE CYCLASE ACTIVATING PATHWAY | Genes involved in Adenylate cyclase activating pathway |
| 0.8 | 22.6 | REACTOME RIP MEDIATED NFKB ACTIVATION VIA DAI | Genes involved in RIP-mediated NFkB activation via DAI |
| 0.7 | 66.5 | REACTOME INTERFERON ALPHA BETA SIGNALING | Genes involved in Interferon alpha/beta signaling |
| 0.7 | 15.3 | REACTOME ENDOSOMAL SORTING COMPLEX REQUIRED FOR TRANSPORT ESCRT | Genes involved in Endosomal Sorting Complex Required For Transport (ESCRT) |
| 0.7 | 13.1 | REACTOME XENOBIOTICS | Genes involved in Xenobiotics |
| 0.7 | 22.5 | REACTOME CHONDROITIN SULFATE BIOSYNTHESIS | Genes involved in Chondroitin sulfate biosynthesis |
| 0.7 | 23.0 | REACTOME EXTRINSIC PATHWAY FOR APOPTOSIS | Genes involved in Extrinsic Pathway for Apoptosis |
| 0.7 | 12.1 | REACTOME G2 M DNA DAMAGE CHECKPOINT | Genes involved in G2/M DNA damage checkpoint |
| 0.7 | 12.6 | REACTOME FANCONI ANEMIA PATHWAY | Genes involved in Fanconi Anemia pathway |
| 0.7 | 7.7 | REACTOME PLATELET CALCIUM HOMEOSTASIS | Genes involved in Platelet calcium homeostasis |
| 0.7 | 16.2 | REACTOME THE ROLE OF NEF IN HIV1 REPLICATION AND DISEASE PATHOGENESIS | Genes involved in The role of Nef in HIV-1 replication and disease pathogenesis |
| 0.6 | 10.2 | REACTOME REGULATION OF MRNA STABILITY BY PROTEINS THAT BIND AU RICH ELEMENTS | Genes involved in Regulation of mRNA Stability by Proteins that Bind AU-rich Elements |
| 0.6 | 12.1 | REACTOME SIGNALING BY FGFR3 MUTANTS | Genes involved in Signaling by FGFR3 mutants |
| 0.6 | 13.8 | REACTOME ANTIGEN ACTIVATES B CELL RECEPTOR LEADING TO GENERATION OF SECOND MESSENGERS | Genes involved in Antigen Activates B Cell Receptor Leading to Generation of Second Messengers |
| 0.6 | 14.6 | REACTOME CRMPS IN SEMA3A SIGNALING | Genes involved in CRMPs in Sema3A signaling |
| 0.6 | 18.3 | REACTOME CIRCADIAN REPRESSION OF EXPRESSION BY REV ERBA | Genes involved in Circadian Repression of Expression by REV-ERBA |
| 0.5 | 25.5 | REACTOME INTRINSIC PATHWAY FOR APOPTOSIS | Genes involved in Intrinsic Pathway for Apoptosis |
| 0.5 | 11.6 | REACTOME IRON UPTAKE AND TRANSPORT | Genes involved in Iron uptake and transport |
| 0.5 | 2.6 | REACTOME NFKB IS ACTIVATED AND SIGNALS SURVIVAL | Genes involved in NF-kB is activated and signals survival |
| 0.5 | 11.4 | REACTOME ERK MAPK TARGETS | Genes involved in ERK/MAPK targets |
| 0.5 | 10.8 | REACTOME ACTIVATION OF THE AP1 FAMILY OF TRANSCRIPTION FACTORS | Genes involved in Activation of the AP-1 family of transcription factors |
| 0.5 | 6.1 | REACTOME MRNA DECAY BY 3 TO 5 EXORIBONUCLEASE | Genes involved in mRNA Decay by 3' to 5' Exoribonuclease |
| 0.5 | 10.1 | REACTOME GLYCOGEN BREAKDOWN GLYCOGENOLYSIS | Genes involved in Glycogen breakdown (glycogenolysis) |
| 0.5 | 24.9 | REACTOME ION TRANSPORT BY P TYPE ATPASES | Genes involved in Ion transport by P-type ATPases |
| 0.5 | 5.8 | REACTOME P38MAPK EVENTS | Genes involved in p38MAPK events |
| 0.5 | 19.5 | REACTOME LATENT INFECTION OF HOMO SAPIENS WITH MYCOBACTERIUM TUBERCULOSIS | Genes involved in Latent infection of Homo sapiens with Mycobacterium tuberculosis |
| 0.5 | 14.7 | REACTOME SULFUR AMINO ACID METABOLISM | Genes involved in Sulfur amino acid metabolism |
| 0.5 | 14.0 | REACTOME G0 AND EARLY G1 | Genes involved in G0 and Early G1 |
| 0.5 | 4.1 | REACTOME MICRORNA MIRNA BIOGENESIS | Genes involved in MicroRNA (miRNA) Biogenesis |
| 0.5 | 9.0 | REACTOME BASE FREE SUGAR PHOSPHATE REMOVAL VIA THE SINGLE NUCLEOTIDE REPLACEMENT PATHWAY | Genes involved in Base-free sugar-phosphate removal via the single-nucleotide replacement pathway |
| 0.4 | 3.9 | REACTOME CS DS DEGRADATION | Genes involved in CS/DS degradation |
| 0.4 | 13.2 | REACTOME SYNTHESIS OF VERY LONG CHAIN FATTY ACYL COAS | Genes involved in Synthesis of very long-chain fatty acyl-CoAs |
| 0.4 | 12.5 | REACTOME KERATAN SULFATE BIOSYNTHESIS | Genes involved in Keratan sulfate biosynthesis |
| 0.4 | 7.6 | REACTOME TERMINATION OF O GLYCAN BIOSYNTHESIS | Genes involved in Termination of O-glycan biosynthesis |
| 0.4 | 9.1 | REACTOME CYTOSOLIC SULFONATION OF SMALL MOLECULES | Genes involved in Cytosolic sulfonation of small molecules |
| 0.4 | 8.5 | REACTOME TGF BETA RECEPTOR SIGNALING IN EMT EPITHELIAL TO MESENCHYMAL TRANSITION | Genes involved in TGF-beta receptor signaling in EMT (epithelial to mesenchymal transition) |
| 0.4 | 3.0 | REACTOME SIGNALING BY FGFR | Genes involved in Signaling by FGFR |
| 0.4 | 27.9 | REACTOME FORMATION OF THE TERNARY COMPLEX AND SUBSEQUENTLY THE 43S COMPLEX | Genes involved in Formation of the ternary complex, and subsequently, the 43S complex |
| 0.3 | 3.8 | REACTOME TETRAHYDROBIOPTERIN BH4 SYNTHESIS RECYCLING SALVAGE AND REGULATION | Genes involved in Tetrahydrobiopterin (BH4) synthesis, recycling, salvage and regulation |
| 0.3 | 6.7 | REACTOME CLASS C 3 METABOTROPIC GLUTAMATE PHEROMONE RECEPTORS | Genes involved in Class C/3 (Metabotropic glutamate/pheromone receptors) |
| 0.3 | 4.8 | REACTOME THROMBIN SIGNALLING THROUGH PROTEINASE ACTIVATED RECEPTORS PARS | Genes involved in Thrombin signalling through proteinase activated receptors (PARs) |
| 0.3 | 3.5 | REACTOME SIGNAL ATTENUATION | Genes involved in Signal attenuation |
| 0.3 | 51.1 | REACTOME G ALPHA I SIGNALLING EVENTS | Genes involved in G alpha (i) signalling events |
| 0.3 | 11.3 | REACTOME GLYCOLYSIS | Genes involved in Glycolysis |
| 0.3 | 3.0 | REACTOME TAK1 ACTIVATES NFKB BY PHOSPHORYLATION AND ACTIVATION OF IKKS COMPLEX | Genes involved in TAK1 activates NFkB by phosphorylation and activation of IKKs complex |
| 0.3 | 6.5 | REACTOME REGULATION OF INSULIN LIKE GROWTH FACTOR IGF ACTIVITY BY INSULIN LIKE GROWTH FACTOR BINDING PROTEINS IGFBPS | Genes involved in Regulation of Insulin-like Growth Factor (IGF) Activity by Insulin-like Growth Factor Binding Proteins (IGFBPs) |
| 0.3 | 5.7 | REACTOME AMINE DERIVED HORMONES | Genes involved in Amine-derived hormones |
| 0.3 | 1.8 | REACTOME TRYPTOPHAN CATABOLISM | Genes involved in Tryptophan catabolism |
| 0.3 | 4.1 | REACTOME GAMMA CARBOXYLATION TRANSPORT AND AMINO TERMINAL CLEAVAGE OF PROTEINS | Genes involved in Gamma-carboxylation, transport, and amino-terminal cleavage of proteins |
| 0.2 | 6.0 | REACTOME PROLACTIN RECEPTOR SIGNALING | Genes involved in Prolactin receptor signaling |
| 0.2 | 4.3 | REACTOME REGULATION OF COMPLEMENT CASCADE | Genes involved in Regulation of Complement cascade |
| 0.2 | 5.4 | REACTOME HIGHLY CALCIUM PERMEABLE POSTSYNAPTIC NICOTINIC ACETYLCHOLINE RECEPTORS | Genes involved in Highly calcium permeable postsynaptic nicotinic acetylcholine receptors |
| 0.2 | 3.1 | REACTOME VEGF LIGAND RECEPTOR INTERACTIONS | Genes involved in VEGF ligand-receptor interactions |
| 0.2 | 4.6 | REACTOME SIGNALING BY FGFR1 FUSION MUTANTS | Genes involved in Signaling by FGFR1 fusion mutants |
| 0.2 | 9.4 | REACTOME INTERACTION BETWEEN L1 AND ANKYRINS | Genes involved in Interaction between L1 and Ankyrins |
| 0.2 | 6.3 | REACTOME RNA POL III TRANSCRIPTION INITIATION FROM TYPE 2 PROMOTER | Genes involved in RNA Polymerase III Transcription Initiation From Type 2 Promoter |
| 0.2 | 9.0 | REACTOME CGMP EFFECTS | Genes involved in cGMP effects |
| 0.2 | 7.3 | REACTOME EFFECTS OF PIP2 HYDROLYSIS | Genes involved in Effects of PIP2 hydrolysis |
| 0.2 | 15.7 | REACTOME G ALPHA1213 SIGNALLING EVENTS | Genes involved in G alpha (12/13) signalling events |
| 0.2 | 3.6 | REACTOME DARPP 32 EVENTS | Genes involved in DARPP-32 events |
| 0.2 | 7.4 | REACTOME SYNTHESIS SECRETION AND INACTIVATION OF GLP1 | Genes involved in Synthesis, Secretion, and Inactivation of Glucagon-like Peptide-1 (GLP-1) |
| 0.2 | 5.7 | REACTOME GABA A RECEPTOR ACTIVATION | Genes involved in GABA A receptor activation |
| 0.2 | 16.8 | REACTOME NUCLEAR RECEPTOR TRANSCRIPTION PATHWAY | Genes involved in Nuclear Receptor transcription pathway |
| 0.2 | 1.7 | REACTOME ETHANOL OXIDATION | Genes involved in Ethanol oxidation |
| 0.2 | 3.9 | REACTOME ACTIVATION OF GENES BY ATF4 | Genes involved in Activation of Genes by ATF4 |
| 0.2 | 0.7 | REACTOME PLATELET AGGREGATION PLUG FORMATION | Genes involved in Platelet Aggregation (Plug Formation) |
| 0.2 | 4.5 | REACTOME RAP1 SIGNALLING | Genes involved in Rap1 signalling |
| 0.2 | 1.7 | REACTOME TRANSCRIPTIONAL REGULATION OF WHITE ADIPOCYTE DIFFERENTIATION | Genes involved in Transcriptional Regulation of White Adipocyte Differentiation |
| 0.2 | 2.6 | REACTOME INFLAMMASOMES | Genes involved in Inflammasomes |
| 0.2 | 4.9 | REACTOME PRE NOTCH EXPRESSION AND PROCESSING | Genes involved in Pre-NOTCH Expression and Processing |
| 0.2 | 2.4 | REACTOME REVERSIBLE HYDRATION OF CARBON DIOXIDE | Genes involved in Reversible Hydration of Carbon Dioxide |
| 0.2 | 2.7 | REACTOME ZINC TRANSPORTERS | Genes involved in Zinc transporters |
| 0.1 | 5.7 | REACTOME NETRIN1 SIGNALING | Genes involved in Netrin-1 signaling |
| 0.1 | 1.3 | REACTOME RNA POL III TRANSCRIPTION INITIATION FROM TYPE 3 PROMOTER | Genes involved in RNA Polymerase III Transcription Initiation From Type 3 Promoter |
| 0.1 | 2.1 | REACTOME ACYL CHAIN REMODELLING OF PS | Genes involved in Acyl chain remodelling of PS |
| 0.1 | 4.9 | REACTOME TIGHT JUNCTION INTERACTIONS | Genes involved in Tight junction interactions |
| 0.1 | 2.3 | REACTOME OTHER SEMAPHORIN INTERACTIONS | Genes involved in Other semaphorin interactions |
| 0.1 | 6.5 | REACTOME GOLGI ASSOCIATED VESICLE BIOGENESIS | Genes involved in Golgi Associated Vesicle Biogenesis |
| 0.1 | 1.1 | REACTOME G BETA GAMMA SIGNALLING THROUGH PI3KGAMMA | Genes involved in G beta:gamma signalling through PI3Kgamma |
| 0.1 | 3.7 | REACTOME POST NMDA RECEPTOR ACTIVATION EVENTS | Genes involved in Post NMDA receptor activation events |
| 0.1 | 1.3 | REACTOME INTERFERON SIGNALING | Genes involved in Interferon Signaling |
| 0.1 | 2.1 | REACTOME PROTEOLYTIC CLEAVAGE OF SNARE COMPLEX PROTEINS | Genes involved in Proteolytic cleavage of SNARE complex proteins |
| 0.1 | 4.6 | REACTOME NOTCH1 INTRACELLULAR DOMAIN REGULATES TRANSCRIPTION | Genes involved in NOTCH1 Intracellular Domain Regulates Transcription |
| 0.1 | 1.6 | REACTOME NUCLEOTIDE LIKE PURINERGIC RECEPTORS | Genes involved in Nucleotide-like (purinergic) receptors |
| 0.1 | 5.6 | REACTOME NCAM1 INTERACTIONS | Genes involved in NCAM1 interactions |
| 0.1 | 1.7 | REACTOME PROCESSING OF INTRONLESS PRE MRNAS | Genes involved in Processing of Intronless Pre-mRNAs |
| 0.1 | 4.4 | REACTOME VOLTAGE GATED POTASSIUM CHANNELS | Genes involved in Voltage gated Potassium channels |
| 0.1 | 22.6 | REACTOME GENERIC TRANSCRIPTION PATHWAY | Genes involved in Generic Transcription Pathway |
| 0.1 | 1.8 | REACTOME AMINE COMPOUND SLC TRANSPORTERS | Genes involved in Amine compound SLC transporters |
| 0.1 | 1.9 | REACTOME SIGNALING BY TGF BETA RECEPTOR COMPLEX | Genes involved in Signaling by TGF-beta Receptor Complex |
| 0.1 | 2.0 | REACTOME MRNA 3 END PROCESSING | Genes involved in mRNA 3'-end processing |
| 0.1 | 1.5 | REACTOME ANTIGEN PRESENTATION FOLDING ASSEMBLY AND PEPTIDE LOADING OF CLASS I MHC | Genes involved in Antigen Presentation: Folding, assembly and peptide loading of class I MHC |
| 0.1 | 2.3 | REACTOME CELL SURFACE INTERACTIONS AT THE VASCULAR WALL | Genes involved in Cell surface interactions at the vascular wall |
| 0.1 | 1.9 | REACTOME INWARDLY RECTIFYING K CHANNELS | Genes involved in Inwardly rectifying K+ channels |
| 0.1 | 0.5 | REACTOME SYNTHESIS OF BILE ACIDS AND BILE SALTS VIA 24 HYDROXYCHOLESTEROL | Genes involved in Synthesis of bile acids and bile salts via 24-hydroxycholesterol |
| 0.1 | 1.5 | REACTOME CONVERSION FROM APC C CDC20 TO APC C CDH1 IN LATE ANAPHASE | Genes involved in Conversion from APC/C:Cdc20 to APC/C:Cdh1 in late anaphase |
| 0.1 | 1.2 | REACTOME FACILITATIVE NA INDEPENDENT GLUCOSE TRANSPORTERS | Genes involved in Facilitative Na+-independent glucose transporters |
| 0.1 | 1.4 | REACTOME HDL MEDIATED LIPID TRANSPORT | Genes involved in HDL-mediated lipid transport |
| 0.1 | 4.7 | REACTOME GLYCEROPHOSPHOLIPID BIOSYNTHESIS | Genes involved in Glycerophospholipid biosynthesis |
| 0.1 | 3.4 | REACTOME AMINO ACID AND OLIGOPEPTIDE SLC TRANSPORTERS | Genes involved in Amino acid and oligopeptide SLC transporters |
| 0.1 | 0.4 | REACTOME BILE SALT AND ORGANIC ANION SLC TRANSPORTERS | Genes involved in Bile salt and organic anion SLC transporters |
| 0.0 | 5.1 | REACTOME FACTORS INVOLVED IN MEGAKARYOCYTE DEVELOPMENT AND PLATELET PRODUCTION | Genes involved in Factors involved in megakaryocyte development and platelet production |
| 0.0 | 0.9 | REACTOME SIGNALING BY BMP | Genes involved in Signaling by BMP |
| 0.0 | 0.4 | REACTOME ABACAVIR TRANSPORT AND METABOLISM | Genes involved in Abacavir transport and metabolism |
| 0.0 | 3.9 | REACTOME SIGNALING BY RHO GTPASES | Genes involved in Signaling by Rho GTPases |
| 0.0 | 0.6 | REACTOME INTEGRATION OF ENERGY METABOLISM | Genes involved in Integration of energy metabolism |
| 0.0 | 0.4 | REACTOME PASSIVE TRANSPORT BY AQUAPORINS | Genes involved in Passive Transport by Aquaporins |
| 0.0 | 0.2 | REACTOME NFKB ACTIVATION THROUGH FADD RIP1 PATHWAY MEDIATED BY CASPASE 8 AND10 | Genes involved in NF-kB activation through FADD/RIP-1 pathway mediated by caspase-8 and -10 |
| 0.0 | 0.2 | REACTOME PEPTIDE CHAIN ELONGATION | Genes involved in Peptide chain elongation |
| 0.0 | 1.3 | REACTOME PHASE1 FUNCTIONALIZATION OF COMPOUNDS | Genes involved in Phase 1 - Functionalization of compounds |
| 0.0 | 0.3 | REACTOME REGULATION OF PYRUVATE DEHYDROGENASE PDH COMPLEX | Genes involved in Regulation of pyruvate dehydrogenase (PDH) complex |