Project
GNF SymAtlas + NCI-60 cancer cell lines, human (Su, 2004; Ross, 2000)
Navigation
Downloads
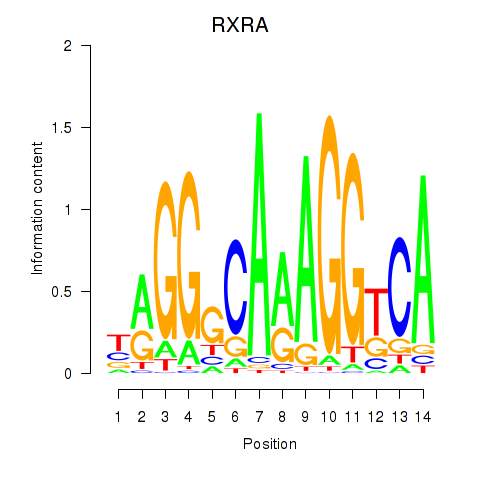
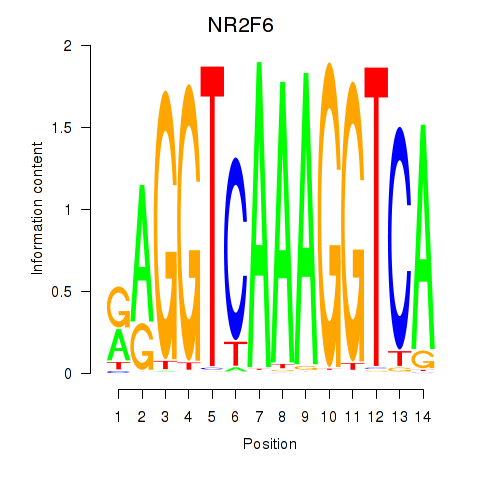
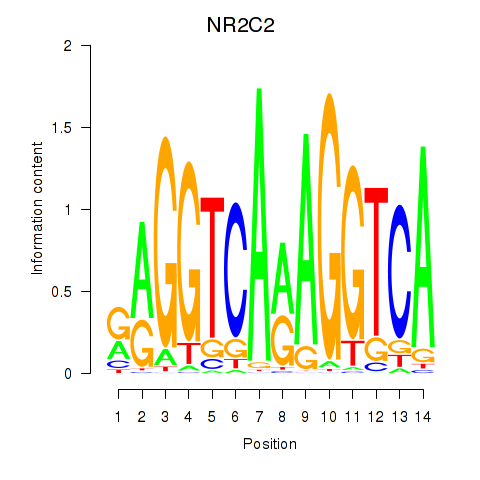
Results for RXRA_NR2F6_NR2C2
Z-value: 1.13
Motif logo
Transcription factors associated with RXRA_NR2F6_NR2C2
| Gene Symbol | Gene ID | Gene Info |
|---|---|---|
|
RXRA
|
ENSG00000186350.12 | RXRA |
|
NR2F6
|
ENSG00000160113.6 | NR2F6 |
|
NR2C2
|
ENSG00000177463.15 | NR2C2 |
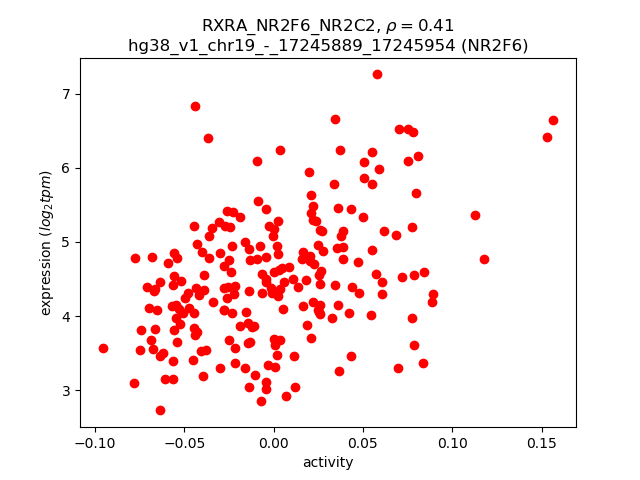
Activity-expression correlation:
| Gene | Promoter | Pearson corr. coef. | P-value | Plot |
|---|---|---|---|---|
| NR2F6 | hg38_v1_chr19_-_17245889_17245954 | 0.41 | 2.7e-10 | Click! |
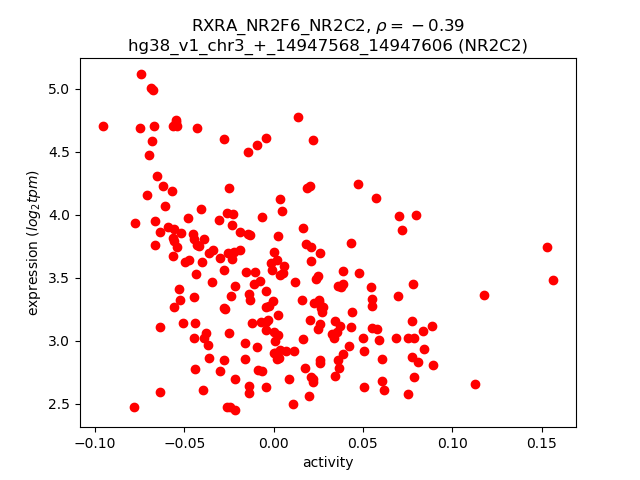
| NR2C2 | hg38_v1_chr3_+_14947568_14947606, hg38_v1_chr3_+_14947680_14947729 | -0.39 | 2.3e-09 | Click! |
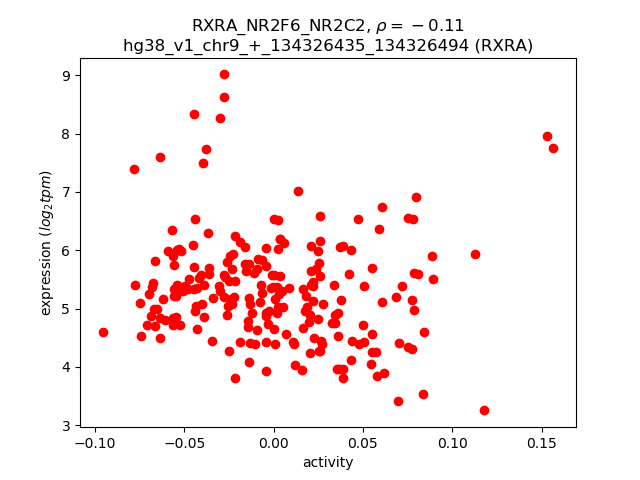
| RXRA | hg38_v1_chr9_+_134326435_134326494 | -0.11 | 1.2e-01 | Click! |
Activity profile of RXRA_NR2F6_NR2C2 motif
Sorted Z-values of RXRA_NR2F6_NR2C2 motif
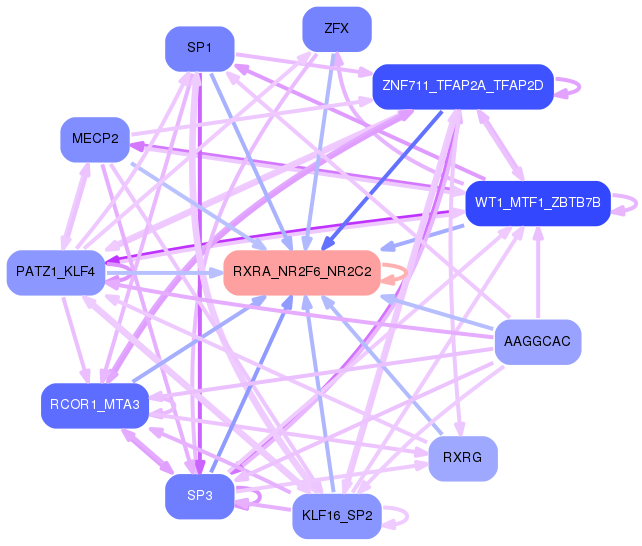
Network of associatons between targets according to the STRING database.

First level regulatory network of RXRA_NR2F6_NR2C2
Gene Ontology Analysis
Gene overrepresentation in biological process category:
| Log-likelihood per target | Total log-likelihood | Term | Description |
|---|---|---|---|
| 23.3 | 69.8 | GO:0070902 | mitochondrial tRNA pseudouridine synthesis(GO:0070902) |
| 6.9 | 20.7 | GO:0002368 | B cell cytokine production(GO:0002368) |
| 6.6 | 19.7 | GO:1904732 | regulation of electron carrier activity(GO:1904732) |
| 5.9 | 23.6 | GO:0060621 | regulation of cholesterol import(GO:0060620) negative regulation of cholesterol import(GO:0060621) regulation of sterol import(GO:2000909) negative regulation of sterol import(GO:2000910) |
| 5.9 | 17.6 | GO:0046504 | ether lipid biosynthetic process(GO:0008611) glycerol ether biosynthetic process(GO:0046504) ether biosynthetic process(GO:1901503) |
| 5.9 | 23.4 | GO:0006238 | CMP salvage(GO:0006238) CMP biosynthetic process(GO:0009224) CMP metabolic process(GO:0046035) |
| 5.5 | 27.4 | GO:0071163 | DNA replication preinitiation complex assembly(GO:0071163) |
| 4.8 | 14.3 | GO:0014810 | positive regulation of skeletal muscle contraction by regulation of release of sequestered calcium ion(GO:0014810) |
| 4.4 | 4.4 | GO:0036388 | pre-replicative complex assembly involved in nuclear cell cycle DNA replication(GO:0006267) pre-replicative complex assembly(GO:0036388) pre-replicative complex assembly involved in cell cycle DNA replication(GO:1902299) |
| 4.3 | 13.0 | GO:0015746 | tricarboxylic acid transport(GO:0006842) citrate transport(GO:0015746) |
| 2.8 | 11.2 | GO:1900533 | medium-chain fatty-acyl-CoA catabolic process(GO:0036114) long-chain fatty-acyl-CoA catabolic process(GO:0036116) palmitic acid metabolic process(GO:1900533) palmitic acid biosynthetic process(GO:1900535) |
| 2.8 | 11.2 | GO:0002188 | translation reinitiation(GO:0002188) |
| 2.6 | 42.3 | GO:0030150 | protein import into mitochondrial matrix(GO:0030150) |
| 2.6 | 28.2 | GO:0010756 | positive regulation of plasminogen activation(GO:0010756) |
| 2.3 | 11.6 | GO:0036089 | cleavage furrow formation(GO:0036089) endothelial tube lumen extension(GO:0097498) skeletal muscle satellite cell migration(GO:1902766) |
| 2.3 | 13.9 | GO:0071460 | cellular response to cell-matrix adhesion(GO:0071460) |
| 2.2 | 8.7 | GO:0035964 | COPI-coated vesicle budding(GO:0035964) Golgi transport vesicle coating(GO:0048200) COPI coating of Golgi vesicle(GO:0048205) |
| 2.0 | 22.3 | GO:0042262 | DNA protection(GO:0042262) |
| 1.9 | 34.9 | GO:0030388 | fructose 1,6-bisphosphate metabolic process(GO:0030388) |
| 1.9 | 7.6 | GO:0060327 | cytoplasmic actin-based contraction involved in cell motility(GO:0060327) |
| 1.9 | 1.9 | GO:0010903 | negative regulation of very-low-density lipoprotein particle remodeling(GO:0010903) |
| 1.8 | 10.9 | GO:0002943 | tRNA dihydrouridine synthesis(GO:0002943) |
| 1.8 | 23.4 | GO:1900029 | positive regulation of ruffle assembly(GO:1900029) |
| 1.7 | 6.7 | GO:0034445 | regulation of plasma lipoprotein particle oxidation(GO:0034444) negative regulation of plasma lipoprotein particle oxidation(GO:0034445) |
| 1.6 | 12.6 | GO:0030997 | regulation of centriole-centriole cohesion(GO:0030997) |
| 1.6 | 6.3 | GO:0021691 | cerebellar Purkinje cell layer maturation(GO:0021691) |
| 1.6 | 6.2 | GO:0046166 | glyceraldehyde-3-phosphate biosynthetic process(GO:0046166) |
| 1.6 | 14.0 | GO:0046940 | nucleoside monophosphate phosphorylation(GO:0046940) |
| 1.5 | 13.6 | GO:1902109 | negative regulation of mitochondrial membrane permeability involved in apoptotic process(GO:1902109) |
| 1.4 | 14.0 | GO:0070601 | centromeric sister chromatid cohesion(GO:0070601) |
| 1.3 | 100.6 | GO:0070125 | mitochondrial translational elongation(GO:0070125) |
| 1.3 | 11.8 | GO:0034551 | respiratory chain complex III assembly(GO:0017062) mitochondrial respiratory chain complex III assembly(GO:0034551) |
| 1.2 | 23.5 | GO:0006782 | protoporphyrinogen IX biosynthetic process(GO:0006782) |
| 1.2 | 11.0 | GO:0071578 | zinc II ion transmembrane import(GO:0071578) |
| 1.2 | 8.4 | GO:0032218 | riboflavin transport(GO:0032218) |
| 1.2 | 1.2 | GO:0009822 | alkaloid catabolic process(GO:0009822) |
| 1.2 | 2.3 | GO:0033594 | response to hydroxyisoflavone(GO:0033594) |
| 1.2 | 3.5 | GO:0001831 | trophectodermal cellular morphogenesis(GO:0001831) |
| 1.2 | 18.6 | GO:1900364 | negative regulation of transcription elongation from RNA polymerase II promoter(GO:0034244) negative regulation of mRNA polyadenylation(GO:1900364) |
| 1.1 | 9.0 | GO:0032020 | ISG15-protein conjugation(GO:0032020) |
| 1.1 | 7.6 | GO:0080009 | mRNA methylation(GO:0080009) |
| 1.1 | 10.7 | GO:0061179 | negative regulation of insulin secretion involved in cellular response to glucose stimulus(GO:0061179) |
| 1.1 | 4.3 | GO:0070221 | sulfide oxidation(GO:0019418) sulfide oxidation, using sulfide:quinone oxidoreductase(GO:0070221) |
| 1.0 | 16.2 | GO:0043248 | proteasome assembly(GO:0043248) |
| 1.0 | 10.1 | GO:0043951 | negative regulation of cAMP-mediated signaling(GO:0043951) |
| 1.0 | 8.0 | GO:0046604 | positive regulation of mitotic centrosome separation(GO:0046604) |
| 1.0 | 8.7 | GO:0010265 | SCF complex assembly(GO:0010265) |
| 1.0 | 2.9 | GO:0007174 | epidermal growth factor catabolic process(GO:0007174) |
| 0.9 | 2.8 | GO:0033168 | conversion of ds siRNA to ss siRNA involved in RNA interference(GO:0033168) conversion of ds siRNA to ss siRNA(GO:0036404) |
| 0.9 | 6.4 | GO:2000491 | positive regulation of hepatic stellate cell activation(GO:2000491) |
| 0.9 | 29.0 | GO:0008334 | histone mRNA metabolic process(GO:0008334) |
| 0.9 | 18.0 | GO:0018345 | protein palmitoylation(GO:0018345) |
| 0.9 | 8.1 | GO:0031536 | positive regulation of exit from mitosis(GO:0031536) negative regulation of mammary gland epithelial cell proliferation(GO:0033600) thelarche(GO:0042695) mammary gland branching involved in thelarche(GO:0060744) regulation of branching involved in mammary gland duct morphogenesis(GO:0060762) |
| 0.9 | 2.7 | GO:1903572 | regulation of protein kinase D signaling(GO:1903570) positive regulation of protein kinase D signaling(GO:1903572) |
| 0.9 | 5.4 | GO:0035105 | sterol regulatory element binding protein import into nucleus(GO:0035105) |
| 0.9 | 6.9 | GO:0046322 | negative regulation of fatty acid oxidation(GO:0046322) |
| 0.8 | 60.1 | GO:0032981 | NADH dehydrogenase complex assembly(GO:0010257) mitochondrial respiratory chain complex I assembly(GO:0032981) mitochondrial respiratory chain complex I biogenesis(GO:0097031) |
| 0.8 | 33.3 | GO:0045737 | positive regulation of cyclin-dependent protein serine/threonine kinase activity(GO:0045737) |
| 0.8 | 2.5 | GO:1902498 | regulation of protein autoubiquitination(GO:1902498) |
| 0.8 | 5.6 | GO:0045079 | negative regulation of chemokine biosynthetic process(GO:0045079) |
| 0.8 | 6.4 | GO:0042866 | pyruvate biosynthetic process(GO:0042866) |
| 0.8 | 5.6 | GO:0002933 | lipid hydroxylation(GO:0002933) |
| 0.8 | 0.8 | GO:1903093 | regulation of protein K48-linked deubiquitination(GO:1903093) negative regulation of protein K48-linked deubiquitination(GO:1903094) negative regulation of ubiquitin-specific protease activity(GO:2000157) |
| 0.8 | 11.6 | GO:0006703 | estrogen biosynthetic process(GO:0006703) |
| 0.7 | 4.4 | GO:0046952 | ketone body catabolic process(GO:0046952) |
| 0.7 | 8.7 | GO:0010764 | negative regulation of fibroblast migration(GO:0010764) |
| 0.7 | 5.0 | GO:0090235 | regulation of metaphase plate congression(GO:0090235) |
| 0.7 | 2.0 | GO:2000397 | protein targeting to vacuole involved in ubiquitin-dependent protein catabolic process via the multivesicular body sorting pathway(GO:0043328) ubiquitin-dependent endocytosis(GO:0070086) regulation of ubiquitin-dependent endocytosis(GO:2000395) positive regulation of ubiquitin-dependent endocytosis(GO:2000397) |
| 0.7 | 2.0 | GO:1904479 | negative regulation of intestinal absorption(GO:1904479) response to iron ion starvation(GO:1990641) |
| 0.6 | 8.4 | GO:0048312 | intracellular distribution of mitochondria(GO:0048312) |
| 0.6 | 3.9 | GO:0010032 | meiotic chromosome condensation(GO:0010032) |
| 0.6 | 4.9 | GO:2000049 | positive regulation of cell-cell adhesion mediated by cadherin(GO:2000049) |
| 0.6 | 2.4 | GO:0046947 | hydroxylysine metabolic process(GO:0046946) hydroxylysine biosynthetic process(GO:0046947) |
| 0.6 | 0.6 | GO:1903939 | regulation of TORC2 signaling(GO:1903939) |
| 0.6 | 5.2 | GO:0042256 | mature ribosome assembly(GO:0042256) |
| 0.6 | 1.7 | GO:0006114 | glycerol biosynthetic process(GO:0006114) cellular response to potassium ion starvation(GO:0051365) |
| 0.6 | 5.6 | GO:0048096 | chromatin-mediated maintenance of transcription(GO:0048096) |
| 0.6 | 3.4 | GO:0006287 | base-excision repair, gap-filling(GO:0006287) |
| 0.6 | 3.3 | GO:0090206 | negative regulation of cholesterol biosynthetic process(GO:0045541) negative regulation of cholesterol metabolic process(GO:0090206) |
| 0.5 | 1.6 | GO:0060151 | peroxisome localization(GO:0060151) microtubule-based peroxisome localization(GO:0060152) |
| 0.5 | 4.3 | GO:0045039 | protein import into mitochondrial inner membrane(GO:0045039) |
| 0.5 | 4.2 | GO:0055129 | proline biosynthetic process(GO:0006561) L-proline biosynthetic process(GO:0055129) |
| 0.5 | 3.1 | GO:0060754 | positive regulation of mast cell chemotaxis(GO:0060754) |
| 0.5 | 1.5 | GO:0090158 | endoplasmic reticulum membrane organization(GO:0090158) |
| 0.5 | 1.9 | GO:0008588 | release of cytoplasmic sequestered NF-kappaB(GO:0008588) |
| 0.5 | 14.2 | GO:0009649 | entrainment of circadian clock(GO:0009649) |
| 0.5 | 1.4 | GO:0090341 | negative regulation of secretion of lysosomal enzymes(GO:0090341) |
| 0.4 | 6.2 | GO:0060124 | positive regulation of growth hormone secretion(GO:0060124) |
| 0.4 | 5.8 | GO:0016024 | CDP-diacylglycerol biosynthetic process(GO:0016024) |
| 0.4 | 4.1 | GO:0006264 | mitochondrial DNA replication(GO:0006264) |
| 0.4 | 1.2 | GO:0072365 | regulation of cellular ketone metabolic process by negative regulation of transcription from RNA polymerase II promoter(GO:0072365) |
| 0.4 | 3.2 | GO:0090063 | positive regulation of microtubule nucleation(GO:0090063) |
| 0.4 | 2.0 | GO:1901162 | primary amino compound biosynthetic process(GO:1901162) |
| 0.4 | 9.1 | GO:0051085 | chaperone mediated protein folding requiring cofactor(GO:0051085) |
| 0.4 | 1.1 | GO:0014858 | negative regulation of hydrogen peroxide biosynthetic process(GO:0010730) positive regulation of skeletal muscle cell proliferation(GO:0014858) positive regulation of skeletal muscle satellite cell proliferation(GO:1902724) positive regulation of growth factor dependent skeletal muscle satellite cell proliferation(GO:1902728) |
| 0.4 | 3.6 | GO:0051601 | exocyst localization(GO:0051601) |
| 0.3 | 4.1 | GO:0000492 | box C/D snoRNP assembly(GO:0000492) |
| 0.3 | 8.3 | GO:0006491 | N-glycan processing(GO:0006491) |
| 0.3 | 1.0 | GO:2001295 | malonyl-CoA biosynthetic process(GO:2001295) |
| 0.3 | 2.3 | GO:0030421 | defecation(GO:0030421) |
| 0.3 | 9.2 | GO:0030214 | hyaluronan catabolic process(GO:0030214) |
| 0.3 | 2.9 | GO:0044854 | plasma membrane raft assembly(GO:0044854) plasma membrane raft organization(GO:0044857) caveola assembly(GO:0070836) |
| 0.3 | 1.9 | GO:0097428 | protein maturation by iron-sulfur cluster transfer(GO:0097428) |
| 0.3 | 0.3 | GO:0032785 | negative regulation of DNA-templated transcription, elongation(GO:0032785) |
| 0.3 | 2.2 | GO:0000255 | allantoin metabolic process(GO:0000255) |
| 0.3 | 26.4 | GO:0042273 | ribosomal large subunit biogenesis(GO:0042273) |
| 0.3 | 10.4 | GO:0032008 | positive regulation of TOR signaling(GO:0032008) |
| 0.3 | 1.2 | GO:0072143 | mesangial cell development(GO:0072143) glomerular mesangial cell development(GO:0072144) |
| 0.3 | 0.9 | GO:0090675 | intermicrovillar adhesion(GO:0090675) |
| 0.3 | 0.9 | GO:0050787 | antibiotic metabolic process(GO:0016999) detoxification of mercury ion(GO:0050787) |
| 0.3 | 3.7 | GO:0019388 | galactose catabolic process(GO:0019388) |
| 0.3 | 1.1 | GO:0002159 | desmosome assembly(GO:0002159) |
| 0.3 | 4.2 | GO:0090110 | cargo loading into COPII-coated vesicle(GO:0090110) |
| 0.3 | 1.6 | GO:2001206 | positive regulation of osteoclast development(GO:2001206) |
| 0.3 | 1.6 | GO:0019509 | L-methionine biosynthetic process from methylthioadenosine(GO:0019509) |
| 0.3 | 1.3 | GO:0048050 | post-embryonic eye morphogenesis(GO:0048050) |
| 0.2 | 2.9 | GO:0052696 | flavonoid glucuronidation(GO:0052696) xenobiotic glucuronidation(GO:0052697) |
| 0.2 | 1.4 | GO:0007296 | vitellogenesis(GO:0007296) |
| 0.2 | 3.7 | GO:2000480 | negative regulation of cAMP-dependent protein kinase activity(GO:2000480) |
| 0.2 | 5.2 | GO:0008053 | mitochondrial fusion(GO:0008053) |
| 0.2 | 1.3 | GO:1990034 | calcium ion export from cell(GO:1990034) |
| 0.2 | 1.6 | GO:0015677 | copper ion import(GO:0015677) |
| 0.2 | 3.3 | GO:0006610 | ribosomal protein import into nucleus(GO:0006610) |
| 0.2 | 2.4 | GO:0060052 | neurofilament cytoskeleton organization(GO:0060052) |
| 0.2 | 0.9 | GO:0002296 | T-helper 1 cell lineage commitment(GO:0002296) |
| 0.2 | 14.9 | GO:0006414 | translational elongation(GO:0006414) |
| 0.2 | 1.5 | GO:1904424 | regulation of GTP binding(GO:1904424) |
| 0.2 | 0.9 | GO:0001519 | peptide amidation(GO:0001519) protein amidation(GO:0018032) peptide modification(GO:0031179) |
| 0.2 | 19.9 | GO:0036498 | IRE1-mediated unfolded protein response(GO:0036498) |
| 0.2 | 3.2 | GO:0010839 | negative regulation of keratinocyte proliferation(GO:0010839) |
| 0.2 | 3.8 | GO:0019852 | L-ascorbic acid metabolic process(GO:0019852) |
| 0.2 | 3.3 | GO:0031115 | negative regulation of microtubule polymerization(GO:0031115) |
| 0.2 | 4.8 | GO:0034063 | stress granule assembly(GO:0034063) |
| 0.2 | 1.4 | GO:0070475 | rRNA base methylation(GO:0070475) |
| 0.2 | 0.8 | GO:0010641 | positive regulation of platelet-derived growth factor receptor signaling pathway(GO:0010641) |
| 0.2 | 22.7 | GO:0006614 | SRP-dependent cotranslational protein targeting to membrane(GO:0006614) |
| 0.2 | 1.4 | GO:0046951 | cellular ketone body metabolic process(GO:0046950) ketone body biosynthetic process(GO:0046951) |
| 0.2 | 0.8 | GO:0060751 | epithelial cell proliferation involved in mammary gland duct elongation(GO:0060750) branch elongation involved in mammary gland duct branching(GO:0060751) |
| 0.2 | 8.1 | GO:0006099 | tricarboxylic acid cycle(GO:0006099) |
| 0.2 | 1.5 | GO:1903659 | regulation of complement-dependent cytotoxicity(GO:1903659) |
| 0.2 | 6.3 | GO:1902884 | positive regulation of response to oxidative stress(GO:1902884) |
| 0.2 | 1.8 | GO:0019919 | peptidyl-arginine methylation, to asymmetrical-dimethyl arginine(GO:0019919) |
| 0.2 | 1.8 | GO:0060628 | regulation of ER to Golgi vesicle-mediated transport(GO:0060628) |
| 0.2 | 4.9 | GO:0006337 | nucleosome disassembly(GO:0006337) |
| 0.2 | 2.4 | GO:0051873 | killing by host of symbiont cells(GO:0051873) |
| 0.2 | 0.5 | GO:0009644 | response to high light intensity(GO:0009644) cellular response to light intensity(GO:0071484) cellular response to high light intensity(GO:0071486) retinal rod cell apoptotic process(GO:0097473) retinal cell apoptotic process(GO:1990009) |
| 0.2 | 2.4 | GO:0015937 | coenzyme A biosynthetic process(GO:0015937) |
| 0.2 | 6.4 | GO:0015893 | drug transport(GO:0015893) |
| 0.2 | 0.5 | GO:0097272 | ammonia homeostasis(GO:0097272) |
| 0.1 | 5.5 | GO:0042438 | melanin biosynthetic process(GO:0042438) |
| 0.1 | 1.7 | GO:0060372 | regulation of atrial cardiac muscle cell membrane repolarization(GO:0060372) |
| 0.1 | 0.4 | GO:2001027 | negative regulation of endothelial cell chemotaxis(GO:2001027) |
| 0.1 | 3.9 | GO:0042026 | protein refolding(GO:0042026) |
| 0.1 | 0.7 | GO:0071638 | negative regulation of monocyte chemotactic protein-1 production(GO:0071638) |
| 0.1 | 9.2 | GO:0006749 | glutathione metabolic process(GO:0006749) |
| 0.1 | 3.2 | GO:0007597 | blood coagulation, intrinsic pathway(GO:0007597) |
| 0.1 | 0.4 | GO:1903028 | asymmetric Golgi ribbon formation(GO:0090164) positive regulation of opsonization(GO:1903028) |
| 0.1 | 3.0 | GO:0030212 | hyaluronan metabolic process(GO:0030212) |
| 0.1 | 2.4 | GO:0032486 | Rap protein signal transduction(GO:0032486) |
| 0.1 | 10.5 | GO:0006521 | regulation of cellular amino acid metabolic process(GO:0006521) |
| 0.1 | 2.2 | GO:0000052 | citrulline metabolic process(GO:0000052) |
| 0.1 | 4.5 | GO:0060236 | regulation of mitotic spindle organization(GO:0060236) |
| 0.1 | 2.3 | GO:0030252 | growth hormone secretion(GO:0030252) |
| 0.1 | 3.6 | GO:0097178 | ruffle assembly(GO:0097178) |
| 0.1 | 2.0 | GO:0030854 | positive regulation of granulocyte differentiation(GO:0030854) |
| 0.1 | 6.7 | GO:0016266 | O-glycan processing(GO:0016266) |
| 0.1 | 3.4 | GO:0070536 | protein K63-linked deubiquitination(GO:0070536) |
| 0.1 | 1.8 | GO:0036295 | cellular response to increased oxygen levels(GO:0036295) |
| 0.1 | 2.0 | GO:0035635 | entry of bacterium into host cell(GO:0035635) |
| 0.1 | 0.3 | GO:1904247 | positive regulation of polynucleotide adenylyltransferase activity(GO:1904247) |
| 0.1 | 3.1 | GO:0030970 | retrograde protein transport, ER to cytosol(GO:0030970) |
| 0.1 | 0.3 | GO:0009786 | regulation of asymmetric cell division(GO:0009786) |
| 0.1 | 1.7 | GO:0006907 | pinocytosis(GO:0006907) |
| 0.1 | 0.9 | GO:1903543 | positive regulation of exosomal secretion(GO:1903543) |
| 0.1 | 3.8 | GO:0042274 | ribosomal small subunit biogenesis(GO:0042274) |
| 0.1 | 1.9 | GO:0032802 | low-density lipoprotein particle receptor catabolic process(GO:0032802) |
| 0.1 | 0.2 | GO:0070681 | glutaminyl-tRNAGln biosynthesis via transamidation(GO:0070681) |
| 0.1 | 5.0 | GO:0000079 | regulation of cyclin-dependent protein serine/threonine kinase activity(GO:0000079) |
| 0.1 | 1.3 | GO:2000052 | positive regulation of non-canonical Wnt signaling pathway(GO:2000052) |
| 0.1 | 6.4 | GO:0045670 | regulation of osteoclast differentiation(GO:0045670) |
| 0.1 | 0.3 | GO:0003366 | cell-matrix adhesion involved in ameboidal cell migration(GO:0003366) |
| 0.1 | 2.8 | GO:0070423 | nucleotide-binding oligomerization domain containing signaling pathway(GO:0070423) |
| 0.1 | 4.0 | GO:0005978 | glycogen biosynthetic process(GO:0005978) glucan biosynthetic process(GO:0009250) |
| 0.1 | 1.4 | GO:0007095 | mitotic G2 DNA damage checkpoint(GO:0007095) |
| 0.1 | 0.4 | GO:0033564 | anterior/posterior axon guidance(GO:0033564) |
| 0.1 | 0.8 | GO:0043922 | negative regulation by host of viral transcription(GO:0043922) |
| 0.1 | 1.8 | GO:0002089 | lens morphogenesis in camera-type eye(GO:0002089) |
| 0.1 | 1.2 | GO:0097264 | self proteolysis(GO:0097264) |
| 0.1 | 0.5 | GO:0098814 | spontaneous neurotransmitter secretion(GO:0061669) spontaneous synaptic transmission(GO:0098814) |
| 0.1 | 6.5 | GO:0070268 | cornification(GO:0070268) |
| 0.1 | 2.0 | GO:0043928 | exonucleolytic nuclear-transcribed mRNA catabolic process involved in deadenylation-dependent decay(GO:0043928) |
| 0.1 | 2.7 | GO:0030224 | monocyte differentiation(GO:0030224) |
| 0.1 | 0.3 | GO:0001957 | intramembranous ossification(GO:0001957) direct ossification(GO:0036072) positive regulation of cell chemotaxis to fibroblast growth factor(GO:1904849) positive regulation of endothelial cell chemotaxis to fibroblast growth factor(GO:2000546) |
| 0.1 | 0.2 | GO:0044240 | multicellular organism lipid catabolic process(GO:0044240) |
| 0.1 | 1.3 | GO:0021680 | cerebellar Purkinje cell layer development(GO:0021680) |
| 0.0 | 0.2 | GO:0034472 | snRNA 3'-end processing(GO:0034472) |
| 0.0 | 3.2 | GO:0060999 | positive regulation of dendritic spine development(GO:0060999) |
| 0.0 | 0.3 | GO:0046643 | regulation of gamma-delta T cell differentiation(GO:0045586) regulation of gamma-delta T cell activation(GO:0046643) |
| 0.0 | 5.1 | GO:0007030 | Golgi organization(GO:0007030) |
| 0.0 | 0.4 | GO:0048227 | plasma membrane to endosome transport(GO:0048227) |
| 0.0 | 0.2 | GO:0017182 | peptidyl-diphthamide metabolic process(GO:0017182) peptidyl-diphthamide biosynthetic process from peptidyl-histidine(GO:0017183) |
| 0.0 | 0.3 | GO:0006848 | pyruvate transport(GO:0006848) pyruvate transmembrane transport(GO:1901475) |
| 0.0 | 0.6 | GO:0006829 | zinc II ion transport(GO:0006829) |
| 0.0 | 0.3 | GO:0070305 | response to cGMP(GO:0070305) |
| 0.0 | 1.0 | GO:0006409 | tRNA export from nucleus(GO:0006409) tRNA transport(GO:0051031) tRNA-containing ribonucleoprotein complex export from nucleus(GO:0071431) |
| 0.0 | 11.5 | GO:0030335 | positive regulation of cell migration(GO:0030335) |
| 0.0 | 0.2 | GO:0021562 | vestibulocochlear nerve development(GO:0021562) |
| 0.0 | 0.2 | GO:0042738 | exogenous drug catabolic process(GO:0042738) |
| 0.0 | 3.3 | GO:0002377 | immunoglobulin production(GO:0002377) |
| 0.0 | 0.5 | GO:0007141 | male meiosis I(GO:0007141) |
| 0.0 | 0.5 | GO:0039694 | viral RNA genome replication(GO:0039694) RNA replication(GO:0039703) |
| 0.0 | 0.2 | GO:0031033 | myosin filament organization(GO:0031033) myosin filament assembly(GO:0031034) striated muscle myosin thick filament assembly(GO:0071688) |
| 0.0 | 2.5 | GO:0006939 | smooth muscle contraction(GO:0006939) |
| 0.0 | 3.9 | GO:0000209 | protein polyubiquitination(GO:0000209) |
| 0.0 | 2.6 | GO:0008213 | protein methylation(GO:0006479) protein alkylation(GO:0008213) |
| 0.0 | 0.1 | GO:0006669 | sphinganine-1-phosphate biosynthetic process(GO:0006669) |
| 0.0 | 1.7 | GO:0030449 | regulation of complement activation(GO:0030449) |
| 0.0 | 0.5 | GO:0001881 | receptor recycling(GO:0001881) |
| 0.0 | 0.3 | GO:0051865 | protein autoubiquitination(GO:0051865) |
| 0.0 | 1.7 | GO:0051262 | protein tetramerization(GO:0051262) |
| 0.0 | 0.1 | GO:0031914 | negative regulation of synaptic plasticity(GO:0031914) |
Gene overrepresentation in cellular component category:
| Log-likelihood per target | Total log-likelihood | Term | Description |
|---|---|---|---|
| 8.4 | 33.5 | GO:0001405 | presequence translocase-associated import motor(GO:0001405) |
| 6.3 | 31.5 | GO:0045272 | plasma membrane respiratory chain complex I(GO:0045272) |
| 4.1 | 29.0 | GO:0005683 | U7 snRNP(GO:0005683) pICln-Sm protein complex(GO:0034715) |
| 3.5 | 28.2 | GO:0000015 | phosphopyruvate hydratase complex(GO:0000015) |
| 2.7 | 18.6 | GO:0032021 | NELF complex(GO:0032021) |
| 2.5 | 27.8 | GO:0033588 | Elongator holoenzyme complex(GO:0033588) |
| 2.3 | 65.1 | GO:0005763 | organellar small ribosomal subunit(GO:0000314) mitochondrial small ribosomal subunit(GO:0005763) |
| 2.3 | 20.7 | GO:0046696 | cyclin-dependent protein kinase activating kinase holoenzyme complex(GO:0019907) lipopolysaccharide receptor complex(GO:0046696) |
| 2.0 | 14.0 | GO:0031415 | NatA complex(GO:0031415) |
| 1.9 | 31.1 | GO:0034366 | spherical high-density lipoprotein particle(GO:0034366) |
| 1.8 | 14.1 | GO:0031931 | TORC1 complex(GO:0031931) |
| 1.6 | 13.0 | GO:0070761 | pre-snoRNP complex(GO:0070761) |
| 1.5 | 7.6 | GO:0045293 | MIS complex(GO:0036396) mRNA editing complex(GO:0045293) |
| 1.5 | 16.2 | GO:0008541 | proteasome regulatory particle, lid subcomplex(GO:0008541) |
| 1.5 | 4.4 | GO:0005656 | nuclear pre-replicative complex(GO:0005656) pre-replicative complex(GO:0036387) |
| 1.4 | 14.9 | GO:0005853 | eukaryotic translation elongation factor 1 complex(GO:0005853) |
| 1.3 | 3.9 | GO:0000799 | nuclear condensin complex(GO:0000799) |
| 1.3 | 10.3 | GO:0005742 | mitochondrial outer membrane translocase complex(GO:0005742) |
| 1.0 | 2.9 | GO:0032419 | extrinsic component of lysosome membrane(GO:0032419) |
| 1.0 | 8.7 | GO:0070765 | gamma-secretase complex(GO:0070765) |
| 0.9 | 2.8 | GO:0033167 | ARC complex(GO:0033167) |
| 0.9 | 2.8 | GO:0035370 | UBC13-UEV1A complex(GO:0035370) |
| 0.9 | 35.5 | GO:0000315 | organellar large ribosomal subunit(GO:0000315) mitochondrial large ribosomal subunit(GO:0005762) |
| 0.9 | 11.8 | GO:0045275 | mitochondrial respiratory chain complex III(GO:0005750) respiratory chain complex III(GO:0045275) |
| 0.9 | 47.2 | GO:0019005 | SCF ubiquitin ligase complex(GO:0019005) |
| 0.8 | 26.4 | GO:0030687 | preribosome, large subunit precursor(GO:0030687) |
| 0.8 | 5.3 | GO:1990726 | Lsm1-7-Pat1 complex(GO:1990726) |
| 0.7 | 2.2 | GO:0070195 | growth hormone receptor complex(GO:0070195) |
| 0.7 | 3.4 | GO:0043625 | delta DNA polymerase complex(GO:0043625) |
| 0.6 | 1.9 | GO:0045323 | interleukin-1 receptor complex(GO:0045323) |
| 0.6 | 3.1 | GO:0000835 | ER ubiquitin ligase complex(GO:0000835) Hrd1p ubiquitin ligase complex(GO:0000836) |
| 0.6 | 4.2 | GO:1990111 | spermatoproteasome complex(GO:1990111) |
| 0.6 | 3.4 | GO:0070552 | BRISC complex(GO:0070552) |
| 0.5 | 6.5 | GO:0019773 | proteasome core complex, alpha-subunit complex(GO:0019773) |
| 0.5 | 28.4 | GO:0031430 | M band(GO:0031430) |
| 0.5 | 6.3 | GO:0030126 | COPI vesicle coat(GO:0030126) |
| 0.5 | 5.4 | GO:0005638 | lamin filament(GO:0005638) |
| 0.5 | 4.3 | GO:0042719 | mitochondrial intermembrane space protein transporter complex(GO:0042719) |
| 0.4 | 3.5 | GO:0005827 | polar microtubule(GO:0005827) |
| 0.4 | 4.3 | GO:0033180 | proton-transporting V-type ATPase, V1 domain(GO:0033180) |
| 0.4 | 22.7 | GO:0005747 | mitochondrial respiratory chain complex I(GO:0005747) NADH dehydrogenase complex(GO:0030964) respiratory chain complex I(GO:0045271) |
| 0.4 | 172.8 | GO:0005759 | mitochondrial matrix(GO:0005759) |
| 0.4 | 7.6 | GO:0032433 | filopodium tip(GO:0032433) |
| 0.4 | 19.2 | GO:0005782 | peroxisomal matrix(GO:0005782) microbody lumen(GO:0031907) |
| 0.4 | 2.9 | GO:0016012 | sarcoglycan complex(GO:0016012) |
| 0.3 | 1.7 | GO:0071012 | catalytic step 1 spliceosome(GO:0071012) |
| 0.3 | 21.4 | GO:0005758 | mitochondrial intermembrane space(GO:0005758) |
| 0.3 | 3.3 | GO:0005652 | nuclear lamina(GO:0005652) |
| 0.3 | 3.9 | GO:0005577 | fibrinogen complex(GO:0005577) |
| 0.3 | 0.9 | GO:0033565 | ESCRT-0 complex(GO:0033565) |
| 0.3 | 8.2 | GO:0035371 | microtubule plus-end(GO:0035371) |
| 0.3 | 2.0 | GO:0045179 | apical cortex(GO:0045179) |
| 0.3 | 2.4 | GO:0000938 | GARP complex(GO:0000938) |
| 0.3 | 5.6 | GO:0005721 | pericentric heterochromatin(GO:0005721) |
| 0.2 | 1.0 | GO:1990876 | cytoplasmic side of nuclear pore(GO:1990876) |
| 0.2 | 4.2 | GO:0030127 | COPII vesicle coat(GO:0030127) |
| 0.2 | 7.8 | GO:0031528 | microvillus membrane(GO:0031528) |
| 0.2 | 1.5 | GO:0071256 | Sec61 translocon complex(GO:0005784) translocon complex(GO:0071256) |
| 0.2 | 2.0 | GO:0000813 | ESCRT I complex(GO:0000813) |
| 0.2 | 22.7 | GO:0022625 | cytosolic large ribosomal subunit(GO:0022625) |
| 0.2 | 3.6 | GO:0000145 | exocyst(GO:0000145) |
| 0.2 | 11.2 | GO:0022627 | cytosolic small ribosomal subunit(GO:0022627) |
| 0.2 | 5.3 | GO:0032040 | small-subunit processome(GO:0032040) |
| 0.2 | 2.0 | GO:0005915 | zonula adherens(GO:0005915) |
| 0.1 | 4.9 | GO:0016514 | SWI/SNF complex(GO:0016514) |
| 0.1 | 18.2 | GO:0017053 | transcriptional repressor complex(GO:0017053) |
| 0.1 | 1.9 | GO:0005686 | U2 snRNP(GO:0005686) |
| 0.1 | 14.1 | GO:0000777 | condensed chromosome kinetochore(GO:0000777) |
| 0.1 | 4.2 | GO:0000407 | pre-autophagosomal structure(GO:0000407) |
| 0.1 | 2.7 | GO:0030122 | AP-2 adaptor complex(GO:0030122) |
| 0.1 | 11.6 | GO:0101003 | ficolin-1-rich granule membrane(GO:0101003) |
| 0.1 | 28.0 | GO:0005743 | mitochondrial inner membrane(GO:0005743) |
| 0.1 | 7.3 | GO:0045171 | intercellular bridge(GO:0045171) |
| 0.1 | 2.9 | GO:0016592 | mediator complex(GO:0016592) |
| 0.1 | 13.2 | GO:0035578 | azurophil granule lumen(GO:0035578) |
| 0.1 | 1.0 | GO:0016600 | flotillin complex(GO:0016600) |
| 0.1 | 3.2 | GO:0012507 | ER to Golgi transport vesicle membrane(GO:0012507) |
| 0.1 | 6.2 | GO:0005881 | cytoplasmic microtubule(GO:0005881) |
| 0.1 | 0.5 | GO:0032280 | symmetric synapse(GO:0032280) |
| 0.1 | 34.1 | GO:0005788 | endoplasmic reticulum lumen(GO:0005788) |
| 0.1 | 2.3 | GO:0030057 | desmosome(GO:0030057) |
| 0.1 | 20.9 | GO:0000151 | ubiquitin ligase complex(GO:0000151) |
| 0.1 | 1.3 | GO:0043205 | microfibril(GO:0001527) fibril(GO:0043205) |
| 0.1 | 0.8 | GO:0097550 | transcriptional preinitiation complex(GO:0097550) |
| 0.1 | 0.3 | GO:0034669 | integrin alpha4-beta7 complex(GO:0034669) |
| 0.1 | 4.4 | GO:0033116 | endoplasmic reticulum-Golgi intermediate compartment membrane(GO:0033116) |
| 0.1 | 1.3 | GO:0032591 | dendritic spine membrane(GO:0032591) |
| 0.1 | 0.5 | GO:0005579 | membrane attack complex(GO:0005579) |
| 0.1 | 4.1 | GO:0031093 | platelet alpha granule lumen(GO:0031093) |
| 0.1 | 4.1 | GO:1904724 | tertiary granule lumen(GO:1904724) |
| 0.1 | 0.8 | GO:0034098 | VCP-NPL4-UFD1 AAA ATPase complex(GO:0034098) |
| 0.1 | 0.2 | GO:0030956 | glutamyl-tRNA(Gln) amidotransferase complex(GO:0030956) |
| 0.1 | 0.8 | GO:0070971 | endoplasmic reticulum exit site(GO:0070971) |
| 0.0 | 0.8 | GO:0030867 | rough endoplasmic reticulum membrane(GO:0030867) |
| 0.0 | 1.8 | GO:0005840 | ribosome(GO:0005840) |
| 0.0 | 0.9 | GO:0071782 | endoplasmic reticulum tubular network(GO:0071782) |
| 0.0 | 6.0 | GO:0072562 | blood microparticle(GO:0072562) |
| 0.0 | 1.3 | GO:0000159 | protein phosphatase type 2A complex(GO:0000159) |
| 0.0 | 0.4 | GO:0017119 | Golgi transport complex(GO:0017119) |
| 0.0 | 2.3 | GO:0016529 | sarcoplasmic reticulum(GO:0016529) |
| 0.0 | 2.0 | GO:0010494 | cytoplasmic stress granule(GO:0010494) |
| 0.0 | 0.5 | GO:0035098 | ESC/E(Z) complex(GO:0035098) |
| 0.0 | 0.3 | GO:0042405 | nuclear inclusion body(GO:0042405) |
Gene overrepresentation in molecular function category:
| Log-likelihood per target | Total log-likelihood | Term | Description |
|---|---|---|---|
| 23.3 | 69.8 | GO:0004730 | pseudouridylate synthase activity(GO:0004730) |
| 6.0 | 18.0 | GO:0030156 | benzodiazepine receptor binding(GO:0030156) |
| 5.5 | 33.3 | GO:0061575 | cyclin-dependent protein serine/threonine kinase activator activity(GO:0061575) |
| 5.2 | 36.6 | GO:0030613 | oxidoreductase activity, acting on phosphorus or arsenic in donors(GO:0030613) oxidoreductase activity, acting on phosphorus or arsenic in donors, disulfide as acceptor(GO:0030614) |
| 5.1 | 25.5 | GO:0070653 | high-density lipoprotein particle receptor binding(GO:0070653) |
| 4.7 | 23.5 | GO:0016749 | 5-aminolevulinate synthase activity(GO:0003870) N-succinyltransferase activity(GO:0016749) |
| 4.3 | 13.0 | GO:0015137 | citrate transmembrane transporter activity(GO:0015137) tricarboxylic acid transmembrane transporter activity(GO:0015142) |
| 4.1 | 16.3 | GO:0070404 | NADH binding(GO:0070404) |
| 3.5 | 28.2 | GO:0004634 | phosphopyruvate hydratase activity(GO:0004634) |
| 3.5 | 20.7 | GO:0034186 | apolipoprotein A-I binding(GO:0034186) |
| 3.4 | 44.0 | GO:0000774 | adenyl-nucleotide exchange factor activity(GO:0000774) |
| 3.3 | 23.4 | GO:0004849 | uridine kinase activity(GO:0004849) |
| 3.3 | 36.1 | GO:0004332 | fructose-bisphosphate aldolase activity(GO:0004332) |
| 3.1 | 9.2 | GO:0004566 | beta-glucuronidase activity(GO:0004566) |
| 2.5 | 10.0 | GO:0017077 | oxidative phosphorylation uncoupler activity(GO:0017077) |
| 2.5 | 19.7 | GO:0016531 | copper chaperone activity(GO:0016531) |
| 2.1 | 14.4 | GO:0061133 | endopeptidase activator activity(GO:0061133) |
| 2.0 | 7.9 | GO:0004466 | long-chain-acyl-CoA dehydrogenase activity(GO:0004466) |
| 1.8 | 5.5 | GO:0033981 | D-dopachrome decarboxylase activity(GO:0033981) |
| 1.8 | 10.9 | GO:0017150 | tRNA dihydrouridine synthase activity(GO:0017150) |
| 1.8 | 9.0 | GO:0042296 | ISG15 transferase activity(GO:0042296) |
| 1.7 | 14.0 | GO:0050145 | nucleoside phosphate kinase activity(GO:0050145) |
| 1.7 | 32.7 | GO:0051537 | 2 iron, 2 sulfur cluster binding(GO:0051537) |
| 1.7 | 11.8 | GO:0016681 | ubiquinol-cytochrome-c reductase activity(GO:0008121) oxidoreductase activity, acting on diphenols and related substances as donors, cytochrome as acceptor(GO:0016681) |
| 1.6 | 6.4 | GO:0005124 | scavenger receptor binding(GO:0005124) |
| 1.6 | 11.2 | GO:0036042 | long-chain fatty acyl-CoA binding(GO:0036042) |
| 1.6 | 6.4 | GO:0004743 | pyruvate kinase activity(GO:0004743) |
| 1.5 | 4.4 | GO:0003858 | 3-hydroxybutyrate dehydrogenase activity(GO:0003858) |
| 1.4 | 9.5 | GO:0046912 | transferase activity, transferring acyl groups, acyl groups converted into alkyl on transfer(GO:0046912) |
| 1.3 | 9.2 | GO:0051022 | GDP-dissociation inhibitor binding(GO:0051021) Rho GDP-dissociation inhibitor binding(GO:0051022) |
| 1.3 | 6.5 | GO:0008240 | tripeptidyl-peptidase activity(GO:0008240) |
| 1.2 | 3.7 | GO:0003974 | UDP-N-acetylglucosamine 4-epimerase activity(GO:0003974) UDP-glucose 4-epimerase activity(GO:0003978) |
| 1.2 | 20.4 | GO:0001222 | transcription corepressor binding(GO:0001222) |
| 1.2 | 8.4 | GO:0032217 | riboflavin transporter activity(GO:0032217) |
| 1.2 | 5.8 | GO:0043183 | vascular endothelial growth factor receptor 1 binding(GO:0043183) |
| 1.2 | 3.5 | GO:0031208 | POZ domain binding(GO:0031208) |
| 1.1 | 5.6 | GO:0034875 | oxidoreductase activity, acting on CH or CH2 groups, quinone or similar compound as acceptor(GO:0033695) caffeine oxidase activity(GO:0034875) |
| 1.1 | 6.3 | GO:0016725 | oxidoreductase activity, acting on CH or CH2 groups(GO:0016725) |
| 1.1 | 10.6 | GO:0003988 | acetyl-CoA C-acyltransferase activity(GO:0003988) |
| 1.0 | 14.0 | GO:0004596 | peptide alpha-N-acetyltransferase activity(GO:0004596) |
| 0.9 | 7.6 | GO:0035727 | lysophosphatidic acid binding(GO:0035727) |
| 0.9 | 4.6 | GO:0016936 | galactoside binding(GO:0016936) |
| 0.7 | 20.1 | GO:0003746 | translation elongation factor activity(GO:0003746) |
| 0.7 | 4.2 | GO:0004735 | pyrroline-5-carboxylate reductase activity(GO:0004735) |
| 0.7 | 5.4 | GO:0015288 | porin activity(GO:0015288) |
| 0.6 | 2.6 | GO:0046933 | proton-transporting ATP synthase activity, rotational mechanism(GO:0046933) |
| 0.6 | 12.2 | GO:0004887 | thyroid hormone receptor activity(GO:0004887) |
| 0.6 | 16.5 | GO:0071949 | FAD binding(GO:0071949) |
| 0.6 | 2.4 | GO:0008475 | procollagen-lysine 5-dioxygenase activity(GO:0008475) procollagen glucosyltransferase activity(GO:0033823) procollagen galactosyltransferase activity(GO:0050211) |
| 0.6 | 3.5 | GO:0015093 | ferrous iron transmembrane transporter activity(GO:0015093) |
| 0.6 | 5.7 | GO:0034485 | phosphatidylinositol-3,4,5-trisphosphate 5-phosphatase activity(GO:0034485) |
| 0.6 | 1.7 | GO:0004613 | phosphoenolpyruvate carboxykinase activity(GO:0004611) phosphoenolpyruvate carboxykinase (GTP) activity(GO:0004613) |
| 0.6 | 2.8 | GO:0004530 | deoxyribonuclease I activity(GO:0004530) |
| 0.6 | 6.2 | GO:0016861 | intramolecular oxidoreductase activity, interconverting aldoses and ketoses(GO:0016861) |
| 0.5 | 7.6 | GO:0004653 | polypeptide N-acetylgalactosaminyltransferase activity(GO:0004653) |
| 0.5 | 1.4 | GO:0000253 | 3-keto sterol reductase activity(GO:0000253) |
| 0.5 | 22.7 | GO:0008137 | NADH dehydrogenase (ubiquinone) activity(GO:0008137) NADH dehydrogenase (quinone) activity(GO:0050136) |
| 0.4 | 3.4 | GO:0000268 | peroxisome targeting sequence binding(GO:0000268) |
| 0.4 | 1.6 | GO:0005375 | copper ion transmembrane transporter activity(GO:0005375) |
| 0.4 | 1.9 | GO:0035614 | snRNA stem-loop binding(GO:0035614) |
| 0.4 | 10.7 | GO:0070003 | threonine-type endopeptidase activity(GO:0004298) threonine-type peptidase activity(GO:0070003) |
| 0.4 | 5.3 | GO:0017070 | U6 snRNA binding(GO:0017070) |
| 0.3 | 1.4 | GO:0032810 | sterol response element binding(GO:0032810) |
| 0.3 | 4.1 | GO:0001075 | transcription factor activity, RNA polymerase II core promoter sequence-specific binding involved in preinitiation complex assembly(GO:0001075) |
| 0.3 | 3.1 | GO:0089720 | caspase binding(GO:0089720) |
| 0.3 | 10.4 | GO:0043539 | protein serine/threonine kinase activator activity(GO:0043539) |
| 0.3 | 2.2 | GO:0016403 | dimethylargininase activity(GO:0016403) |
| 0.3 | 64.8 | GO:0003735 | structural constituent of ribosome(GO:0003735) |
| 0.3 | 5.9 | GO:0005385 | zinc ion transmembrane transporter activity(GO:0005385) |
| 0.3 | 4.4 | GO:0003688 | DNA replication origin binding(GO:0003688) |
| 0.3 | 4.9 | GO:0008320 | protein transmembrane transporter activity(GO:0008320) |
| 0.3 | 9.5 | GO:0017025 | TBP-class protein binding(GO:0017025) |
| 0.3 | 5.6 | GO:0035173 | histone kinase activity(GO:0035173) |
| 0.3 | 28.4 | GO:0070491 | repressing transcription factor binding(GO:0070491) |
| 0.3 | 38.6 | GO:0051082 | unfolded protein binding(GO:0051082) |
| 0.3 | 3.1 | GO:0097027 | ubiquitin-protein transferase activator activity(GO:0097027) |
| 0.2 | 2.0 | GO:0016813 | hydrolase activity, acting on carbon-nitrogen (but not peptide) bonds, in linear amidines(GO:0016813) |
| 0.2 | 10.1 | GO:0061631 | ubiquitin conjugating enzyme activity(GO:0061631) |
| 0.2 | 0.2 | GO:0050508 | glucuronosyl-N-acetylglucosaminyl-proteoglycan 4-alpha-N-acetylglucosaminyltransferase activity(GO:0050508) |
| 0.2 | 8.6 | GO:0004198 | calcium-dependent cysteine-type endopeptidase activity(GO:0004198) |
| 0.2 | 6.0 | GO:0005092 | GDP-dissociation inhibitor activity(GO:0005092) |
| 0.2 | 3.4 | GO:0008296 | 3'-5'-exodeoxyribonuclease activity(GO:0008296) |
| 0.2 | 16.7 | GO:0005507 | copper ion binding(GO:0005507) |
| 0.2 | 3.6 | GO:0017049 | GTP-Rho binding(GO:0017049) |
| 0.2 | 5.5 | GO:0070410 | co-SMAD binding(GO:0070410) |
| 0.2 | 1.8 | GO:0035242 | protein-arginine omega-N asymmetric methyltransferase activity(GO:0035242) |
| 0.2 | 7.4 | GO:0004364 | glutathione transferase activity(GO:0004364) |
| 0.2 | 6.4 | GO:0043027 | cysteine-type endopeptidase inhibitor activity involved in apoptotic process(GO:0043027) |
| 0.2 | 3.7 | GO:0004862 | cAMP-dependent protein kinase inhibitor activity(GO:0004862) |
| 0.2 | 0.7 | GO:0016971 | flavin-linked sulfhydryl oxidase activity(GO:0016971) thiol oxidase activity(GO:0016972) |
| 0.2 | 2.8 | GO:0042043 | neurexin family protein binding(GO:0042043) |
| 0.2 | 8.1 | GO:0030331 | estrogen receptor binding(GO:0030331) |
| 0.1 | 3.8 | GO:0015002 | cytochrome-c oxidase activity(GO:0004129) heme-copper terminal oxidase activity(GO:0015002) oxidoreductase activity, acting on a heme group of donors, oxygen as acceptor(GO:0016676) |
| 0.1 | 2.2 | GO:0034450 | ubiquitin-ubiquitin ligase activity(GO:0034450) |
| 0.1 | 4.4 | GO:0004707 | MAP kinase activity(GO:0004707) |
| 0.1 | 5.6 | GO:0030544 | Hsp70 protein binding(GO:0030544) |
| 0.1 | 0.4 | GO:0005042 | netrin receptor activity(GO:0005042) |
| 0.1 | 2.7 | GO:0098748 | clathrin adaptor activity(GO:0035615) endocytic adaptor activity(GO:0098748) |
| 0.1 | 10.9 | GO:0019003 | GDP binding(GO:0019003) |
| 0.1 | 9.1 | GO:0051087 | chaperone binding(GO:0051087) |
| 0.1 | 4.9 | GO:0031492 | nucleosomal DNA binding(GO:0031492) |
| 0.1 | 2.0 | GO:0019966 | interleukin-1 binding(GO:0019966) |
| 0.1 | 2.1 | GO:0016805 | dipeptidase activity(GO:0016805) |
| 0.1 | 12.1 | GO:0005070 | SH3/SH2 adaptor activity(GO:0005070) |
| 0.1 | 1.7 | GO:0005095 | GTPase inhibitor activity(GO:0005095) |
| 0.1 | 0.3 | GO:0005477 | pyruvate secondary active transmembrane transporter activity(GO:0005477) |
| 0.1 | 2.5 | GO:0042171 | 1-acylglycerol-3-phosphate O-acyltransferase activity(GO:0003841) lysophosphatidic acid acyltransferase activity(GO:0042171) lysophospholipid acyltransferase activity(GO:0071617) |
| 0.1 | 3.2 | GO:0070840 | dynein complex binding(GO:0070840) |
| 0.1 | 1.6 | GO:0004143 | diacylglycerol kinase activity(GO:0004143) |
| 0.1 | 6.0 | GO:0098531 | RNA polymerase II transcription factor activity, ligand-activated sequence-specific DNA binding(GO:0004879) transcription factor activity, direct ligand regulated sequence-specific DNA binding(GO:0098531) |
| 0.1 | 1.8 | GO:0005537 | mannose binding(GO:0005537) |
| 0.1 | 1.2 | GO:0015923 | alpha-mannosidase activity(GO:0004559) mannosidase activity(GO:0015923) |
| 0.1 | 7.9 | GO:0051219 | phosphoprotein binding(GO:0051219) |
| 0.1 | 0.9 | GO:0000062 | fatty-acyl-CoA binding(GO:0000062) |
| 0.1 | 2.2 | GO:0070064 | proline-rich region binding(GO:0070064) |
| 0.1 | 1.1 | GO:0045294 | alpha-catenin binding(GO:0045294) |
| 0.1 | 1.8 | GO:0046961 | ATPase activity, coupled to transmembrane movement of ions, rotational mechanism(GO:0044769) proton-transporting ATPase activity, rotational mechanism(GO:0046961) |
| 0.1 | 11.0 | GO:0000149 | SNARE binding(GO:0000149) |
| 0.1 | 16.4 | GO:0061630 | ubiquitin protein ligase activity(GO:0061630) |
| 0.1 | 21.8 | GO:0003924 | GTPase activity(GO:0003924) |
| 0.1 | 1.9 | GO:0046966 | thyroid hormone receptor binding(GO:0046966) |
| 0.1 | 2.9 | GO:0015020 | glucuronosyltransferase activity(GO:0015020) |
| 0.1 | 0.5 | GO:0042301 | phosphate ion binding(GO:0042301) |
| 0.1 | 0.3 | GO:0005111 | type 2 fibroblast growth factor receptor binding(GO:0005111) |
| 0.1 | 1.7 | GO:0086008 | voltage-gated potassium channel activity involved in cardiac muscle cell action potential repolarization(GO:0086008) |
| 0.1 | 0.1 | GO:0004040 | amidase activity(GO:0004040) |
| 0.1 | 1.4 | GO:0098847 | sequence-specific single stranded DNA binding(GO:0098847) |
| 0.1 | 1.4 | GO:0008649 | rRNA methyltransferase activity(GO:0008649) |
| 0.1 | 0.9 | GO:0043225 | anion transmembrane-transporting ATPase activity(GO:0043225) |
| 0.1 | 3.9 | GO:0035064 | methylated histone binding(GO:0035064) |
| 0.1 | 3.0 | GO:0030145 | manganese ion binding(GO:0030145) |
| 0.1 | 8.3 | GO:0002020 | protease binding(GO:0002020) |
| 0.1 | 1.8 | GO:0050431 | transforming growth factor beta binding(GO:0050431) |
| 0.1 | 0.8 | GO:0005112 | Notch binding(GO:0005112) |
| 0.0 | 85.3 | GO:0003723 | RNA binding(GO:0003723) |
| 0.0 | 1.3 | GO:0005388 | calcium-transporting ATPase activity(GO:0005388) |
| 0.0 | 2.9 | GO:0001104 | RNA polymerase II transcription cofactor activity(GO:0001104) |
| 0.0 | 0.7 | GO:0097493 | structural molecule activity conferring elasticity(GO:0097493) |
| 0.0 | 2.9 | GO:0019210 | kinase inhibitor activity(GO:0019210) |
| 0.0 | 0.5 | GO:0034237 | protein kinase A regulatory subunit binding(GO:0034237) |
| 0.0 | 0.6 | GO:0051879 | Hsp90 protein binding(GO:0051879) |
| 0.0 | 0.2 | GO:0004771 | sterol esterase activity(GO:0004771) |
| 0.0 | 1.9 | GO:0070888 | E-box binding(GO:0070888) |
| 0.0 | 0.5 | GO:0004089 | carbonate dehydratase activity(GO:0004089) |
| 0.0 | 3.9 | GO:0019903 | protein phosphatase binding(GO:0019903) |
| 0.0 | 0.5 | GO:0001221 | transcription cofactor binding(GO:0001221) |
| 0.0 | 0.3 | GO:0005159 | insulin-like growth factor receptor binding(GO:0005159) |
| 0.0 | 0.4 | GO:0043395 | heparan sulfate proteoglycan binding(GO:0043395) |
| 0.0 | 0.9 | GO:0031072 | heat shock protein binding(GO:0031072) |
| 0.0 | 0.4 | GO:0070330 | aromatase activity(GO:0070330) |
| 0.0 | 0.1 | GO:0004102 | choline O-acetyltransferase activity(GO:0004102) |
| 0.0 | 0.5 | GO:0001848 | complement binding(GO:0001848) |
| 0.0 | 0.1 | GO:0017050 | sphinganine kinase activity(GO:0008481) D-erythro-sphingosine kinase activity(GO:0017050) |
| 0.0 | 1.1 | GO:0004553 | hydrolase activity, hydrolyzing O-glycosyl compounds(GO:0004553) |
| 0.0 | 0.9 | GO:0004197 | cysteine-type endopeptidase activity(GO:0004197) |
| 0.0 | 1.8 | GO:0016829 | lyase activity(GO:0016829) |
| 0.0 | 0.3 | GO:0001205 | transcriptional activator activity, RNA polymerase II distal enhancer sequence-specific binding(GO:0001205) |
| 0.0 | 0.1 | GO:0004427 | inorganic diphosphatase activity(GO:0004427) |
Gene overrepresentation in curated gene sets: canonical pathways category:
| Log-likelihood per target | Total log-likelihood | Term | Description |
|---|---|---|---|
| 0.9 | 31.6 | PID TOLL ENDOGENOUS PATHWAY | Endogenous TLR signaling |
| 0.8 | 60.6 | PID FOXM1 PATHWAY | FOXM1 transcription factor network |
| 0.7 | 53.7 | PID HNF3B PATHWAY | FOXA2 and FOXA3 transcription factor networks |
| 0.6 | 66.4 | PID HIF1 TFPATHWAY | HIF-1-alpha transcription factor network |
| 0.4 | 27.1 | PID MAPK TRK PATHWAY | Trk receptor signaling mediated by the MAPK pathway |
| 0.3 | 12.8 | SIG CHEMOTAXIS | Genes related to chemotaxis |
| 0.3 | 11.6 | PID MYC PATHWAY | C-MYC pathway |
| 0.2 | 14.3 | SIG REGULATION OF THE ACTIN CYTOSKELETON BY RHO GTPASES | Genes related to regulation of the actin cytoskeleton |
| 0.2 | 10.4 | PID CXCR3 PATHWAY | CXCR3-mediated signaling events |
| 0.2 | 3.1 | PID VEGF VEGFR PATHWAY | VEGF and VEGFR signaling network |
| 0.2 | 13.3 | PID DELTA NP63 PATHWAY | Validated transcriptional targets of deltaNp63 isoforms |
| 0.1 | 7.7 | PID P53 REGULATION PATHWAY | p53 pathway |
| 0.1 | 3.5 | PID WNT CANONICAL PATHWAY | Canonical Wnt signaling pathway |
| 0.1 | 6.4 | PID EPHB FWD PATHWAY | EPHB forward signaling |
| 0.1 | 2.0 | PID ECADHERIN KERATINOCYTE PATHWAY | E-cadherin signaling in keratinocytes |
| 0.1 | 8.2 | PID E2F PATHWAY | E2F transcription factor network |
| 0.1 | 3.3 | PID SYNDECAN 2 PATHWAY | Syndecan-2-mediated signaling events |
| 0.1 | 2.8 | PID IL8 CXCR2 PATHWAY | IL8- and CXCR2-mediated signaling events |
| 0.1 | 3.5 | PID GLYPICAN 1PATHWAY | Glypican 1 network |
| 0.1 | 3.3 | SA CASPASE CASCADE | Apoptosis is mediated by caspases, cysteine proteases arranged in a proteolytic cascade. |
| 0.1 | 5.0 | PID CASPASE PATHWAY | Caspase cascade in apoptosis |
| 0.1 | 1.9 | PID SMAD2 3PATHWAY | Regulation of cytoplasmic and nuclear SMAD2/3 signaling |
| 0.1 | 2.8 | PID IL1 PATHWAY | IL1-mediated signaling events |
| 0.1 | 2.3 | PID SYNDECAN 4 PATHWAY | Syndecan-4-mediated signaling events |
| 0.1 | 0.9 | SIG IL4RECEPTOR IN B LYPHOCYTES | Genes related to IL4 rceptor signaling in B lymphocytes |
| 0.1 | 1.1 | ST STAT3 PATHWAY | STAT3 Pathway |
| 0.1 | 2.8 | PID TAP63 PATHWAY | Validated transcriptional targets of TAp63 isoforms |
| 0.1 | 2.3 | PID RXR VDR PATHWAY | RXR and RAR heterodimerization with other nuclear receptor |
| 0.0 | 1.9 | PID LYSOPHOSPHOLIPID PATHWAY | LPA receptor mediated events |
| 0.0 | 1.3 | PID AURORA A PATHWAY | Aurora A signaling |
| 0.0 | 3.5 | PID AR PATHWAY | Coregulation of Androgen receptor activity |
| 0.0 | 2.5 | PID MYC ACTIV PATHWAY | Validated targets of C-MYC transcriptional activation |
| 0.0 | 0.7 | ST G ALPHA I PATHWAY | G alpha i Pathway |
| 0.0 | 1.4 | PID CDC42 REG PATHWAY | Regulation of CDC42 activity |
| 0.0 | 1.0 | SIG INSULIN RECEPTOR PATHWAY IN CARDIAC MYOCYTES | Genes related to the insulin receptor pathway |
| 0.0 | 1.5 | PID TRKR PATHWAY | Neurotrophic factor-mediated Trk receptor signaling |
| 0.0 | 0.6 | PID UPA UPAR PATHWAY | Urokinase-type plasminogen activator (uPA) and uPAR-mediated signaling |
| 0.0 | 0.9 | PID VEGFR1 2 PATHWAY | Signaling events mediated by VEGFR1 and VEGFR2 |
| 0.0 | 0.4 | PID NETRIN PATHWAY | Netrin-mediated signaling events |
| 0.0 | 0.3 | PID INTEGRIN5 PATHWAY | Beta5 beta6 beta7 and beta8 integrin cell surface interactions |
| 0.0 | 1.3 | PID CMYB PATHWAY | C-MYB transcription factor network |
| 0.0 | 0.7 | PID IL4 2PATHWAY | IL4-mediated signaling events |
| 0.0 | 0.3 | PID INTEGRIN2 PATHWAY | Beta2 integrin cell surface interactions |
| 0.0 | 0.3 | ST WNT BETA CATENIN PATHWAY | Wnt/beta-catenin Pathway |
Gene overrepresentation in curated gene sets: REACTOME pathways category:
| Log-likelihood per target | Total log-likelihood | Term | Description |
|---|---|---|---|
| 1.9 | 29.0 | REACTOME SLBP DEPENDENT PROCESSING OF REPLICATION DEPENDENT HISTONE PRE MRNAS | Genes involved in SLBP Dependent Processing of Replication-Dependent Histone Pre-mRNAs |
| 1.7 | 31.8 | REACTOME ASSOCIATION OF LICENSING FACTORS WITH THE PRE REPLICATIVE COMPLEX | Genes involved in Association of licensing factors with the pre-replicative complex |
| 1.5 | 90.9 | REACTOME MITOCHONDRIAL PROTEIN IMPORT | Genes involved in Mitochondrial Protein Import |
| 1.3 | 74.7 | REACTOME GLYCOLYSIS | Genes involved in Glycolysis |
| 0.9 | 47.2 | REACTOME G1 PHASE | Genes involved in G1 Phase |
| 0.9 | 20.6 | REACTOME CHYLOMICRON MEDIATED LIPID TRANSPORT | Genes involved in Chylomicron-mediated lipid transport |
| 0.8 | 20.7 | REACTOME SIGNALLING TO P38 VIA RIT AND RIN | Genes involved in Signalling to p38 via RIT and RIN |
| 0.8 | 23.5 | REACTOME METABOLISM OF PORPHYRINS | Genes involved in Metabolism of porphyrins |
| 0.7 | 21.6 | REACTOME APC CDC20 MEDIATED DEGRADATION OF NEK2A | Genes involved in APC-Cdc20 mediated degradation of Nek2A |
| 0.7 | 20.4 | REACTOME PEROXISOMAL LIPID METABOLISM | Genes involved in Peroxisomal lipid metabolism |
| 0.6 | 11.6 | REACTOME TGF BETA RECEPTOR SIGNALING IN EMT EPITHELIAL TO MESENCHYMAL TRANSITION | Genes involved in TGF-beta receptor signaling in EMT (epithelial to mesenchymal transition) |
| 0.6 | 23.4 | REACTOME PYRIMIDINE METABOLISM | Genes involved in Pyrimidine metabolism |
| 0.6 | 8.3 | REACTOME CALNEXIN CALRETICULIN CYCLE | Genes involved in Calnexin/calreticulin cycle |
| 0.6 | 10.4 | REACTOME MTORC1 MEDIATED SIGNALLING | Genes involved in mTORC1-mediated signalling |
| 0.6 | 50.7 | REACTOME RESPIRATORY ELECTRON TRANSPORT ATP SYNTHESIS BY CHEMIOSMOTIC COUPLING AND HEAT PRODUCTION BY UNCOUPLING PROTEINS | Genes involved in Respiratory electron transport, ATP synthesis by chemiosmotic coupling, and heat production by uncoupling proteins. |
| 0.6 | 6.3 | REACTOME COPI MEDIATED TRANSPORT | Genes involved in COPI Mediated Transport |
| 0.6 | 42.4 | REACTOME ACTIVATION OF CHAPERONE GENES BY XBP1S | Genes involved in Activation of Chaperone Genes by XBP1(S) |
| 0.5 | 15.9 | REACTOME GLUTATHIONE CONJUGATION | Genes involved in Glutathione conjugation |
| 0.4 | 12.7 | REACTOME GLUCONEOGENESIS | Genes involved in Gluconeogenesis |
| 0.4 | 9.2 | REACTOME HYALURONAN UPTAKE AND DEGRADATION | Genes involved in Hyaluronan uptake and degradation |
| 0.3 | 5.8 | REACTOME VEGF LIGAND RECEPTOR INTERACTIONS | Genes involved in VEGF ligand-receptor interactions |
| 0.3 | 5.9 | REACTOME ZINC TRANSPORTERS | Genes involved in Zinc transporters |
| 0.3 | 5.7 | REACTOME XENOBIOTICS | Genes involved in Xenobiotics |
| 0.3 | 2.8 | REACTOME MICRORNA MIRNA BIOGENESIS | Genes involved in MicroRNA (miRNA) Biogenesis |
| 0.3 | 16.4 | REACTOME SIGNALING BY ROBO RECEPTOR | Genes involved in Signaling by Robo receptor |
| 0.3 | 2.0 | REACTOME MEMBRANE BINDING AND TARGETTING OF GAG PROTEINS | Genes involved in Membrane binding and targetting of GAG proteins |
| 0.2 | 5.9 | REACTOME SULFUR AMINO ACID METABOLISM | Genes involved in Sulfur amino acid metabolism |
| 0.2 | 6.1 | REACTOME TIE2 SIGNALING | Genes involved in Tie2 Signaling |
| 0.2 | 1.7 | REACTOME INFLUENZA VIRAL RNA TRANSCRIPTION AND REPLICATION | Genes involved in Influenza Viral RNA Transcription and Replication |
| 0.2 | 13.0 | REACTOME RNA POL II TRANSCRIPTION PRE INITIATION AND PROMOTER OPENING | Genes involved in RNA Polymerase II Transcription Pre-Initiation And Promoter Opening |
| 0.2 | 4.2 | REACTOME ANTIGEN PRESENTATION FOLDING ASSEMBLY AND PEPTIDE LOADING OF CLASS I MHC | Genes involved in Antigen Presentation: Folding, assembly and peptide loading of class I MHC |
| 0.2 | 3.4 | REACTOME REMOVAL OF THE FLAP INTERMEDIATE FROM THE C STRAND | Genes involved in Removal of the Flap Intermediate from the C-strand |
| 0.2 | 1.6 | REACTOME METAL ION SLC TRANSPORTERS | Genes involved in Metal ion SLC transporters |
| 0.2 | 12.5 | REACTOME AUTODEGRADATION OF CDH1 BY CDH1 APC C | Genes involved in Autodegradation of Cdh1 by Cdh1:APC/C |
| 0.2 | 3.5 | REACTOME COMMON PATHWAY | Genes involved in Common Pathway |
| 0.2 | 20.6 | REACTOME NUCLEAR RECEPTOR TRANSCRIPTION PATHWAY | Genes involved in Nuclear Receptor transcription pathway |
| 0.2 | 6.4 | REACTOME ERK MAPK TARGETS | Genes involved in ERK/MAPK targets |
| 0.2 | 5.8 | REACTOME SYNTHESIS OF PA | Genes involved in Synthesis of PA |
| 0.2 | 4.2 | REACTOME AMINO ACID SYNTHESIS AND INTERCONVERSION TRANSAMINATION | Genes involved in Amino acid synthesis and interconversion (transamination) |
| 0.2 | 2.0 | REACTOME METABOLISM OF POLYAMINES | Genes involved in Metabolism of polyamines |
| 0.2 | 2.4 | REACTOME VITAMIN B5 PANTOTHENATE METABOLISM | Genes involved in Vitamin B5 (pantothenate) metabolism |
| 0.1 | 35.7 | REACTOME TRANSLATION | Genes involved in Translation |
| 0.1 | 1.8 | REACTOME GAMMA CARBOXYLATION TRANSPORT AND AMINO TERMINAL CLEAVAGE OF PROTEINS | Genes involved in Gamma-carboxylation, transport, and amino-terminal cleavage of proteins |
| 0.1 | 6.7 | REACTOME DOWNREGULATION OF SMAD2 3 SMAD4 TRANSCRIPTIONAL ACTIVITY | Genes involved in Downregulation of SMAD2/3:SMAD4 transcriptional activity |
| 0.1 | 2.9 | REACTOME GLUCURONIDATION | Genes involved in Glucuronidation |
| 0.1 | 4.9 | REACTOME GLUCOSE METABOLISM | Genes involved in Glucose metabolism |
| 0.1 | 6.7 | REACTOME O LINKED GLYCOSYLATION OF MUCINS | Genes involved in O-linked glycosylation of mucins |
| 0.1 | 8.7 | REACTOME NRAGE SIGNALS DEATH THROUGH JNK | Genes involved in NRAGE signals death through JNK |
| 0.1 | 3.6 | REACTOME IL RECEPTOR SHC SIGNALING | Genes involved in Interleukin receptor SHC signaling |
| 0.1 | 2.2 | REACTOME PROLACTIN RECEPTOR SIGNALING | Genes involved in Prolactin receptor signaling |
| 0.1 | 17.4 | REACTOME ANTIGEN PROCESSING UBIQUITINATION PROTEASOME DEGRADATION | Genes involved in Antigen processing: Ubiquitination & Proteasome degradation |
| 0.1 | 1.1 | REACTOME CREATION OF C4 AND C2 ACTIVATORS | Genes involved in Creation of C4 and C2 activators |
| 0.1 | 1.1 | REACTOME IL 6 SIGNALING | Genes involved in Interleukin-6 signaling |
| 0.1 | 9.4 | REACTOME HOST INTERACTIONS OF HIV FACTORS | Genes involved in Host Interactions of HIV factors |
| 0.1 | 1.8 | REACTOME INSULIN RECEPTOR RECYCLING | Genes involved in Insulin receptor recycling |
| 0.1 | 1.5 | REACTOME CTNNB1 PHOSPHORYLATION CASCADE | Genes involved in Beta-catenin phosphorylation cascade |
| 0.1 | 2.9 | REACTOME MHC CLASS II ANTIGEN PRESENTATION | Genes involved in MHC class II antigen presentation |
| 0.1 | 0.9 | REACTOME EGFR DOWNREGULATION | Genes involved in EGFR downregulation |
| 0.1 | 3.8 | REACTOME METABOLISM OF VITAMINS AND COFACTORS | Genes involved in Metabolism of vitamins and cofactors |
| 0.1 | 2.0 | REACTOME ADHERENS JUNCTIONS INTERACTIONS | Genes involved in Adherens junctions interactions |
| 0.0 | 0.2 | REACTOME E2F ENABLED INHIBITION OF PRE REPLICATION COMPLEX FORMATION | Genes involved in E2F-enabled inhibition of pre-replication complex formation |
| 0.0 | 3.9 | REACTOME MYD88 MAL CASCADE INITIATED ON PLASMA MEMBRANE | Genes involved in MyD88:Mal cascade initiated on plasma membrane |
| 0.0 | 0.5 | REACTOME NEGATIVE REGULATION OF THE PI3K AKT NETWORK | Genes involved in Negative regulation of the PI3K/AKT network |
| 0.0 | 1.2 | REACTOME POST CHAPERONIN TUBULIN FOLDING PATHWAY | Genes involved in Post-chaperonin tubulin folding pathway |
| 0.0 | 2.4 | REACTOME COLLAGEN FORMATION | Genes involved in Collagen formation |
| 0.0 | 0.5 | REACTOME REVERSIBLE HYDRATION OF CARBON DIOXIDE | Genes involved in Reversible Hydration of Carbon Dioxide |
| 0.0 | 1.4 | REACTOME PPARA ACTIVATES GENE EXPRESSION | Genes involved in PPARA Activates Gene Expression |
| 0.0 | 1.0 | REACTOME CASPASE MEDIATED CLEAVAGE OF CYTOSKELETAL PROTEINS | Genes involved in Caspase-mediated cleavage of cytoskeletal proteins |
| 0.0 | 1.1 | REACTOME TRANSPORT TO THE GOLGI AND SUBSEQUENT MODIFICATION | Genes involved in Transport to the Golgi and subsequent modification |
| 0.0 | 1.0 | REACTOME FATTY ACYL COA BIOSYNTHESIS | Genes involved in Fatty Acyl-CoA Biosynthesis |
| 0.0 | 3.1 | REACTOME RESPONSE TO ELEVATED PLATELET CYTOSOLIC CA2 | Genes involved in Response to elevated platelet cytosolic Ca2+ |
| 0.0 | 0.6 | REACTOME REGULATION OF INSULIN LIKE GROWTH FACTOR IGF ACTIVITY BY INSULIN LIKE GROWTH FACTOR BINDING PROTEINS IGFBPS | Genes involved in Regulation of Insulin-like Growth Factor (IGF) Activity by Insulin-like Growth Factor Binding Proteins (IGFBPs) |
| 0.0 | 0.4 | REACTOME SIGNALING BY FGFR1 FUSION MUTANTS | Genes involved in Signaling by FGFR1 fusion mutants |
| 0.0 | 2.9 | REACTOME MRNA SPLICING | Genes involved in mRNA Splicing |
| 0.0 | 0.9 | REACTOME ABC FAMILY PROTEINS MEDIATED TRANSPORT | Genes involved in ABC-family proteins mediated transport |
| 0.0 | 1.3 | REACTOME LOSS OF NLP FROM MITOTIC CENTROSOMES | Genes involved in Loss of Nlp from mitotic centrosomes |
| 0.0 | 0.3 | REACTOME FGFR4 LIGAND BINDING AND ACTIVATION | Genes involved in FGFR4 ligand binding and activation |
| 0.0 | 0.2 | REACTOME BMAL1 CLOCK NPAS2 ACTIVATES CIRCADIAN EXPRESSION | Genes involved in BMAL1:CLOCK/NPAS2 Activates Circadian Expression |
| 0.0 | 0.5 | REACTOME ASSOCIATION OF TRIC CCT WITH TARGET PROTEINS DURING BIOSYNTHESIS | Genes involved in Association of TriC/CCT with target proteins during biosynthesis |
| 0.0 | 0.9 | REACTOME DOWNSTREAM SIGNAL TRANSDUCTION | Genes involved in Downstream signal transduction |
| 0.0 | 0.3 | REACTOME COMPLEMENT CASCADE | Genes involved in Complement cascade |