Project
GNF SymAtlas + NCI-60 cancer cell lines, human (Su, 2004; Ross, 2000)
Navigation
Downloads
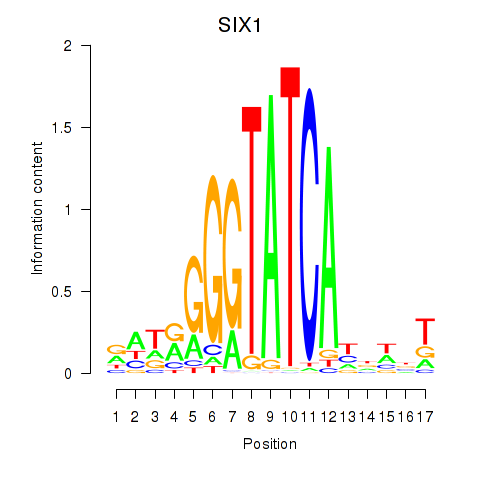
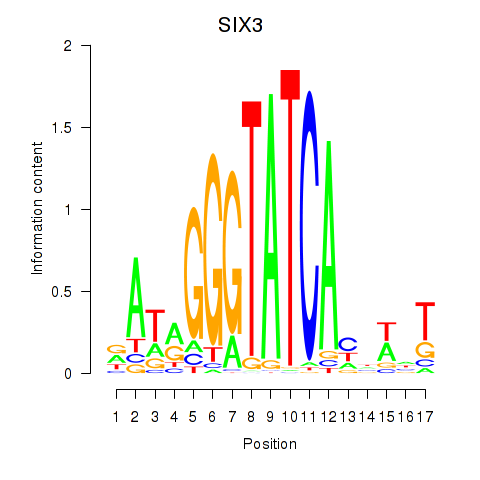
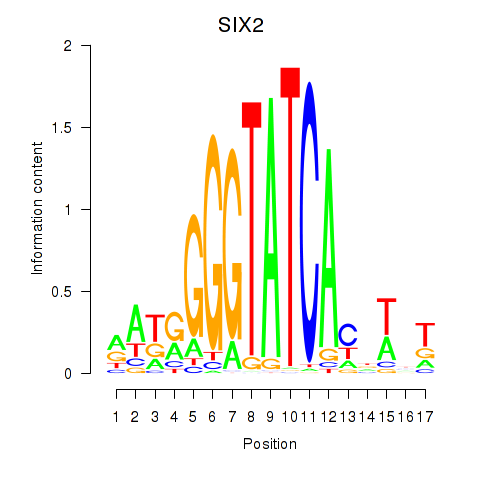
Results for SIX1_SIX3_SIX2
Z-value: 0.69
Motif logo
Transcription factors associated with SIX1_SIX3_SIX2
| Gene Symbol | Gene ID | Gene Info |
|---|---|---|
|
SIX1
|
ENSG00000126778.12 | SIX1 |
|
SIX3
|
ENSG00000138083.5 | SIX3 |
|
SIX2
|
ENSG00000170577.8 | SIX2 |
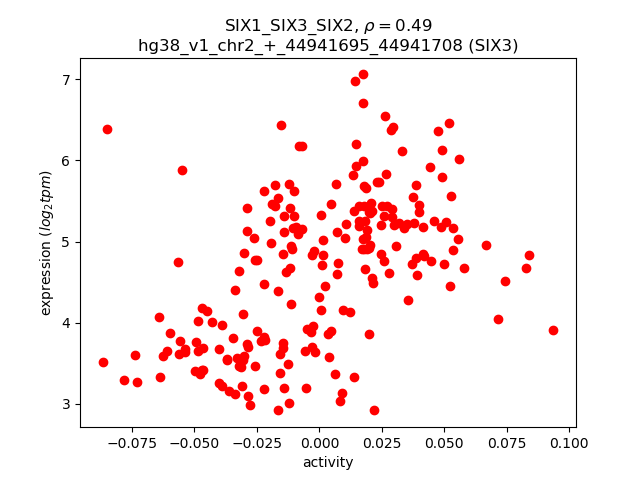
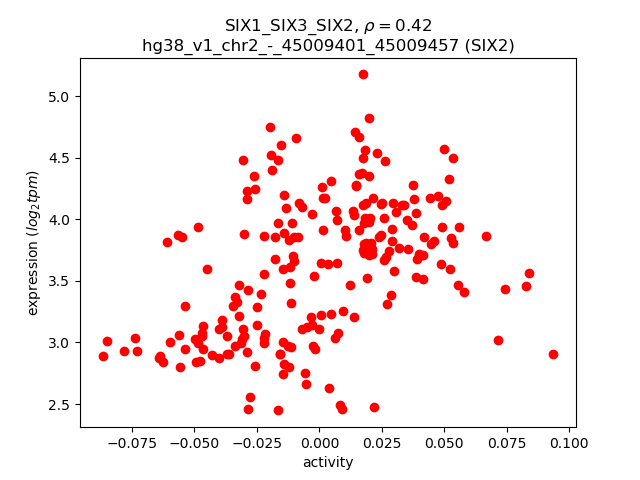
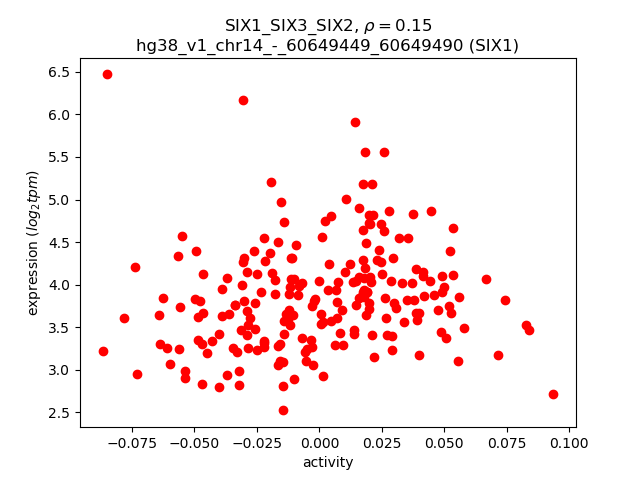
Activity-expression correlation:
| Gene | Promoter | Pearson corr. coef. | P-value | Plot |
|---|---|---|---|---|
| SIX3 | hg38_v1_chr2_+_44941695_44941708 | 0.49 | 1.6e-14 | Click! |
| SIX2 | hg38_v1_chr2_-_45009401_45009457 | 0.42 | 9.9e-11 | Click! |
| SIX1 | hg38_v1_chr14_-_60649449_60649490 | 0.15 | 3.1e-02 | Click! |
Activity profile of SIX1_SIX3_SIX2 motif
Sorted Z-values of SIX1_SIX3_SIX2 motif
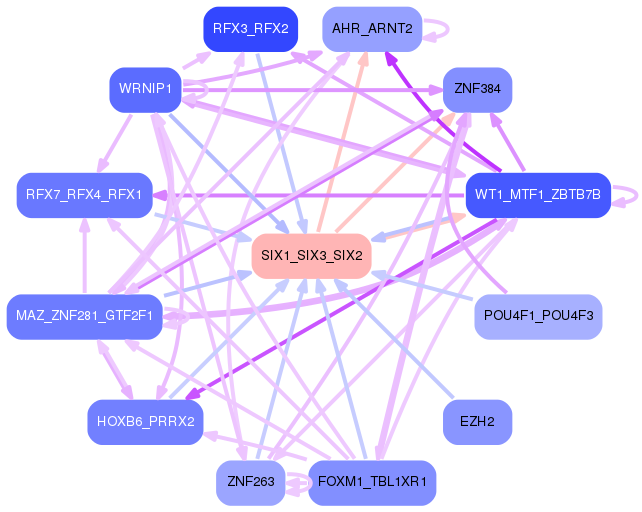
Network of associatons between targets according to the STRING database.

First level regulatory network of SIX1_SIX3_SIX2
Gene Ontology Analysis
Gene overrepresentation in biological process category:
| Log-likelihood per target | Total log-likelihood | Term | Description |
|---|---|---|---|
| 2.1 | 6.3 | GO:0055048 | regulation of spindle elongation(GO:0032887) regulation of mitotic spindle elongation(GO:0032888) anastral spindle assembly(GO:0055048) protein localization to spindle pole body(GO:0071988) regulation of protein localization to spindle pole body(GO:1902363) positive regulation of protein localization to spindle pole body(GO:1902365) positive regulation of mitotic spindle elongation(GO:1902846) |
| 2.1 | 8.3 | GO:0003330 | regulation of extracellular matrix constituent secretion(GO:0003330) positive regulation of extracellular matrix constituent secretion(GO:0003331) |
| 1.6 | 4.8 | GO:0003147 | neural crest cell migration involved in heart formation(GO:0003147) cell migration involved in heart formation(GO:0060974) anterior neural tube closure(GO:0061713) |
| 1.5 | 4.5 | GO:1903937 | response to acrylamide(GO:1903937) |
| 1.4 | 4.3 | GO:1901899 | positive regulation of relaxation of cardiac muscle(GO:1901899) |
| 1.4 | 7.1 | GO:1902998 | regulation of neuronal signal transduction(GO:1902847) positive regulation of neurofibrillary tangle assembly(GO:1902998) |
| 1.4 | 5.4 | GO:0034628 | nicotinamide nucleotide biosynthetic process from aspartate(GO:0019355) 'de novo' NAD biosynthetic process(GO:0034627) 'de novo' NAD biosynthetic process from aspartate(GO:0034628) |
| 1.3 | 5.1 | GO:0019805 | quinolinate biosynthetic process(GO:0019805) |
| 1.0 | 8.2 | GO:0015747 | urate transport(GO:0015747) |
| 0.9 | 2.8 | GO:0010735 | positive regulation of transcription via serum response element binding(GO:0010735) |
| 0.9 | 2.7 | GO:1905246 | regulation of choline O-acetyltransferase activity(GO:1902769) positive regulation of choline O-acetyltransferase activity(GO:1902771) negative regulation of tau-protein kinase activity(GO:1902948) positive regulation of early endosome to recycling endosome transport(GO:1902955) negative regulation of aspartic-type endopeptidase activity involved in amyloid precursor protein catabolic process(GO:1902960) negative regulation of neurofibrillary tangle assembly(GO:1902997) negative regulation of aspartic-type peptidase activity(GO:1905246) |
| 0.9 | 2.6 | GO:0002415 | immunoglobulin transcytosis in epithelial cells mediated by polymeric immunoglobulin receptor(GO:0002415) |
| 0.8 | 3.4 | GO:0072302 | posterior mesonephric tubule development(GO:0072166) negative regulation of metanephric glomerulus development(GO:0072299) negative regulation of metanephric glomerular mesangial cell proliferation(GO:0072302) |
| 0.8 | 4.9 | GO:0071395 | response to jasmonic acid(GO:0009753) cellular response to jasmonic acid stimulus(GO:0071395) |
| 0.8 | 3.1 | GO:0071947 | protein deubiquitination involved in ubiquitin-dependent protein catabolic process(GO:0071947) |
| 0.7 | 2.2 | GO:0050653 | chondroitin sulfate proteoglycan biosynthetic process, polysaccharide chain biosynthetic process(GO:0050653) |
| 0.7 | 8.8 | GO:0061469 | regulation of type B pancreatic cell proliferation(GO:0061469) |
| 0.7 | 2.9 | GO:0090301 | fibroblast growth factor receptor signaling pathway involved in neural plate anterior/posterior pattern formation(GO:0060825) regulation of neural crest formation(GO:0090299) negative regulation of neural crest formation(GO:0090301) regulation of fibroblast growth factor receptor signaling pathway involved in neural plate anterior/posterior pattern formation(GO:2000313) negative regulation of fibroblast growth factor receptor signaling pathway involved in neural plate anterior/posterior pattern formation(GO:2000314) |
| 0.7 | 6.3 | GO:2000124 | regulation of endocannabinoid signaling pathway(GO:2000124) |
| 0.7 | 6.1 | GO:0072383 | plus-end-directed vesicle transport along microtubule(GO:0072383) |
| 0.7 | 2.0 | GO:0002414 | immunoglobulin transcytosis in epithelial cells(GO:0002414) IgG immunoglobulin transcytosis in epithelial cells mediated by FcRn immunoglobulin receptor(GO:0002416) |
| 0.6 | 6.4 | GO:0034058 | endosomal vesicle fusion(GO:0034058) |
| 0.6 | 1.8 | GO:0035759 | mesangial cell-matrix adhesion(GO:0035759) positive regulation of granulocyte colony-stimulating factor production(GO:0071657) metanephric mesangial cell differentiation(GO:0072209) metanephric glomerular mesangial cell differentiation(GO:0072254) positive regulation of macrophage colony-stimulating factor production(GO:1901258) |
| 0.6 | 2.4 | GO:2000639 | regulation of SREBP signaling pathway(GO:2000638) negative regulation of SREBP signaling pathway(GO:2000639) |
| 0.6 | 1.7 | GO:0038193 | thromboxane A2 signaling pathway(GO:0038193) |
| 0.6 | 2.8 | GO:0035617 | stress granule disassembly(GO:0035617) |
| 0.5 | 2.2 | GO:1902159 | regulation of cyclic nucleotide-gated ion channel activity(GO:1902159) |
| 0.5 | 3.7 | GO:0010890 | positive regulation of sequestering of triglyceride(GO:0010890) |
| 0.5 | 1.4 | GO:0045897 | positive regulation of transcription during mitosis(GO:0045897) |
| 0.5 | 1.4 | GO:0046603 | negative regulation of mitotic centrosome separation(GO:0046603) |
| 0.5 | 4.2 | GO:0032790 | ribosome disassembly(GO:0032790) |
| 0.4 | 2.6 | GO:0050955 | thermoception(GO:0050955) |
| 0.4 | 2.5 | GO:0034287 | detection of carbohydrate stimulus(GO:0009730) detection of hexose stimulus(GO:0009732) detection of monosaccharide stimulus(GO:0034287) detection of glucose(GO:0051594) |
| 0.4 | 2.9 | GO:0060160 | negative regulation of dopamine receptor signaling pathway(GO:0060160) |
| 0.4 | 1.2 | GO:0071400 | carbamoyl phosphate metabolic process(GO:0070408) carbamoyl phosphate biosynthetic process(GO:0070409) cellular response to oleic acid(GO:0071400) response to ammonia(GO:1903717) cellular response to ammonia(GO:1903718) |
| 0.4 | 1.1 | GO:0030187 | melatonin metabolic process(GO:0030186) melatonin biosynthetic process(GO:0030187) |
| 0.4 | 2.5 | GO:0035609 | C-terminal protein deglutamylation(GO:0035609) |
| 0.4 | 4.7 | GO:0043031 | negative regulation of macrophage activation(GO:0043031) |
| 0.4 | 1.8 | GO:0032286 | central nervous system myelin maintenance(GO:0032286) |
| 0.3 | 1.0 | GO:0010587 | miRNA catabolic process(GO:0010587) |
| 0.3 | 1.9 | GO:0061092 | regulation of phospholipid translocation(GO:0061091) positive regulation of phospholipid translocation(GO:0061092) |
| 0.3 | 4.4 | GO:0006930 | substrate-dependent cell migration, cell extension(GO:0006930) |
| 0.3 | 12.0 | GO:0008045 | motor neuron axon guidance(GO:0008045) |
| 0.3 | 1.2 | GO:0002357 | defense response to tumor cell(GO:0002357) |
| 0.3 | 4.9 | GO:0007021 | tubulin complex assembly(GO:0007021) |
| 0.3 | 3.7 | GO:0090043 | regulation of tubulin deacetylation(GO:0090043) |
| 0.3 | 0.8 | GO:0051230 | mitotic spindle disassembly(GO:0051228) spindle disassembly(GO:0051230) |
| 0.2 | 1.0 | GO:0035627 | ceramide transport(GO:0035627) |
| 0.2 | 2.2 | GO:0007598 | blood coagulation, extrinsic pathway(GO:0007598) |
| 0.2 | 4.7 | GO:0019614 | catechol-containing compound catabolic process(GO:0019614) catecholamine catabolic process(GO:0042424) |
| 0.2 | 0.5 | GO:1900005 | positive regulation of serine-type endopeptidase activity(GO:1900005) positive regulation of serine-type peptidase activity(GO:1902573) |
| 0.2 | 2.9 | GO:2000400 | positive regulation of T cell differentiation in thymus(GO:0033089) positive regulation of thymocyte aggregation(GO:2000400) |
| 0.2 | 8.2 | GO:0048665 | neuron fate specification(GO:0048665) |
| 0.2 | 2.2 | GO:0000290 | deadenylation-dependent decapping of nuclear-transcribed mRNA(GO:0000290) |
| 0.2 | 1.4 | GO:0032466 | negative regulation of cytokinesis(GO:0032466) |
| 0.2 | 0.7 | GO:0015860 | purine nucleoside transmembrane transport(GO:0015860) |
| 0.2 | 4.4 | GO:0006957 | complement activation, alternative pathway(GO:0006957) |
| 0.2 | 1.0 | GO:0061762 | CAMKK-AMPK signaling cascade(GO:0061762) |
| 0.2 | 1.0 | GO:0018243 | protein O-linked glycosylation via threonine(GO:0018243) |
| 0.2 | 1.3 | GO:1904879 | positive regulation of calcium ion transmembrane transport via high voltage-gated calcium channel(GO:1904879) |
| 0.2 | 1.1 | GO:0046092 | deoxycytidine metabolic process(GO:0046092) |
| 0.2 | 0.9 | GO:0016078 | tRNA catabolic process(GO:0016078) |
| 0.2 | 0.8 | GO:0014738 | regulation of muscle hyperplasia(GO:0014738) |
| 0.2 | 3.9 | GO:0006704 | glucocorticoid biosynthetic process(GO:0006704) |
| 0.2 | 0.8 | GO:0070269 | pyroptosis(GO:0070269) |
| 0.2 | 1.9 | GO:0052697 | flavonoid glucuronidation(GO:0052696) xenobiotic glucuronidation(GO:0052697) |
| 0.2 | 2.6 | GO:0007016 | cytoskeletal anchoring at plasma membrane(GO:0007016) |
| 0.2 | 2.1 | GO:0006570 | tyrosine metabolic process(GO:0006570) |
| 0.2 | 6.7 | GO:0033014 | tetrapyrrole biosynthetic process(GO:0033014) |
| 0.1 | 0.4 | GO:0072535 | tumor necrosis factor (ligand) superfamily member 11 production(GO:0072535) regulation of tumor necrosis factor (ligand) superfamily member 11 production(GO:2000307) |
| 0.1 | 3.1 | GO:0006071 | glycerol metabolic process(GO:0006071) |
| 0.1 | 1.0 | GO:0086073 | bundle of His cell-Purkinje myocyte adhesion involved in cell communication(GO:0086073) |
| 0.1 | 7.5 | GO:0043001 | Golgi to plasma membrane protein transport(GO:0043001) |
| 0.1 | 4.4 | GO:0043252 | sodium-independent organic anion transport(GO:0043252) |
| 0.1 | 0.9 | GO:0008218 | bioluminescence(GO:0008218) |
| 0.1 | 2.4 | GO:0034389 | lipid particle organization(GO:0034389) |
| 0.1 | 1.8 | GO:0042355 | fucose catabolic process(GO:0019317) L-fucose metabolic process(GO:0042354) L-fucose catabolic process(GO:0042355) |
| 0.1 | 0.7 | GO:0061107 | seminal vesicle development(GO:0061107) |
| 0.1 | 1.4 | GO:0046951 | ketone body biosynthetic process(GO:0046951) |
| 0.1 | 0.5 | GO:0001692 | histamine metabolic process(GO:0001692) histidine catabolic process(GO:0006548) imidazole-containing compound catabolic process(GO:0052805) |
| 0.1 | 0.8 | GO:0032483 | regulation of Rab protein signal transduction(GO:0032483) |
| 0.1 | 1.9 | GO:0086046 | membrane depolarization during SA node cell action potential(GO:0086046) |
| 0.1 | 2.2 | GO:0046606 | negative regulation of centrosome duplication(GO:0010826) negative regulation of centrosome cycle(GO:0046606) |
| 0.1 | 13.3 | GO:0070098 | chemokine-mediated signaling pathway(GO:0070098) |
| 0.1 | 14.2 | GO:0006970 | response to osmotic stress(GO:0006970) |
| 0.1 | 0.6 | GO:0038161 | prolactin signaling pathway(GO:0038161) |
| 0.1 | 0.4 | GO:0031456 | glycine betaine biosynthetic process from choline(GO:0019285) glycine betaine metabolic process(GO:0031455) glycine betaine biosynthetic process(GO:0031456) |
| 0.1 | 0.8 | GO:0044245 | polysaccharide digestion(GO:0044245) |
| 0.1 | 1.8 | GO:0060285 | cilium-dependent cell motility(GO:0060285) |
| 0.1 | 15.9 | GO:0006805 | xenobiotic metabolic process(GO:0006805) |
| 0.1 | 0.6 | GO:0014050 | negative regulation of glutamate secretion(GO:0014050) |
| 0.1 | 1.3 | GO:0007320 | insemination(GO:0007320) |
| 0.1 | 3.1 | GO:0032012 | regulation of ARF protein signal transduction(GO:0032012) |
| 0.1 | 1.2 | GO:0071985 | multivesicular body sorting pathway(GO:0071985) |
| 0.1 | 1.1 | GO:0051967 | negative regulation of synaptic transmission, glutamatergic(GO:0051967) |
| 0.1 | 2.1 | GO:0097151 | positive regulation of inhibitory postsynaptic potential(GO:0097151) modulation of inhibitory postsynaptic potential(GO:0098828) |
| 0.1 | 1.4 | GO:0070544 | histone H3-K36 demethylation(GO:0070544) |
| 0.1 | 0.8 | GO:0014816 | skeletal muscle satellite cell differentiation(GO:0014816) |
| 0.1 | 0.8 | GO:0050713 | negative regulation of interleukin-1 beta secretion(GO:0050713) |
| 0.1 | 1.0 | GO:0043152 | induction of bacterial agglutination(GO:0043152) |
| 0.1 | 1.6 | GO:0031053 | primary miRNA processing(GO:0031053) |
| 0.1 | 1.0 | GO:0097070 | ductus arteriosus closure(GO:0097070) |
| 0.1 | 0.7 | GO:0098703 | calcium ion import across plasma membrane(GO:0098703) calcium ion import into cell(GO:1990035) |
| 0.1 | 0.2 | GO:0015670 | carbon dioxide transport(GO:0015670) |
| 0.1 | 1.1 | GO:0000244 | spliceosomal tri-snRNP complex assembly(GO:0000244) |
| 0.1 | 0.4 | GO:0045959 | regulation of complement activation, classical pathway(GO:0030450) negative regulation of complement activation, classical pathway(GO:0045959) |
| 0.1 | 0.4 | GO:0070253 | somatostatin secretion(GO:0070253) |
| 0.1 | 0.5 | GO:1900122 | positive regulation of receptor binding(GO:1900122) |
| 0.1 | 4.5 | GO:0030212 | hyaluronan metabolic process(GO:0030212) |
| 0.1 | 2.5 | GO:0010039 | response to iron ion(GO:0010039) |
| 0.1 | 0.5 | GO:1990564 | protein polyufmylation(GO:1990564) protein K69-linked ufmylation(GO:1990592) |
| 0.1 | 0.7 | GO:0097105 | presynaptic membrane assembly(GO:0097105) |
| 0.1 | 0.8 | GO:1901740 | negative regulation of myoblast fusion(GO:1901740) regulation of hepatocyte apoptotic process(GO:1903943) negative regulation of hepatocyte apoptotic process(GO:1903944) |
| 0.1 | 3.5 | GO:0045744 | negative regulation of G-protein coupled receptor protein signaling pathway(GO:0045744) |
| 0.1 | 1.9 | GO:0048025 | negative regulation of mRNA splicing, via spliceosome(GO:0048025) |
| 0.1 | 0.4 | GO:0018344 | protein geranylgeranylation(GO:0018344) |
| 0.1 | 2.1 | GO:0033006 | regulation of mast cell activation involved in immune response(GO:0033006) regulation of mast cell degranulation(GO:0043304) |
| 0.1 | 2.7 | GO:0006904 | vesicle docking involved in exocytosis(GO:0006904) |
| 0.1 | 0.3 | GO:0098704 | fructose transport(GO:0015755) fructose import(GO:0032445) carbohydrate import into cell(GO:0097319) carbohydrate import across plasma membrane(GO:0098704) fructose import across plasma membrane(GO:1990539) |
| 0.1 | 0.3 | GO:0019755 | urea transport(GO:0015840) one-carbon compound transport(GO:0019755) |
| 0.0 | 1.2 | GO:0001580 | detection of chemical stimulus involved in sensory perception of bitter taste(GO:0001580) |
| 0.0 | 0.9 | GO:0002052 | positive regulation of neuroblast proliferation(GO:0002052) |
| 0.0 | 0.8 | GO:0050427 | purine ribonucleoside bisphosphate metabolic process(GO:0034035) 3'-phosphoadenosine 5'-phosphosulfate metabolic process(GO:0050427) |
| 0.0 | 1.4 | GO:0034219 | carbohydrate transmembrane transport(GO:0034219) |
| 0.0 | 1.0 | GO:0005513 | detection of calcium ion(GO:0005513) |
| 0.0 | 1.3 | GO:0006706 | steroid catabolic process(GO:0006706) |
| 0.0 | 1.1 | GO:0071420 | cellular response to histamine(GO:0071420) |
| 0.0 | 0.8 | GO:0048268 | clathrin coat assembly(GO:0048268) |
| 0.0 | 0.4 | GO:1902260 | negative regulation of delayed rectifier potassium channel activity(GO:1902260) |
| 0.0 | 0.9 | GO:0032802 | low-density lipoprotein particle receptor catabolic process(GO:0032802) |
| 0.0 | 3.8 | GO:0050911 | detection of chemical stimulus involved in sensory perception of smell(GO:0050911) |
| 0.0 | 1.1 | GO:0042462 | eye photoreceptor cell development(GO:0042462) |
| 0.0 | 1.6 | GO:0010107 | potassium ion import(GO:0010107) |
| 0.0 | 1.2 | GO:0045026 | plasma membrane fusion(GO:0045026) |
| 0.0 | 0.2 | GO:2001180 | negative regulation of interleukin-10 secretion(GO:2001180) |
| 0.0 | 3.0 | GO:0050672 | negative regulation of mononuclear cell proliferation(GO:0032945) negative regulation of lymphocyte proliferation(GO:0050672) negative regulation of leukocyte proliferation(GO:0070664) |
| 0.0 | 1.2 | GO:0006699 | bile acid biosynthetic process(GO:0006699) |
| 0.0 | 5.3 | GO:0007162 | negative regulation of cell adhesion(GO:0007162) |
| 0.0 | 4.4 | GO:0007224 | smoothened signaling pathway(GO:0007224) |
| 0.0 | 0.8 | GO:0007095 | mitotic G2 DNA damage checkpoint(GO:0007095) |
| 0.0 | 2.5 | GO:0046849 | bone remodeling(GO:0046849) |
| 0.0 | 0.1 | GO:0030579 | ubiquitin-dependent SMAD protein catabolic process(GO:0030579) |
| 0.0 | 0.7 | GO:2001014 | regulation of skeletal muscle cell differentiation(GO:2001014) |
| 0.0 | 0.4 | GO:2000194 | regulation of female gonad development(GO:2000194) |
| 0.0 | 0.2 | GO:1902412 | regulation of mitotic cytokinesis(GO:1902412) |
| 0.0 | 1.1 | GO:0050982 | detection of mechanical stimulus(GO:0050982) |
| 0.0 | 0.4 | GO:0006449 | regulation of translational termination(GO:0006449) |
| 0.0 | 0.2 | GO:0042908 | xenobiotic transport(GO:0042908) |
| 0.0 | 0.9 | GO:0000188 | inactivation of MAPK activity(GO:0000188) |
| 0.0 | 0.5 | GO:0007130 | synaptonemal complex assembly(GO:0007130) |
| 0.0 | 0.7 | GO:2000785 | regulation of autophagosome assembly(GO:2000785) |
| 0.0 | 2.5 | GO:0060349 | bone morphogenesis(GO:0060349) |
| 0.0 | 0.6 | GO:0035338 | long-chain fatty-acyl-CoA biosynthetic process(GO:0035338) |
| 0.0 | 0.4 | GO:0007214 | gamma-aminobutyric acid signaling pathway(GO:0007214) |
| 0.0 | 0.4 | GO:0015669 | gas transport(GO:0015669) oxygen transport(GO:0015671) |
| 0.0 | 1.8 | GO:0030049 | muscle filament sliding(GO:0030049) actin-myosin filament sliding(GO:0033275) |
| 0.0 | 2.9 | GO:2000134 | negative regulation of G1/S transition of mitotic cell cycle(GO:2000134) |
| 0.0 | 5.0 | GO:0007565 | female pregnancy(GO:0007565) |
| 0.0 | 1.7 | GO:0042102 | positive regulation of T cell proliferation(GO:0042102) |
| 0.0 | 0.3 | GO:0060746 | maternal behavior(GO:0042711) parental behavior(GO:0060746) |
| 0.0 | 0.8 | GO:0050909 | sensory perception of taste(GO:0050909) |
| 0.0 | 1.2 | GO:0010633 | negative regulation of epithelial cell migration(GO:0010633) |
| 0.0 | 15.3 | GO:0045596 | negative regulation of cell differentiation(GO:0045596) |
| 0.0 | 4.5 | GO:0060271 | cilium morphogenesis(GO:0060271) |
| 0.0 | 1.8 | GO:0010811 | positive regulation of cell-substrate adhesion(GO:0010811) |
| 0.0 | 0.3 | GO:0030728 | ovulation(GO:0030728) |
| 0.0 | 1.7 | GO:0008366 | ensheathment of neurons(GO:0007272) axon ensheathment(GO:0008366) |
| 0.0 | 1.1 | GO:0042267 | natural killer cell mediated cytotoxicity(GO:0042267) |
| 0.0 | 12.2 | GO:0007417 | central nervous system development(GO:0007417) |
| 0.0 | 0.5 | GO:0050832 | defense response to fungus(GO:0050832) |
| 0.0 | 1.2 | GO:0007218 | neuropeptide signaling pathway(GO:0007218) |
| 0.0 | 0.6 | GO:0046426 | negative regulation of JAK-STAT cascade(GO:0046426) negative regulation of STAT cascade(GO:1904893) |
| 0.0 | 1.7 | GO:0007156 | homophilic cell adhesion via plasma membrane adhesion molecules(GO:0007156) |
| 0.0 | 0.3 | GO:0071108 | protein K48-linked deubiquitination(GO:0071108) |
| 0.0 | 2.3 | GO:0006367 | transcription initiation from RNA polymerase II promoter(GO:0006367) |
| 0.0 | 0.1 | GO:0006689 | ganglioside catabolic process(GO:0006689) |
| 0.0 | 1.1 | GO:0007030 | Golgi organization(GO:0007030) |
Gene overrepresentation in cellular component category:
| Log-likelihood per target | Total log-likelihood | Term | Description |
|---|---|---|---|
| 2.1 | 6.3 | GO:0061673 | cortical microtubule(GO:0055028) mitotic spindle astral microtubule(GO:0061673) |
| 1.6 | 6.4 | GO:0033263 | CORVET complex(GO:0033263) |
| 1.4 | 4.3 | GO:0016939 | kinesin II complex(GO:0016939) |
| 1.1 | 4.5 | GO:0033596 | TSC1-TSC2 complex(GO:0033596) |
| 0.9 | 5.4 | GO:0032437 | cuticular plate(GO:0032437) |
| 0.9 | 12.0 | GO:0035253 | ciliary rootlet(GO:0035253) |
| 0.8 | 13.3 | GO:0042583 | chromaffin granule(GO:0042583) |
| 0.6 | 2.5 | GO:0005602 | complement component C1 complex(GO:0005602) |
| 0.4 | 4.6 | GO:1990023 | mitotic spindle midzone(GO:1990023) |
| 0.4 | 1.1 | GO:0031251 | PAN complex(GO:0031251) |
| 0.3 | 2.4 | GO:1990452 | Parkin-FBXW7-Cul1 ubiquitin ligase complex(GO:1990452) |
| 0.3 | 4.9 | GO:0097512 | cardiac myofibril(GO:0097512) |
| 0.3 | 2.3 | GO:0097425 | smooth endoplasmic reticulum membrane(GO:0030868) smooth endoplasmic reticulum part(GO:0097425) |
| 0.2 | 0.7 | GO:0097180 | protein C inhibitor-TMPRSS7 complex(GO:0036024) protein C inhibitor-TMPRSS11E complex(GO:0036025) protein C inhibitor-PLAT complex(GO:0036026) protein C inhibitor-PLAU complex(GO:0036027) protein C inhibitor-thrombin complex(GO:0036028) protein C inhibitor-KLK3 complex(GO:0036029) protein C inhibitor-plasma kallikrein complex(GO:0036030) serine protease inhibitor complex(GO:0097180) protein C inhibitor-coagulation factor V complex(GO:0097181) protein C inhibitor-coagulation factor Xa complex(GO:0097182) protein C inhibitor-coagulation factor XI complex(GO:0097183) |
| 0.2 | 3.0 | GO:0000124 | SAGA complex(GO:0000124) |
| 0.2 | 1.9 | GO:0005672 | transcription factor TFIIA complex(GO:0005672) |
| 0.2 | 4.8 | GO:0031362 | anchored component of external side of plasma membrane(GO:0031362) |
| 0.2 | 4.2 | GO:0032591 | dendritic spine membrane(GO:0032591) |
| 0.2 | 13.9 | GO:0005881 | cytoplasmic microtubule(GO:0005881) |
| 0.2 | 1.8 | GO:0061574 | ASAP complex(GO:0061574) |
| 0.2 | 2.7 | GO:0005641 | nuclear envelope lumen(GO:0005641) |
| 0.2 | 3.3 | GO:0031089 | platelet dense granule lumen(GO:0031089) |
| 0.2 | 26.2 | GO:0005875 | microtubule associated complex(GO:0005875) |
| 0.2 | 0.8 | GO:0097169 | AIM2 inflammasome complex(GO:0097169) |
| 0.2 | 2.7 | GO:0000145 | exocyst(GO:0000145) |
| 0.1 | 0.9 | GO:0000172 | ribonuclease MRP complex(GO:0000172) |
| 0.1 | 5.1 | GO:0035869 | ciliary transition zone(GO:0035869) |
| 0.1 | 1.8 | GO:0005862 | muscle thin filament tropomyosin(GO:0005862) |
| 0.1 | 0.6 | GO:0005854 | nascent polypeptide-associated complex(GO:0005854) |
| 0.1 | 0.8 | GO:0042406 | extrinsic component of endoplasmic reticulum membrane(GO:0042406) |
| 0.1 | 0.4 | GO:0044218 | other organism cell membrane(GO:0044218) other organism membrane(GO:0044279) |
| 0.1 | 3.7 | GO:0034361 | very-low-density lipoprotein particle(GO:0034361) triglyceride-rich lipoprotein particle(GO:0034385) |
| 0.1 | 0.7 | GO:1990130 | Iml1 complex(GO:1990130) |
| 0.1 | 0.4 | GO:0005968 | Rab-protein geranylgeranyltransferase complex(GO:0005968) |
| 0.1 | 0.6 | GO:0032279 | asymmetric synapse(GO:0032279) |
| 0.1 | 0.5 | GO:0031205 | endoplasmic reticulum Sec complex(GO:0031205) |
| 0.1 | 13.9 | GO:0005884 | actin filament(GO:0005884) |
| 0.1 | 1.7 | GO:0042613 | MHC class II protein complex(GO:0042613) |
| 0.1 | 1.0 | GO:0005577 | fibrinogen complex(GO:0005577) |
| 0.1 | 1.8 | GO:0046930 | pore complex(GO:0046930) |
| 0.1 | 11.5 | GO:0005923 | bicellular tight junction(GO:0005923) |
| 0.1 | 9.5 | GO:0005796 | Golgi lumen(GO:0005796) |
| 0.1 | 1.0 | GO:0005916 | fascia adherens(GO:0005916) |
| 0.1 | 1.4 | GO:0030992 | intraciliary transport particle B(GO:0030992) |
| 0.1 | 3.1 | GO:0001533 | cornified envelope(GO:0001533) |
| 0.1 | 17.3 | GO:0043209 | myelin sheath(GO:0043209) |
| 0.1 | 1.2 | GO:0042589 | zymogen granule membrane(GO:0042589) |
| 0.1 | 1.3 | GO:1990454 | L-type voltage-gated calcium channel complex(GO:1990454) |
| 0.1 | 2.9 | GO:0008180 | COP9 signalosome(GO:0008180) |
| 0.1 | 2.2 | GO:0030173 | integral component of Golgi membrane(GO:0030173) |
| 0.1 | 0.8 | GO:0000815 | ESCRT III complex(GO:0000815) |
| 0.1 | 1.1 | GO:0032839 | dendrite cytoplasm(GO:0032839) |
| 0.0 | 1.6 | GO:1902555 | endoribonuclease complex(GO:1902555) |
| 0.0 | 1.1 | GO:0036020 | endolysosome membrane(GO:0036020) |
| 0.0 | 1.6 | GO:0071565 | nBAF complex(GO:0071565) |
| 0.0 | 5.0 | GO:0072562 | blood microparticle(GO:0072562) |
| 0.0 | 9.3 | GO:0005802 | trans-Golgi network(GO:0005802) |
| 0.0 | 2.1 | GO:0048786 | presynaptic active zone(GO:0048786) |
| 0.0 | 5.3 | GO:0008076 | voltage-gated potassium channel complex(GO:0008076) potassium channel complex(GO:0034705) |
| 0.0 | 0.8 | GO:0097342 | ripoptosome(GO:0097342) |
| 0.0 | 0.8 | GO:0005921 | gap junction(GO:0005921) |
| 0.0 | 0.7 | GO:0071004 | U2-type prespliceosome(GO:0071004) |
| 0.0 | 0.4 | GO:0005833 | hemoglobin complex(GO:0005833) |
| 0.0 | 9.2 | GO:0009897 | external side of plasma membrane(GO:0009897) |
| 0.0 | 1.8 | GO:0035577 | azurophil granule membrane(GO:0035577) |
| 0.0 | 1.2 | GO:0005891 | voltage-gated calcium channel complex(GO:0005891) |
| 0.0 | 1.1 | GO:0005902 | microvillus(GO:0005902) |
| 0.0 | 1.6 | GO:0001669 | acrosomal vesicle(GO:0001669) |
| 0.0 | 0.8 | GO:1902711 | GABA-A receptor complex(GO:1902711) |
| 0.0 | 11.2 | GO:0000139 | Golgi membrane(GO:0000139) |
| 0.0 | 2.4 | GO:0005793 | endoplasmic reticulum-Golgi intermediate compartment(GO:0005793) |
| 0.0 | 5.4 | GO:0019898 | extrinsic component of membrane(GO:0019898) |
| 0.0 | 1.8 | GO:0005604 | basement membrane(GO:0005604) |
| 0.0 | 3.8 | GO:0014069 | postsynaptic density(GO:0014069) postsynaptic specialization(GO:0099572) |
| 0.0 | 0.8 | GO:0005905 | clathrin-coated pit(GO:0005905) |
| 0.0 | 0.1 | GO:0005889 | hydrogen:potassium-exchanging ATPase complex(GO:0005889) |
| 0.0 | 0.6 | GO:0031904 | endosome lumen(GO:0031904) |
| 0.0 | 1.0 | GO:0010494 | cytoplasmic stress granule(GO:0010494) |
| 0.0 | 0.5 | GO:0000795 | synaptonemal complex(GO:0000795) |
Gene overrepresentation in molecular function category:
| Log-likelihood per target | Total log-likelihood | Term | Description |
|---|---|---|---|
| 1.4 | 5.4 | GO:0000309 | nicotinamide-nucleotide adenylyltransferase activity(GO:0000309) |
| 1.2 | 4.8 | GO:0061714 | folic acid receptor activity(GO:0061714) |
| 1.0 | 3.1 | GO:0004144 | diacylglycerol O-acyltransferase activity(GO:0004144) |
| 1.0 | 3.8 | GO:0047023 | androsterone dehydrogenase activity(GO:0047023) |
| 0.9 | 8.2 | GO:0015143 | urate transmembrane transporter activity(GO:0015143) salt transmembrane transporter activity(GO:1901702) |
| 0.9 | 13.1 | GO:0019957 | C-C chemokine binding(GO:0019957) |
| 0.8 | 4.9 | GO:0008420 | CTD phosphatase activity(GO:0008420) |
| 0.7 | 3.4 | GO:0044729 | hemi-methylated DNA-binding(GO:0044729) |
| 0.6 | 2.5 | GO:1904493 | Ac-Asp-Glu binding(GO:1904492) tetrahydrofolyl-poly(glutamate) polymer binding(GO:1904493) |
| 0.6 | 6.3 | GO:0051011 | microtubule minus-end binding(GO:0051011) |
| 0.6 | 16.2 | GO:0008574 | ATP-dependent microtubule motor activity, plus-end-directed(GO:0008574) |
| 0.6 | 1.7 | GO:0004961 | thromboxane receptor activity(GO:0004960) thromboxane A2 receptor activity(GO:0004961) |
| 0.6 | 4.6 | GO:0019763 | immunoglobulin receptor activity(GO:0019763) |
| 0.6 | 2.3 | GO:0004769 | steroid delta-isomerase activity(GO:0004769) |
| 0.6 | 1.7 | GO:0003845 | 11-beta-hydroxysteroid dehydrogenase [NAD(P)] activity(GO:0003845) |
| 0.5 | 1.1 | GO:0047115 | phenanthrene 9,10-monooxygenase activity(GO:0018636) ketosteroid monooxygenase activity(GO:0047086) trans-1,2-dihydrobenzene-1,2-diol dehydrogenase activity(GO:0047115) |
| 0.5 | 4.7 | GO:0016206 | catechol O-methyltransferase activity(GO:0016206) |
| 0.5 | 4.5 | GO:0005549 | odorant binding(GO:0005549) |
| 0.4 | 2.2 | GO:0047238 | glucuronosyl-N-acetylgalactosaminyl-proteoglycan 4-beta-N-acetylgalactosaminyltransferase activity(GO:0047238) |
| 0.4 | 1.3 | GO:0004060 | arylamine N-acetyltransferase activity(GO:0004060) |
| 0.4 | 5.1 | GO:0016174 | NAD(P)H oxidase activity(GO:0016174) |
| 0.4 | 1.2 | GO:0086059 | voltage-gated calcium channel activity involved SA node cell action potential(GO:0086059) |
| 0.4 | 2.1 | GO:0004447 | iodide peroxidase activity(GO:0004447) |
| 0.4 | 5.9 | GO:0047372 | acylglycerol lipase activity(GO:0047372) |
| 0.4 | 1.5 | GO:0031728 | CCR3 chemokine receptor binding(GO:0031728) |
| 0.3 | 1.3 | GO:0004773 | steryl-sulfatase activity(GO:0004773) |
| 0.3 | 2.2 | GO:0004983 | neuropeptide Y receptor activity(GO:0004983) |
| 0.3 | 7.1 | GO:0051787 | misfolded protein binding(GO:0051787) |
| 0.3 | 2.4 | GO:0050816 | phosphothreonine binding(GO:0050816) |
| 0.3 | 1.2 | GO:0004088 | carbamoyl-phosphate synthase (ammonia) activity(GO:0004087) carbamoyl-phosphate synthase (glutamine-hydrolyzing) activity(GO:0004088) |
| 0.3 | 1.8 | GO:0017060 | 3-galactosyl-N-acetylglucosaminide 4-alpha-L-fucosyltransferase activity(GO:0017060) |
| 0.3 | 2.5 | GO:0004340 | glucokinase activity(GO:0004340) hexokinase activity(GO:0004396) fructokinase activity(GO:0008865) mannokinase activity(GO:0019158) |
| 0.3 | 4.0 | GO:0017162 | aryl hydrocarbon receptor binding(GO:0017162) |
| 0.3 | 1.6 | GO:0032296 | ribonuclease III activity(GO:0004525) double-stranded RNA-specific ribonuclease activity(GO:0032296) |
| 0.3 | 5.0 | GO:0031702 | type 1 angiotensin receptor binding(GO:0031702) |
| 0.3 | 1.0 | GO:0016404 | 15-hydroxyprostaglandin dehydrogenase (NAD+) activity(GO:0016404) |
| 0.2 | 1.0 | GO:0097001 | glycolipid transporter activity(GO:0017089) ceramide binding(GO:0097001) |
| 0.2 | 3.6 | GO:0043024 | ribosomal small subunit binding(GO:0043024) |
| 0.2 | 4.4 | GO:0005522 | profilin binding(GO:0005522) |
| 0.2 | 3.5 | GO:1990380 | Lys48-specific deubiquitinase activity(GO:1990380) |
| 0.2 | 3.5 | GO:0015101 | organic cation transmembrane transporter activity(GO:0015101) |
| 0.2 | 3.2 | GO:0008569 | ATP-dependent microtubule motor activity, minus-end-directed(GO:0008569) |
| 0.2 | 1.8 | GO:0043199 | sulfate binding(GO:0043199) |
| 0.2 | 4.1 | GO:0071949 | FAD binding(GO:0071949) |
| 0.2 | 1.6 | GO:0015272 | ATP-activated inward rectifier potassium channel activity(GO:0015272) |
| 0.2 | 2.7 | GO:0030306 | ADP-ribosylation factor binding(GO:0030306) |
| 0.2 | 4.5 | GO:0043274 | phospholipase binding(GO:0043274) |
| 0.2 | 0.7 | GO:0005415 | nucleoside:sodium symporter activity(GO:0005415) |
| 0.2 | 4.9 | GO:0005212 | structural constituent of eye lens(GO:0005212) |
| 0.2 | 0.8 | GO:0008422 | beta-glucosidase activity(GO:0008422) |
| 0.2 | 1.1 | GO:0008172 | S-methyltransferase activity(GO:0008172) |
| 0.2 | 1.1 | GO:0005497 | androgen binding(GO:0005497) |
| 0.2 | 0.5 | GO:0005260 | channel-conductance-controlling ATPase activity(GO:0005260) |
| 0.2 | 1.1 | GO:0004137 | deoxycytidine kinase activity(GO:0004137) thymidine kinase activity(GO:0004797) |
| 0.2 | 2.1 | GO:1902282 | voltage-gated potassium channel activity involved in ventricular cardiac muscle cell action potential repolarization(GO:1902282) |
| 0.1 | 0.6 | GO:0004925 | prolactin receptor activity(GO:0004925) |
| 0.1 | 2.6 | GO:0004535 | poly(A)-specific ribonuclease activity(GO:0004535) |
| 0.1 | 0.6 | GO:0070905 | serine binding(GO:0070905) |
| 0.1 | 34.1 | GO:0051015 | actin filament binding(GO:0051015) |
| 0.1 | 1.3 | GO:0004128 | cytochrome-b5 reductase activity, acting on NAD(P)H(GO:0004128) |
| 0.1 | 3.3 | GO:0004181 | metallocarboxypeptidase activity(GO:0004181) |
| 0.1 | 0.6 | GO:0005222 | intracellular cAMP activated cation channel activity(GO:0005222) |
| 0.1 | 4.4 | GO:0003777 | microtubule motor activity(GO:0003777) |
| 0.1 | 1.1 | GO:0015277 | kainate selective glutamate receptor activity(GO:0015277) |
| 0.1 | 2.2 | GO:0031005 | filamin binding(GO:0031005) |
| 0.1 | 0.8 | GO:0008568 | microtubule-severing ATPase activity(GO:0008568) |
| 0.1 | 1.1 | GO:0005237 | inhibitory extracellular ligand-gated ion channel activity(GO:0005237) |
| 0.1 | 0.9 | GO:0015349 | thyroid hormone transmembrane transporter activity(GO:0015349) |
| 0.1 | 1.4 | GO:0051864 | histone demethylase activity (H3-K36 specific)(GO:0051864) |
| 0.1 | 3.3 | GO:0005086 | ARF guanyl-nucleotide exchange factor activity(GO:0005086) |
| 0.1 | 3.0 | GO:0016922 | ligand-dependent nuclear receptor binding(GO:0016922) |
| 0.1 | 3.4 | GO:0017091 | AU-rich element binding(GO:0017091) |
| 0.1 | 1.0 | GO:1990825 | sequence-specific mRNA binding(GO:1990825) |
| 0.1 | 2.9 | GO:0050780 | dopamine receptor binding(GO:0050780) |
| 0.1 | 1.4 | GO:0016405 | CoA-ligase activity(GO:0016405) |
| 0.1 | 0.4 | GO:0004663 | Rab geranylgeranyltransferase activity(GO:0004663) |
| 0.1 | 0.8 | GO:0035612 | AP-2 adaptor complex binding(GO:0035612) |
| 0.1 | 0.7 | GO:0032190 | acrosin binding(GO:0032190) |
| 0.1 | 1.9 | GO:0004012 | phospholipid-translocating ATPase activity(GO:0004012) |
| 0.1 | 0.9 | GO:0004526 | ribonuclease P activity(GO:0004526) |
| 0.1 | 7.9 | GO:0016410 | N-acyltransferase activity(GO:0016410) |
| 0.1 | 1.2 | GO:0008320 | protein transmembrane transporter activity(GO:0008320) |
| 0.1 | 1.0 | GO:0004653 | polypeptide N-acetylgalactosaminyltransferase activity(GO:0004653) |
| 0.1 | 1.1 | GO:0035615 | clathrin adaptor activity(GO:0035615) endocytic adaptor activity(GO:0098748) |
| 0.1 | 0.4 | GO:0030492 | hemoglobin binding(GO:0030492) |
| 0.1 | 0.4 | GO:0003747 | translation release factor activity(GO:0003747) translation termination factor activity(GO:0008079) |
| 0.1 | 0.8 | GO:0015280 | ligand-gated sodium channel activity(GO:0015280) |
| 0.1 | 0.9 | GO:0017017 | MAP kinase tyrosine/serine/threonine phosphatase activity(GO:0017017) |
| 0.1 | 1.9 | GO:0001972 | retinoic acid binding(GO:0001972) |
| 0.1 | 1.8 | GO:0001530 | lipopolysaccharide binding(GO:0001530) |
| 0.1 | 0.7 | GO:0001206 | transcriptional repressor activity, RNA polymerase II distal enhancer sequence-specific binding(GO:0001206) |
| 0.1 | 1.7 | GO:0042605 | peptide antigen binding(GO:0042605) |
| 0.1 | 1.3 | GO:0004806 | triglyceride lipase activity(GO:0004806) |
| 0.1 | 0.7 | GO:0042043 | neurexin family protein binding(GO:0042043) |
| 0.1 | 0.3 | GO:0005353 | fructose transmembrane transporter activity(GO:0005353) |
| 0.1 | 0.3 | GO:0005250 | A-type (transient outward) potassium channel activity(GO:0005250) |
| 0.1 | 0.8 | GO:0008252 | nucleotidase activity(GO:0008252) |
| 0.0 | 3.0 | GO:0005544 | calcium-dependent phospholipid binding(GO:0005544) |
| 0.0 | 0.2 | GO:0015562 | efflux transmembrane transporter activity(GO:0015562) |
| 0.0 | 0.2 | GO:0004991 | parathyroid hormone receptor activity(GO:0004991) |
| 0.0 | 8.2 | GO:0001078 | transcriptional repressor activity, RNA polymerase II core promoter proximal region sequence-specific binding(GO:0001078) |
| 0.0 | 1.6 | GO:0005540 | hyaluronic acid binding(GO:0005540) |
| 0.0 | 0.9 | GO:0032183 | SUMO binding(GO:0032183) |
| 0.0 | 0.5 | GO:0031995 | insulin-like growth factor II binding(GO:0031995) |
| 0.0 | 6.4 | GO:0017137 | Rab GTPase binding(GO:0017137) |
| 0.0 | 1.2 | GO:0008395 | steroid hydroxylase activity(GO:0008395) |
| 0.0 | 3.7 | GO:0005319 | lipid transporter activity(GO:0005319) |
| 0.0 | 1.8 | GO:0004407 | histone deacetylase activity(GO:0004407) |
| 0.0 | 4.5 | GO:0005262 | calcium channel activity(GO:0005262) |
| 0.0 | 3.2 | GO:0004867 | serine-type endopeptidase inhibitor activity(GO:0004867) |
| 0.0 | 3.3 | GO:0004866 | endopeptidase inhibitor activity(GO:0004866) |
| 0.0 | 3.7 | GO:0051082 | unfolded protein binding(GO:0051082) |
| 0.0 | 0.8 | GO:0051059 | NF-kappaB binding(GO:0051059) |
| 0.0 | 0.7 | GO:0005527 | macrolide binding(GO:0005527) FK506 binding(GO:0005528) |
| 0.0 | 0.6 | GO:0102391 | decanoate--CoA ligase activity(GO:0102391) |
| 0.0 | 8.1 | GO:0008236 | serine-type peptidase activity(GO:0008236) |
| 0.0 | 0.8 | GO:0097200 | cysteine-type endopeptidase activity involved in execution phase of apoptosis(GO:0097200) |
| 0.0 | 2.4 | GO:0005070 | SH3/SH2 adaptor activity(GO:0005070) |
| 0.0 | 1.7 | GO:0004715 | non-membrane spanning protein tyrosine kinase activity(GO:0004715) |
| 0.0 | 0.2 | GO:0022842 | leak channel activity(GO:0022840) narrow pore channel activity(GO:0022842) |
| 0.0 | 1.0 | GO:0004683 | calmodulin-dependent protein kinase activity(GO:0004683) |
| 0.0 | 1.9 | GO:0004222 | metalloendopeptidase activity(GO:0004222) |
| 0.0 | 2.0 | GO:0003727 | single-stranded RNA binding(GO:0003727) |
| 0.0 | 1.3 | GO:0005249 | voltage-gated potassium channel activity(GO:0005249) |
| 0.0 | 0.2 | GO:0004691 | cAMP-dependent protein kinase activity(GO:0004691) |
| 0.0 | 7.2 | GO:0046982 | protein heterodimerization activity(GO:0046982) |
| 0.0 | 1.2 | GO:0004714 | transmembrane receptor protein tyrosine kinase activity(GO:0004714) |
| 0.0 | 2.3 | GO:0005516 | calmodulin binding(GO:0005516) |
| 0.0 | 1.4 | GO:0004860 | protein kinase inhibitor activity(GO:0004860) |
| 0.0 | 0.6 | GO:0015144 | carbohydrate transmembrane transporter activity(GO:0015144) carbohydrate transporter activity(GO:1901476) |
| 0.0 | 0.9 | GO:0000979 | RNA polymerase II core promoter sequence-specific DNA binding(GO:0000979) |
| 0.0 | 0.5 | GO:0016831 | carboxy-lyase activity(GO:0016831) |
| 0.0 | 0.4 | GO:0005184 | neuropeptide hormone activity(GO:0005184) |
| 0.0 | 1.4 | GO:0005178 | integrin binding(GO:0005178) |
Gene overrepresentation in curated gene sets: canonical pathways category:
| Log-likelihood per target | Total log-likelihood | Term | Description |
|---|---|---|---|
| 0.2 | 11.8 | PID AMB2 NEUTROPHILS PATHWAY | amb2 Integrin signaling |
| 0.2 | 4.4 | PID SYNDECAN 3 PATHWAY | Syndecan-3-mediated signaling events |
| 0.1 | 5.4 | PID PRL SIGNALING EVENTS PATHWAY | Signaling events mediated by PRL |
| 0.1 | 4.9 | PID SMAD2 3PATHWAY | Regulation of cytoplasmic and nuclear SMAD2/3 signaling |
| 0.1 | 5.6 | PID HEDGEHOG GLI PATHWAY | Hedgehog signaling events mediated by Gli proteins |
| 0.1 | 3.2 | PID MYC PATHWAY | C-MYC pathway |
| 0.1 | 7.8 | PID MYC REPRESS PATHWAY | Validated targets of C-MYC transcriptional repression |
| 0.1 | 1.5 | PID HIF1A PATHWAY | Hypoxic and oxygen homeostasis regulation of HIF-1-alpha |
| 0.1 | 5.5 | PID CASPASE PATHWAY | Caspase cascade in apoptosis |
| 0.0 | 0.8 | PID HEDGEHOG 2PATHWAY | Signaling events mediated by the Hedgehog family |
| 0.0 | 1.1 | PID AR NONGENOMIC PATHWAY | Nongenotropic Androgen signaling |
| 0.0 | 3.0 | PID TELOMERASE PATHWAY | Regulation of Telomerase |
| 0.0 | 2.5 | PID HNF3B PATHWAY | FOXA2 and FOXA3 transcription factor networks |
| 0.0 | 2.6 | ST INTEGRIN SIGNALING PATHWAY | Integrin Signaling Pathway |
| 0.0 | 1.8 | PID ARF6 PATHWAY | Arf6 signaling events |
| 0.0 | 1.7 | PID TXA2PATHWAY | Thromboxane A2 receptor signaling |
| 0.0 | 1.0 | PID UPA UPAR PATHWAY | Urokinase-type plasminogen activator (uPA) and uPAR-mediated signaling |
| 0.0 | 0.8 | SA PTEN PATHWAY | PTEN is a tumor suppressor that dephosphorylates the lipid messenger phosphatidylinositol triphosphate. |
| 0.0 | 5.4 | NABA ECM AFFILIATED | Genes encoding proteins affiliated structurally or functionally to extracellular matrix proteins |
| 0.0 | 1.1 | PID PI3K PLC TRK PATHWAY | Trk receptor signaling mediated by PI3K and PLC-gamma |
| 0.0 | 0.9 | ST ERK1 ERK2 MAPK PATHWAY | ERK1/ERK2 MAPK Pathway |
| 0.0 | 0.1 | SA G2 AND M PHASES | Cdc25 activates the cdc2/cyclin B complex to induce the G2/M transition. |
| 0.0 | 0.4 | PID CD40 PATHWAY | CD40/CD40L signaling |
| 0.0 | 1.8 | PID IL4 2PATHWAY | IL4-mediated signaling events |
| 0.0 | 1.3 | PID RAC1 REG PATHWAY | Regulation of RAC1 activity |
| 0.0 | 1.0 | PID ARF6 TRAFFICKING PATHWAY | Arf6 trafficking events |
| 0.0 | 1.0 | PID VEGFR1 2 PATHWAY | Signaling events mediated by VEGFR1 and VEGFR2 |
| 0.0 | 1.2 | PID TCR PATHWAY | TCR signaling in naïve CD4+ T cells |
| 0.0 | 3.9 | NABA ECM REGULATORS | Genes encoding enzymes and their regulators involved in the remodeling of the extracellular matrix |
| 0.0 | 0.6 | PID ERBB4 PATHWAY | ErbB4 signaling events |
| 0.0 | 0.7 | PID PLK1 PATHWAY | PLK1 signaling events |
| 0.0 | 1.2 | PID CMYB PATHWAY | C-MYB transcription factor network |
| 0.0 | 0.7 | PID REG GR PATHWAY | Glucocorticoid receptor regulatory network |
| 0.0 | 3.5 | NABA SECRETED FACTORS | Genes encoding secreted soluble factors |
Gene overrepresentation in curated gene sets: REACTOME pathways category:
| Log-likelihood per target | Total log-likelihood | Term | Description |
|---|---|---|---|
| 0.7 | 5.1 | REACTOME TRYPTOPHAN CATABOLISM | Genes involved in Tryptophan catabolism |
| 0.5 | 6.3 | REACTOME RECRUITMENT OF NUMA TO MITOTIC CENTROSOMES | Genes involved in Recruitment of NuMA to mitotic centrosomes |
| 0.5 | 8.2 | REACTOME ORGANIC CATION ANION ZWITTERION TRANSPORT | Genes involved in Organic cation/anion/zwitterion transport |
| 0.3 | 3.4 | REACTOME SYNTHESIS OF BILE ACIDS AND BILE SALTS VIA 24 HYDROXYCHOLESTEROL | Genes involved in Synthesis of bile acids and bile salts via 24-hydroxycholesterol |
| 0.2 | 2.5 | REACTOME CREATION OF C4 AND C2 ACTIVATORS | Genes involved in Creation of C4 and C2 activators |
| 0.2 | 2.3 | REACTOME ANDROGEN BIOSYNTHESIS | Genes involved in Androgen biosynthesis |
| 0.1 | 6.3 | REACTOME EFFECTS OF PIP2 HYDROLYSIS | Genes involved in Effects of PIP2 hydrolysis |
| 0.1 | 4.5 | REACTOME UNBLOCKING OF NMDA RECEPTOR GLUTAMATE BINDING AND ACTIVATION | Genes involved in Unblocking of NMDA receptor, glutamate binding and activation |
| 0.1 | 1.7 | REACTOME PROSTANOID LIGAND RECEPTORS | Genes involved in Prostanoid ligand receptors |
| 0.1 | 12.6 | REACTOME PHASE II CONJUGATION | Genes involved in Phase II conjugation |
| 0.1 | 2.9 | REACTOME REGULATION OF INSULIN LIKE GROWTH FACTOR IGF ACTIVITY BY INSULIN LIKE GROWTH FACTOR BINDING PROTEINS IGFBPS | Genes involved in Regulation of Insulin-like Growth Factor (IGF) Activity by Insulin-like Growth Factor Binding Proteins (IGFBPs) |
| 0.1 | 2.0 | REACTOME GAMMA CARBOXYLATION TRANSPORT AND AMINO TERMINAL CLEAVAGE OF PROTEINS | Genes involved in Gamma-carboxylation, transport, and amino-terminal cleavage of proteins |
| 0.1 | 4.7 | REACTOME INTERACTION BETWEEN L1 AND ANKYRINS | Genes involved in Interaction between L1 and Ankyrins |
| 0.1 | 2.1 | REACTOME AMINE DERIVED HORMONES | Genes involved in Amine-derived hormones |
| 0.1 | 1.3 | REACTOME THE ACTIVATION OF ARYLSULFATASES | Genes involved in The activation of arylsulfatases |
| 0.1 | 2.1 | REACTOME NOREPINEPHRINE NEUROTRANSMITTER RELEASE CYCLE | Genes involved in Norepinephrine Neurotransmitter Release Cycle |
| 0.1 | 2.5 | REACTOME KINESINS | Genes involved in Kinesins |
| 0.1 | 1.5 | REACTOME OXYGEN DEPENDENT PROLINE HYDROXYLATION OF HYPOXIA INDUCIBLE FACTOR ALPHA | Genes involved in Oxygen-dependent Proline Hydroxylation of Hypoxia-inducible Factor Alpha |
| 0.1 | 1.0 | REACTOME COMMON PATHWAY | Genes involved in Common Pathway |
| 0.1 | 11.1 | REACTOME CELL SURFACE INTERACTIONS AT THE VASCULAR WALL | Genes involved in Cell surface interactions at the vascular wall |
| 0.1 | 1.7 | REACTOME TRANSLOCATION OF ZAP 70 TO IMMUNOLOGICAL SYNAPSE | Genes involved in Translocation of ZAP-70 to Immunological synapse |
| 0.1 | 1.7 | REACTOME STEROID HORMONES | Genes involved in Steroid hormones |
| 0.1 | 5.4 | REACTOME METABOLISM OF VITAMINS AND COFACTORS | Genes involved in Metabolism of vitamins and cofactors |
| 0.1 | 4.9 | REACTOME ACTIVATION OF CHAPERONE GENES BY XBP1S | Genes involved in Activation of Chaperone Genes by XBP1(S) |
| 0.1 | 2.2 | REACTOME CHONDROITIN SULFATE BIOSYNTHESIS | Genes involved in Chondroitin sulfate biosynthesis |
| 0.1 | 0.8 | REACTOME DIGESTION OF DIETARY CARBOHYDRATE | Genes involved in Digestion of dietary carbohydrate |
| 0.1 | 2.4 | REACTOME ASSOCIATION OF TRIC CCT WITH TARGET PROTEINS DURING BIOSYNTHESIS | Genes involved in Association of TriC/CCT with target proteins during biosynthesis |
| 0.1 | 0.9 | REACTOME HYALURONAN UPTAKE AND DEGRADATION | Genes involved in Hyaluronan uptake and degradation |
| 0.1 | 2.9 | REACTOME REGULATION OF GENE EXPRESSION IN BETA CELLS | Genes involved in Regulation of gene expression in beta cells |
| 0.1 | 1.1 | REACTOME TRAFFICKING OF GLUR2 CONTAINING AMPA RECEPTORS | Genes involved in Trafficking of GluR2-containing AMPA receptors |
| 0.1 | 1.6 | REACTOME MICRORNA MIRNA BIOGENESIS | Genes involved in MicroRNA (miRNA) Biogenesis |
| 0.1 | 4.6 | REACTOME INTERFERON GAMMA SIGNALING | Genes involved in Interferon gamma signaling |
| 0.1 | 7.1 | REACTOME RESPONSE TO ELEVATED PLATELET CYTOSOLIC CA2 | Genes involved in Response to elevated platelet cytosolic Ca2+ |
| 0.1 | 0.9 | REACTOME TRANSPORT OF ORGANIC ANIONS | Genes involved in Transport of organic anions |
| 0.0 | 1.2 | REACTOME POST CHAPERONIN TUBULIN FOLDING PATHWAY | Genes involved in Post-chaperonin tubulin folding pathway |
| 0.0 | 1.2 | REACTOME G1 S SPECIFIC TRANSCRIPTION | Genes involved in G1/S-Specific Transcription |
| 0.0 | 8.1 | REACTOME PEPTIDE LIGAND BINDING RECEPTORS | Genes involved in Peptide ligand-binding receptors |
| 0.0 | 1.8 | REACTOME SMOOTH MUSCLE CONTRACTION | Genes involved in Smooth Muscle Contraction |
| 0.0 | 1.9 | REACTOME ION TRANSPORT BY P TYPE ATPASES | Genes involved in Ion transport by P-type ATPases |
| 0.0 | 1.1 | REACTOME IONOTROPIC ACTIVITY OF KAINATE RECEPTORS | Genes involved in Ionotropic activity of Kainate Receptors |
| 0.0 | 2.6 | REACTOME NCAM1 INTERACTIONS | Genes involved in NCAM1 interactions |
| 0.0 | 0.6 | REACTOME CLASS C 3 METABOTROPIC GLUTAMATE PHEROMONE RECEPTORS | Genes involved in Class C/3 (Metabotropic glutamate/pheromone receptors) |
| 0.0 | 1.6 | REACTOME INWARDLY RECTIFYING K CHANNELS | Genes involved in Inwardly rectifying K+ channels |
| 0.0 | 2.6 | REACTOME POTASSIUM CHANNELS | Genes involved in Potassium Channels |
| 0.0 | 0.7 | REACTOME TRANSPORT OF VITAMINS NUCLEOSIDES AND RELATED MOLECULES | Genes involved in Transport of vitamins, nucleosides, and related molecules |
| 0.0 | 2.5 | REACTOME OLFACTORY SIGNALING PATHWAY | Genes involved in Olfactory Signaling Pathway |
| 0.0 | 0.8 | REACTOME EXTRINSIC PATHWAY FOR APOPTOSIS | Genes involved in Extrinsic Pathway for Apoptosis |
| 0.0 | 0.8 | REACTOME GABA A RECEPTOR ACTIVATION | Genes involved in GABA A receptor activation |
| 0.0 | 0.6 | REACTOME PROLACTIN RECEPTOR SIGNALING | Genes involved in Prolactin receptor signaling |
| 0.0 | 1.0 | REACTOME O LINKED GLYCOSYLATION OF MUCINS | Genes involved in O-linked glycosylation of mucins |
| 0.0 | 0.6 | REACTOME SYNTHESIS OF VERY LONG CHAIN FATTY ACYL COAS | Genes involved in Synthesis of very long-chain fatty acyl-CoAs |
| 0.0 | 1.3 | REACTOME IMMUNOREGULATORY INTERACTIONS BETWEEN A LYMPHOID AND A NON LYMPHOID CELL | Genes involved in Immunoregulatory interactions between a Lymphoid and a non-Lymphoid cell |
| 0.0 | 0.4 | REACTOME REGULATION OF COMPLEMENT CASCADE | Genes involved in Regulation of Complement cascade |
| 0.0 | 0.7 | REACTOME ABC FAMILY PROTEINS MEDIATED TRANSPORT | Genes involved in ABC-family proteins mediated transport |
| 0.0 | 0.3 | REACTOME FACILITATIVE NA INDEPENDENT GLUCOSE TRANSPORTERS | Genes involved in Facilitative Na+-independent glucose transporters |
| 0.0 | 0.7 | REACTOME LATENT INFECTION OF HOMO SAPIENS WITH MYCOBACTERIUM TUBERCULOSIS | Genes involved in Latent infection of Homo sapiens with Mycobacterium tuberculosis |
| 0.0 | 7.0 | REACTOME GENERIC TRANSCRIPTION PATHWAY | Genes involved in Generic Transcription Pathway |
| 0.0 | 0.4 | REACTOME DEGRADATION OF THE EXTRACELLULAR MATRIX | Genes involved in Degradation of the extracellular matrix |
| 0.0 | 1.7 | REACTOME METABOLISM OF AMINO ACIDS AND DERIVATIVES | Genes involved in Metabolism of amino acids and derivatives |
| 0.0 | 0.8 | REACTOME MYOGENESIS | Genes involved in Myogenesis |