Project
GNF SymAtlas + NCI-60 cancer cell lines, human (Su, 2004; Ross, 2000)
Navigation
Downloads
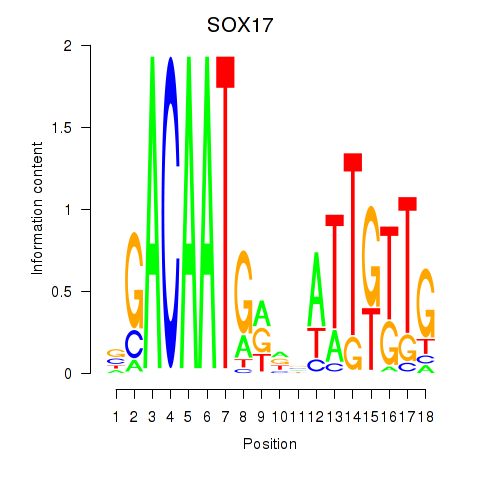
Results for SOX17
Z-value: 0.93
Motif logo
Transcription factors associated with SOX17
| Gene Symbol | Gene ID | Gene Info |
|---|---|---|
|
SOX17
|
ENSG00000164736.6 | SOX17 |
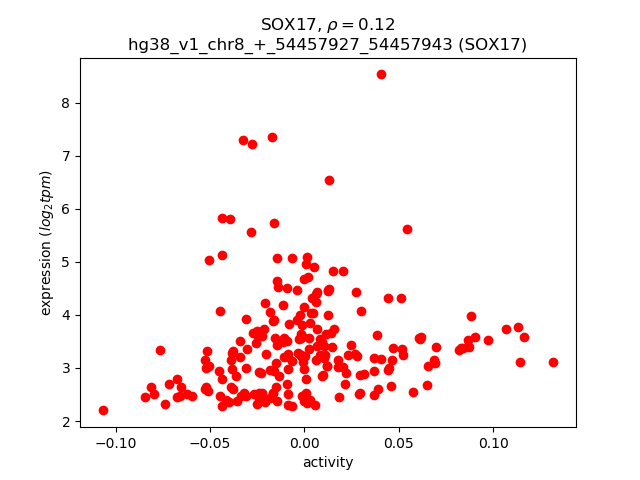
Activity-expression correlation:
| Gene | Promoter | Pearson corr. coef. | P-value | Plot |
|---|---|---|---|---|
| SOX17 | hg38_v1_chr8_+_54457927_54457943 | 0.12 | 7.7e-02 | Click! |
Activity profile of SOX17 motif
Sorted Z-values of SOX17 motif
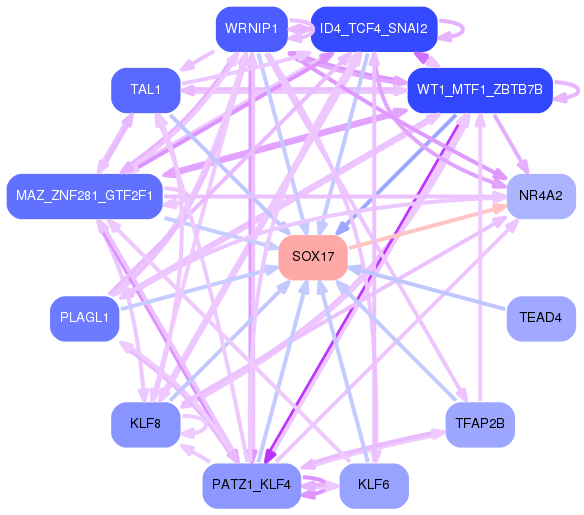
Network of associatons between targets according to the STRING database.

First level regulatory network of SOX17
| Promoter | Score | Transcript | Gene | Gene Info |
|---|---|---|---|---|
| chrX_+_49331616 | 15.64 |
ENST00000612958.1
|
GAGE13
|
G antigen 13 |
| chrX_+_49341192 | 15.45 |
ENST00000621907.1
|
GAGE2E
|
G antigen 2E |
| chrY_+_2841864 | 12.49 |
ENST00000430575.1
|
RPS4Y1
|
ribosomal protein S4 Y-linked 1 |
| chr2_-_89040745 | 11.75 |
ENST00000480492.1
|
IGKV1-12
|
immunoglobulin kappa variable 1-12 |
| chr3_-_123992046 | 11.21 |
ENST00000467907.5
ENST00000459660.5 ENST00000495093.1 ENST00000460743.5 ENST00000405845.7 ENST00000484329.1 ENST00000479867.1 ENST00000496145.5 |
ROPN1
|
rhophilin associated tail protein 1 |
| chr19_+_6135635 | 10.22 |
ENST00000588304.5
ENST00000588722.5 ENST00000588485.6 ENST00000591403.5 ENST00000586696.5 ENST00000681525.1 ENST00000589401.5 |
ACSBG2
|
acyl-CoA synthetase bubblegum family member 2 |
| chr6_-_32953017 | 9.43 |
ENST00000395305.7
ENST00000374843.9 ENST00000395303.7 ENST00000429234.1 |
HLA-DMA
ENSG00000248993.1
|
major histocompatibility complex, class II, DM alpha novel protein |
| chrX_-_6535118 | 9.41 |
ENST00000381089.7
ENST00000612369.4 ENST00000398729.1 |
VCX3A
|
variable charge X-linked 3A |
| chrX_+_49322057 | 9.39 |
ENST00000442437.2
|
GAGE12J
|
G antigen 12J |
| chr3_-_123991352 | 9.36 |
ENST00000184183.8
|
ROPN1
|
rhophilin associated tail protein 1 |
| chr2_-_89222461 | 9.13 |
ENST00000482769.1
|
IGKV2-28
|
immunoglobulin kappa variable 2-28 |
| chr1_-_48472166 | 8.72 |
ENST00000371847.8
ENST00000396199.7 |
SPATA6
|
spermatogenesis associated 6 |
| chr2_-_88992903 | 8.71 |
ENST00000495489.1
|
IGKV1-8
|
immunoglobulin kappa variable 1-8 |
| chr2_+_90082635 | 8.51 |
ENST00000483379.1
|
IGKV1D-17
|
immunoglobulin kappa variable 1D-17 |
| chr3_+_125969172 | 8.46 |
ENST00000514116.6
ENST00000513830.5 |
ROPN1B
|
rhophilin associated tail protein 1B |
| chr3_+_125969152 | 8.45 |
ENST00000251776.8
ENST00000504401.1 |
ROPN1B
|
rhophilin associated tail protein 1B |
| chr12_+_10929229 | 8.30 |
ENST00000381847.7
ENST00000396400.4 |
PRH2
|
proline rich protein HaeIII subfamily 2 |
| chr3_+_125969214 | 7.84 |
ENST00000508088.1
|
ROPN1B
|
rhophilin associated tail protein 1B |
| chr2_-_89117844 | 7.84 |
ENST00000490686.1
|
IGKV1-17
|
immunoglobulin kappa variable 1-17 |
| chr6_-_49787265 | 7.52 |
ENST00000304801.6
|
PGK2
|
phosphoglycerate kinase 2 |
| chr11_-_7674206 | 7.39 |
ENST00000533558.5
ENST00000527542.5 |
CYB5R2
|
cytochrome b5 reductase 2 |
| chr12_-_110920710 | 7.35 |
ENST00000546404.1
|
MYL2
|
myosin light chain 2 |
| chr16_+_10386049 | 7.18 |
ENST00000562527.5
ENST00000396559.5 ENST00000396560.6 ENST00000562102.5 ENST00000543967.5 ENST00000569939.5 ENST00000569900.5 |
ATF7IP2
|
activating transcription factor 7 interacting protein 2 |
| chr6_-_52803807 | 7.11 |
ENST00000334575.6
|
GSTA1
|
glutathione S-transferase alpha 1 |
| chr16_+_2817230 | 7.08 |
ENST00000005995.8
ENST00000574813.5 |
PRSS21
|
serine protease 21 |
| chr6_+_32637419 | 7.04 |
ENST00000374949.2
|
HLA-DQA1
|
major histocompatibility complex, class II, DQ alpha 1 |
| chr8_+_132919403 | 6.90 |
ENST00000519178.5
|
TG
|
thyroglobulin |
| chr7_-_29146527 | 6.78 |
ENST00000265394.10
|
CPVL
|
carboxypeptidase vitellogenic like |
| chr7_-_29146436 | 6.38 |
ENST00000396276.7
|
CPVL
|
carboxypeptidase vitellogenic like |
| chr12_+_69348372 | 6.02 |
ENST00000261267.7
ENST00000549690.1 ENST00000548839.1 |
LYZ
|
lysozyme |
| chr12_-_110920568 | 5.67 |
ENST00000548438.1
ENST00000228841.15 |
MYL2
|
myosin light chain 2 |
| chr3_-_122564253 | 5.65 |
ENST00000492382.5
ENST00000682323.1 ENST00000462315.5 |
PARP9
|
poly(ADP-ribose) polymerase family member 9 |
| chr12_+_25052634 | 5.59 |
ENST00000548766.5
|
IRAG2
|
inositol 1,4,5-triphosphate receptor associated 2 |
| chr19_+_47745534 | 5.58 |
ENST00000246802.10
|
NOP53
|
NOP53 ribosome biogenesis factor |
| chr4_+_70028452 | 5.57 |
ENST00000530128.5
ENST00000381057.3 ENST00000673563.1 |
HTN3
|
histatin 3 |
| chr13_-_46182136 | 5.49 |
ENST00000323076.7
|
LCP1
|
lymphocyte cytosolic protein 1 |
| chr17_-_5234801 | 5.49 |
ENST00000571800.5
ENST00000574081.6 ENST00000399600.8 ENST00000574297.1 |
SCIMP
|
SLP adaptor and CSK interacting membrane protein |
| chr12_+_25052512 | 5.42 |
ENST00000557489.5
ENST00000354454.7 ENST00000536173.5 |
IRAG2
|
inositol 1,4,5-triphosphate receptor associated 2 |
| chrX_-_8171267 | 5.37 |
ENST00000317103.5
|
VCX2
|
variable charge X-linked 2 |
| chr11_-_116837586 | 5.36 |
ENST00000375320.5
ENST00000359492.6 ENST00000375329.6 ENST00000375323.5 ENST00000236850.5 |
APOA1
|
apolipoprotein A1 |
| chr5_-_178187364 | 5.34 |
ENST00000463439.3
|
GMCL2
|
germ cell-less 2, spermatogenesis associated |
| chr12_+_25052732 | 5.30 |
ENST00000547044.5
|
IRAG2
|
inositol 1,4,5-triphosphate receptor associated 2 |
| chr19_+_10654261 | 5.18 |
ENST00000449870.5
|
ILF3
|
interleukin enhancer binding factor 3 |
| chr15_-_19988117 | 5.05 |
ENST00000558565.2
|
IGHV3OR15-7
|
immunoglobulin heavy variable 3/OR15-7 (pseudogene) |
| chr17_-_59964714 | 4.95 |
ENST00000589113.1
ENST00000305783.13 |
RNFT1
|
ring finger protein, transmembrane 1 |
| chr1_+_103617427 | 4.88 |
ENST00000423678.2
ENST00000414303.7 |
AMY2A
|
amylase alpha 2A |
| chr1_+_174875505 | 4.83 |
ENST00000486220.5
|
RABGAP1L
|
RAB GTPase activating protein 1 like |
| chr2_+_90172802 | 4.82 |
ENST00000390277.3
|
IGKV3D-11
|
immunoglobulin kappa variable 3D-11 |
| chr6_+_32637396 | 4.78 |
ENST00000395363.5
ENST00000496318.5 ENST00000343139.11 |
HLA-DQA1
|
major histocompatibility complex, class II, DQ alpha 1 |
| chrX_+_8464830 | 4.69 |
ENST00000453306.4
ENST00000381032.6 ENST00000444481.3 |
VCX3B
|
variable charge X-linked 3B |
| chr3_+_39051990 | 4.48 |
ENST00000302313.10
|
WDR48
|
WD repeat domain 48 |
| chr6_-_39934450 | 4.47 |
ENST00000340692.10
ENST00000373195.7 ENST00000373188.6 |
MOCS1
|
molybdenum cofactor synthesis 1 |
| chr1_-_145995713 | 4.44 |
ENST00000425134.2
|
TXNIP
|
thioredoxin interacting protein |
| chr14_-_106557465 | 4.35 |
ENST00000390625.3
|
IGHV3-49
|
immunoglobulin heavy variable 3-49 |
| chr16_+_84175933 | 4.29 |
ENST00000569735.1
|
DNAAF1
|
dynein axonemal assembly factor 1 |
| chr12_-_11310420 | 4.13 |
ENST00000621732.4
ENST00000445719.2 ENST00000279575.7 |
PRB4
|
proline rich protein BstNI subfamily 4 |
| chr2_-_219245465 | 4.13 |
ENST00000392089.6
|
GLB1L
|
galactosidase beta 1 like |
| chr16_-_5065911 | 3.99 |
ENST00000472572.8
ENST00000474471.7 |
C16orf89
|
chromosome 16 open reading frame 89 |
| chr1_+_53894181 | 3.93 |
ENST00000361921.8
ENST00000322679.10 ENST00000613679.4 ENST00000617230.2 ENST00000610607.4 ENST00000532493.5 ENST00000525202.5 ENST00000524406.5 ENST00000388876.3 |
DIO1
|
iodothyronine deiodinase 1 |
| chr3_+_46370854 | 3.88 |
ENST00000292303.4
|
CCR5
|
C-C motif chemokine receptor 5 |
| chr2_-_88947820 | 3.81 |
ENST00000496168.1
|
IGKV1-5
|
immunoglobulin kappa variable 1-5 |
| chr2_+_86441341 | 3.62 |
ENST00000312912.10
ENST00000409064.5 |
KDM3A
|
lysine demethylase 3A |
| chr12_+_21527017 | 3.54 |
ENST00000535033.5
|
SPX
|
spexin hormone |
| chr11_+_62337424 | 3.32 |
ENST00000415229.6
ENST00000301776.9 ENST00000628829.2 ENST00000534571.5 ENST00000526096.2 |
ASRGL1
|
asparaginase and isoaspartyl peptidase 1 |
| chr2_-_229921316 | 3.26 |
ENST00000428959.5
ENST00000675423.1 |
TRIP12
|
thyroid hormone receptor interactor 12 |
| chr9_-_113056670 | 3.25 |
ENST00000553380.1
ENST00000374227.8 |
ZFP37
|
ZFP37 zinc finger protein |
| chr2_-_156342348 | 3.22 |
ENST00000409572.5
|
NR4A2
|
nuclear receptor subfamily 4 group A member 2 |
| chr1_+_172452885 | 3.21 |
ENST00000367725.4
|
C1orf105
|
chromosome 1 open reading frame 105 |
| chr20_+_35968566 | 3.21 |
ENST00000373973.7
ENST00000349339.5 ENST00000489667.1 ENST00000538900.1 |
CNBD2
|
cyclic nucleotide binding domain containing 2 |
| chr16_-_15094008 | 3.17 |
ENST00000327307.11
|
RRN3
|
RRN3 homolog, RNA polymerase I transcription factor |
| chr6_+_142147162 | 3.15 |
ENST00000452973.6
ENST00000620996.4 ENST00000367621.1 ENST00000367630.9 |
VTA1
|
vesicle trafficking 1 |
| chr19_+_3933059 | 3.14 |
ENST00000616156.4
ENST00000168977.6 ENST00000599576.5 |
NMRK2
|
nicotinamide riboside kinase 2 |
| chr3_+_111542178 | 3.07 |
ENST00000283285.10
ENST00000352690.9 |
CD96
|
CD96 molecule |
| chr7_+_139341311 | 3.07 |
ENST00000297534.7
ENST00000541515.3 |
FMC1
FMC1-LUC7L2
|
formation of mitochondrial complex V assembly factor 1 homolog FMC1-LUC7L2 readthrough |
| chr3_+_121567924 | 3.03 |
ENST00000334384.5
|
ARGFX
|
arginine-fifty homeobox |
| chr14_-_106811131 | 3.03 |
ENST00000424969.2
|
IGHV3-74
|
immunoglobulin heavy variable 3-74 |
| chr9_-_35650902 | 2.99 |
ENST00000259608.8
ENST00000618781.1 |
SIT1
|
signaling threshold regulating transmembrane adaptor 1 |
| chr1_+_45551031 | 2.98 |
ENST00000481885.5
ENST00000471651.1 |
AKR1A1
|
aldo-keto reductase family 1 member A1 |
| chr14_-_91946989 | 2.94 |
ENST00000556154.5
|
FBLN5
|
fibulin 5 |
| chr1_+_13315581 | 2.93 |
ENST00000376152.2
|
PRAMEF15
|
PRAME family member 15 |
| chr6_+_88047822 | 2.93 |
ENST00000237201.2
|
SPACA1
|
sperm acrosome associated 1 |
| chr16_+_590056 | 2.89 |
ENST00000248139.8
ENST00000568586.5 ENST00000538492.5 |
RAB40C
|
RAB40C, member RAS oncogene family |
| chr6_-_42142604 | 2.88 |
ENST00000356542.5
ENST00000341865.9 |
C6orf132
|
chromosome 6 open reading frame 132 |
| chr14_-_106235582 | 2.88 |
ENST00000390607.2
|
IGHV3-21
|
immunoglobulin heavy variable 3-21 |
| chr1_+_24643264 | 2.87 |
ENST00000374389.8
ENST00000323848.14 ENST00000447431.6 |
SRRM1
|
serine and arginine repetitive matrix 1 |
| chr11_+_65027402 | 2.84 |
ENST00000377244.8
ENST00000534637.5 ENST00000524831.5 |
SNX15
|
sorting nexin 15 |
| chr14_-_106088573 | 2.73 |
ENST00000632099.1
|
IGHV3-64D
|
immunoglobulin heavy variable 3-64D |
| chr1_-_173824856 | 2.72 |
ENST00000682279.1
|
CENPL
|
centromere protein L |
| chr3_-_58214671 | 2.71 |
ENST00000460422.1
ENST00000483681.5 |
DNASE1L3
|
deoxyribonuclease 1 like 3 |
| chr10_+_75111476 | 2.69 |
ENST00000671730.1
|
SAMD8
|
sterile alpha motif domain containing 8 |
| chr19_+_43716070 | 2.65 |
ENST00000244314.6
|
IRGC
|
immunity related GTPase cinema |
| chr4_-_185956652 | 2.65 |
ENST00000355634.9
|
SORBS2
|
sorbin and SH3 domain containing 2 |
| chr19_+_43716095 | 2.61 |
ENST00000596627.1
|
IRGC
|
immunity related GTPase cinema |
| chr7_+_57450171 | 2.58 |
ENST00000420713.2
|
ZNF716
|
zinc finger protein 716 |
| chr2_-_151971750 | 2.54 |
ENST00000636598.1
|
CACNB4
|
calcium voltage-gated channel auxiliary subunit beta 4 |
| chr19_+_10654327 | 2.52 |
ENST00000407004.7
ENST00000589998.5 ENST00000589600.5 |
ILF3
|
interleukin enhancer binding factor 3 |
| chr1_-_150808251 | 2.49 |
ENST00000271651.8
ENST00000676970.1 ENST00000679260.1 ENST00000676751.1 ENST00000677887.1 |
CTSK
|
cathepsin K |
| chr1_+_158931539 | 2.46 |
ENST00000368140.6
ENST00000368138.7 ENST00000392254.6 ENST00000392252.7 ENST00000368135.4 |
PYHIN1
|
pyrin and HIN domain family member 1 |
| chr10_+_75111595 | 2.45 |
ENST00000671800.1
ENST00000542569.6 ENST00000372687.4 |
SAMD8
|
sterile alpha motif domain containing 8 |
| chr1_-_9072252 | 2.38 |
ENST00000474145.5
|
SLC2A5
|
solute carrier family 2 member 5 |
| chr1_+_13254212 | 2.38 |
ENST00000622421.2
|
PRAMEF5
|
PRAME family member 5 |
| chr1_+_22007450 | 2.38 |
ENST00000400271.2
|
CELA3A
|
chymotrypsin like elastase 3A |
| chr11_-_85665077 | 2.38 |
ENST00000527447.2
|
CREBZF
|
CREB/ATF bZIP transcription factor |
| chrX_+_102247167 | 2.35 |
ENST00000625106.4
|
NXF2
|
nuclear RNA export factor 2 |
| chr2_-_157444044 | 2.26 |
ENST00000264192.8
|
CYTIP
|
cytohesin 1 interacting protein |
| chr4_+_154743993 | 2.21 |
ENST00000336356.4
|
LRAT
|
lecithin retinol acyltransferase |
| chr19_-_58002761 | 2.21 |
ENST00000552184.1
ENST00000546715.5 ENST00000547828.5 ENST00000547121.5 ENST00000551380.6 |
ZNF606
|
zinc finger protein 606 |
| chr1_-_13155961 | 2.17 |
ENST00000624207.1
|
PRAMEF26
|
PRAME family member 26 |
| chr1_+_75796867 | 2.12 |
ENST00000263187.4
|
MSH4
|
mutS homolog 4 |
| chr19_+_3933581 | 2.11 |
ENST00000593949.1
|
NMRK2
|
nicotinamide riboside kinase 2 |
| chr6_+_125919296 | 2.10 |
ENST00000444128.2
|
NCOA7
|
nuclear receptor coactivator 7 |
| chr16_+_31355165 | 2.09 |
ENST00000562918.5
ENST00000268296.9 |
ITGAX
|
integrin subunit alpha X |
| chr6_+_125919210 | 2.06 |
ENST00000438495.6
|
NCOA7
|
nuclear receptor coactivator 7 |
| chr8_-_7452365 | 2.06 |
ENST00000458665.5
ENST00000528168.3 |
SPAG11B
|
sperm associated antigen 11B |
| chr16_+_33827140 | 2.06 |
ENST00000562905.2
|
IGHV3OR16-13
|
immunoglobulin heavy variable 3/OR16-13 (non-functional) |
| chr19_-_53254841 | 2.04 |
ENST00000601828.5
ENST00000599012.5 ENST00000598513.6 ENST00000598806.5 |
ZNF677
|
zinc finger protein 677 |
| chr11_+_60378524 | 2.03 |
ENST00000530614.5
ENST00000530027.5 ENST00000300184.8 ENST00000530234.2 ENST00000528215.1 ENST00000531787.5 |
MS4A7
MS4A14
|
membrane spanning 4-domains A7 membrane spanning 4-domains A14 |
| chr22_+_32357867 | 2.01 |
ENST00000249007.4
|
RFPL3
|
ret finger protein like 3 |
| chr2_+_1414382 | 2.00 |
ENST00000423320.5
ENST00000346956.7 ENST00000382198.5 |
TPO
|
thyroid peroxidase |
| chr3_+_73061659 | 2.00 |
ENST00000533473.1
|
EBLN2
|
endogenous Bornavirus like nucleoprotein 2 |
| chr6_+_135851681 | 1.99 |
ENST00000308191.11
|
PDE7B
|
phosphodiesterase 7B |
| chr17_-_45060988 | 1.94 |
ENST00000342350.9
|
DCAKD
|
dephospho-CoA kinase domain containing |
| chr19_-_3626746 | 1.94 |
ENST00000429344.7
ENST00000248420.9 ENST00000221899.7 |
CACTIN
|
cactin, spliceosome C complex subunit |
| chr3_+_98732688 | 1.93 |
ENST00000486334.6
ENST00000394162.5 ENST00000613264.4 |
ST3GAL6
|
ST3 beta-galactoside alpha-2,3-sialyltransferase 6 |
| chr11_+_60378475 | 1.92 |
ENST00000358246.5
|
MS4A7
|
membrane spanning 4-domains A7 |
| chr1_-_154956086 | 1.92 |
ENST00000368463.8
ENST00000368460.7 ENST00000368465.5 |
PBXIP1
|
PBX homeobox interacting protein 1 |
| chr14_-_106511856 | 1.92 |
ENST00000390622.2
|
IGHV1-46
|
immunoglobulin heavy variable 1-46 |
| chr3_-_52454032 | 1.87 |
ENST00000232975.8
|
TNNC1
|
troponin C1, slow skeletal and cardiac type |
| chr2_+_43838963 | 1.86 |
ENST00000272286.4
|
ABCG8
|
ATP binding cassette subfamily G member 8 |
| chr2_+_181457342 | 1.85 |
ENST00000397033.7
ENST00000233573.6 |
ITGA4
|
integrin subunit alpha 4 |
| chr17_+_3420568 | 1.84 |
ENST00000574571.4
|
OR3A3
|
olfactory receptor family 3 subfamily A member 3 |
| chr19_+_54769785 | 1.83 |
ENST00000336077.11
|
KIR2DL1
|
killer cell immunoglobulin like receptor, two Ig domains and long cytoplasmic tail 1 |
| chr1_+_15617415 | 1.82 |
ENST00000480945.6
|
DDI2
|
DNA damage inducible 1 homolog 2 |
| chr2_+_216633411 | 1.81 |
ENST00000233809.9
|
IGFBP2
|
insulin like growth factor binding protein 2 |
| chr6_+_29301701 | 1.80 |
ENST00000641895.1
|
OR14J1
|
olfactory receptor family 14 subfamily J member 1 |
| chr2_+_33436304 | 1.80 |
ENST00000402538.7
|
RASGRP3
|
RAS guanyl releasing protein 3 |
| chr4_+_70197924 | 1.80 |
ENST00000514097.5
|
ODAM
|
odontogenic, ameloblast associated |
| chr16_+_31355215 | 1.77 |
ENST00000562522.2
|
ITGAX
|
integrin subunit alpha X |
| chr13_+_24764158 | 1.77 |
ENST00000255324.10
ENST00000255325.6 |
RNF17
|
ring finger protein 17 |
| chr1_-_92483947 | 1.76 |
ENST00000370332.5
|
GFI1
|
growth factor independent 1 transcriptional repressor |
| chr12_-_7502730 | 1.73 |
ENST00000541972.5
|
CD163
|
CD163 molecule |
| chrY_-_17880220 | 1.73 |
ENST00000382867.4
|
CDY2B
|
chromodomain Y-linked 2B |
| chr18_+_24460630 | 1.71 |
ENST00000256906.5
|
HRH4
|
histamine receptor H4 |
| chr18_+_54828406 | 1.70 |
ENST00000262094.10
|
RAB27B
|
RAB27B, member RAS oncogene family |
| chr1_-_12831410 | 1.69 |
ENST00000619922.1
|
PRAMEF11
|
PRAME family member 11 |
| chr18_+_24460655 | 1.68 |
ENST00000426880.2
|
HRH4
|
histamine receptor H4 |
| chr6_-_118935146 | 1.68 |
ENST00000619706.5
ENST00000316316.10 |
MCM9
|
minichromosome maintenance 9 homologous recombination repair factor |
| chrY_-_23694579 | 1.66 |
ENST00000343584.10
|
PRYP3
|
PTPN13 like Y-linked pseudogene 3 |
| chr6_-_45377860 | 1.65 |
ENST00000371460.5
ENST00000371459.6 |
SUPT3H
|
SPT3 homolog, SAGA and STAGA complex component |
| chrY_+_24834127 | 1.64 |
ENST00000382296.4
ENST00000634662.1 |
DAZ4
|
deleted in azoospermia 4 |
| chr4_+_139454070 | 1.62 |
ENST00000305626.6
|
RAB33B
|
RAB33B, member RAS oncogene family |
| chr7_-_115968302 | 1.60 |
ENST00000457268.5
|
TFEC
|
transcription factor EC |
| chr8_-_94208548 | 1.58 |
ENST00000027335.8
ENST00000441892.6 ENST00000521491.1 |
CDH17
|
cadherin 17 |
| chr19_+_54630497 | 1.57 |
ENST00000396332.8
ENST00000427581.6 |
LILRB1
|
leukocyte immunoglobulin like receptor B1 |
| chr17_+_27471999 | 1.54 |
ENST00000583370.5
ENST00000509603.6 ENST00000268763.10 ENST00000398988.7 |
KSR1
|
kinase suppressor of ras 1 |
| chr7_-_77199808 | 1.53 |
ENST00000248598.6
|
FGL2
|
fibrinogen like 2 |
| chr1_+_171248471 | 1.52 |
ENST00000402921.6
ENST00000617670.6 ENST00000367750.7 |
FMO1
|
flavin containing dimethylaniline monoxygenase 1 |
| chr14_+_21825453 | 1.50 |
ENST00000390432.2
|
TRAV10
|
T cell receptor alpha variable 10 |
| chr19_+_2163915 | 1.49 |
ENST00000398665.8
|
DOT1L
|
DOT1 like histone lysine methyltransferase |
| chr9_-_113056759 | 1.47 |
ENST00000555206.5
|
ZFP37
|
ZFP37 zinc finger protein |
| chr17_-_3063607 | 1.44 |
ENST00000575751.1
|
OR1D5
|
olfactory receptor family 1 subfamily D member 5 |
| chr12_-_56360084 | 1.44 |
ENST00000314128.9
ENST00000557235.5 ENST00000651915.1 |
STAT2
|
signal transducer and activator of transcription 2 |
| chr2_+_102418642 | 1.44 |
ENST00000264260.6
|
IL18RAP
|
interleukin 18 receptor accessory protein |
| chr1_-_12945416 | 1.43 |
ENST00000415464.6
|
PRAMEF6
|
PRAME family member 6 |
| chr1_-_45339995 | 1.43 |
ENST00000488731.6
ENST00000435155.1 |
MUTYH
|
mutY DNA glycosylase |
| chr1_-_12886201 | 1.39 |
ENST00000235349.6
|
PRAMEF4
|
PRAME family member 4 |
| chr19_-_44304968 | 1.38 |
ENST00000591609.1
ENST00000589799.5 ENST00000291182.9 ENST00000650576.1 ENST00000589248.5 |
ZNF235
|
zinc finger protein 235 |
| chr3_+_122564327 | 1.38 |
ENST00000296161.9
ENST00000383661.3 |
DTX3L
|
deltex E3 ubiquitin ligase 3L |
| chr16_-_20697680 | 1.37 |
ENST00000520010.6
|
ACSM1
|
acyl-CoA synthetase medium chain family member 1 |
| chr1_+_158831323 | 1.33 |
ENST00000368141.5
|
MNDA
|
myeloid cell nuclear differentiation antigen |
| chr3_+_98732236 | 1.33 |
ENST00000265261.10
ENST00000483910.5 ENST00000460774.5 |
ST3GAL6
|
ST3 beta-galactoside alpha-2,3-sialyltransferase 6 |
| chr6_+_83859640 | 1.32 |
ENST00000369679.4
ENST00000369681.10 |
CYB5R4
|
cytochrome b5 reductase 4 |
| chr17_+_59220446 | 1.30 |
ENST00000284116.9
ENST00000581140.5 ENST00000581276.5 |
GDPD1
|
glycerophosphodiester phosphodiesterase domain containing 1 |
| chr12_-_8662808 | 1.29 |
ENST00000359478.7
ENST00000396549.6 |
MFAP5
|
microfibril associated protein 5 |
| chr6_-_142147122 | 1.28 |
ENST00000258042.2
|
NMBR
|
neuromedin B receptor |
| chr5_+_141208697 | 1.27 |
ENST00000624949.1
ENST00000622978.1 ENST00000239450.4 |
PCDHB12
|
protocadherin beta 12 |
| chr5_-_16508858 | 1.27 |
ENST00000684456.1
|
RETREG1
|
reticulophagy regulator 1 |
| chr8_-_17895487 | 1.26 |
ENST00000427924.5
ENST00000381841.4 |
FGL1
|
fibrinogen like 1 |
| chr3_+_185586270 | 1.24 |
ENST00000296257.10
|
SENP2
|
SUMO specific peptidase 2 |
| chr12_+_26011713 | 1.24 |
ENST00000542004.5
|
RASSF8
|
Ras association domain family member 8 |
| chr6_-_42722590 | 1.21 |
ENST00000230381.7
|
PRPH2
|
peripherin 2 |
| chr6_-_31777319 | 1.21 |
ENST00000375688.5
|
VWA7
|
von Willebrand factor A domain containing 7 |
| chr5_-_10307821 | 1.20 |
ENST00000296658.4
|
CMBL
|
carboxymethylenebutenolidase homolog |
| chr7_+_95485934 | 1.20 |
ENST00000325885.6
|
ASB4
|
ankyrin repeat and SOCS box containing 4 |
| chr12_-_8662703 | 1.18 |
ENST00000535336.5
|
MFAP5
|
microfibril associated protein 5 |
| chr2_-_215138603 | 1.18 |
ENST00000272895.12
|
ABCA12
|
ATP binding cassette subfamily A member 12 |
| chrX_-_13319952 | 1.17 |
ENST00000622204.1
ENST00000380622.5 |
ATXN3L
|
ataxin 3 like |
| chr1_+_86468902 | 1.17 |
ENST00000394711.2
|
CLCA1
|
chloride channel accessory 1 |
| chr12_-_68253502 | 1.16 |
ENST00000328087.6
ENST00000538666.6 |
IL22
|
interleukin 22 |
| chr15_-_33067884 | 1.16 |
ENST00000334528.13
|
FMN1
|
formin 1 |
| chr14_+_39233908 | 1.16 |
ENST00000280082.4
|
MIA2
|
MIA SH3 domain ER export factor 2 |
| chr5_+_170861990 | 1.14 |
ENST00000523189.6
|
RANBP17
|
RAN binding protein 17 |
| chr1_+_15247267 | 1.14 |
ENST00000358897.8
ENST00000433640.7 |
FHAD1
|
forkhead associated phosphopeptide binding domain 1 |
| chr19_+_16661121 | 1.13 |
ENST00000187762.7
ENST00000599479.1 |
TMEM38A
|
transmembrane protein 38A |
| chr5_-_168883333 | 1.10 |
ENST00000404867.7
|
SLIT3
|
slit guidance ligand 3 |
| chr11_+_17295322 | 1.09 |
ENST00000458064.6
ENST00000622082.4 |
NUCB2
|
nucleobindin 2 |
| chr10_-_27100463 | 1.08 |
ENST00000436985.7
ENST00000376087.5 |
ANKRD26
|
ankyrin repeat domain 26 |
| chr15_-_42920638 | 1.06 |
ENST00000566931.1
ENST00000564431.5 ENST00000567274.5 ENST00000267890.11 |
TTBK2
|
tau tubulin kinase 2 |
| chr21_-_32603237 | 1.03 |
ENST00000431599.1
|
CFAP298
|
cilia and flagella associated protein 298 |
| chr12_+_52274610 | 1.02 |
ENST00000423955.7
|
KRT86
|
keratin 86 |
Gene Ontology Analysis
Gene overrepresentation in biological process category:
| Log-likelihood per target | Total log-likelihood | Term | Description |
|---|---|---|---|
| 3.1 | 9.4 | GO:0002503 | peptide antigen assembly with MHC class II protein complex(GO:0002503) |
| 1.9 | 5.6 | GO:1903004 | regulation of protein K63-linked deubiquitination(GO:1903004) positive regulation of protein K63-linked deubiquitination(GO:1903006) |
| 1.8 | 9.0 | GO:0016998 | cell wall macromolecule catabolic process(GO:0016998) |
| 1.6 | 1.6 | GO:1903433 | regulation of constitutive secretory pathway(GO:1903433) |
| 1.3 | 24.8 | GO:0007342 | fusion of sperm to egg plasma membrane(GO:0007342) |
| 1.2 | 3.6 | GO:0046292 | formaldehyde metabolic process(GO:0046292) |
| 1.2 | 13.0 | GO:0098735 | positive regulation of the force of heart contraction(GO:0098735) |
| 1.1 | 5.4 | GO:0010903 | negative regulation of very-low-density lipoprotein particle remodeling(GO:0010903) |
| 1.1 | 3.2 | GO:0021538 | epithalamus development(GO:0021538) habenula development(GO:0021986) |
| 0.9 | 6.9 | GO:0015705 | iodide transport(GO:0015705) |
| 0.8 | 5.7 | GO:0070212 | protein poly-ADP-ribosylation(GO:0070212) |
| 0.8 | 3.1 | GO:0002370 | natural killer cell cytokine production(GO:0002370) regulation of natural killer cell cytokine production(GO:0002727) |
| 0.7 | 4.3 | GO:0035469 | determination of pancreatic left/right asymmetry(GO:0035469) |
| 0.7 | 4.9 | GO:0044245 | polysaccharide digestion(GO:0044245) |
| 0.6 | 5.1 | GO:0006686 | sphingomyelin biosynthetic process(GO:0006686) |
| 0.6 | 3.2 | GO:0001180 | transcription initiation from RNA polymerase I promoter for nuclear large rRNA transcript(GO:0001180) |
| 0.6 | 1.9 | GO:0002086 | diaphragm contraction(GO:0002086) |
| 0.6 | 1.9 | GO:1904479 | negative regulation of intestinal absorption(GO:1904479) |
| 0.6 | 1.9 | GO:1903238 | positive regulation of leukocyte tethering or rolling(GO:1903238) |
| 0.6 | 3.5 | GO:1904306 | regulation of gastro-intestinal system smooth muscle contraction(GO:1904304) positive regulation of gastro-intestinal system smooth muscle contraction(GO:1904306) |
| 0.6 | 1.8 | GO:0070105 | positive regulation of interleukin-6-mediated signaling pathway(GO:0070105) |
| 0.6 | 4.5 | GO:0019720 | Mo-molybdopterin cofactor biosynthetic process(GO:0006777) Mo-molybdopterin cofactor metabolic process(GO:0019720) |
| 0.5 | 1.6 | GO:0002314 | germinal center B cell differentiation(GO:0002314) |
| 0.5 | 1.5 | GO:0045957 | regulation of complement activation, alternative pathway(GO:0030451) negative regulation of complement activation, alternative pathway(GO:0045957) |
| 0.5 | 2.5 | GO:0001957 | intramembranous ossification(GO:0001957) direct ossification(GO:0036072) |
| 0.5 | 1.5 | GO:0034729 | histone H3-K79 methylation(GO:0034729) |
| 0.5 | 3.3 | GO:1901315 | negative regulation of histone ubiquitination(GO:0033183) negative regulation of protein K63-linked ubiquitination(GO:1900045) regulation of histone H2A K63-linked ubiquitination(GO:1901314) negative regulation of histone H2A K63-linked ubiquitination(GO:1901315) negative regulation of protein polyubiquitination(GO:1902915) |
| 0.5 | 1.4 | GO:0019605 | benzoate metabolic process(GO:0018874) butyrate metabolic process(GO:0019605) |
| 0.4 | 4.5 | GO:1902525 | regulation of protein monoubiquitination(GO:1902525) |
| 0.4 | 2.4 | GO:0032445 | fructose transport(GO:0015755) fructose import(GO:0032445) carbohydrate import into cell(GO:0097319) carbohydrate import across plasma membrane(GO:0098704) fructose import across plasma membrane(GO:1990539) |
| 0.4 | 1.6 | GO:0002290 | gamma-delta T cell activation involved in immune response(GO:0002290) negative regulation of interferon-beta secretion(GO:0035548) regulation of gamma-delta T cell activation involved in immune response(GO:2001191) positive regulation of gamma-delta T cell activation involved in immune response(GO:2001193) |
| 0.4 | 3.9 | GO:0039663 | fusion of virus membrane with host plasma membrane(GO:0019064) membrane fusion involved in viral entry into host cell(GO:0039663) multi-organism membrane fusion(GO:0044800) |
| 0.4 | 8.7 | GO:0044458 | motile cilium assembly(GO:0044458) |
| 0.4 | 0.8 | GO:0002876 | positive regulation of chronic inflammatory response to antigenic stimulus(GO:0002876) |
| 0.4 | 3.3 | GO:0006528 | asparagine metabolic process(GO:0006528) |
| 0.4 | 51.8 | GO:0006958 | complement activation, classical pathway(GO:0006958) |
| 0.4 | 10.2 | GO:0035338 | long-chain fatty-acyl-CoA biosynthetic process(GO:0035338) |
| 0.4 | 1.1 | GO:1904692 | positive regulation of type B pancreatic cell proliferation(GO:1904692) |
| 0.3 | 3.1 | GO:0061469 | regulation of type B pancreatic cell proliferation(GO:0061469) |
| 0.3 | 1.2 | GO:0035627 | ceramide transport(GO:0035627) |
| 0.3 | 1.2 | GO:0072092 | ureteric bud invasion(GO:0072092) |
| 0.3 | 4.8 | GO:0071985 | multivesicular body sorting pathway(GO:0071985) |
| 0.3 | 7.1 | GO:0043651 | linoleic acid metabolic process(GO:0043651) |
| 0.3 | 5.5 | GO:0071803 | positive regulation of podosome assembly(GO:0071803) |
| 0.3 | 5.9 | GO:0006590 | thyroid hormone generation(GO:0006590) |
| 0.3 | 1.8 | GO:0002767 | immune response-inhibiting signal transduction(GO:0002765) immune response-inhibiting cell surface receptor signaling pathway(GO:0002767) |
| 0.3 | 1.8 | GO:0060054 | positive regulation of epithelial cell proliferation involved in wound healing(GO:0060054) |
| 0.2 | 1.2 | GO:0034334 | adherens junction maintenance(GO:0034334) |
| 0.2 | 2.9 | GO:0048251 | elastic fiber assembly(GO:0048251) |
| 0.2 | 2.1 | GO:0051026 | chiasma assembly(GO:0051026) |
| 0.2 | 0.7 | GO:0030573 | bile acid catabolic process(GO:0030573) |
| 0.2 | 0.9 | GO:0031064 | negative regulation of histone deacetylation(GO:0031064) |
| 0.2 | 1.1 | GO:0061364 | apoptotic process involved in luteolysis(GO:0061364) |
| 0.2 | 4.2 | GO:1902083 | negative regulation of peptidyl-cysteine S-nitrosylation(GO:1902083) |
| 0.2 | 1.5 | GO:0030321 | transepithelial chloride transport(GO:0030321) |
| 0.2 | 1.2 | GO:0016926 | protein desumoylation(GO:0016926) |
| 0.2 | 1.4 | GO:0045007 | depurination(GO:0045007) |
| 0.2 | 1.9 | GO:0060339 | negative regulation of type I interferon-mediated signaling pathway(GO:0060339) |
| 0.2 | 1.5 | GO:0070995 | NADPH oxidation(GO:0070995) |
| 0.2 | 5.3 | GO:0045662 | negative regulation of myoblast differentiation(GO:0045662) |
| 0.2 | 0.9 | GO:0006127 | glycerophosphate shuttle(GO:0006127) |
| 0.2 | 2.0 | GO:0006776 | vitamin A metabolic process(GO:0006776) |
| 0.2 | 4.4 | GO:0002347 | response to tumor cell(GO:0002347) |
| 0.2 | 7.5 | GO:0030317 | sperm motility(GO:0030317) |
| 0.2 | 1.4 | GO:0015816 | glycine transport(GO:0015816) |
| 0.2 | 9.2 | GO:0015701 | bicarbonate transport(GO:0015701) |
| 0.2 | 5.6 | GO:0050832 | defense response to fungus(GO:0050832) |
| 0.1 | 0.9 | GO:1901098 | regulation of autophagosome maturation(GO:1901096) positive regulation of autophagosome maturation(GO:1901098) |
| 0.1 | 0.7 | GO:0007056 | spindle assembly involved in female meiosis(GO:0007056) |
| 0.1 | 0.4 | GO:1903383 | neuron intrinsic apoptotic signaling pathway in response to hydrogen peroxide(GO:0036482) positive regulation of mitochondrial electron transport, NADH to ubiquinone(GO:1902958) regulation of hydrogen peroxide-induced neuron intrinsic apoptotic signaling pathway(GO:1903383) negative regulation of hydrogen peroxide-induced neuron intrinsic apoptotic signaling pathway(GO:1903384) |
| 0.1 | 0.4 | GO:0006421 | asparaginyl-tRNA aminoacylation(GO:0006421) |
| 0.1 | 2.6 | GO:0010623 | programmed cell death involved in cell development(GO:0010623) |
| 0.1 | 0.4 | GO:0001831 | trophectodermal cellular morphogenesis(GO:0001831) |
| 0.1 | 1.0 | GO:2000467 | insulin receptor signaling pathway via phosphatidylinositol 3-kinase(GO:0038028) positive regulation of glycogen (starch) synthase activity(GO:2000467) |
| 0.1 | 2.4 | GO:0016973 | poly(A)+ mRNA export from nucleus(GO:0016973) |
| 0.1 | 0.7 | GO:0002230 | positive regulation of defense response to virus by host(GO:0002230) |
| 0.1 | 3.0 | GO:0097503 | sialylation(GO:0097503) |
| 0.1 | 11.8 | GO:0031295 | T cell costimulation(GO:0031295) |
| 0.1 | 0.9 | GO:0001787 | natural killer cell proliferation(GO:0001787) |
| 0.1 | 0.9 | GO:0070315 | G1 to G0 transition involved in cell differentiation(GO:0070315) |
| 0.1 | 3.0 | GO:0043029 | T cell homeostasis(GO:0043029) |
| 0.1 | 0.3 | GO:0002725 | negative regulation of T cell cytokine production(GO:0002725) |
| 0.1 | 8.2 | GO:0045071 | negative regulation of viral genome replication(GO:0045071) |
| 0.1 | 0.8 | GO:0007023 | post-chaperonin tubulin folding pathway(GO:0007023) |
| 0.1 | 0.4 | GO:0051005 | negative regulation of lipoprotein lipase activity(GO:0051005) |
| 0.1 | 0.7 | GO:0061709 | reticulophagy(GO:0061709) |
| 0.1 | 1.8 | GO:0042104 | positive regulation of activated T cell proliferation(GO:0042104) |
| 0.1 | 6.1 | GO:0006501 | C-terminal protein lipidation(GO:0006501) |
| 0.1 | 2.6 | GO:0003301 | physiological muscle hypertrophy(GO:0003298) physiological cardiac muscle hypertrophy(GO:0003301) cell growth involved in cardiac muscle cell development(GO:0061049) |
| 0.1 | 0.7 | GO:0002480 | antigen processing and presentation of exogenous peptide antigen via MHC class I, TAP-independent(GO:0002480) |
| 0.1 | 1.4 | GO:2001214 | positive regulation of vasculogenesis(GO:2001214) |
| 0.1 | 0.6 | GO:1904354 | negative regulation of telomere capping(GO:1904354) |
| 0.1 | 1.6 | GO:0070935 | 3'-UTR-mediated mRNA stabilization(GO:0070935) |
| 0.1 | 2.7 | GO:0034080 | chromatin remodeling at centromere(GO:0031055) CENP-A containing nucleosome assembly(GO:0034080) CENP-A containing chromatin organization(GO:0061641) |
| 0.1 | 1.9 | GO:0015937 | coenzyme A biosynthetic process(GO:0015937) |
| 0.1 | 0.7 | GO:0051601 | exocyst localization(GO:0051601) |
| 0.1 | 1.2 | GO:0035520 | monoubiquitinated protein deubiquitination(GO:0035520) |
| 0.1 | 0.2 | GO:0010133 | proline catabolic process to glutamate(GO:0010133) |
| 0.1 | 1.6 | GO:0016578 | histone deubiquitination(GO:0016578) |
| 0.1 | 1.3 | GO:0030889 | negative regulation of B cell proliferation(GO:0030889) |
| 0.1 | 3.1 | GO:0007194 | negative regulation of adenylate cyclase activity(GO:0007194) |
| 0.1 | 5.5 | GO:0007127 | meiosis I(GO:0007127) |
| 0.1 | 6.0 | GO:0050911 | detection of chemical stimulus involved in sensory perception of smell(GO:0050911) |
| 0.1 | 9.0 | GO:0006614 | SRP-dependent cotranslational protein targeting to membrane(GO:0006614) |
| 0.1 | 2.2 | GO:0060216 | definitive hemopoiesis(GO:0060216) |
| 0.1 | 3.6 | GO:0006953 | acute-phase response(GO:0006953) |
| 0.1 | 0.6 | GO:0034638 | phosphatidylcholine catabolic process(GO:0034638) |
| 0.1 | 6.2 | GO:0090630 | activation of GTPase activity(GO:0090630) |
| 0.1 | 1.0 | GO:0043691 | reverse cholesterol transport(GO:0043691) |
| 0.1 | 0.2 | GO:0000415 | negative regulation of histone H3-K36 methylation(GO:0000415) |
| 0.1 | 0.9 | GO:0010886 | positive regulation of cholesterol storage(GO:0010886) |
| 0.0 | 0.5 | GO:0006957 | complement activation, alternative pathway(GO:0006957) |
| 0.0 | 3.9 | GO:0034113 | heterotypic cell-cell adhesion(GO:0034113) |
| 0.0 | 1.4 | GO:0010390 | histone monoubiquitination(GO:0010390) |
| 0.0 | 2.2 | GO:0006904 | vesicle docking involved in exocytosis(GO:0006904) |
| 0.0 | 2.0 | GO:0006198 | cAMP catabolic process(GO:0006198) |
| 0.0 | 1.4 | GO:0090140 | regulation of mitochondrial fission(GO:0090140) |
| 0.0 | 4.4 | GO:0002377 | immunoglobulin production(GO:0002377) |
| 0.0 | 2.0 | GO:1901385 | regulation of voltage-gated calcium channel activity(GO:1901385) |
| 0.0 | 0.6 | GO:0019371 | cyclooxygenase pathway(GO:0019371) |
| 0.0 | 1.5 | GO:0019933 | cAMP-mediated signaling(GO:0019933) |
| 0.0 | 0.7 | GO:0034142 | toll-like receptor 4 signaling pathway(GO:0034142) |
| 0.0 | 2.9 | GO:0031124 | mRNA 3'-end processing(GO:0031124) |
| 0.0 | 0.5 | GO:0045109 | intermediate filament organization(GO:0045109) |
| 0.0 | 0.2 | GO:0070166 | enamel mineralization(GO:0070166) regulation of tooth mineralization(GO:0070170) |
| 0.0 | 0.1 | GO:0009822 | alkaloid catabolic process(GO:0009822) |
| 0.0 | 0.3 | GO:0010992 | ubiquitin homeostasis(GO:0010992) |
| 0.0 | 0.5 | GO:0030033 | microvillus assembly(GO:0030033) |
| 0.0 | 0.7 | GO:0045616 | regulation of keratinocyte differentiation(GO:0045616) |
| 0.0 | 0.1 | GO:0001880 | Mullerian duct regression(GO:0001880) |
| 0.0 | 0.1 | GO:0032074 | negative regulation of nuclease activity(GO:0032074) |
| 0.0 | 2.0 | GO:0007586 | digestion(GO:0007586) |
| 0.0 | 1.1 | GO:0000725 | double-strand break repair via homologous recombination(GO:0000724) recombinational repair(GO:0000725) |
| 0.0 | 1.3 | GO:0042439 | ethanolamine-containing compound metabolic process(GO:0042439) |
| 0.0 | 5.2 | GO:0007283 | spermatogenesis(GO:0007283) male gamete generation(GO:0048232) |
| 0.0 | 1.5 | GO:0007224 | smoothened signaling pathway(GO:0007224) |
| 0.0 | 1.1 | GO:0007200 | phospholipase C-activating G-protein coupled receptor signaling pathway(GO:0007200) |
| 0.0 | 0.5 | GO:0010501 | RNA secondary structure unwinding(GO:0010501) |
| 0.0 | 0.7 | GO:0045814 | negative regulation of gene expression, epigenetic(GO:0045814) |
| 0.0 | 0.2 | GO:0003215 | cardiac right ventricle morphogenesis(GO:0003215) |
Gene overrepresentation in cellular component category:
| Log-likelihood per target | Total log-likelihood | Term | Description |
|---|---|---|---|
| 2.9 | 8.7 | GO:0097224 | sperm connecting piece(GO:0097224) |
| 1.3 | 5.4 | GO:0034365 | discoidal high-density lipoprotein particle(GO:0034365) |
| 1.1 | 21.2 | GO:0042613 | MHC class II protein complex(GO:0042613) |
| 0.9 | 1.9 | GO:1990584 | cardiac Troponin complex(GO:1990584) |
| 0.9 | 5.6 | GO:0033553 | rDNA heterochromatin(GO:0033553) |
| 0.8 | 13.0 | GO:0097512 | cardiac myofibril(GO:0097512) |
| 0.8 | 7.5 | GO:0035686 | sperm fibrous sheath(GO:0035686) |
| 0.6 | 2.4 | GO:0042272 | nuclear RNA export factor complex(GO:0042272) |
| 0.5 | 5.5 | GO:0097197 | tetraspanin-enriched microdomain(GO:0097197) |
| 0.5 | 1.9 | GO:0034669 | integrin alpha4-beta7 complex(GO:0034669) |
| 0.4 | 2.1 | GO:0005713 | recombination nodule(GO:0005713) |
| 0.4 | 2.5 | GO:0036021 | endolysosome lumen(GO:0036021) |
| 0.3 | 3.8 | GO:0005577 | fibrinogen complex(GO:0005577) |
| 0.3 | 17.4 | GO:0042571 | immunoglobulin complex, circulating(GO:0042571) |
| 0.3 | 2.9 | GO:0071953 | elastic fiber(GO:0071953) |
| 0.2 | 5.5 | GO:0001891 | phagocytic cup(GO:0001891) |
| 0.2 | 0.6 | GO:0000333 | telomerase catalytic core complex(GO:0000333) |
| 0.2 | 2.0 | GO:0043190 | ATP-binding cassette (ABC) transporter complex(GO:0043190) |
| 0.2 | 12.5 | GO:0005844 | polysome(GO:0005844) |
| 0.2 | 0.7 | GO:0098592 | cytoplasmic side of apical plasma membrane(GO:0098592) |
| 0.2 | 1.2 | GO:0097209 | epidermal lamellar body(GO:0097209) |
| 0.2 | 3.5 | GO:0031045 | dense core granule(GO:0031045) |
| 0.1 | 0.9 | GO:0009331 | glycerol-3-phosphate dehydrogenase complex(GO:0009331) |
| 0.1 | 5.1 | GO:0030173 | integral component of Golgi membrane(GO:0030173) |
| 0.1 | 1.8 | GO:0032045 | guanyl-nucleotide exchange factor complex(GO:0032045) |
| 0.1 | 17.2 | GO:0031514 | motile cilium(GO:0031514) |
| 0.1 | 2.2 | GO:0001527 | microfibril(GO:0001527) fibril(GO:0043205) |
| 0.1 | 1.6 | GO:0000124 | SAGA complex(GO:0000124) |
| 0.1 | 2.2 | GO:0042589 | zymogen granule membrane(GO:0042589) |
| 0.1 | 0.9 | GO:0019907 | cyclin-dependent protein kinase activating kinase holoenzyme complex(GO:0019907) |
| 0.1 | 1.4 | GO:0031462 | Cul2-RING ubiquitin ligase complex(GO:0031462) |
| 0.1 | 3.9 | GO:0008305 | integrin complex(GO:0008305) |
| 0.1 | 2.1 | GO:0002080 | acrosomal membrane(GO:0002080) |
| 0.1 | 0.7 | GO:0072687 | meiotic spindle(GO:0072687) |
| 0.1 | 5.7 | GO:1904724 | tertiary granule lumen(GO:1904724) |
| 0.1 | 0.7 | GO:0042611 | MHC protein complex(GO:0042611) |
| 0.1 | 4.3 | GO:0097014 | axoneme(GO:0005930) ciliary plasm(GO:0097014) |
| 0.1 | 1.2 | GO:0042405 | nuclear inclusion body(GO:0042405) |
| 0.1 | 0.4 | GO:0005827 | polar microtubule(GO:0005827) |
| 0.1 | 0.4 | GO:0005742 | mitochondrial outer membrane translocase complex(GO:0005742) |
| 0.0 | 1.5 | GO:0035869 | ciliary transition zone(GO:0035869) |
| 0.0 | 7.8 | GO:0072562 | blood microparticle(GO:0072562) |
| 0.0 | 1.3 | GO:0070971 | endoplasmic reticulum exit site(GO:0070971) |
| 0.0 | 7.8 | GO:0031225 | anchored component of membrane(GO:0031225) |
| 0.0 | 0.9 | GO:0005832 | chaperonin-containing T-complex(GO:0005832) |
| 0.0 | 0.9 | GO:0034362 | low-density lipoprotein particle(GO:0034362) |
| 0.0 | 0.7 | GO:0043220 | Schmidt-Lanterman incisure(GO:0043220) |
| 0.0 | 1.5 | GO:0045095 | keratin filament(GO:0045095) |
| 0.0 | 5.6 | GO:0009897 | external side of plasma membrane(GO:0009897) |
| 0.0 | 2.0 | GO:0005891 | voltage-gated calcium channel complex(GO:0005891) |
| 0.0 | 1.0 | GO:0005796 | Golgi lumen(GO:0005796) |
| 0.0 | 40.8 | GO:0005615 | extracellular space(GO:0005615) |
| 0.0 | 2.6 | GO:0005758 | mitochondrial intermembrane space(GO:0005758) |
| 0.0 | 2.2 | GO:0005791 | rough endoplasmic reticulum(GO:0005791) |
| 0.0 | 2.4 | GO:0035579 | specific granule membrane(GO:0035579) |
| 0.0 | 4.2 | GO:0008021 | synaptic vesicle(GO:0008021) |
| 0.0 | 1.5 | GO:0101003 | ficolin-1-rich granule membrane(GO:0101003) |
| 0.0 | 1.1 | GO:0033017 | sarcoplasmic reticulum membrane(GO:0033017) |
| 0.0 | 1.3 | GO:0035578 | azurophil granule lumen(GO:0035578) |
| 0.0 | 0.5 | GO:0009925 | basal plasma membrane(GO:0009925) |
| 0.0 | 0.4 | GO:0030140 | trans-Golgi network transport vesicle(GO:0030140) |
| 0.0 | 1.2 | GO:0001750 | photoreceptor outer segment(GO:0001750) |
| 0.0 | 3.6 | GO:0016323 | basolateral plasma membrane(GO:0016323) |
| 0.0 | 0.9 | GO:0030315 | T-tubule(GO:0030315) |
Gene overrepresentation in molecular function category:
| Log-likelihood per target | Total log-likelihood | Term | Description |
|---|---|---|---|
| 2.5 | 7.5 | GO:0004618 | phosphoglycerate kinase activity(GO:0004618) |
| 1.7 | 5.1 | GO:0033188 | sphingomyelin synthase activity(GO:0033188) ceramide cholinephosphotransferase activity(GO:0047493) |
| 1.6 | 4.9 | GO:0004556 | alpha-amylase activity(GO:0004556) |
| 1.5 | 9.0 | GO:0003796 | lysozyme activity(GO:0003796) |
| 1.3 | 5.3 | GO:0061769 | ribosylnicotinamide kinase activity(GO:0050262) ribosylnicotinate kinase activity(GO:0061769) |
| 1.1 | 6.5 | GO:0034191 | apolipoprotein A-I receptor binding(GO:0034191) |
| 1.1 | 3.3 | GO:0052798 | beta-galactoside alpha-2,3-sialyltransferase activity(GO:0052798) |
| 0.9 | 8.7 | GO:0032027 | myosin light chain binding(GO:0032027) |
| 0.8 | 11.8 | GO:0032395 | MHC class II receptor activity(GO:0032395) |
| 0.8 | 3.3 | GO:0008798 | beta-aspartyl-peptidase activity(GO:0008798) |
| 0.8 | 8.7 | GO:0004128 | cytochrome-b5 reductase activity, acting on NAD(P)H(GO:0004128) |
| 0.8 | 3.9 | GO:0004800 | thyroxine 5'-deiodinase activity(GO:0004800) |
| 0.6 | 13.2 | GO:0004185 | serine-type carboxypeptidase activity(GO:0004185) |
| 0.6 | 13.0 | GO:0032036 | myosin heavy chain binding(GO:0032036) |
| 0.6 | 10.2 | GO:0031957 | very long-chain fatty acid-CoA ligase activity(GO:0031957) |
| 0.5 | 24.8 | GO:0030159 | receptor signaling complex scaffold activity(GO:0030159) |
| 0.5 | 1.5 | GO:0001861 | complement component C4b receptor activity(GO:0001861) complement component C3b receptor activity(GO:0004877) |
| 0.5 | 4.1 | GO:0004565 | beta-galactosidase activity(GO:0004565) |
| 0.4 | 2.0 | GO:0004447 | iodide peroxidase activity(GO:0004447) |
| 0.4 | 5.6 | GO:0008097 | 5S rRNA binding(GO:0008097) |
| 0.4 | 2.4 | GO:0005353 | fructose transmembrane transporter activity(GO:0005353) |
| 0.4 | 1.6 | GO:0030107 | HLA-A specific inhibitory MHC class I receptor activity(GO:0030107) |
| 0.4 | 1.9 | GO:0004140 | dephospho-CoA kinase activity(GO:0004140) |
| 0.4 | 86.4 | GO:0003823 | antigen binding(GO:0003823) |
| 0.4 | 2.2 | GO:0016416 | O-palmitoyltransferase activity(GO:0016416) |
| 0.4 | 1.4 | GO:0032406 | MutLbeta complex binding(GO:0032406) MutSbeta complex binding(GO:0032408) |
| 0.4 | 3.2 | GO:0000990 | transcription factor activity, core RNA polymerase binding(GO:0000990) |
| 0.4 | 3.2 | GO:0004969 | histamine receptor activity(GO:0004969) |
| 0.3 | 1.6 | GO:0035673 | oligopeptide transmembrane transporter activity(GO:0035673) |
| 0.3 | 3.9 | GO:0019957 | C-C chemokine binding(GO:0019957) |
| 0.2 | 1.5 | GO:0045029 | UDP-activated nucleotide receptor activity(GO:0045029) |
| 0.2 | 4.6 | GO:0032454 | histone demethylase activity (H3-K9 specific)(GO:0032454) |
| 0.2 | 0.7 | GO:0047787 | delta4-3-oxosteroid 5beta-reductase activity(GO:0047787) |
| 0.2 | 7.1 | GO:0004602 | glutathione peroxidase activity(GO:0004602) |
| 0.2 | 5.7 | GO:0070403 | NAD+ binding(GO:0070403) |
| 0.2 | 1.5 | GO:0004499 | N,N-dimethylaniline monooxygenase activity(GO:0004499) |
| 0.2 | 0.9 | GO:0052590 | sn-glycerol-3-phosphate:ubiquinone oxidoreductase activity(GO:0052590) sn-glycerol-3-phosphate:ubiquinone-8 oxidoreductase activity(GO:0052591) |
| 0.2 | 1.2 | GO:0016929 | SUMO-specific protease activity(GO:0016929) |
| 0.2 | 1.9 | GO:0031013 | troponin I binding(GO:0031013) |
| 0.2 | 12.5 | GO:0019843 | rRNA binding(GO:0019843) |
| 0.2 | 0.6 | GO:0036134 | thromboxane-A synthase activity(GO:0004796) 12-hydroxyheptadecatrienoic acid synthase activity(GO:0036134) |
| 0.2 | 1.8 | GO:0005549 | odorant binding(GO:0005549) |
| 0.2 | 0.7 | GO:0017159 | pantetheine hydrolase activity(GO:0017159) |
| 0.2 | 1.5 | GO:0005078 | MAP-kinase scaffold activity(GO:0005078) |
| 0.2 | 1.8 | GO:0031995 | insulin-like growth factor II binding(GO:0031995) |
| 0.1 | 0.6 | GO:0047391 | alkylglycerophosphoethanolamine phosphodiesterase activity(GO:0047391) |
| 0.1 | 1.4 | GO:0004321 | fatty-acyl-CoA synthase activity(GO:0004321) |
| 0.1 | 3.2 | GO:0035259 | glucocorticoid receptor binding(GO:0035259) |
| 0.1 | 0.4 | GO:0031208 | POZ domain binding(GO:0031208) |
| 0.1 | 1.1 | GO:0048495 | Roundabout binding(GO:0048495) |
| 0.1 | 2.0 | GO:0004115 | 3',5'-cyclic-AMP phosphodiesterase activity(GO:0004115) |
| 0.1 | 2.6 | GO:0008093 | cytoskeletal adaptor activity(GO:0008093) |
| 0.1 | 1.2 | GO:0030280 | structural constituent of epidermis(GO:0030280) |
| 0.1 | 2.5 | GO:0001968 | fibronectin binding(GO:0001968) |
| 0.1 | 3.5 | GO:0005184 | neuropeptide hormone activity(GO:0005184) |
| 0.1 | 4.5 | GO:0051539 | 4 iron, 4 sulfur cluster binding(GO:0051539) |
| 0.1 | 1.8 | GO:0019992 | diacylglycerol binding(GO:0019992) |
| 0.1 | 1.9 | GO:0017127 | cholesterol transporter activity(GO:0017127) |
| 0.1 | 3.3 | GO:0046966 | thyroid hormone receptor binding(GO:0046966) |
| 0.1 | 2.1 | GO:0030983 | mismatched DNA binding(GO:0030983) |
| 0.1 | 0.5 | GO:0019531 | oxalate transmembrane transporter activity(GO:0019531) |
| 0.1 | 1.7 | GO:0031489 | myosin V binding(GO:0031489) |
| 0.1 | 0.4 | GO:0055131 | C3HC4-type RING finger domain binding(GO:0055131) |
| 0.1 | 2.0 | GO:0008331 | high voltage-gated calcium channel activity(GO:0008331) |
| 0.1 | 7.7 | GO:0003725 | double-stranded RNA binding(GO:0003725) |
| 0.1 | 3.4 | GO:0005044 | scavenger receptor activity(GO:0005044) |
| 0.1 | 3.2 | GO:0030374 | ligand-dependent nuclear receptor transcription coactivator activity(GO:0030374) |
| 0.1 | 0.4 | GO:0010465 | nerve growth factor receptor activity(GO:0010465) |
| 0.1 | 3.2 | GO:0030552 | cAMP binding(GO:0030552) |
| 0.1 | 0.9 | GO:0031432 | titin binding(GO:0031432) |
| 0.1 | 5.5 | GO:0005179 | hormone activity(GO:0005179) |
| 0.1 | 5.6 | GO:0036459 | thiol-dependent ubiquitinyl hydrolase activity(GO:0036459) ubiquitinyl hydrolase activity(GO:0101005) |
| 0.0 | 1.4 | GO:0005328 | neurotransmitter:sodium symporter activity(GO:0005328) |
| 0.0 | 1.3 | GO:0004622 | lysophospholipase activity(GO:0004622) |
| 0.0 | 4.2 | GO:0004984 | olfactory receptor activity(GO:0004984) |
| 0.0 | 8.9 | GO:0004252 | serine-type endopeptidase activity(GO:0004252) |
| 0.0 | 2.9 | GO:0019003 | GDP binding(GO:0019003) |
| 0.0 | 0.7 | GO:0017049 | GTP-Rho binding(GO:0017049) |
| 0.0 | 1.1 | GO:0015269 | calcium-activated potassium channel activity(GO:0015269) |
| 0.0 | 0.5 | GO:0015467 | G-protein activated inward rectifier potassium channel activity(GO:0015467) |
| 0.0 | 4.5 | GO:0017137 | Rab GTPase binding(GO:0017137) |
| 0.0 | 0.6 | GO:0070182 | DNA polymerase binding(GO:0070182) |
| 0.0 | 1.5 | GO:0004520 | endodeoxyribonuclease activity(GO:0004520) |
| 0.0 | 2.5 | GO:0043130 | ubiquitin binding(GO:0043130) |
| 0.0 | 1.9 | GO:0005201 | extracellular matrix structural constituent(GO:0005201) |
| 0.0 | 0.8 | GO:0048487 | beta-tubulin binding(GO:0048487) |
| 0.0 | 0.4 | GO:0016875 | aminoacyl-tRNA ligase activity(GO:0004812) ligase activity, forming carbon-oxygen bonds(GO:0016875) ligase activity, forming aminoacyl-tRNA and related compounds(GO:0016876) |
| 0.0 | 1.6 | GO:0003730 | mRNA 3'-UTR binding(GO:0003730) |
| 0.0 | 2.4 | GO:0005178 | integrin binding(GO:0005178) |
| 0.0 | 0.8 | GO:0005164 | tumor necrosis factor receptor binding(GO:0005164) |
| 0.0 | 0.5 | GO:0008188 | neuropeptide receptor activity(GO:0008188) |
| 0.0 | 0.1 | GO:0030618 | transforming growth factor beta receptor, pathway-specific cytoplasmic mediator activity(GO:0030618) |
| 0.0 | 2.1 | GO:0051015 | actin filament binding(GO:0051015) |
Gene overrepresentation in curated gene sets: canonical pathways category:
| Log-likelihood per target | Total log-likelihood | Term | Description |
|---|---|---|---|
| 0.8 | 13.0 | PID THROMBIN PAR4 PATHWAY | PAR4-mediated thrombin signaling events |
| 0.2 | 1.2 | PID ECADHERIN KERATINOCYTE PATHWAY | E-cadherin signaling in keratinocytes |
| 0.1 | 5.7 | PID INTEGRIN CS PATHWAY | Integrin family cell surface interactions |
| 0.1 | 1.4 | ST TYPE I INTERFERON PATHWAY | Type I Interferon (alpha/beta IFN) Pathway |
| 0.1 | 2.2 | PID CONE PATHWAY | Visual signal transduction: Cones |
| 0.1 | 5.4 | PID HNF3B PATHWAY | FOXA2 and FOXA3 transcription factor networks |
| 0.0 | 2.4 | PID FANCONI PATHWAY | Fanconi anemia pathway |
| 0.0 | 4.3 | PID IL12 2PATHWAY | IL12-mediated signaling events |
| 0.0 | 4.2 | PID ERA GENOMIC PATHWAY | Validated nuclear estrogen receptor alpha network |
| 0.0 | 6.7 | PID CMYB PATHWAY | C-MYB transcription factor network |
| 0.0 | 9.2 | NABA ECM GLYCOPROTEINS | Genes encoding structural ECM glycoproteins |
| 0.0 | 1.6 | PID MYC PATHWAY | C-MYC pathway |
| 0.0 | 1.8 | PID RAS PATHWAY | Regulation of Ras family activation |
| 0.0 | 3.2 | PID MTOR 4PATHWAY | mTOR signaling pathway |
| 0.0 | 0.8 | PID IL2 STAT5 PATHWAY | IL2 signaling events mediated by STAT5 |
| 0.0 | 1.8 | PID MYC REPRESS PATHWAY | Validated targets of C-MYC transcriptional repression |
| 0.0 | 0.7 | PID INSULIN PATHWAY | Insulin Pathway |
| 0.0 | 0.5 | ST WNT CA2 CYCLIC GMP PATHWAY | Wnt/Ca2+/cyclic GMP signaling. |
| 0.0 | 0.5 | PID FCER1 PATHWAY | Fc-epsilon receptor I signaling in mast cells |
Gene overrepresentation in curated gene sets: REACTOME pathways category:
| Log-likelihood per target | Total log-likelihood | Term | Description |
|---|---|---|---|
| 0.6 | 3.9 | REACTOME BINDING AND ENTRY OF HIV VIRION | Genes involved in Binding and entry of HIV virion |
| 0.6 | 11.8 | REACTOME TRANSLOCATION OF ZAP 70 TO IMMUNOLOGICAL SYNAPSE | Genes involved in Translocation of ZAP-70 to Immunological synapse |
| 0.4 | 4.9 | REACTOME DIGESTION OF DIETARY CARBOHYDRATE | Genes involved in Digestion of dietary carbohydrate |
| 0.4 | 8.4 | REACTOME ABCA TRANSPORTERS IN LIPID HOMEOSTASIS | Genes involved in ABCA transporters in lipid homeostasis |
| 0.3 | 5.9 | REACTOME AMINE DERIVED HORMONES | Genes involved in Amine-derived hormones |
| 0.2 | 4.4 | REACTOME THE NLRP3 INFLAMMASOME | Genes involved in The NLRP3 inflammasome |
| 0.2 | 14.9 | REACTOME STRIATED MUSCLE CONTRACTION | Genes involved in Striated Muscle Contraction |
| 0.2 | 7.8 | REACTOME AMYLOIDS | Genes involved in Amyloids |
| 0.2 | 2.5 | REACTOME TRAFFICKING AND PROCESSING OF ENDOSOMAL TLR | Genes involved in Trafficking and processing of endosomal TLR |
| 0.2 | 12.5 | REACTOME FORMATION OF THE TERNARY COMPLEX AND SUBSEQUENTLY THE 43S COMPLEX | Genes involved in Formation of the ternary complex, and subsequently, the 43S complex |
| 0.1 | 3.2 | REACTOME ENDOSOMAL SORTING COMPLEX REQUIRED FOR TRANSPORT ESCRT | Genes involved in Endosomal Sorting Complex Required For Transport (ESCRT) |
| 0.1 | 3.3 | REACTOME PRE NOTCH PROCESSING IN GOLGI | Genes involved in Pre-NOTCH Processing in Golgi |
| 0.1 | 2.4 | REACTOME FACILITATIVE NA INDEPENDENT GLUCOSE TRANSPORTERS | Genes involved in Facilitative Na+-independent glucose transporters |
| 0.1 | 0.7 | REACTOME ENDOSOMAL VACUOLAR PATHWAY | Genes involved in Endosomal/Vacuolar pathway |
| 0.1 | 2.9 | REACTOME GLUTATHIONE CONJUGATION | Genes involved in Glutathione conjugation |
| 0.1 | 2.0 | REACTOME REGULATION OF COMPLEMENT CASCADE | Genes involved in Regulation of Complement cascade |
| 0.1 | 7.0 | REACTOME IMMUNOREGULATORY INTERACTIONS BETWEEN A LYMPHOID AND A NON LYMPHOID CELL | Genes involved in Immunoregulatory interactions between a Lymphoid and a non-Lymphoid cell |
| 0.1 | 3.2 | REACTOME RNA POL I TRANSCRIPTION INITIATION | Genes involved in RNA Polymerase I Transcription Initiation |
| 0.1 | 1.5 | REACTOME P2Y RECEPTORS | Genes involved in P2Y receptors |
| 0.1 | 1.4 | REACTOME BASE FREE SUGAR PHOSPHATE REMOVAL VIA THE SINGLE NUCLEOTIDE REPLACEMENT PATHWAY | Genes involved in Base-free sugar-phosphate removal via the single-nucleotide replacement pathway |
| 0.1 | 2.9 | REACTOME AMINE LIGAND BINDING RECEPTORS | Genes involved in Amine ligand-binding receptors |
| 0.1 | 4.5 | REACTOME METABOLISM OF VITAMINS AND COFACTORS | Genes involved in Metabolism of vitamins and cofactors |
| 0.1 | 5.5 | REACTOME OLFACTORY SIGNALING PATHWAY | Genes involved in Olfactory Signaling Pathway |
| 0.1 | 2.2 | REACTOME METABOLISM OF STEROID HORMONES AND VITAMINS A AND D | Genes involved in Metabolism of steroid hormones and vitamins A and D |
| 0.1 | 0.7 | REACTOME SYNTHESIS OF BILE ACIDS AND BILE SALTS VIA 24 HYDROXYCHOLESTEROL | Genes involved in Synthesis of bile acids and bile salts via 24-hydroxycholesterol |
| 0.1 | 2.9 | REACTOME MRNA 3 END PROCESSING | Genes involved in mRNA 3'-end processing |
| 0.1 | 1.3 | REACTOME REGULATION OF INSULIN LIKE GROWTH FACTOR IGF ACTIVITY BY INSULIN LIKE GROWTH FACTOR BINDING PROTEINS IGFBPS | Genes involved in Regulation of Insulin-like Growth Factor (IGF) Activity by Insulin-like Growth Factor Binding Proteins (IGFBPs) |
| 0.0 | 6.1 | REACTOME MHC CLASS II ANTIGEN PRESENTATION | Genes involved in MHC class II antigen presentation |
| 0.0 | 1.4 | REACTOME NA CL DEPENDENT NEUROTRANSMITTER TRANSPORTERS | Genes involved in Na+/Cl- dependent neurotransmitter transporters |
| 0.0 | 1.6 | REACTOME MEIOTIC RECOMBINATION | Genes involved in Meiotic Recombination |
| 0.0 | 0.6 | REACTOME NONSENSE MEDIATED DECAY ENHANCED BY THE EXON JUNCTION COMPLEX | Genes involved in Nonsense Mediated Decay Enhanced by the Exon Junction Complex |
| 0.0 | 0.7 | REACTOME INSULIN SYNTHESIS AND PROCESSING | Genes involved in Insulin Synthesis and Processing |
| 0.0 | 3.9 | REACTOME CELL SURFACE INTERACTIONS AT THE VASCULAR WALL | Genes involved in Cell surface interactions at the vascular wall |
| 0.0 | 3.2 | REACTOME NUCLEAR RECEPTOR TRANSCRIPTION PATHWAY | Genes involved in Nuclear Receptor transcription pathway |
| 0.0 | 0.8 | REACTOME POST CHAPERONIN TUBULIN FOLDING PATHWAY | Genes involved in Post-chaperonin tubulin folding pathway |
| 0.0 | 1.8 | REACTOME DOWNSTREAM SIGNALING EVENTS OF B CELL RECEPTOR BCR | Genes involved in Downstream Signaling Events Of B Cell Receptor (BCR) |
| 0.0 | 2.0 | REACTOME NCAM1 INTERACTIONS | Genes involved in NCAM1 interactions |
| 0.0 | 2.7 | REACTOME MITOTIC PROMETAPHASE | Genes involved in Mitotic Prometaphase |
| 0.0 | 0.4 | REACTOME MITOCHONDRIAL TRNA AMINOACYLATION | Genes involved in Mitochondrial tRNA aminoacylation |
| 0.0 | 1.0 | REACTOME RNA POL II TRANSCRIPTION PRE INITIATION AND PROMOTER OPENING | Genes involved in RNA Polymerase II Transcription Pre-Initiation And Promoter Opening |
| 0.0 | 3.9 | REACTOME ANTIGEN PROCESSING UBIQUITINATION PROTEASOME DEGRADATION | Genes involved in Antigen processing: Ubiquitination & Proteasome degradation |
| 0.0 | 0.5 | REACTOME INHIBITION OF VOLTAGE GATED CA2 CHANNELS VIA GBETA GAMMA SUBUNITS | Genes involved in Inhibition of voltage gated Ca2+ channels via Gbeta/gamma subunits |
| 0.0 | 2.0 | REACTOME G ALPHA S SIGNALLING EVENTS | Genes involved in G alpha (s) signalling events |
| 0.0 | 0.3 | REACTOME REGULATION OF IFNA SIGNALING | Genes involved in Regulation of IFNA signaling |