Project
GNF SymAtlas + NCI-60 cancer cell lines, human (Su, 2004; Ross, 2000)
Navigation
Downloads
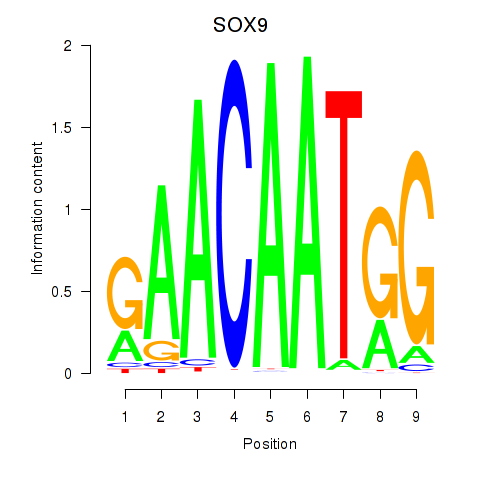
Results for SOX9
Z-value: 0.89
Motif logo
Transcription factors associated with SOX9
| Gene Symbol | Gene ID | Gene Info |
|---|---|---|
|
SOX9
|
ENSG00000125398.8 | SOX9 |
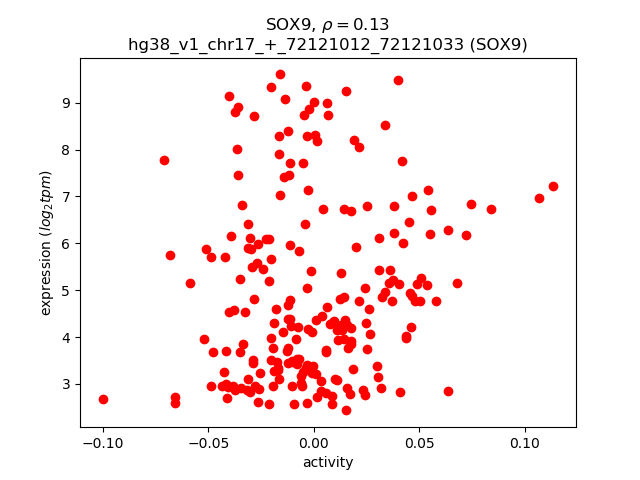
Activity-expression correlation:
| Gene | Promoter | Pearson corr. coef. | P-value | Plot |
|---|---|---|---|---|
| SOX9 | hg38_v1_chr17_+_72121012_72121033 | 0.13 | 4.7e-02 | Click! |
Activity profile of SOX9 motif
Sorted Z-values of SOX9 motif
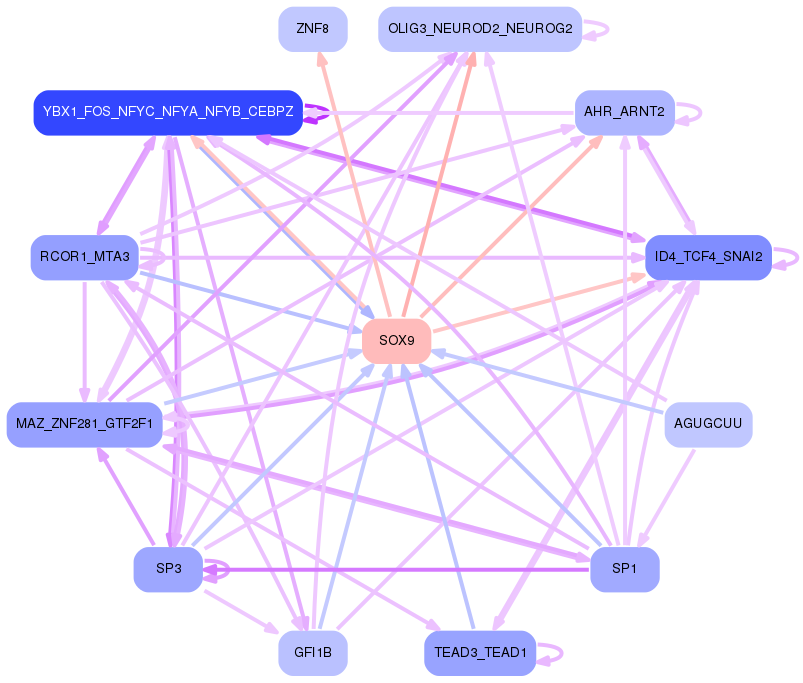
Network of associatons between targets according to the STRING database.

First level regulatory network of SOX9
Gene Ontology Analysis
Gene overrepresentation in biological process category:
| Log-likelihood per target | Total log-likelihood | Term | Description |
|---|---|---|---|
| 6.7 | 33.7 | GO:1904207 | regulation of chemokine (C-C motif) ligand 2 secretion(GO:1904207) positive regulation of chemokine (C-C motif) ligand 2 secretion(GO:1904209) |
| 5.0 | 29.7 | GO:0071874 | cellular response to norepinephrine stimulus(GO:0071874) |
| 4.4 | 13.1 | GO:1904529 | regulation of actin filament binding(GO:1904529) regulation of actin binding(GO:1904616) |
| 4.3 | 17.0 | GO:0006542 | glutamine biosynthetic process(GO:0006542) |
| 3.9 | 15.4 | GO:2000297 | negative regulation of synapse maturation(GO:2000297) |
| 3.8 | 15.4 | GO:0031161 | phosphatidylinositol catabolic process(GO:0031161) |
| 3.6 | 10.9 | GO:0008065 | establishment of blood-nerve barrier(GO:0008065) |
| 2.8 | 28.4 | GO:0036309 | protein localization to M-band(GO:0036309) protein localization to T-tubule(GO:0036371) |
| 2.4 | 23.6 | GO:0071787 | endoplasmic reticulum tubular network assembly(GO:0071787) |
| 2.1 | 6.2 | GO:0018395 | peptidyl-lysine hydroxylation to 5-hydroxy-L-lysine(GO:0018395) histone arginine demethylation(GO:0070077) histone H3-R2 demethylation(GO:0070078) histone H4-R3 demethylation(GO:0070079) |
| 1.9 | 7.7 | GO:0050861 | positive regulation of B cell receptor signaling pathway(GO:0050861) |
| 1.7 | 27.2 | GO:0070444 | oligodendrocyte progenitor proliferation(GO:0070444) regulation of oligodendrocyte progenitor proliferation(GO:0070445) |
| 1.6 | 4.9 | GO:1902595 | regulation of DNA replication origin binding(GO:1902595) |
| 1.6 | 17.1 | GO:0097116 | gephyrin clustering involved in postsynaptic density assembly(GO:0097116) |
| 1.5 | 21.5 | GO:0030050 | vesicle transport along actin filament(GO:0030050) |
| 1.3 | 3.8 | GO:0021718 | superior olivary nucleus development(GO:0021718) superior olivary nucleus maturation(GO:0021722) |
| 1.3 | 6.3 | GO:0045906 | negative regulation of vasoconstriction(GO:0045906) |
| 1.2 | 3.5 | GO:0006683 | galactosylceramide catabolic process(GO:0006683) |
| 1.1 | 3.4 | GO:0007037 | vacuolar phosphate transport(GO:0007037) positive regulation of mitotic cell cycle DNA replication(GO:1903465) positive regulation of parathyroid hormone secretion(GO:2000830) |
| 1.0 | 12.5 | GO:0070494 | regulation of thrombin receptor signaling pathway(GO:0070494) negative regulation of thrombin receptor signaling pathway(GO:0070495) |
| 1.0 | 3.0 | GO:0072709 | cellular response to sorbitol(GO:0072709) |
| 1.0 | 10.6 | GO:0034983 | peptidyl-lysine deacetylation(GO:0034983) |
| 0.9 | 1.9 | GO:0021778 | spinal cord oligodendrocyte cell differentiation(GO:0021529) spinal cord oligodendrocyte cell fate specification(GO:0021530) oligodendrocyte cell fate specification(GO:0021778) oligodendrocyte cell fate commitment(GO:0021779) glial cell fate specification(GO:0021780) |
| 0.9 | 3.7 | GO:1900147 | Schwann cell migration(GO:0036135) regulation of Schwann cell migration(GO:1900147) |
| 0.9 | 13.7 | GO:0070779 | D-aspartate transport(GO:0070777) D-aspartate import(GO:0070779) |
| 0.9 | 13.1 | GO:0047484 | regulation of response to osmotic stress(GO:0047484) |
| 0.9 | 1.7 | GO:1904049 | negative regulation of spontaneous neurotransmitter secretion(GO:1904049) |
| 0.9 | 2.6 | GO:0003358 | noradrenergic neuron development(GO:0003358) |
| 0.8 | 3.3 | GO:0072658 | maintenance of protein location in membrane(GO:0072658) maintenance of protein location in plasma membrane(GO:0072660) positive regulation of membrane depolarization during cardiac muscle cell action potential(GO:1900827) |
| 0.8 | 3.2 | GO:0036515 | serotonergic neuron axon guidance(GO:0036515) |
| 0.8 | 2.4 | GO:2000584 | regulation of platelet-derived growth factor receptor-alpha signaling pathway(GO:2000583) negative regulation of platelet-derived growth factor receptor-alpha signaling pathway(GO:2000584) |
| 0.7 | 2.8 | GO:1904381 | Golgi apparatus mannose trimming(GO:1904381) |
| 0.7 | 16.6 | GO:0070262 | peptidyl-serine dephosphorylation(GO:0070262) |
| 0.6 | 8.9 | GO:0070050 | neuron cellular homeostasis(GO:0070050) |
| 0.6 | 5.0 | GO:0007256 | activation of JNKK activity(GO:0007256) |
| 0.6 | 1.2 | GO:0055095 | lipoprotein particle mediated signaling(GO:0055095) low-density lipoprotein particle mediated signaling(GO:0055096) |
| 0.6 | 1.8 | GO:0021986 | epithalamus development(GO:0021538) habenula development(GO:0021986) |
| 0.6 | 1.8 | GO:0071676 | negative regulation of mononuclear cell migration(GO:0071676) |
| 0.6 | 1.8 | GO:1990108 | protein linear deubiquitination(GO:1990108) |
| 0.6 | 3.0 | GO:0036072 | intramembranous ossification(GO:0001957) direct ossification(GO:0036072) |
| 0.6 | 5.9 | GO:0061179 | negative regulation of insulin secretion involved in cellular response to glucose stimulus(GO:0061179) |
| 0.6 | 10.3 | GO:0036148 | phosphatidylglycerol acyl-chain remodeling(GO:0036148) |
| 0.5 | 15.3 | GO:0007141 | male meiosis I(GO:0007141) |
| 0.5 | 7.1 | GO:0033617 | mitochondrial respiratory chain complex IV assembly(GO:0033617) |
| 0.5 | 1.6 | GO:1900220 | semaphorin-plexin signaling pathway involved in bone trabecula morphogenesis(GO:1900220) |
| 0.5 | 1.6 | GO:0070256 | negative regulation of circadian sleep/wake cycle, non-REM sleep(GO:0042323) negative regulation of mucus secretion(GO:0070256) |
| 0.5 | 18.6 | GO:0048665 | neuron fate specification(GO:0048665) |
| 0.5 | 7.9 | GO:0090360 | platelet-derived growth factor production(GO:0090360) regulation of platelet-derived growth factor production(GO:0090361) |
| 0.5 | 2.5 | GO:0030950 | establishment or maintenance of actin cytoskeleton polarity(GO:0030950) |
| 0.5 | 2.0 | GO:0090403 | oxidative stress-induced premature senescence(GO:0090403) |
| 0.5 | 11.1 | GO:0006895 | Golgi to endosome transport(GO:0006895) |
| 0.5 | 9.3 | GO:0021681 | cerebellar granular layer development(GO:0021681) |
| 0.4 | 1.7 | GO:0030035 | microspike assembly(GO:0030035) |
| 0.4 | 0.9 | GO:0070662 | mast cell proliferation(GO:0070662) |
| 0.4 | 6.8 | GO:0010839 | negative regulation of keratinocyte proliferation(GO:0010839) |
| 0.4 | 2.9 | GO:2000483 | negative regulation of interleukin-8 secretion(GO:2000483) |
| 0.4 | 1.2 | GO:0042819 | pyridoxine metabolic process(GO:0008614) pyridoxine biosynthetic process(GO:0008615) vitamin B6 biosynthetic process(GO:0042819) |
| 0.4 | 3.4 | GO:1903142 | positive regulation of endothelial cell development(GO:1901552) positive regulation of establishment of endothelial barrier(GO:1903142) |
| 0.4 | 2.2 | GO:0045629 | negative regulation of T-helper 2 cell differentiation(GO:0045629) |
| 0.4 | 7.2 | GO:1904776 | regulation of protein localization to cell cortex(GO:1904776) positive regulation of protein localization to cell cortex(GO:1904778) |
| 0.4 | 1.1 | GO:1990654 | regulation of extrathymic T cell differentiation(GO:0033082) sebum secreting cell proliferation(GO:1990654) |
| 0.3 | 3.4 | GO:0080182 | histone H3-K4 trimethylation(GO:0080182) |
| 0.3 | 4.7 | GO:0071372 | cellular response to follicle-stimulating hormone stimulus(GO:0071372) |
| 0.3 | 3.6 | GO:1900227 | positive regulation of NLRP3 inflammasome complex assembly(GO:1900227) |
| 0.3 | 3.3 | GO:0032286 | central nervous system myelin maintenance(GO:0032286) |
| 0.3 | 1.0 | GO:0019287 | isopentenyl diphosphate biosynthetic process, mevalonate pathway(GO:0019287) |
| 0.3 | 1.9 | GO:0070945 | neutrophil mediated killing of gram-negative bacterium(GO:0070945) |
| 0.3 | 4.7 | GO:1904152 | regulation of retrograde protein transport, ER to cytosol(GO:1904152) |
| 0.3 | 0.9 | GO:1900365 | positive regulation of mRNA polyadenylation(GO:1900365) |
| 0.3 | 1.8 | GO:0007296 | vitellogenesis(GO:0007296) |
| 0.3 | 2.9 | GO:0021902 | commitment of neuronal cell to specific neuron type in forebrain(GO:0021902) |
| 0.3 | 1.1 | GO:0006288 | base-excision repair, DNA ligation(GO:0006288) |
| 0.3 | 3.1 | GO:0035721 | intraciliary retrograde transport(GO:0035721) |
| 0.3 | 2.4 | GO:0061343 | cell adhesion involved in heart morphogenesis(GO:0061343) |
| 0.3 | 7.0 | GO:0051901 | positive regulation of mitochondrial depolarization(GO:0051901) |
| 0.3 | 7.4 | GO:0045332 | lipid translocation(GO:0034204) phospholipid translocation(GO:0045332) |
| 0.3 | 1.3 | GO:1903936 | cellular response to sodium arsenite(GO:1903936) |
| 0.2 | 2.0 | GO:0001714 | endodermal cell fate specification(GO:0001714) |
| 0.2 | 1.8 | GO:0048014 | Tie signaling pathway(GO:0048014) |
| 0.2 | 1.1 | GO:0051935 | amino acid neurotransmitter reuptake(GO:0051933) glutamate reuptake(GO:0051935) |
| 0.2 | 0.7 | GO:0021830 | interneuron migration from the subpallium to the cortex(GO:0021830) cerebral cortex GABAergic interneuron migration(GO:0021853) interneuron migration(GO:1904936) |
| 0.2 | 2.0 | GO:0018344 | protein geranylgeranylation(GO:0018344) |
| 0.2 | 5.6 | GO:0051764 | actin crosslink formation(GO:0051764) |
| 0.2 | 9.9 | GO:0070884 | regulation of calcineurin-NFAT signaling cascade(GO:0070884) |
| 0.2 | 2.1 | GO:0045721 | negative regulation of gluconeogenesis(GO:0045721) |
| 0.2 | 6.8 | GO:0045187 | regulation of circadian sleep/wake cycle, sleep(GO:0045187) |
| 0.2 | 5.2 | GO:0045725 | positive regulation of glycogen biosynthetic process(GO:0045725) |
| 0.2 | 1.4 | GO:0006003 | fructose 2,6-bisphosphate metabolic process(GO:0006003) |
| 0.2 | 8.2 | GO:0008038 | neuron recognition(GO:0008038) |
| 0.2 | 0.8 | GO:2000672 | negative regulation of motor neuron apoptotic process(GO:2000672) |
| 0.2 | 6.0 | GO:0097503 | sialylation(GO:0097503) |
| 0.2 | 1.5 | GO:0061370 | testosterone biosynthetic process(GO:0061370) |
| 0.2 | 0.5 | GO:0003257 | positive regulation of transcription from RNA polymerase II promoter involved in myocardial precursor cell differentiation(GO:0003257) positive regulation of transcription via serum response element binding(GO:0010735) positive regulation of transcription from RNA polymerase II promoter involved in heart development(GO:1901228) |
| 0.2 | 2.3 | GO:0008585 | female gonad development(GO:0008585) |
| 0.2 | 1.6 | GO:0045054 | constitutive secretory pathway(GO:0045054) |
| 0.2 | 1.4 | GO:0046836 | glycolipid transport(GO:0046836) |
| 0.2 | 0.7 | GO:0050904 | diapedesis(GO:0050904) glomerular endothelium development(GO:0072011) |
| 0.2 | 1.8 | GO:1900112 | regulation of histone H3-K9 trimethylation(GO:1900112) |
| 0.2 | 1.1 | GO:0098828 | positive regulation of inhibitory postsynaptic potential(GO:0097151) modulation of inhibitory postsynaptic potential(GO:0098828) |
| 0.2 | 0.5 | GO:0097272 | ammonia homeostasis(GO:0097272) |
| 0.2 | 2.3 | GO:0070544 | histone H3-K36 demethylation(GO:0070544) |
| 0.2 | 2.8 | GO:0043162 | ubiquitin-dependent protein catabolic process via the multivesicular body sorting pathway(GO:0043162) |
| 0.2 | 2.6 | GO:0003322 | pancreatic A cell development(GO:0003322) |
| 0.2 | 3.5 | GO:0030575 | nuclear body organization(GO:0030575) |
| 0.1 | 2.1 | GO:0007130 | synaptonemal complex assembly(GO:0007130) |
| 0.1 | 1.2 | GO:0061368 | behavioral response to chemical pain(GO:0061366) behavioral response to formalin induced pain(GO:0061368) |
| 0.1 | 5.2 | GO:0010738 | regulation of protein kinase A signaling(GO:0010738) |
| 0.1 | 1.2 | GO:0035694 | mitochondrial protein catabolic process(GO:0035694) |
| 0.1 | 4.0 | GO:0016048 | detection of temperature stimulus(GO:0016048) |
| 0.1 | 4.2 | GO:0014850 | response to muscle activity(GO:0014850) |
| 0.1 | 2.6 | GO:0071526 | semaphorin-plexin signaling pathway(GO:0071526) |
| 0.1 | 3.1 | GO:0061577 | calcium ion transmembrane transport via high voltage-gated calcium channel(GO:0061577) |
| 0.1 | 1.9 | GO:0014051 | gamma-aminobutyric acid secretion(GO:0014051) |
| 0.1 | 3.8 | GO:0036295 | cellular response to increased oxygen levels(GO:0036295) |
| 0.1 | 0.4 | GO:2000417 | negative regulation of eosinophil migration(GO:2000417) |
| 0.1 | 1.6 | GO:0048505 | regulation of development, heterochronic(GO:0040034) regulation of timing of cell differentiation(GO:0048505) |
| 0.1 | 0.9 | GO:0001675 | acrosome assembly(GO:0001675) |
| 0.1 | 3.6 | GO:0032012 | regulation of ARF protein signal transduction(GO:0032012) |
| 0.1 | 5.4 | GO:0008089 | anterograde axonal transport(GO:0008089) |
| 0.1 | 1.1 | GO:0014894 | response to muscle inactivity involved in regulation of muscle adaptation(GO:0014877) response to denervation involved in regulation of muscle adaptation(GO:0014894) |
| 0.1 | 1.0 | GO:1901841 | regulation of high voltage-gated calcium channel activity(GO:1901841) |
| 0.1 | 11.1 | GO:0030516 | regulation of axon extension(GO:0030516) |
| 0.1 | 0.6 | GO:0097498 | endothelial tube lumen extension(GO:0097498) |
| 0.1 | 3.1 | GO:0034453 | microtubule anchoring(GO:0034453) |
| 0.1 | 19.0 | GO:0007156 | homophilic cell adhesion via plasma membrane adhesion molecules(GO:0007156) |
| 0.1 | 3.2 | GO:0006825 | copper ion transport(GO:0006825) |
| 0.1 | 5.8 | GO:0030866 | cortical actin cytoskeleton organization(GO:0030866) |
| 0.1 | 0.3 | GO:0018076 | N-terminal peptidyl-lysine acetylation(GO:0018076) |
| 0.1 | 0.6 | GO:0002024 | diet induced thermogenesis(GO:0002024) |
| 0.1 | 1.8 | GO:0008340 | determination of adult lifespan(GO:0008340) |
| 0.1 | 0.7 | GO:0061669 | spontaneous neurotransmitter secretion(GO:0061669) spontaneous synaptic transmission(GO:0098814) |
| 0.1 | 1.1 | GO:0016576 | histone dephosphorylation(GO:0016576) |
| 0.1 | 2.2 | GO:0005513 | detection of calcium ion(GO:0005513) |
| 0.1 | 0.3 | GO:0090050 | positive regulation of cell migration involved in sprouting angiogenesis(GO:0090050) |
| 0.1 | 1.1 | GO:0002315 | marginal zone B cell differentiation(GO:0002315) |
| 0.1 | 1.9 | GO:0001829 | trophectodermal cell differentiation(GO:0001829) |
| 0.1 | 1.8 | GO:0015671 | oxygen transport(GO:0015671) |
| 0.1 | 0.8 | GO:0006682 | galactosylceramide biosynthetic process(GO:0006682) galactolipid biosynthetic process(GO:0019375) |
| 0.1 | 0.7 | GO:0070235 | regulation of activation-induced cell death of T cells(GO:0070235) negative regulation of activation-induced cell death of T cells(GO:0070236) |
| 0.1 | 5.6 | GO:0061178 | regulation of insulin secretion involved in cellular response to glucose stimulus(GO:0061178) |
| 0.1 | 1.1 | GO:1903358 | regulation of Golgi organization(GO:1903358) |
| 0.1 | 1.3 | GO:0030150 | protein import into mitochondrial matrix(GO:0030150) |
| 0.1 | 1.8 | GO:0030889 | negative regulation of B cell proliferation(GO:0030889) |
| 0.1 | 2.5 | GO:0042036 | negative regulation of cytokine biosynthetic process(GO:0042036) |
| 0.1 | 0.3 | GO:0086046 | membrane depolarization during SA node cell action potential(GO:0086046) |
| 0.1 | 2.1 | GO:0030033 | microvillus assembly(GO:0030033) |
| 0.1 | 4.0 | GO:0006904 | vesicle docking involved in exocytosis(GO:0006904) |
| 0.1 | 0.6 | GO:0009597 | detection of virus(GO:0009597) |
| 0.1 | 1.1 | GO:0030208 | dermatan sulfate biosynthetic process(GO:0030208) |
| 0.1 | 3.2 | GO:0035115 | embryonic forelimb morphogenesis(GO:0035115) |
| 0.1 | 1.4 | GO:0035855 | megakaryocyte development(GO:0035855) |
| 0.1 | 2.4 | GO:0060325 | face morphogenesis(GO:0060325) |
| 0.1 | 0.2 | GO:0033385 | geranylgeranyl diphosphate metabolic process(GO:0033385) geranylgeranyl diphosphate biosynthetic process(GO:0033386) |
| 0.1 | 5.5 | GO:0006687 | glycosphingolipid metabolic process(GO:0006687) |
| 0.1 | 0.3 | GO:0060686 | negative regulation of prostatic bud formation(GO:0060686) |
| 0.1 | 0.5 | GO:0071799 | response to prostaglandin D(GO:0071798) cellular response to prostaglandin D stimulus(GO:0071799) |
| 0.1 | 0.8 | GO:0031065 | positive regulation of histone deacetylation(GO:0031065) |
| 0.1 | 0.2 | GO:0051710 | regulation of cytolysis in other organism(GO:0051710) |
| 0.1 | 1.4 | GO:0050901 | leukocyte tethering or rolling(GO:0050901) |
| 0.1 | 1.8 | GO:0043928 | exonucleolytic nuclear-transcribed mRNA catabolic process involved in deadenylation-dependent decay(GO:0043928) |
| 0.1 | 3.8 | GO:0010923 | negative regulation of phosphatase activity(GO:0010923) |
| 0.1 | 8.2 | GO:0006805 | xenobiotic metabolic process(GO:0006805) |
| 0.1 | 0.1 | GO:2000543 | positive regulation of gastrulation(GO:2000543) |
| 0.1 | 0.3 | GO:0006546 | glycine catabolic process(GO:0006546) glycine decarboxylation via glycine cleavage system(GO:0019464) |
| 0.1 | 1.4 | GO:0014047 | glutamate secretion(GO:0014047) |
| 0.1 | 0.9 | GO:0051412 | response to corticosterone(GO:0051412) |
| 0.0 | 3.0 | GO:0006120 | mitochondrial electron transport, NADH to ubiquinone(GO:0006120) |
| 0.0 | 3.9 | GO:0006977 | DNA damage response, signal transduction by p53 class mediator resulting in cell cycle arrest(GO:0006977) |
| 0.0 | 0.6 | GO:0097152 | mesenchymal cell apoptotic process(GO:0097152) regulation of mesenchymal cell apoptotic process(GO:2001053) negative regulation of mesenchymal cell apoptotic process(GO:2001054) |
| 0.0 | 0.3 | GO:0042791 | 5S class rRNA transcription from RNA polymerase III type 1 promoter(GO:0042791) tRNA transcription from RNA polymerase III promoter(GO:0042797) |
| 0.0 | 1.6 | GO:1902475 | L-alpha-amino acid transmembrane transport(GO:1902475) |
| 0.0 | 0.5 | GO:0032688 | negative regulation of interferon-beta production(GO:0032688) |
| 0.0 | 3.0 | GO:0045921 | positive regulation of exocytosis(GO:0045921) |
| 0.0 | 2.0 | GO:0001755 | neural crest cell migration(GO:0001755) |
| 0.0 | 2.7 | GO:0006027 | glycosaminoglycan catabolic process(GO:0006027) |
| 0.0 | 0.8 | GO:0003351 | epithelial cilium movement(GO:0003351) |
| 0.0 | 0.4 | GO:0034465 | response to carbon monoxide(GO:0034465) |
| 0.0 | 0.7 | GO:0006048 | UDP-N-acetylglucosamine biosynthetic process(GO:0006048) |
| 0.0 | 0.8 | GO:1900116 | extracellular regulation of signal transduction(GO:1900115) extracellular negative regulation of signal transduction(GO:1900116) |
| 0.0 | 0.9 | GO:0007095 | mitotic G2 DNA damage checkpoint(GO:0007095) |
| 0.0 | 1.4 | GO:0010165 | response to X-ray(GO:0010165) |
| 0.0 | 0.2 | GO:0017196 | N-terminal peptidyl-methionine acetylation(GO:0017196) |
| 0.0 | 1.9 | GO:0006383 | transcription from RNA polymerase III promoter(GO:0006383) |
| 0.0 | 1.3 | GO:0007271 | synaptic transmission, cholinergic(GO:0007271) |
| 0.0 | 0.6 | GO:0016226 | iron-sulfur cluster assembly(GO:0016226) metallo-sulfur cluster assembly(GO:0031163) |
| 0.0 | 1.1 | GO:0010644 | cell communication by electrical coupling(GO:0010644) |
| 0.0 | 0.8 | GO:0060612 | adipose tissue development(GO:0060612) |
| 0.0 | 2.6 | GO:0030705 | cytoskeleton-dependent intracellular transport(GO:0030705) |
| 0.0 | 1.8 | GO:0019886 | antigen processing and presentation of exogenous peptide antigen via MHC class II(GO:0019886) |
| 0.0 | 2.2 | GO:0007018 | microtubule-based movement(GO:0007018) |
| 0.0 | 3.5 | GO:0000075 | cell cycle checkpoint(GO:0000075) |
| 0.0 | 1.1 | GO:0046785 | microtubule polymerization(GO:0046785) |
| 0.0 | 2.8 | GO:0006958 | complement activation, classical pathway(GO:0006958) |
| 0.0 | 3.6 | GO:0043523 | regulation of neuron apoptotic process(GO:0043523) |
| 0.0 | 0.4 | GO:0030220 | platelet formation(GO:0030220) |
| 0.0 | 0.0 | GO:0014067 | negative regulation of phosphatidylinositol 3-kinase signaling(GO:0014067) |
| 0.0 | 4.5 | GO:0018105 | peptidyl-serine phosphorylation(GO:0018105) |
| 0.0 | 4.6 | GO:0048511 | rhythmic process(GO:0048511) |
| 0.0 | 0.2 | GO:0035970 | peptidyl-threonine dephosphorylation(GO:0035970) |
| 0.0 | 0.1 | GO:0006651 | diacylglycerol biosynthetic process(GO:0006651) |
| 0.0 | 2.2 | GO:0030509 | BMP signaling pathway(GO:0030509) |
| 0.0 | 0.4 | GO:0016338 | calcium-independent cell-cell adhesion via plasma membrane cell-adhesion molecules(GO:0016338) |
| 0.0 | 0.5 | GO:0007205 | protein kinase C-activating G-protein coupled receptor signaling pathway(GO:0007205) |
| 0.0 | 0.4 | GO:0000305 | response to oxygen radical(GO:0000305) |
| 0.0 | 1.6 | GO:0015992 | proton transport(GO:0015992) |
| 0.0 | 1.1 | GO:1903955 | positive regulation of protein targeting to mitochondrion(GO:1903955) |
| 0.0 | 0.3 | GO:0016242 | negative regulation of macroautophagy(GO:0016242) |
Gene overrepresentation in cellular component category:
| Log-likelihood per target | Total log-likelihood | Term | Description |
|---|---|---|---|
| 5.6 | 33.7 | GO:0033269 | internode region of axon(GO:0033269) |
| 4.5 | 22.5 | GO:0072534 | perineuronal net(GO:0072534) |
| 1.7 | 1.7 | GO:0044393 | microspike(GO:0044393) |
| 1.3 | 5.2 | GO:0005899 | insulin receptor complex(GO:0005899) |
| 1.3 | 10.2 | GO:0000138 | Golgi trans cisterna(GO:0000138) |
| 1.0 | 6.3 | GO:0000137 | Golgi cis cisterna(GO:0000137) |
| 0.9 | 23.6 | GO:0071782 | endoplasmic reticulum tubular network(GO:0071782) |
| 0.8 | 2.3 | GO:0034991 | nuclear meiotic cohesin complex(GO:0034991) |
| 0.8 | 3.8 | GO:0016533 | cyclin-dependent protein kinase 5 holoenzyme complex(GO:0016533) |
| 0.6 | 17.4 | GO:0097386 | glial cell projection(GO:0097386) |
| 0.5 | 2.1 | GO:0030893 | meiotic cohesin complex(GO:0030893) |
| 0.5 | 7.7 | GO:0097433 | dense body(GO:0097433) |
| 0.5 | 2.0 | GO:0005968 | Rab-protein geranylgeranyltransferase complex(GO:0005968) |
| 0.5 | 2.9 | GO:0001940 | male pronucleus(GO:0001940) |
| 0.5 | 9.1 | GO:0014731 | spectrin-associated cytoskeleton(GO:0014731) |
| 0.4 | 3.1 | GO:0030991 | intraciliary transport particle A(GO:0030991) |
| 0.4 | 26.2 | GO:0031430 | M band(GO:0031430) |
| 0.4 | 3.7 | GO:0044294 | dendritic growth cone(GO:0044294) |
| 0.4 | 0.8 | GO:0001939 | female pronucleus(GO:0001939) |
| 0.4 | 2.3 | GO:0005594 | collagen type IX trimer(GO:0005594) |
| 0.4 | 4.7 | GO:0097427 | microtubule bundle(GO:0097427) |
| 0.4 | 15.3 | GO:0030673 | axolemma(GO:0030673) |
| 0.4 | 1.1 | GO:0005745 | m-AAA complex(GO:0005745) |
| 0.4 | 2.5 | GO:0097165 | nuclear stress granule(GO:0097165) |
| 0.3 | 1.7 | GO:1990761 | growth cone lamellipodium(GO:1990761) |
| 0.3 | 2.8 | GO:0000813 | ESCRT I complex(GO:0000813) |
| 0.3 | 2.0 | GO:0033391 | chromatoid body(GO:0033391) |
| 0.3 | 10.9 | GO:0000159 | protein phosphatase type 2A complex(GO:0000159) |
| 0.3 | 0.8 | GO:0097058 | CRLF-CLCF1 complex(GO:0097058) |
| 0.2 | 4.9 | GO:0016342 | catenin complex(GO:0016342) |
| 0.2 | 2.9 | GO:0031618 | nuclear pericentric heterochromatin(GO:0031618) |
| 0.2 | 44.0 | GO:0055037 | recycling endosome(GO:0055037) |
| 0.2 | 3.7 | GO:0044295 | axonal growth cone(GO:0044295) |
| 0.2 | 28.4 | GO:0005604 | basement membrane(GO:0005604) |
| 0.2 | 3.3 | GO:0033177 | proton-transporting two-sector ATPase complex, proton-transporting domain(GO:0033177) proton-transporting V-type ATPase, V0 domain(GO:0033179) |
| 0.2 | 0.2 | GO:0042612 | MHC class I protein complex(GO:0042612) |
| 0.2 | 3.8 | GO:0005640 | nuclear outer membrane(GO:0005640) |
| 0.2 | 2.9 | GO:0031045 | dense core granule(GO:0031045) |
| 0.2 | 18.7 | GO:0042734 | presynaptic membrane(GO:0042734) |
| 0.2 | 9.9 | GO:0031594 | neuromuscular junction(GO:0031594) |
| 0.2 | 4.7 | GO:0071437 | invadopodium(GO:0071437) |
| 0.2 | 3.1 | GO:1990454 | L-type voltage-gated calcium channel complex(GO:1990454) |
| 0.1 | 1.6 | GO:0002116 | semaphorin receptor complex(GO:0002116) |
| 0.1 | 1.7 | GO:0031464 | Cul4A-RING E3 ubiquitin ligase complex(GO:0031464) |
| 0.1 | 13.9 | GO:0030864 | cortical actin cytoskeleton(GO:0030864) |
| 0.1 | 2.1 | GO:0043073 | germ cell nucleus(GO:0043073) |
| 0.1 | 0.6 | GO:0005879 | axonemal microtubule(GO:0005879) |
| 0.1 | 19.9 | GO:0030426 | growth cone(GO:0030426) |
| 0.1 | 1.7 | GO:0005744 | mitochondrial inner membrane presequence translocase complex(GO:0005744) |
| 0.1 | 1.8 | GO:0005833 | hemoglobin complex(GO:0005833) |
| 0.1 | 2.5 | GO:0035371 | microtubule plus-end(GO:0035371) |
| 0.1 | 2.4 | GO:0097440 | apical dendrite(GO:0097440) |
| 0.1 | 16.0 | GO:0008021 | synaptic vesicle(GO:0008021) |
| 0.1 | 41.8 | GO:0005874 | microtubule(GO:0005874) |
| 0.1 | 0.6 | GO:0031616 | spindle pole centrosome(GO:0031616) |
| 0.1 | 1.4 | GO:0035102 | PRC1 complex(GO:0035102) |
| 0.1 | 1.0 | GO:0030015 | CCR4-NOT core complex(GO:0030015) |
| 0.1 | 7.5 | GO:0001750 | photoreceptor outer segment(GO:0001750) |
| 0.1 | 2.6 | GO:0009925 | basal plasma membrane(GO:0009925) |
| 0.1 | 0.6 | GO:0072487 | MSL complex(GO:0072487) |
| 0.1 | 2.8 | GO:0030173 | integral component of Golgi membrane(GO:0030173) |
| 0.1 | 1.4 | GO:0048786 | presynaptic active zone(GO:0048786) |
| 0.1 | 1.3 | GO:0005922 | connexon complex(GO:0005922) |
| 0.1 | 0.8 | GO:0097486 | multivesicular body lumen(GO:0097486) |
| 0.1 | 0.4 | GO:0033553 | rDNA heterochromatin(GO:0033553) |
| 0.1 | 1.4 | GO:0099738 | cell cortex region(GO:0099738) |
| 0.1 | 0.6 | GO:0033180 | proton-transporting V-type ATPase, V1 domain(GO:0033180) |
| 0.1 | 0.3 | GO:0005960 | glycine cleavage complex(GO:0005960) |
| 0.1 | 10.8 | GO:0005777 | peroxisome(GO:0005777) microbody(GO:0042579) |
| 0.1 | 0.9 | GO:0032281 | AMPA glutamate receptor complex(GO:0032281) |
| 0.1 | 3.0 | GO:0005747 | mitochondrial respiratory chain complex I(GO:0005747) NADH dehydrogenase complex(GO:0030964) respiratory chain complex I(GO:0045271) |
| 0.0 | 1.2 | GO:0032839 | dendrite cytoplasm(GO:0032839) |
| 0.0 | 0.5 | GO:0032433 | filopodium tip(GO:0032433) |
| 0.0 | 9.5 | GO:0005819 | spindle(GO:0005819) |
| 0.0 | 0.3 | GO:0000127 | transcription factor TFIIIC complex(GO:0000127) |
| 0.0 | 2.4 | GO:0005581 | collagen trimer(GO:0005581) |
| 0.0 | 2.8 | GO:0032588 | trans-Golgi network membrane(GO:0032588) |
| 0.0 | 0.5 | GO:0033256 | I-kappaB/NF-kappaB complex(GO:0033256) |
| 0.0 | 6.9 | GO:0043209 | myelin sheath(GO:0043209) |
| 0.0 | 2.9 | GO:0036064 | ciliary basal body(GO:0036064) |
| 0.0 | 5.4 | GO:0043202 | lysosomal lumen(GO:0043202) |
| 0.0 | 0.4 | GO:0016602 | CCAAT-binding factor complex(GO:0016602) |
| 0.0 | 2.8 | GO:0031093 | platelet alpha granule lumen(GO:0031093) |
| 0.0 | 0.2 | GO:0031414 | N-terminal protein acetyltransferase complex(GO:0031414) |
| 0.0 | 5.5 | GO:0005578 | proteinaceous extracellular matrix(GO:0005578) |
| 0.0 | 0.4 | GO:0031235 | intrinsic component of the cytoplasmic side of the plasma membrane(GO:0031235) |
| 0.0 | 5.2 | GO:0045211 | postsynaptic membrane(GO:0045211) |
| 0.0 | 1.8 | GO:0035578 | azurophil granule lumen(GO:0035578) |
| 0.0 | 0.4 | GO:0016327 | apicolateral plasma membrane(GO:0016327) |
| 0.0 | 4.3 | GO:0016323 | basolateral plasma membrane(GO:0016323) |
| 0.0 | 2.0 | GO:0034705 | voltage-gated potassium channel complex(GO:0008076) potassium channel complex(GO:0034705) |
| 0.0 | 0.9 | GO:0045171 | intercellular bridge(GO:0045171) |
| 0.0 | 1.2 | GO:0005901 | caveola(GO:0005901) |
| 0.0 | 0.3 | GO:0090665 | dystrophin-associated glycoprotein complex(GO:0016010) glycoprotein complex(GO:0090665) |
| 0.0 | 1.4 | GO:0032580 | Golgi cisterna membrane(GO:0032580) |
| 0.0 | 0.1 | GO:0031209 | SCAR complex(GO:0031209) |
| 0.0 | 0.3 | GO:0005686 | U2 snRNP(GO:0005686) |
Gene overrepresentation in molecular function category:
| Log-likelihood per target | Total log-likelihood | Term | Description |
|---|---|---|---|
| 9.9 | 29.7 | GO:0031696 | alpha-2C adrenergic receptor binding(GO:0031696) |
| 4.8 | 57.6 | GO:0019911 | structural constituent of myelin sheath(GO:0019911) |
| 4.3 | 17.0 | GO:0004356 | glutamate-ammonia ligase activity(GO:0004356) ammonia ligase activity(GO:0016211) acid-ammonia (or amide) ligase activity(GO:0016880) |
| 3.2 | 9.5 | GO:0004157 | dihydropyrimidinase activity(GO:0004157) |
| 2.6 | 10.3 | GO:0047192 | 1-alkylglycerophosphocholine O-acetyltransferase activity(GO:0047192) |
| 2.1 | 6.2 | GO:0033746 | histone demethylase activity (H3-R2 specific)(GO:0033746) histone demethylase activity (H4-R3 specific)(GO:0033749) |
| 2.1 | 10.3 | GO:0001025 | RNA polymerase III transcription factor binding(GO:0001025) |
| 1.9 | 7.7 | GO:0004698 | calcium-dependent protein kinase C activity(GO:0004698) |
| 1.9 | 15.4 | GO:0008934 | inositol monophosphate 1-phosphatase activity(GO:0008934) inositol monophosphate 3-phosphatase activity(GO:0052832) inositol monophosphate 4-phosphatase activity(GO:0052833) inositol monophosphate phosphatase activity(GO:0052834) |
| 1.6 | 4.7 | GO:0004421 | hydroxymethylglutaryl-CoA synthase activity(GO:0004421) |
| 1.5 | 5.9 | GO:0004420 | hydroxymethylglutaryl-CoA reductase (NADPH) activity(GO:0004420) hydroxymethylglutaryl-CoA reductase activity(GO:0042282) |
| 1.3 | 3.8 | GO:0016534 | cyclin-dependent protein kinase 5 activator activity(GO:0016534) |
| 1.2 | 5.0 | GO:0004706 | JUN kinase kinase kinase activity(GO:0004706) |
| 1.2 | 4.9 | GO:0035033 | histone deacetylase regulator activity(GO:0035033) |
| 1.2 | 3.5 | GO:0004336 | galactosylceramidase activity(GO:0004336) |
| 1.2 | 7.0 | GO:0003998 | acylphosphatase activity(GO:0003998) |
| 1.1 | 9.9 | GO:0008597 | calcium-dependent protein serine/threonine phosphatase regulator activity(GO:0008597) |
| 1.0 | 13.7 | GO:0015501 | glutamate:sodium symporter activity(GO:0015501) |
| 0.9 | 13.0 | GO:0055056 | D-glucose transmembrane transporter activity(GO:0055056) |
| 0.9 | 28.9 | GO:0005001 | transmembrane receptor protein tyrosine phosphatase activity(GO:0005001) transmembrane receptor protein phosphatase activity(GO:0019198) |
| 0.9 | 4.4 | GO:0004803 | transposase activity(GO:0004803) |
| 0.8 | 4.7 | GO:0004468 | lysine N-acetyltransferase activity, acting on acetyl phosphate as donor(GO:0004468) |
| 0.8 | 3.1 | GO:0047288 | monosialoganglioside sialyltransferase activity(GO:0047288) |
| 0.8 | 18.4 | GO:0033130 | acetylcholine receptor binding(GO:0033130) |
| 0.7 | 16.7 | GO:0031005 | filamin binding(GO:0031005) |
| 0.7 | 10.1 | GO:0017162 | aryl hydrocarbon receptor binding(GO:0017162) |
| 0.7 | 41.6 | GO:0030507 | spectrin binding(GO:0030507) |
| 0.6 | 2.9 | GO:0008553 | hydrogen-exporting ATPase activity, phosphorylative mechanism(GO:0008553) |
| 0.5 | 5.8 | GO:0004065 | arylsulfatase activity(GO:0004065) |
| 0.4 | 2.9 | GO:0003828 | alpha-N-acetylneuraminate alpha-2,8-sialyltransferase activity(GO:0003828) |
| 0.4 | 1.2 | GO:0055100 | adiponectin binding(GO:0055100) |
| 0.4 | 3.2 | GO:0004322 | ferroxidase activity(GO:0004322) oxidoreductase activity, oxidizing metal ions, oxygen as acceptor(GO:0016724) |
| 0.4 | 1.6 | GO:0032795 | heterotrimeric G-protein binding(GO:0032795) |
| 0.4 | 3.5 | GO:0097322 | 7SK snRNA binding(GO:0097322) |
| 0.3 | 1.4 | GO:0017089 | glycolipid transporter activity(GO:0017089) |
| 0.3 | 2.7 | GO:0004111 | creatine kinase activity(GO:0004111) |
| 0.3 | 12.0 | GO:0005540 | hyaluronic acid binding(GO:0005540) |
| 0.3 | 1.3 | GO:0061752 | telomeric repeat-containing RNA binding(GO:0061752) |
| 0.3 | 0.9 | GO:0035650 | AP-1 adaptor complex binding(GO:0035650) |
| 0.3 | 2.3 | GO:0004571 | mannosyl-oligosaccharide 1,2-alpha-mannosidase activity(GO:0004571) |
| 0.3 | 0.9 | GO:0005173 | stem cell factor receptor binding(GO:0005173) |
| 0.3 | 3.4 | GO:0005007 | fibroblast growth factor-activated receptor activity(GO:0005007) |
| 0.3 | 2.5 | GO:0070679 | inositol 1,4,5 trisphosphate binding(GO:0070679) |
| 0.3 | 7.4 | GO:0004012 | phospholipid-translocating ATPase activity(GO:0004012) |
| 0.3 | 2.3 | GO:0030020 | extracellular matrix structural constituent conferring tensile strength(GO:0030020) |
| 0.3 | 4.8 | GO:0045294 | alpha-catenin binding(GO:0045294) |
| 0.3 | 1.8 | GO:1903763 | gap junction channel activity involved in cell communication by electrical coupling(GO:1903763) |
| 0.2 | 22.5 | GO:0004722 | protein serine/threonine phosphatase activity(GO:0004722) |
| 0.2 | 8.4 | GO:0017075 | syntaxin-1 binding(GO:0017075) |
| 0.2 | 1.4 | GO:0003873 | 6-phosphofructo-2-kinase activity(GO:0003873) |
| 0.2 | 24.9 | GO:0005070 | SH3/SH2 adaptor activity(GO:0005070) |
| 0.2 | 1.5 | GO:0047045 | testosterone 17-beta-dehydrogenase (NADP+) activity(GO:0047045) |
| 0.2 | 6.9 | GO:0008157 | protein phosphatase 1 binding(GO:0008157) |
| 0.2 | 2.8 | GO:0017034 | Rap guanyl-nucleotide exchange factor activity(GO:0017034) |
| 0.2 | 1.8 | GO:0048495 | Roundabout binding(GO:0048495) |
| 0.2 | 0.6 | GO:0031862 | prostanoid receptor binding(GO:0031862) |
| 0.2 | 3.7 | GO:0001087 | transcription factor activity, sequence-specific DNA binding, RNA polymerase recruiting(GO:0001011) transcription factor activity, TFIIB-class binding(GO:0001087) |
| 0.2 | 0.5 | GO:0004958 | prostaglandin F receptor activity(GO:0004958) |
| 0.2 | 0.5 | GO:0052836 | inositol 5-diphosphate pentakisphosphate 5-kinase activity(GO:0052836) inositol diphosphate tetrakisphosphate kinase activity(GO:0052839) |
| 0.2 | 13.8 | GO:0048365 | Rac GTPase binding(GO:0048365) |
| 0.2 | 4.7 | GO:0050321 | tau-protein kinase activity(GO:0050321) |
| 0.2 | 0.7 | GO:0004360 | glutamine-fructose-6-phosphate transaminase (isomerizing) activity(GO:0004360) |
| 0.2 | 2.0 | GO:0008020 | G-protein coupled photoreceptor activity(GO:0008020) |
| 0.2 | 1.6 | GO:0030215 | semaphorin receptor binding(GO:0030215) |
| 0.2 | 2.3 | GO:0051864 | histone demethylase activity (H3-K36 specific)(GO:0051864) |
| 0.2 | 0.8 | GO:0008889 | glycerophosphodiester phosphodiesterase activity(GO:0008889) |
| 0.1 | 0.6 | GO:0046933 | proton-transporting ATP synthase activity, rotational mechanism(GO:0046933) |
| 0.1 | 2.6 | GO:0038191 | neuropilin binding(GO:0038191) |
| 0.1 | 1.1 | GO:0043426 | MRF binding(GO:0043426) |
| 0.1 | 0.8 | GO:0005127 | ciliary neurotrophic factor receptor binding(GO:0005127) |
| 0.1 | 0.8 | GO:0038052 | RNA polymerase II transcription factor activity, estrogen-activated sequence-specific DNA binding(GO:0038052) |
| 0.1 | 1.8 | GO:0061578 | Lys63-specific deubiquitinase activity(GO:0061578) |
| 0.1 | 1.1 | GO:0015272 | ATP-activated inward rectifier potassium channel activity(GO:0015272) |
| 0.1 | 3.1 | GO:0017134 | fibroblast growth factor binding(GO:0017134) |
| 0.1 | 1.8 | GO:0005344 | oxygen transporter activity(GO:0005344) |
| 0.1 | 6.0 | GO:0005245 | voltage-gated calcium channel activity(GO:0005245) |
| 0.1 | 4.6 | GO:0017091 | AU-rich element binding(GO:0017091) |
| 0.1 | 0.3 | GO:0001002 | polymerase III regulatory region sequence-specific DNA binding(GO:0000992) RNA polymerase III type 1 promoter sequence-specific DNA binding(GO:0001002) RNA polymerase III type 2 promoter sequence-specific DNA binding(GO:0001003) RNA polymerase III type 1 promoter DNA binding(GO:0001030) RNA polymerase III type 2 promoter DNA binding(GO:0001031) 5S rDNA binding(GO:0080084) |
| 0.1 | 4.6 | GO:0005227 | calcium activated cation channel activity(GO:0005227) |
| 0.1 | 2.6 | GO:0015035 | protein disulfide oxidoreductase activity(GO:0015035) |
| 0.1 | 2.9 | GO:0003785 | actin monomer binding(GO:0003785) |
| 0.1 | 2.5 | GO:0051010 | microtubule plus-end binding(GO:0051010) |
| 0.1 | 1.5 | GO:0008499 | UDP-galactose:beta-N-acetylglucosamine beta-1,3-galactosyltransferase activity(GO:0008499) |
| 0.1 | 3.0 | GO:0004708 | MAP kinase kinase activity(GO:0004708) |
| 0.1 | 6.3 | GO:0019905 | syntaxin binding(GO:0019905) |
| 0.1 | 1.4 | GO:0031821 | G-protein coupled serotonin receptor binding(GO:0031821) |
| 0.1 | 6.5 | GO:0003777 | microtubule motor activity(GO:0003777) |
| 0.1 | 0.4 | GO:0004791 | thioredoxin-disulfide reductase activity(GO:0004791) |
| 0.1 | 0.6 | GO:0003680 | AT DNA binding(GO:0003680) |
| 0.1 | 1.5 | GO:0045499 | chemorepellent activity(GO:0045499) |
| 0.1 | 0.4 | GO:0043398 | HLH domain binding(GO:0043398) |
| 0.1 | 1.1 | GO:0003906 | DNA-(apurinic or apyrimidinic site) lyase activity(GO:0003906) |
| 0.1 | 0.8 | GO:0017151 | DEAD/H-box RNA helicase binding(GO:0017151) |
| 0.1 | 0.3 | GO:0005222 | intracellular cAMP activated cation channel activity(GO:0005222) |
| 0.1 | 1.8 | GO:0035259 | glucocorticoid receptor binding(GO:0035259) |
| 0.1 | 0.5 | GO:0070878 | primary miRNA binding(GO:0070878) |
| 0.1 | 1.9 | GO:0071837 | HMG box domain binding(GO:0071837) |
| 0.1 | 1.8 | GO:0003746 | translation elongation factor activity(GO:0003746) |
| 0.1 | 1.1 | GO:0004143 | diacylglycerol kinase activity(GO:0004143) |
| 0.1 | 3.2 | GO:0004712 | protein serine/threonine/tyrosine kinase activity(GO:0004712) |
| 0.1 | 2.7 | GO:0070888 | E-box binding(GO:0070888) |
| 0.1 | 1.6 | GO:0030676 | Rac guanyl-nucleotide exchange factor activity(GO:0030676) |
| 0.1 | 1.6 | GO:0035198 | miRNA binding(GO:0035198) |
| 0.1 | 2.9 | GO:0016706 | oxidoreductase activity, acting on paired donors, with incorporation or reduction of molecular oxygen, 2-oxoglutarate as one donor, and incorporation of one atom each of oxygen into both donors(GO:0016706) |
| 0.1 | 2.7 | GO:0030332 | cyclin binding(GO:0030332) |
| 0.1 | 3.0 | GO:0008137 | NADH dehydrogenase (ubiquinone) activity(GO:0008137) NADH dehydrogenase (quinone) activity(GO:0050136) |
| 0.1 | 1.7 | GO:0031210 | phosphatidylcholine binding(GO:0031210) |
| 0.1 | 1.5 | GO:0022848 | acetylcholine-gated cation channel activity(GO:0022848) |
| 0.1 | 2.2 | GO:0015175 | neutral amino acid transmembrane transporter activity(GO:0015175) |
| 0.1 | 0.5 | GO:0050682 | AF-2 domain binding(GO:0050682) |
| 0.1 | 2.6 | GO:0035035 | histone acetyltransferase binding(GO:0035035) |
| 0.1 | 0.8 | GO:0004016 | adenylate cyclase activity(GO:0004016) |
| 0.0 | 4.0 | GO:0003730 | mRNA 3'-UTR binding(GO:0003730) |
| 0.0 | 0.3 | GO:0004977 | melanocortin receptor activity(GO:0004977) |
| 0.0 | 9.8 | GO:0051015 | actin filament binding(GO:0051015) |
| 0.0 | 0.6 | GO:0070700 | BMP receptor binding(GO:0070700) |
| 0.0 | 0.2 | GO:0004161 | dimethylallyltranstransferase activity(GO:0004161) geranyltranstransferase activity(GO:0004337) |
| 0.0 | 0.4 | GO:0004957 | prostaglandin E receptor activity(GO:0004957) |
| 0.0 | 2.9 | GO:0019003 | GDP binding(GO:0019003) |
| 0.0 | 2.7 | GO:0035064 | methylated histone binding(GO:0035064) |
| 0.0 | 0.7 | GO:0000339 | RNA cap binding(GO:0000339) |
| 0.0 | 5.8 | GO:0017137 | Rab GTPase binding(GO:0017137) |
| 0.0 | 0.5 | GO:0042800 | histone methyltransferase activity (H3-K4 specific)(GO:0042800) |
| 0.0 | 1.5 | GO:0015485 | cholesterol binding(GO:0015485) |
| 0.0 | 8.3 | GO:0015631 | tubulin binding(GO:0015631) |
| 0.0 | 0.9 | GO:0004709 | MAP kinase kinase kinase activity(GO:0004709) |
| 0.0 | 0.8 | GO:0004190 | aspartic-type endopeptidase activity(GO:0004190) aspartic-type peptidase activity(GO:0070001) |
| 0.0 | 0.7 | GO:0016638 | oxidoreductase activity, acting on the CH-NH2 group of donors(GO:0016638) |
| 0.0 | 0.1 | GO:0071987 | WD40-repeat domain binding(GO:0071987) |
| 0.0 | 0.4 | GO:0031702 | type 1 angiotensin receptor binding(GO:0031702) |
| 0.0 | 0.1 | GO:0003846 | 2-acylglycerol O-acyltransferase activity(GO:0003846) |
| 0.0 | 0.2 | GO:0032393 | MHC class I receptor activity(GO:0032393) |
| 0.0 | 1.0 | GO:0030971 | receptor tyrosine kinase binding(GO:0030971) |
| 0.0 | 0.3 | GO:0031078 | histone deacetylase activity (H3-K14 specific)(GO:0031078) NAD-dependent histone deacetylase activity (H3-K14 specific)(GO:0032041) |
| 0.0 | 16.2 | GO:0005509 | calcium ion binding(GO:0005509) |
| 0.0 | 20.6 | GO:0008270 | zinc ion binding(GO:0008270) |
| 0.0 | 2.1 | GO:0030165 | PDZ domain binding(GO:0030165) |
| 0.0 | 2.4 | GO:0001046 | core promoter sequence-specific DNA binding(GO:0001046) |
| 0.0 | 0.3 | GO:0003691 | double-stranded telomeric DNA binding(GO:0003691) |
| 0.0 | 0.4 | GO:0019870 | potassium channel inhibitor activity(GO:0019870) |
| 0.0 | 0.3 | GO:0044769 | hydrogen-exporting ATPase activity(GO:0036442) ATPase activity, coupled to transmembrane movement of ions, rotational mechanism(GO:0044769) proton-transporting ATPase activity, rotational mechanism(GO:0046961) |
| 0.0 | 0.1 | GO:0030368 | interleukin-17 receptor activity(GO:0030368) |
| 0.0 | 0.2 | GO:0046790 | virion binding(GO:0046790) |
| 0.0 | 0.2 | GO:0031489 | myosin V binding(GO:0031489) |
| 0.0 | 1.2 | GO:0008013 | beta-catenin binding(GO:0008013) |
| 0.0 | 2.4 | GO:0000287 | magnesium ion binding(GO:0000287) |
| 0.0 | 0.3 | GO:0008483 | transaminase activity(GO:0008483) |
| 0.0 | 0.6 | GO:0051539 | 4 iron, 4 sulfur cluster binding(GO:0051539) |
| 0.0 | 0.9 | GO:0001540 | beta-amyloid binding(GO:0001540) |
| 0.0 | 0.4 | GO:0030374 | ligand-dependent nuclear receptor transcription coactivator activity(GO:0030374) |
Gene overrepresentation in curated gene sets: canonical pathways category:
| Log-likelihood per target | Total log-likelihood | Term | Description |
|---|---|---|---|
| 0.7 | 13.6 | PID P38 GAMMA DELTA PATHWAY | Signaling mediated by p38-gamma and p38-delta |
| 0.6 | 13.9 | PID TCR JNK PATHWAY | JNK signaling in the CD4+ TCR pathway |
| 0.2 | 2.5 | PID EPHA2 FWD PATHWAY | EPHA2 forward signaling |
| 0.2 | 14.9 | PID ATR PATHWAY | ATR signaling pathway |
| 0.2 | 3.6 | SA REG CASCADE OF CYCLIN EXPR | Expression of cyclins regulates progression through the cell cycle by activating cyclin-dependent kinases. |
| 0.2 | 2.9 | PID SYNDECAN 3 PATHWAY | Syndecan-3-mediated signaling events |
| 0.2 | 9.3 | PID FAS PATHWAY | FAS (CD95) signaling pathway |
| 0.2 | 13.0 | PID MAPK TRK PATHWAY | Trk receptor signaling mediated by the MAPK pathway |
| 0.2 | 8.0 | ST DIFFERENTIATION PATHWAY IN PC12 CELLS | Differentiation Pathway in PC12 Cells; this is a specific case of PAC1 Receptor Pathway. |
| 0.2 | 9.9 | PID TCR CALCIUM PATHWAY | Calcium signaling in the CD4+ TCR pathway |
| 0.2 | 6.9 | PID HDAC CLASSIII PATHWAY | Signaling events mediated by HDAC Class III |
| 0.2 | 8.9 | NABA PROTEOGLYCANS | Genes encoding proteoglycans |
| 0.2 | 7.5 | PID NFAT TFPATHWAY | Calcineurin-regulated NFAT-dependent transcription in lymphocytes |
| 0.2 | 18.7 | PID P75 NTR PATHWAY | p75(NTR)-mediated signaling |
| 0.2 | 4.7 | PID ARF6 DOWNSTREAM PATHWAY | Arf6 downstream pathway |
| 0.1 | 5.4 | PID SYNDECAN 2 PATHWAY | Syndecan-2-mediated signaling events |
| 0.1 | 5.1 | PID INSULIN PATHWAY | Insulin Pathway |
| 0.1 | 4.7 | PID EPHB FWD PATHWAY | EPHB forward signaling |
| 0.1 | 4.3 | ST JNK MAPK PATHWAY | JNK MAPK Pathway |
| 0.1 | 2.5 | PID ARF 3PATHWAY | Arf1 pathway |
| 0.1 | 8.3 | PID FGF PATHWAY | FGF signaling pathway |
| 0.1 | 1.5 | PID ERBB2 ERBB3 PATHWAY | ErbB2/ErbB3 signaling events |
| 0.1 | 2.2 | PID INTEGRIN5 PATHWAY | Beta5 beta6 beta7 and beta8 integrin cell surface interactions |
| 0.1 | 4.7 | PID LKB1 PATHWAY | LKB1 signaling events |
| 0.1 | 0.7 | PID INTEGRIN3 PATHWAY | Beta3 integrin cell surface interactions |
| 0.1 | 4.0 | PID ERBB1 DOWNSTREAM PATHWAY | ErbB1 downstream signaling |
| 0.1 | 1.4 | PID ERBB1 RECEPTOR PROXIMAL PATHWAY | EGF receptor (ErbB1) signaling pathway |
| 0.1 | 8.6 | PID PDGFRB PATHWAY | PDGFR-beta signaling pathway |
| 0.1 | 2.2 | PID RB 1PATHWAY | Regulation of retinoblastoma protein |
| 0.1 | 1.8 | PID GLYPICAN 1PATHWAY | Glypican 1 network |
| 0.1 | 6.0 | PID MYC REPRESS PATHWAY | Validated targets of C-MYC transcriptional repression |
| 0.1 | 3.7 | PID HNF3B PATHWAY | FOXA2 and FOXA3 transcription factor networks |
| 0.1 | 1.2 | PID PI3KCI PATHWAY | Class I PI3K signaling events |
| 0.1 | 2.9 | ST FAS SIGNALING PATHWAY | Fas Signaling Pathway |
| 0.0 | 0.9 | PID P38 MKK3 6PATHWAY | p38 MAPK signaling pathway |
| 0.0 | 0.5 | PID IL3 PATHWAY | IL3-mediated signaling events |
| 0.0 | 2.0 | PID P53 REGULATION PATHWAY | p53 pathway |
| 0.0 | 2.1 | PID IL12 2PATHWAY | IL12-mediated signaling events |
| 0.0 | 6.1 | NABA ECM AFFILIATED | Genes encoding proteins affiliated structurally or functionally to extracellular matrix proteins |
| 0.0 | 0.4 | PID EPHA FWDPATHWAY | EPHA forward signaling |
| 0.0 | 1.2 | PID INTEGRIN A4B1 PATHWAY | Alpha4 beta1 integrin signaling events |
| 0.0 | 0.8 | PID ERB GENOMIC PATHWAY | Validated nuclear estrogen receptor beta network |
| 0.0 | 0.5 | PID NETRIN PATHWAY | Netrin-mediated signaling events |
| 0.0 | 3.6 | PID P53 DOWNSTREAM PATHWAY | Direct p53 effectors |
| 0.0 | 0.5 | PID WNT NONCANONICAL PATHWAY | Noncanonical Wnt signaling pathway |
| 0.0 | 1.8 | PID HIF1 TFPATHWAY | HIF-1-alpha transcription factor network |
| 0.0 | 0.3 | PID ATF2 PATHWAY | ATF-2 transcription factor network |
| 0.0 | 3.4 | NABA SECRETED FACTORS | Genes encoding secreted soluble factors |
Gene overrepresentation in curated gene sets: REACTOME pathways category:
| Log-likelihood per target | Total log-likelihood | Term | Description |
|---|---|---|---|
| 1.1 | 31.5 | REACTOME CRMPS IN SEMA3A SIGNALING | Genes involved in CRMPs in Sema3A signaling |
| 0.7 | 10.3 | REACTOME ACYL CHAIN REMODELLING OF PS | Genes involved in Acyl chain remodelling of PS |
| 0.6 | 18.2 | REACTOME AMINO ACID SYNTHESIS AND INTERCONVERSION TRANSAMINATION | Genes involved in Amino acid synthesis and interconversion (transamination) |
| 0.6 | 13.0 | REACTOME FACILITATIVE NA INDEPENDENT GLUCOSE TRANSPORTERS | Genes involved in Facilitative Na+-independent glucose transporters |
| 0.5 | 13.9 | REACTOME POST CHAPERONIN TUBULIN FOLDING PATHWAY | Genes involved in Post-chaperonin tubulin folding pathway |
| 0.4 | 5.5 | REACTOME THE ACTIVATION OF ARYLSULFATASES | Genes involved in The activation of arylsulfatases |
| 0.3 | 7.7 | REACTOME TRAFFICKING OF GLUR2 CONTAINING AMPA RECEPTORS | Genes involved in Trafficking of GluR2-containing AMPA receptors |
| 0.3 | 3.6 | REACTOME ACTIVATION OF CHAPERONE GENES BY ATF6 ALPHA | Genes involved in Activation of Chaperone Genes by ATF6-alpha |
| 0.2 | 4.9 | REACTOME NRIF SIGNALS CELL DEATH FROM THE NUCLEUS | Genes involved in NRIF signals cell death from the nucleus |
| 0.2 | 25.4 | REACTOME P75 NTR RECEPTOR MEDIATED SIGNALLING | Genes involved in p75 NTR receptor-mediated signalling |
| 0.2 | 7.2 | REACTOME TIGHT JUNCTION INTERACTIONS | Genes involved in Tight junction interactions |
| 0.2 | 2.1 | REACTOME REGULATION OF INSULIN SECRETION BY ACETYLCHOLINE | Genes involved in Regulation of Insulin Secretion by Acetylcholine |
| 0.2 | 2.0 | REACTOME OPSINS | Genes involved in Opsins |
| 0.2 | 14.0 | REACTOME AMINO ACID AND OLIGOPEPTIDE SLC TRANSPORTERS | Genes involved in Amino acid and oligopeptide SLC transporters |
| 0.2 | 3.4 | REACTOME SIGNALING BY ACTIVATED POINT MUTANTS OF FGFR1 | Genes involved in Signaling by activated point mutants of FGFR1 |
| 0.1 | 7.4 | REACTOME ION TRANSPORT BY P TYPE ATPASES | Genes involved in Ion transport by P-type ATPases |
| 0.1 | 6.5 | REACTOME IRON UPTAKE AND TRANSPORT | Genes involved in Iron uptake and transport |
| 0.1 | 1.8 | REACTOME NEF MEDIATED DOWNREGULATION OF MHC CLASS I COMPLEX CELL SURFACE EXPRESSION | Genes involved in Nef mediated downregulation of MHC class I complex cell surface expression |
| 0.1 | 1.8 | REACTOME TIE2 SIGNALING | Genes involved in Tie2 Signaling |
| 0.1 | 2.6 | REACTOME OTHER SEMAPHORIN INTERACTIONS | Genes involved in Other semaphorin interactions |
| 0.1 | 4.6 | REACTOME CELL CELL JUNCTION ORGANIZATION | Genes involved in Cell-cell junction organization |
| 0.1 | 8.8 | REACTOME NOTCH1 INTRACELLULAR DOMAIN REGULATES TRANSCRIPTION | Genes involved in NOTCH1 Intracellular Domain Regulates Transcription |
| 0.1 | 4.5 | REACTOME INHIBITION OF INSULIN SECRETION BY ADRENALINE NORADRENALINE | Genes involved in Inhibition of Insulin Secretion by Adrenaline/Noradrenaline |
| 0.1 | 2.9 | REACTOME HS GAG DEGRADATION | Genes involved in HS-GAG degradation |
| 0.1 | 1.5 | REACTOME ANDROGEN BIOSYNTHESIS | Genes involved in Androgen biosynthesis |
| 0.1 | 1.6 | REACTOME G ALPHA1213 SIGNALLING EVENTS | Genes involved in G alpha (12/13) signalling events |
| 0.1 | 5.5 | REACTOME REGULATION OF BETA CELL DEVELOPMENT | Genes involved in Regulation of beta-cell development |
| 0.1 | 1.3 | REACTOME JNK C JUN KINASES PHOSPHORYLATION AND ACTIVATION MEDIATED BY ACTIVATED HUMAN TAK1 | Genes involved in JNK (c-Jun kinases) phosphorylation and activation mediated by activated human TAK1 |
| 0.1 | 4.4 | REACTOME MEIOTIC SYNAPSIS | Genes involved in Meiotic Synapsis |
| 0.1 | 3.5 | REACTOME NOD1 2 SIGNALING PATHWAY | Genes involved in NOD1/2 Signaling Pathway |
| 0.1 | 2.9 | REACTOME GLYCOSPHINGOLIPID METABOLISM | Genes involved in Glycosphingolipid metabolism |
| 0.1 | 1.5 | REACTOME PRESYNAPTIC NICOTINIC ACETYLCHOLINE RECEPTORS | Genes involved in Presynaptic nicotinic acetylcholine receptors |
| 0.1 | 0.9 | REACTOME PROSTANOID LIGAND RECEPTORS | Genes involved in Prostanoid ligand receptors |
| 0.1 | 1.3 | REACTOME GAP JUNCTION ASSEMBLY | Genes involved in Gap junction assembly |
| 0.1 | 2.2 | REACTOME RNA POL III TRANSCRIPTION INITIATION FROM TYPE 3 PROMOTER | Genes involved in RNA Polymerase III Transcription Initiation From Type 3 Promoter |
| 0.1 | 10.1 | REACTOME FACTORS INVOLVED IN MEGAKARYOCYTE DEVELOPMENT AND PLATELET PRODUCTION | Genes involved in Factors involved in megakaryocyte development and platelet production |
| 0.1 | 2.5 | REACTOME INTERACTION BETWEEN L1 AND ANKYRINS | Genes involved in Interaction between L1 and Ankyrins |
| 0.1 | 1.1 | REACTOME BASE FREE SUGAR PHOSPHATE REMOVAL VIA THE SINGLE NUCLEOTIDE REPLACEMENT PATHWAY | Genes involved in Base-free sugar-phosphate removal via the single-nucleotide replacement pathway |
| 0.1 | 2.4 | REACTOME CGMP EFFECTS | Genes involved in cGMP effects |
| 0.1 | 0.4 | REACTOME DOWNSTREAM SIGNAL TRANSDUCTION | Genes involved in Downstream signal transduction |
| 0.1 | 1.9 | REACTOME DEADENYLATION OF MRNA | Genes involved in Deadenylation of mRNA |
| 0.1 | 1.1 | REACTOME NOREPINEPHRINE NEUROTRANSMITTER RELEASE CYCLE | Genes involved in Norepinephrine Neurotransmitter Release Cycle |
| 0.1 | 2.8 | REACTOME TRANSPORT TO THE GOLGI AND SUBSEQUENT MODIFICATION | Genes involved in Transport to the Golgi and subsequent modification |
| 0.0 | 1.1 | REACTOME INHIBITION OF VOLTAGE GATED CA2 CHANNELS VIA GBETA GAMMA SUBUNITS | Genes involved in Inhibition of voltage gated Ca2+ channels via Gbeta/gamma subunits |
| 0.0 | 1.7 | REACTOME FORMATION OF TRANSCRIPTION COUPLED NER TC NER REPAIR COMPLEX | Genes involved in Formation of transcription-coupled NER (TC-NER) repair complex |
| 0.0 | 0.9 | REACTOME REGULATION OF KIT SIGNALING | Genes involved in Regulation of KIT signaling |
| 0.0 | 0.7 | REACTOME SYNTHESIS OF SUBSTRATES IN N GLYCAN BIOSYTHESIS | Genes involved in Synthesis of substrates in N-glycan biosythesis |
| 0.0 | 2.3 | REACTOME NCAM1 INTERACTIONS | Genes involved in NCAM1 interactions |
| 0.0 | 0.7 | REACTOME ACTIVATION OF RAC | Genes involved in Activation of Rac |
| 0.0 | 1.0 | REACTOME DARPP 32 EVENTS | Genes involved in DARPP-32 events |
| 0.0 | 2.6 | REACTOME NUCLEAR RECEPTOR TRANSCRIPTION PATHWAY | Genes involved in Nuclear Receptor transcription pathway |
| 0.0 | 1.4 | REACTOME GLYCOLYSIS | Genes involved in Glycolysis |
| 0.0 | 1.1 | REACTOME ACTIVATION OF KAINATE RECEPTORS UPON GLUTAMATE BINDING | Genes involved in Activation of Kainate Receptors upon glutamate binding |
| 0.0 | 4.2 | REACTOME PPARA ACTIVATES GENE EXPRESSION | Genes involved in PPARA Activates Gene Expression |
| 0.0 | 0.7 | REACTOME SEMA4D IN SEMAPHORIN SIGNALING | Genes involved in Sema4D in semaphorin signaling |
| 0.0 | 1.2 | REACTOME MYOGENESIS | Genes involved in Myogenesis |
| 0.0 | 2.8 | REACTOME SIGNALING BY RHO GTPASES | Genes involved in Signaling by Rho GTPases |
| 0.0 | 1.3 | REACTOME MITOCHONDRIAL PROTEIN IMPORT | Genes involved in Mitochondrial Protein Import |
| 0.0 | 0.1 | REACTOME SIGNALING BY FGFR | Genes involved in Signaling by FGFR |
| 0.0 | 1.8 | REACTOME RESPONSE TO ELEVATED PLATELET CYTOSOLIC CA2 | Genes involved in Response to elevated platelet cytosolic Ca2+ |
| 0.0 | 0.3 | REACTOME NUCLEOTIDE LIKE PURINERGIC RECEPTORS | Genes involved in Nucleotide-like (purinergic) receptors |