|
chr14_-_74493275
Show fit
|
11.19 |
ENST00000541064.5
|
NPC2
|
NPC intracellular cholesterol transporter 2
|
|
chr14_-_74493322
Show fit
|
10.55 |
ENST00000553490.5
ENST00000557510.5
|
NPC2
|
NPC intracellular cholesterol transporter 2
|
|
chr14_-_74493291
Show fit
|
10.52 |
ENST00000238633.6
ENST00000555619.6
ENST00000434013.6
|
NPC2
|
NPC intracellular cholesterol transporter 2
|
|
chr2_-_55923775
Show fit
|
8.40 |
ENST00000438672.5
ENST00000355426.8
ENST00000440439.5
ENST00000429909.5
ENST00000424207.5
ENST00000452337.5
ENST00000439193.5
ENST00000421664.1
|
EFEMP1
|
EGF containing fibulin extracellular matrix protein 1
|
|
chr17_-_41918944
Show fit
|
8.08 |
ENST00000352035.7
ENST00000590770.5
ENST00000590151.5
|
ACLY
|
ATP citrate lyase
|
|
chr12_-_91111460
Show fit
|
7.45 |
ENST00000266718.5
|
LUM
|
lumican
|
|
chr17_-_41918966
Show fit
|
6.96 |
ENST00000537919.5
ENST00000353196.5
ENST00000393896.6
|
ACLY
|
ATP citrate lyase
|
|
chr10_-_73096974
Show fit
|
6.68 |
ENST00000440381.5
ENST00000263556.3
|
P4HA1
|
prolyl 4-hydroxylase subunit alpha 1
|
|
chr12_-_52949818
Show fit
|
6.59 |
ENST00000546897.5
ENST00000552551.5
|
KRT8
|
keratin 8
|
|
chr2_+_27212866
Show fit
|
6.54 |
ENST00000419744.1
|
ATRAID
|
all-trans retinoic acid induced differentiation factor
|
|
chr19_+_11089446
Show fit
|
6.33 |
ENST00000557933.5
ENST00000455727.6
ENST00000535915.5
ENST00000545707.5
ENST00000558518.6
ENST00000558013.5
|
LDLR
|
low density lipoprotein receptor
|
|
chr17_-_15265230
Show fit
|
6.31 |
ENST00000676161.1
ENST00000646419.2
ENST00000312280.9
ENST00000494511.7
ENST00000580584.3
ENST00000676221.1
|
PMP22
|
peripheral myelin protein 22
|
|
chr18_-_23586422
Show fit
|
6.28 |
ENST00000269228.10
|
NPC1
|
NPC intracellular cholesterol transporter 1
|
|
chr5_-_150155828
Show fit
|
5.95 |
ENST00000261799.9
|
PDGFRB
|
platelet derived growth factor receptor beta
|
|
chr10_-_73096850
Show fit
|
5.88 |
ENST00000307116.6
ENST00000373008.6
ENST00000394890.7
|
P4HA1
|
prolyl 4-hydroxylase subunit alpha 1
|
|
chr5_-_39424966
Show fit
|
5.59 |
ENST00000515700.5
ENST00000320816.11
ENST00000339788.10
|
DAB2
|
DAB adaptor protein 2
|
|
chr6_+_151239951
Show fit
|
4.92 |
ENST00000402676.7
|
AKAP12
|
A-kinase anchoring protein 12
|
|
chr19_-_11197516
Show fit
|
4.91 |
ENST00000592903.5
ENST00000586659.6
ENST00000589359.5
ENST00000588724.5
|
KANK2
|
KN motif and ankyrin repeat domains 2
|
|
chr17_-_82098187
Show fit
|
4.51 |
ENST00000634990.1
|
FASN
|
fatty acid synthase
|
|
chr8_+_11802667
Show fit
|
4.39 |
ENST00000443614.6
ENST00000220584.9
ENST00000525900.5
|
FDFT1
|
farnesyl-diphosphate farnesyltransferase 1
|
|
chr8_+_11802611
Show fit
|
4.28 |
ENST00000623368.3
|
FDFT1
|
farnesyl-diphosphate farnesyltransferase 1
|
|
chr6_-_31958431
Show fit
|
3.91 |
ENST00000625905.1
ENST00000454913.5
ENST00000436289.6
|
NELFE
|
negative elongation factor complex member E
|
|
chr8_+_26577843
Show fit
|
3.89 |
ENST00000311151.9
|
DPYSL2
|
dihydropyrimidinase like 2
|
|
chr1_+_112619824
Show fit
|
3.66 |
ENST00000263168.4
|
CAPZA1
|
capping actin protein of muscle Z-line subunit alpha 1
|
|
chr6_-_53348902
Show fit
|
3.62 |
ENST00000370913.5
ENST00000304434.11
|
ELOVL5
|
ELOVL fatty acid elongase 5
|
|
chr10_-_3785197
Show fit
|
3.48 |
ENST00000497571.6
|
KLF6
|
Kruppel like factor 6
|
|
chr6_-_52995170
Show fit
|
3.46 |
ENST00000370959.1
ENST00000370963.9
|
GSTA4
|
glutathione S-transferase alpha 4
|
|
chr3_+_50269140
Show fit
|
3.17 |
ENST00000616701.5
ENST00000433753.4
ENST00000611067.4
|
SEMA3B
|
semaphorin 3B
|
|
chr17_+_75261864
Show fit
|
3.17 |
ENST00000245539.11
ENST00000579002.5
|
MRPS7
|
mitochondrial ribosomal protein S7
|
|
chr5_-_43313403
Show fit
|
2.90 |
ENST00000325110.11
|
HMGCS1
|
3-hydroxy-3-methylglutaryl-CoA synthase 1
|
|
chr5_-_43313473
Show fit
|
2.82 |
ENST00000433297.2
|
HMGCS1
|
3-hydroxy-3-methylglutaryl-CoA synthase 1
|
|
chr1_-_155262348
Show fit
|
2.75 |
ENST00000302631.8
ENST00000355379.3
|
SCAMP3
|
secretory carrier membrane protein 3
|
|
chr9_+_128689948
Show fit
|
2.57 |
ENST00000372688.8
ENST00000372686.5
|
SET
|
SET nuclear proto-oncogene
|
|
chr4_+_74365136
Show fit
|
2.37 |
ENST00000244869.3
|
EREG
|
epiregulin
|
|
chr8_+_123416735
Show fit
|
2.27 |
ENST00000524254.5
|
NTAQ1
|
N-terminal glutamine amidase 1
|
|
chr9_+_128689201
Show fit
|
2.17 |
ENST00000322030.13
|
SET
|
SET nuclear proto-oncogene
|
|
chr17_+_75261661
Show fit
|
2.08 |
ENST00000579761.5
|
MRPS7
|
mitochondrial ribosomal protein S7
|
|
chr8_+_123416766
Show fit
|
2.04 |
ENST00000287387.7
ENST00000650311.1
ENST00000523356.1
|
NTAQ1
|
N-terminal glutamine amidase 1
|
|
chr11_+_2902258
Show fit
|
1.88 |
ENST00000649076.2
ENST00000449793.6
|
SLC22A18
|
solute carrier family 22 member 18
|
|
chr6_-_32184243
Show fit
|
1.82 |
ENST00000375055.6
ENST00000375076.9
|
AGER
|
advanced glycosylation end-product specific receptor
|
|
chr8_+_123416718
Show fit
|
1.81 |
ENST00000523984.5
|
NTAQ1
|
N-terminal glutamine amidase 1
|
|
chr10_-_3785225
Show fit
|
1.73 |
ENST00000542957.1
|
KLF6
|
Kruppel like factor 6
|
|
chr6_-_32184287
Show fit
|
1.69 |
ENST00000375069.7
ENST00000375070.7
ENST00000438221.6
ENST00000620802.4
ENST00000538695.2
|
AGER
|
advanced glycosylation end-product specific receptor
|
|
chr15_+_67067780
Show fit
|
1.53 |
ENST00000679624.1
|
SMAD3
|
SMAD family member 3
|
|
chr3_+_160399630
Show fit
|
1.52 |
ENST00000465903.5
ENST00000485645.5
ENST00000472991.5
ENST00000467468.5
ENST00000469762.5
ENST00000357388.8
ENST00000489573.5
ENST00000462787.5
ENST00000490207.5
ENST00000485867.5
|
SMC4
|
structural maintenance of chromosomes 4
|
|
chr11_+_2902388
Show fit
|
1.32 |
ENST00000380574.5
|
SLC22A18
|
solute carrier family 22 member 18
|
|
chr8_-_123416327
Show fit
|
1.14 |
ENST00000521903.5
|
ATAD2
|
ATPase family AAA domain containing 2
|
|
chr1_-_41918666
Show fit
|
0.99 |
ENST00000372584.5
|
HIVEP3
|
HIVEP zinc finger 3
|
|
chr6_-_32184227
Show fit
|
0.91 |
ENST00000450110.5
ENST00000375067.7
ENST00000375056.6
|
AGER
|
advanced glycosylation end-product specific receptor
|
|
chr2_+_231707650
Show fit
|
0.90 |
ENST00000409321.5
|
PTMA
|
prothymosin alpha
|
|
chr6_+_12012304
Show fit
|
0.87 |
ENST00000379388.7
ENST00000627968.2
ENST00000541134.5
|
HIVEP1
|
HIVEP zinc finger 1
|
|
chr10_-_114684612
Show fit
|
0.84 |
ENST00000533213.6
ENST00000369252.8
|
ABLIM1
|
actin binding LIM protein 1
|
|
chr10_-_114684457
Show fit
|
0.82 |
ENST00000392955.7
|
ABLIM1
|
actin binding LIM protein 1
|
|
chr1_+_32013848
Show fit
|
0.70 |
ENST00000327300.12
ENST00000492989.1
|
KHDRBS1
|
KH RNA binding domain containing, signal transduction associated 1
|
|
chr12_-_48004496
Show fit
|
0.70 |
ENST00000337299.7
|
COL2A1
|
collagen type II alpha 1 chain
|
|
chr8_-_17722217
Show fit
|
0.69 |
ENST00000381861.7
|
MTUS1
|
microtubule associated scaffold protein 1
|
|
chr15_+_32717994
Show fit
|
0.67 |
ENST00000560677.5
ENST00000560830.1
ENST00000651154.1
|
GREM1
|
gremlin 1, DAN family BMP antagonist
|
|
chr15_-_82952683
Show fit
|
0.62 |
ENST00000450735.7
ENST00000304231.12
|
HOMER2
|
homer scaffold protein 2
|
|
chr17_+_81103998
Show fit
|
0.61 |
ENST00000572498.1
|
BAIAP2
|
BAR/IMD domain containing adaptor protein 2
|
|
chr12_-_48004467
Show fit
|
0.60 |
ENST00000380518.8
|
COL2A1
|
collagen type II alpha 1 chain
|
|
chr12_-_57846686
Show fit
|
0.59 |
ENST00000548823.1
ENST00000398073.7
|
CTDSP2
|
CTD small phosphatase 2
|
|
chr19_-_55279690
Show fit
|
0.45 |
ENST00000587959.1
ENST00000585927.1
ENST00000587922.5
ENST00000585698.1
|
HSPBP1
|
HSPA (Hsp70) binding protein 1
|
|
chr19_-_14112641
Show fit
|
0.42 |
ENST00000536649.5
|
PRKACA
|
protein kinase cAMP-activated catalytic subunit alpha
|
|
chr11_+_22666604
Show fit
|
0.38 |
ENST00000454584.6
|
GAS2
|
growth arrest specific 2
|
|
chr13_+_24270681
Show fit
|
0.22 |
ENST00000343003.10
ENST00000399949.6
|
SPATA13
|
spermatogenesis associated 13
|
|
chr22_+_41833079
Show fit
|
0.19 |
ENST00000612482.4
ENST00000361204.9
|
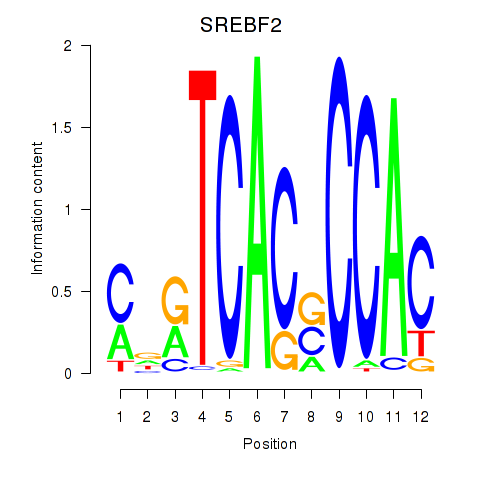
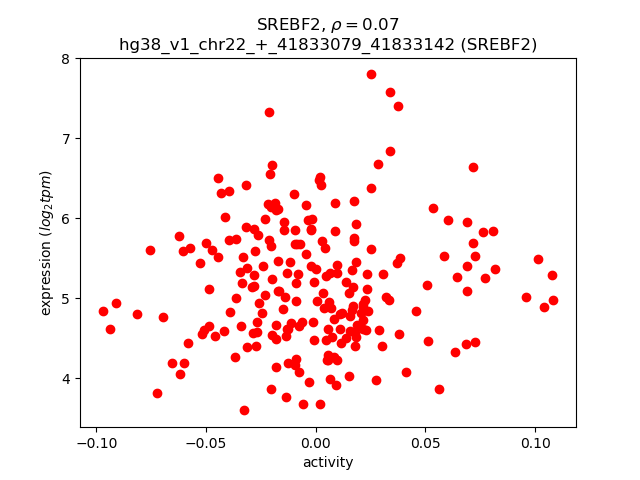
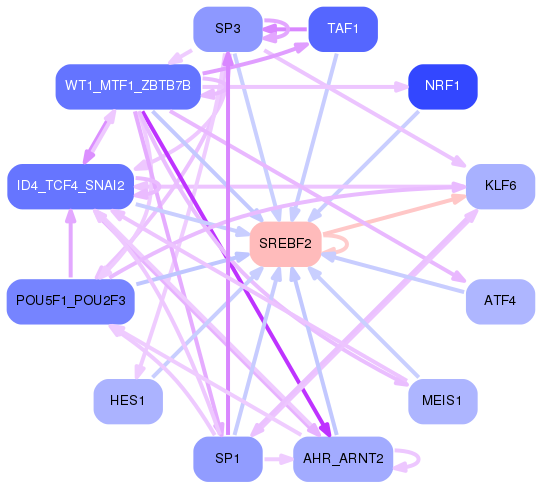
SREBF2
|
sterol regulatory element binding transcription factor 2
|
|
chr22_+_23772839
Show fit
|
0.18 |
ENST00000215743.8
|
MMP11
|
matrix metallopeptidase 11
|
|
chr10_-_50623897
Show fit
|
0.09 |
ENST00000361781.7
ENST00000429490.5
ENST00000619438.4
|
SGMS1
|
sphingomyelin synthase 1
|
|
chr3_-_171810432
Show fit
|
0.06 |
ENST00000356327.9
ENST00000351298.9
|
PLD1
|
phospholipase D1
|
|
chr1_+_206470463
Show fit
|
0.04 |
ENST00000581977.7
ENST00000578328.6
ENST00000584998.5
ENST00000579827.6
|
IKBKE
|
inhibitor of nuclear factor kappa B kinase subunit epsilon
|
|
chr15_-_72783685
Show fit
|
0.02 |
ENST00000456471.3
ENST00000311669.12
|
ADPGK
|
ADP dependent glucokinase
|
