Project
GNF SymAtlas + NCI-60 cancer cell lines, human (Su, 2004; Ross, 2000)
Navigation
Downloads
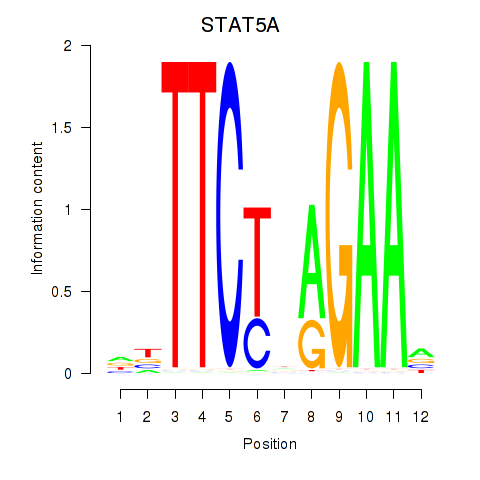
Results for STAT5A
Z-value: 1.33
Motif logo
Transcription factors associated with STAT5A
| Gene Symbol | Gene ID | Gene Info |
|---|---|---|
|
STAT5A
|
ENSG00000126561.18 | STAT5A |
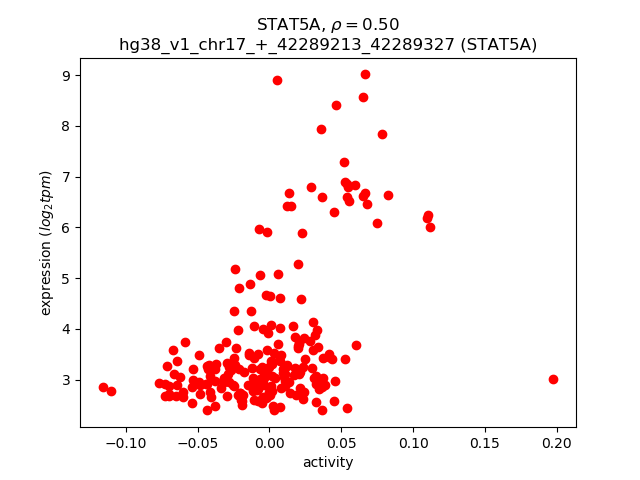
Activity-expression correlation:
| Gene | Promoter | Pearson corr. coef. | P-value | Plot |
|---|---|---|---|---|
| STAT5A | hg38_v1_chr17_+_42289213_42289327, hg38_v1_chr17_+_42288464_42288543, hg38_v1_chr17_+_42288429_42288448 | 0.50 | 6.5e-15 | Click! |
Activity profile of STAT5A motif
Sorted Z-values of STAT5A motif
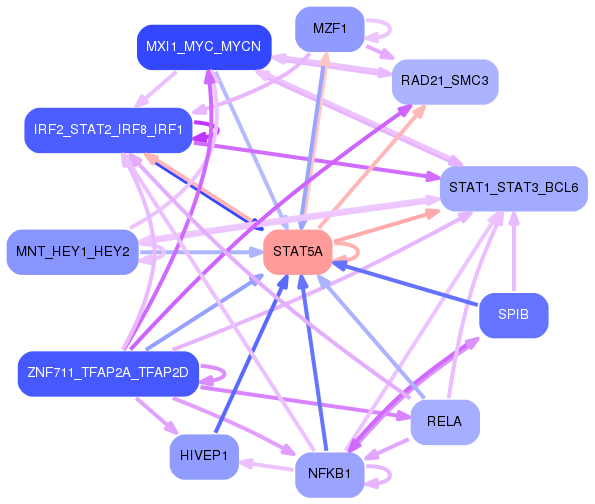
Network of associatons between targets according to the STRING database.

First level regulatory network of STAT5A
Gene Ontology Analysis
Gene overrepresentation in biological process category:
| Log-likelihood per target | Total log-likelihood | Term | Description |
|---|---|---|---|
| 10.2 | 30.7 | GO:0071461 | cellular response to redox state(GO:0071461) |
| 7.6 | 22.7 | GO:0097698 | telomere maintenance via base-excision repair(GO:0097698) |
| 5.5 | 16.4 | GO:0009786 | regulation of asymmetric cell division(GO:0009786) |
| 4.8 | 14.4 | GO:1902524 | positive regulation of protein K48-linked ubiquitination(GO:1902524) |
| 4.7 | 14.0 | GO:0036292 | DNA rewinding(GO:0036292) |
| 4.5 | 13.5 | GO:0018364 | peptidyl-glutamine methylation(GO:0018364) |
| 3.3 | 9.9 | GO:1903595 | positive regulation of histamine secretion by mast cell(GO:1903595) |
| 3.2 | 3.2 | GO:0060557 | positive regulation of vitamin metabolic process(GO:0046136) positive regulation of vitamin D biosynthetic process(GO:0060557) positive regulation of calcidiol 1-monooxygenase activity(GO:0060559) |
| 3.1 | 28.3 | GO:0045039 | protein import into mitochondrial inner membrane(GO:0045039) |
| 2.9 | 17.4 | GO:2000110 | negative regulation of macrophage apoptotic process(GO:2000110) |
| 2.9 | 11.5 | GO:0002357 | defense response to tumor cell(GO:0002357) |
| 2.9 | 11.4 | GO:0046121 | deoxyribonucleoside catabolic process(GO:0046121) |
| 2.8 | 11.1 | GO:0000961 | negative regulation of mitochondrial RNA catabolic process(GO:0000961) |
| 2.7 | 8.1 | GO:0072334 | UDP-galactose transport(GO:0015785) UDP-galactose transmembrane transport(GO:0072334) |
| 2.6 | 10.4 | GO:0006269 | DNA replication, synthesis of RNA primer(GO:0006269) |
| 2.6 | 20.4 | GO:0006659 | phosphatidylserine biosynthetic process(GO:0006659) |
| 2.5 | 15.0 | GO:2001184 | myoblast differentiation involved in skeletal muscle regeneration(GO:0014835) positive regulation of interleukin-12 secretion(GO:2001184) |
| 2.5 | 20.0 | GO:0044351 | macropinocytosis(GO:0044351) |
| 2.5 | 12.5 | GO:0008626 | granzyme-mediated apoptotic signaling pathway(GO:0008626) |
| 2.5 | 9.9 | GO:0048294 | negative regulation of mast cell cytokine production(GO:0032764) negative regulation of isotype switching to IgE isotypes(GO:0048294) |
| 2.5 | 4.9 | GO:2001274 | negative regulation of glucose import in response to insulin stimulus(GO:2001274) |
| 2.4 | 7.3 | GO:0043973 | histone H3-K4 acetylation(GO:0043973) |
| 2.4 | 12.1 | GO:0032747 | positive regulation of interleukin-23 production(GO:0032747) |
| 2.4 | 7.1 | GO:0005999 | xylulose biosynthetic process(GO:0005999) |
| 2.3 | 7.0 | GO:0046080 | dUTP metabolic process(GO:0046080) dUTP catabolic process(GO:0046081) |
| 2.2 | 6.7 | GO:0050717 | positive regulation of interleukin-1 alpha secretion(GO:0050717) |
| 2.2 | 8.8 | GO:0002370 | natural killer cell cytokine production(GO:0002370) regulation of natural killer cell cytokine production(GO:0002727) |
| 2.2 | 6.6 | GO:0090155 | negative regulation of sphingolipid biosynthetic process(GO:0090155) negative regulation of ceramide biosynthetic process(GO:1900060) |
| 2.2 | 17.2 | GO:0035694 | mitochondrial protein catabolic process(GO:0035694) |
| 2.1 | 15.0 | GO:0000255 | allantoin metabolic process(GO:0000255) |
| 2.0 | 12.0 | GO:0000973 | posttranscriptional tethering of RNA polymerase II gene DNA at nuclear periphery(GO:0000973) |
| 2.0 | 21.7 | GO:0060753 | regulation of mast cell chemotaxis(GO:0060753) |
| 1.9 | 9.7 | GO:0014900 | regulation of muscle hyperplasia(GO:0014738) muscle hyperplasia(GO:0014900) |
| 1.9 | 7.6 | GO:0002290 | gamma-delta T cell activation involved in immune response(GO:0002290) negative regulation of interferon-beta secretion(GO:0035548) regulation of gamma-delta T cell activation involved in immune response(GO:2001191) positive regulation of gamma-delta T cell activation involved in immune response(GO:2001193) |
| 1.8 | 5.5 | GO:1902161 | positive regulation of cyclic nucleotide-gated ion channel activity(GO:1902161) |
| 1.8 | 5.5 | GO:0044752 | response to human chorionic gonadotropin(GO:0044752) cellular response to thyroxine stimulus(GO:0097069) cellular response to L-phenylalanine derivative(GO:1904387) |
| 1.8 | 5.5 | GO:0044034 | negative stranded viral RNA replication(GO:0039689) multi-organism biosynthetic process(GO:0044034) |
| 1.8 | 3.6 | GO:0036265 | RNA (guanine-N7)-methylation(GO:0036265) rRNA (guanine-N7)-methylation(GO:0070476) |
| 1.8 | 5.3 | GO:0070213 | protein auto-ADP-ribosylation(GO:0070213) |
| 1.8 | 5.3 | GO:1901301 | regulation of cargo loading into COPII-coated vesicle(GO:1901301) |
| 1.7 | 5.2 | GO:0035732 | nitric oxide storage(GO:0035732) |
| 1.7 | 5.2 | GO:0044278 | cell wall disruption in other organism(GO:0044278) |
| 1.7 | 8.6 | GO:1900264 | regulation of DNA-directed DNA polymerase activity(GO:1900262) positive regulation of DNA-directed DNA polymerase activity(GO:1900264) |
| 1.7 | 15.3 | GO:2000332 | response to linoleic acid(GO:0070543) blood microparticle formation(GO:0072564) regulation of blood microparticle formation(GO:2000332) positive regulation of blood microparticle formation(GO:2000334) |
| 1.7 | 5.1 | GO:0070272 | proton-transporting ATP synthase complex assembly(GO:0043461) proton-transporting ATP synthase complex biogenesis(GO:0070272) |
| 1.7 | 5.0 | GO:0071603 | endothelial cell-cell adhesion(GO:0071603) |
| 1.7 | 78.4 | GO:0032731 | positive regulation of interleukin-1 beta production(GO:0032731) |
| 1.7 | 9.9 | GO:0010032 | meiotic chromosome condensation(GO:0010032) |
| 1.6 | 6.5 | GO:0051257 | meiotic metaphase I plate congression(GO:0043060) meiotic spindle midzone assembly(GO:0051257) meiotic metaphase plate congression(GO:0051311) |
| 1.6 | 8.1 | GO:0015862 | uridine transport(GO:0015862) |
| 1.6 | 4.8 | GO:0007518 | myoblast fate determination(GO:0007518) |
| 1.6 | 4.8 | GO:0018160 | peptidyl-pyrromethane cofactor linkage(GO:0018160) |
| 1.5 | 3.1 | GO:0006382 | adenosine to inosine editing(GO:0006382) |
| 1.5 | 7.6 | GO:0060161 | positive regulation of dopamine receptor signaling pathway(GO:0060161) |
| 1.5 | 4.4 | GO:0042495 | detection of bacterial lipoprotein(GO:0042494) detection of triacyl bacterial lipopeptide(GO:0042495) detection of bacterial lipopeptide(GO:0070340) |
| 1.5 | 13.1 | GO:1902416 | positive regulation of mRNA binding(GO:1902416) |
| 1.4 | 8.5 | GO:0043987 | histone H3-S10 phosphorylation(GO:0043987) |
| 1.4 | 7.0 | GO:1902896 | terminal web assembly(GO:1902896) |
| 1.3 | 5.3 | GO:0015855 | canalicular bile acid transport(GO:0015722) pyrimidine nucleobase transport(GO:0015855) urea transmembrane transport(GO:0071918) purine nucleobase transmembrane transport(GO:1904823) |
| 1.3 | 10.4 | GO:0036337 | Fas signaling pathway(GO:0036337) |
| 1.3 | 6.4 | GO:0044791 | modulation by host of viral release from host cell(GO:0044789) positive regulation by host of viral release from host cell(GO:0044791) |
| 1.2 | 3.7 | GO:0070682 | proteasome regulatory particle assembly(GO:0070682) |
| 1.2 | 3.6 | GO:0002339 | B cell selection(GO:0002339) |
| 1.2 | 4.8 | GO:0006049 | UDP-N-acetylglucosamine catabolic process(GO:0006049) |
| 1.2 | 4.8 | GO:0007113 | endomitotic cell cycle(GO:0007113) |
| 1.2 | 4.8 | GO:0060708 | spongiotrophoblast differentiation(GO:0060708) |
| 1.1 | 14.8 | GO:0045059 | positive thymic T cell selection(GO:0045059) |
| 1.1 | 7.9 | GO:1904798 | positive regulation of core promoter binding(GO:1904798) |
| 1.1 | 6.7 | GO:0060370 | susceptibility to T cell mediated cytotoxicity(GO:0060370) |
| 1.1 | 15.2 | GO:0070934 | CRD-mediated mRNA stabilization(GO:0070934) |
| 1.1 | 3.2 | GO:1904882 | telomerase catalytic core complex assembly(GO:1904868) regulation of telomerase catalytic core complex assembly(GO:1904882) positive regulation of telomerase catalytic core complex assembly(GO:1904884) |
| 1.0 | 4.2 | GO:0090290 | positive regulation of osteoclast proliferation(GO:0090290) |
| 1.0 | 5.2 | GO:2001271 | negative regulation of cysteine-type endopeptidase activity involved in execution phase of apoptosis(GO:2001271) |
| 1.0 | 4.0 | GO:1904502 | regulation of lipophagy(GO:1904502) positive regulation of lipophagy(GO:1904504) |
| 1.0 | 5.9 | GO:0032252 | secretory granule localization(GO:0032252) |
| 1.0 | 17.7 | GO:0045899 | positive regulation of RNA polymerase II transcriptional preinitiation complex assembly(GO:0045899) |
| 1.0 | 12.7 | GO:2001032 | regulation of double-strand break repair via nonhomologous end joining(GO:2001032) |
| 1.0 | 1.9 | GO:0002329 | pre-B cell differentiation(GO:0002329) pre-B cell allelic exclusion(GO:0002331) |
| 1.0 | 2.9 | GO:0034476 | U1 snRNA 3'-end processing(GO:0034473) U5 snRNA 3'-end processing(GO:0034476) |
| 1.0 | 1.9 | GO:0006447 | regulation of translational initiation by iron(GO:0006447) |
| 1.0 | 5.7 | GO:0010751 | negative regulation of nitric oxide mediated signal transduction(GO:0010751) |
| 1.0 | 3.8 | GO:0030961 | peptidyl-arginine hydroxylation(GO:0030961) |
| 0.9 | 4.7 | GO:2000563 | positive regulation of CD4-positive, alpha-beta T cell proliferation(GO:2000563) |
| 0.9 | 3.7 | GO:0035610 | protein side chain deglutamylation(GO:0035610) |
| 0.9 | 8.4 | GO:0060574 | intestinal epithelial cell maturation(GO:0060574) |
| 0.9 | 7.4 | GO:1901856 | negative regulation of cellular respiration(GO:1901856) |
| 0.9 | 5.5 | GO:0032383 | regulation of intracellular lipid transport(GO:0032377) regulation of intracellular sterol transport(GO:0032380) regulation of intracellular cholesterol transport(GO:0032383) |
| 0.9 | 2.7 | GO:0016107 | sesquiterpenoid metabolic process(GO:0006714) sesquiterpenoid catabolic process(GO:0016107) farnesol metabolic process(GO:0016487) farnesol catabolic process(GO:0016488) regulation of testosterone biosynthetic process(GO:2000224) |
| 0.9 | 7.3 | GO:0072733 | response to staurosporine(GO:0072733) cellular response to staurosporine(GO:0072734) |
| 0.9 | 4.5 | GO:0031291 | Ran protein signal transduction(GO:0031291) |
| 0.9 | 16.2 | GO:0071803 | positive regulation of podosome assembly(GO:0071803) |
| 0.9 | 1.8 | GO:0071725 | toll-like receptor TLR1:TLR2 signaling pathway(GO:0038123) toll-like receptor TLR6:TLR2 signaling pathway(GO:0038124) response to diacyl bacterial lipopeptide(GO:0071724) response to triacyl bacterial lipopeptide(GO:0071725) cellular response to diacyl bacterial lipopeptide(GO:0071726) cellular response to triacyl bacterial lipopeptide(GO:0071727) |
| 0.9 | 3.6 | GO:0033313 | meiotic cell cycle checkpoint(GO:0033313) |
| 0.9 | 4.4 | GO:1903377 | negative regulation of oxidative stress-induced neuron intrinsic apoptotic signaling pathway(GO:1903377) |
| 0.9 | 3.5 | GO:0045903 | positive regulation of translational fidelity(GO:0045903) |
| 0.9 | 16.5 | GO:0007064 | mitotic sister chromatid cohesion(GO:0007064) |
| 0.9 | 1.7 | GO:0002581 | negative regulation of antigen processing and presentation of peptide or polysaccharide antigen via MHC class II(GO:0002581) |
| 0.9 | 21.6 | GO:0032201 | telomere maintenance via semi-conservative replication(GO:0032201) |
| 0.9 | 7.7 | GO:0006265 | DNA topological change(GO:0006265) |
| 0.9 | 5.1 | GO:0016554 | cytidine to uridine editing(GO:0016554) |
| 0.8 | 4.2 | GO:0002381 | immunoglobulin production involved in immunoglobulin mediated immune response(GO:0002381) |
| 0.8 | 5.8 | GO:0010792 | DNA double-strand break processing involved in repair via single-strand annealing(GO:0010792) |
| 0.8 | 2.4 | GO:1902766 | skeletal muscle satellite cell migration(GO:1902766) |
| 0.8 | 2.4 | GO:0060739 | mesenchymal-epithelial cell signaling involved in prostate gland development(GO:0060739) |
| 0.8 | 6.4 | GO:0045959 | regulation of complement activation, classical pathway(GO:0030450) negative regulation of complement activation, classical pathway(GO:0045959) regulation of opsonization(GO:1903027) |
| 0.8 | 2.4 | GO:1902576 | negative regulation of nuclear cell cycle DNA replication(GO:1902576) negative regulation of mitotic cell cycle DNA replication(GO:1903464) |
| 0.8 | 7.1 | GO:0045617 | negative regulation of keratinocyte differentiation(GO:0045617) |
| 0.8 | 28.9 | GO:0035455 | response to interferon-alpha(GO:0035455) |
| 0.8 | 3.9 | GO:1902459 | positive regulation of stem cell population maintenance(GO:1902459) |
| 0.8 | 4.6 | GO:2000825 | positive regulation of androgen receptor activity(GO:2000825) |
| 0.7 | 2.2 | GO:1990918 | meiotic DNA double-strand break processing(GO:0000706) double-strand break repair involved in meiotic recombination(GO:1990918) |
| 0.7 | 5.0 | GO:0000389 | mRNA 3'-splice site recognition(GO:0000389) |
| 0.7 | 2.8 | GO:1904715 | negative regulation of chaperone-mediated autophagy(GO:1904715) |
| 0.7 | 1.4 | GO:0043932 | ossification involved in bone remodeling(GO:0043932) |
| 0.7 | 2.1 | GO:1990654 | regulation of extrathymic T cell differentiation(GO:0033082) sebum secreting cell proliferation(GO:1990654) |
| 0.7 | 4.8 | GO:0007195 | adenylate cyclase-inhibiting dopamine receptor signaling pathway(GO:0007195) |
| 0.7 | 8.8 | GO:0060261 | positive regulation of transcription initiation from RNA polymerase II promoter(GO:0060261) |
| 0.7 | 5.4 | GO:0006848 | pyruvate transport(GO:0006848) pyruvate transmembrane transport(GO:1901475) |
| 0.7 | 2.0 | GO:2000002 | negative regulation of DNA damage checkpoint(GO:2000002) |
| 0.6 | 5.8 | GO:0032790 | ribosome disassembly(GO:0032790) |
| 0.6 | 7.7 | GO:0042407 | cristae formation(GO:0042407) |
| 0.6 | 2.6 | GO:2000569 | T-helper 2 cell activation(GO:0035712) regulation of T-helper 2 cell activation(GO:2000569) positive regulation of T-helper 2 cell activation(GO:2000570) |
| 0.6 | 5.7 | GO:0046125 | thymidine metabolic process(GO:0046104) pyrimidine deoxyribonucleoside metabolic process(GO:0046125) |
| 0.6 | 2.5 | GO:0000379 | tRNA-type intron splice site recognition and cleavage(GO:0000379) |
| 0.6 | 6.2 | GO:0018377 | protein myristoylation(GO:0018377) |
| 0.6 | 6.7 | GO:1904424 | regulation of GTP binding(GO:1904424) |
| 0.6 | 10.3 | GO:0045779 | negative regulation of bone resorption(GO:0045779) |
| 0.6 | 7.8 | GO:0071044 | histone mRNA catabolic process(GO:0071044) |
| 0.6 | 5.3 | GO:0060267 | positive regulation of respiratory burst(GO:0060267) |
| 0.6 | 16.4 | GO:0048025 | negative regulation of mRNA splicing, via spliceosome(GO:0048025) |
| 0.6 | 9.7 | GO:0071361 | cellular response to ethanol(GO:0071361) |
| 0.6 | 6.2 | GO:0010756 | positive regulation of plasminogen activation(GO:0010756) |
| 0.6 | 20.2 | GO:0006376 | mRNA splice site selection(GO:0006376) |
| 0.6 | 9.0 | GO:1903800 | positive regulation of production of miRNAs involved in gene silencing by miRNA(GO:1903800) |
| 0.6 | 6.1 | GO:0000056 | ribosomal small subunit export from nucleus(GO:0000056) |
| 0.6 | 2.2 | GO:2000354 | regulation of ovarian follicle development(GO:2000354) |
| 0.5 | 3.3 | GO:0034134 | toll-like receptor 2 signaling pathway(GO:0034134) |
| 0.5 | 1.6 | GO:0035880 | embryonic nail plate morphogenesis(GO:0035880) |
| 0.5 | 4.8 | GO:0043353 | enucleate erythrocyte differentiation(GO:0043353) |
| 0.5 | 1.1 | GO:0002876 | positive regulation of chronic inflammatory response to antigenic stimulus(GO:0002876) |
| 0.5 | 4.7 | GO:0007023 | post-chaperonin tubulin folding pathway(GO:0007023) |
| 0.5 | 3.6 | GO:2000270 | negative regulation of fibroblast apoptotic process(GO:2000270) |
| 0.5 | 1.0 | GO:0035915 | pore formation in membrane of other organism(GO:0035915) |
| 0.5 | 13.8 | GO:0050869 | negative regulation of B cell activation(GO:0050869) |
| 0.5 | 3.1 | GO:2001206 | positive regulation of osteoclast development(GO:2001206) |
| 0.5 | 4.0 | GO:0007068 | negative regulation of transcription during mitosis(GO:0007068) negative regulation of transcription from RNA polymerase II promoter during mitosis(GO:0007070) |
| 0.5 | 2.4 | GO:1990426 | homologous recombination-dependent replication fork processing(GO:1990426) |
| 0.5 | 1.4 | GO:0072365 | regulation of cellular ketone metabolic process by negative regulation of transcription from RNA polymerase II promoter(GO:0072365) |
| 0.5 | 3.3 | GO:0060235 | lens induction in camera-type eye(GO:0060235) |
| 0.5 | 7.4 | GO:0034356 | NAD biosynthesis via nicotinamide riboside salvage pathway(GO:0034356) |
| 0.5 | 2.7 | GO:1904431 | positive regulation of t-circle formation(GO:1904431) |
| 0.5 | 2.7 | GO:0051694 | pointed-end actin filament capping(GO:0051694) |
| 0.4 | 5.8 | GO:1904293 | negative regulation of ERAD pathway(GO:1904293) |
| 0.4 | 3.6 | GO:0045040 | protein import into mitochondrial outer membrane(GO:0045040) |
| 0.4 | 0.9 | GO:0097325 | melanocyte proliferation(GO:0097325) |
| 0.4 | 2.2 | GO:2000542 | regulation of endodermal cell differentiation(GO:1903224) negative regulation of gastrulation(GO:2000542) |
| 0.4 | 2.2 | GO:0060298 | positive regulation of sarcomere organization(GO:0060298) |
| 0.4 | 3.9 | GO:0010818 | T cell chemotaxis(GO:0010818) |
| 0.4 | 4.3 | GO:0021520 | spinal cord motor neuron cell fate specification(GO:0021520) |
| 0.4 | 8.9 | GO:1901741 | positive regulation of myoblast fusion(GO:1901741) |
| 0.4 | 3.8 | GO:0071492 | cellular response to UV-A(GO:0071492) |
| 0.4 | 2.9 | GO:0061087 | positive regulation of histone H3-K27 methylation(GO:0061087) |
| 0.4 | 9.7 | GO:0007095 | mitotic G2 DNA damage checkpoint(GO:0007095) |
| 0.4 | 15.1 | GO:0000245 | spliceosomal complex assembly(GO:0000245) |
| 0.4 | 2.1 | GO:2000210 | positive regulation of anoikis(GO:2000210) |
| 0.4 | 31.7 | GO:0045576 | mast cell activation(GO:0045576) |
| 0.4 | 2.5 | GO:0008218 | bioluminescence(GO:0008218) |
| 0.4 | 8.6 | GO:0023058 | adaptation of signaling pathway(GO:0023058) |
| 0.4 | 6.5 | GO:0042340 | keratan sulfate catabolic process(GO:0042340) |
| 0.4 | 2.8 | GO:2000253 | positive regulation of feeding behavior(GO:2000253) |
| 0.4 | 26.2 | GO:0045071 | negative regulation of viral genome replication(GO:0045071) |
| 0.4 | 3.6 | GO:0033148 | positive regulation of intracellular estrogen receptor signaling pathway(GO:0033148) |
| 0.4 | 7.6 | GO:0031639 | plasminogen activation(GO:0031639) |
| 0.4 | 6.2 | GO:0043555 | regulation of translation in response to stress(GO:0043555) |
| 0.4 | 3.5 | GO:0032057 | negative regulation of translational initiation in response to stress(GO:0032057) |
| 0.4 | 22.7 | GO:0016445 | somatic diversification of immunoglobulins(GO:0016445) |
| 0.4 | 1.5 | GO:0045074 | interleukin-10 biosynthetic process(GO:0042091) regulation of interleukin-10 biosynthetic process(GO:0045074) |
| 0.4 | 27.8 | GO:0070125 | mitochondrial translational elongation(GO:0070125) mitochondrial translational termination(GO:0070126) |
| 0.4 | 1.1 | GO:0001544 | initiation of primordial ovarian follicle growth(GO:0001544) |
| 0.4 | 2.6 | GO:0032218 | riboflavin transport(GO:0032218) |
| 0.4 | 6.2 | GO:0001765 | membrane raft assembly(GO:0001765) |
| 0.4 | 2.9 | GO:0002074 | extraocular skeletal muscle development(GO:0002074) |
| 0.4 | 2.1 | GO:0014067 | negative regulation of phosphatidylinositol 3-kinase signaling(GO:0014067) |
| 0.4 | 7.4 | GO:0045730 | respiratory burst(GO:0045730) |
| 0.4 | 1.1 | GO:0098905 | regulation of bundle of His cell action potential(GO:0098905) |
| 0.4 | 2.8 | GO:0042226 | interleukin-6 biosynthetic process(GO:0042226) |
| 0.4 | 1.8 | GO:0014004 | microglia differentiation(GO:0014004) microglia development(GO:0014005) |
| 0.3 | 3.1 | GO:0001672 | regulation of chromatin assembly or disassembly(GO:0001672) |
| 0.3 | 1.0 | GO:0045062 | extrathymic T cell selection(GO:0045062) |
| 0.3 | 3.4 | GO:0051451 | myoblast migration(GO:0051451) |
| 0.3 | 5.2 | GO:0050862 | positive regulation of T cell receptor signaling pathway(GO:0050862) |
| 0.3 | 0.7 | GO:0070141 | response to UV-A(GO:0070141) |
| 0.3 | 0.6 | GO:0070212 | protein poly-ADP-ribosylation(GO:0070212) |
| 0.3 | 5.4 | GO:0003334 | keratinocyte development(GO:0003334) |
| 0.3 | 2.2 | GO:0000012 | single strand break repair(GO:0000012) |
| 0.3 | 6.3 | GO:0007172 | signal complex assembly(GO:0007172) |
| 0.3 | 5.3 | GO:0019371 | cyclooxygenase pathway(GO:0019371) |
| 0.3 | 6.6 | GO:0032506 | cytokinetic process(GO:0032506) |
| 0.3 | 3.1 | GO:0071763 | nuclear membrane organization(GO:0071763) |
| 0.3 | 1.2 | GO:0010430 | fatty acid omega-oxidation(GO:0010430) |
| 0.3 | 2.4 | GO:1904646 | cellular response to beta-amyloid(GO:1904646) |
| 0.3 | 0.6 | GO:0018879 | biphenyl metabolic process(GO:0018879) |
| 0.3 | 0.6 | GO:1901859 | negative regulation of mitochondrial DNA replication(GO:0090298) negative regulation of mitochondrial DNA metabolic process(GO:1901859) |
| 0.3 | 4.4 | GO:0016576 | histone dephosphorylation(GO:0016576) |
| 0.3 | 4.3 | GO:0070389 | chaperone cofactor-dependent protein refolding(GO:0070389) |
| 0.3 | 26.5 | GO:0031295 | T cell costimulation(GO:0031295) |
| 0.3 | 4.5 | GO:0031629 | synaptic vesicle fusion to presynaptic active zone membrane(GO:0031629) vesicle fusion to plasma membrane(GO:0099500) |
| 0.3 | 3.7 | GO:0010839 | negative regulation of keratinocyte proliferation(GO:0010839) |
| 0.3 | 3.6 | GO:1904355 | positive regulation of telomere capping(GO:1904355) |
| 0.3 | 5.8 | GO:0042347 | negative regulation of NF-kappaB import into nucleus(GO:0042347) |
| 0.3 | 1.9 | GO:0033211 | adiponectin-activated signaling pathway(GO:0033211) |
| 0.3 | 2.4 | GO:1901409 | positive regulation of phosphorylation of RNA polymerase II C-terminal domain(GO:1901409) |
| 0.3 | 5.0 | GO:0050860 | negative regulation of T cell receptor signaling pathway(GO:0050860) |
| 0.3 | 2.6 | GO:0015871 | choline transport(GO:0015871) |
| 0.3 | 2.4 | GO:0060613 | fat pad development(GO:0060613) |
| 0.3 | 1.3 | GO:0060685 | regulation of prostatic bud formation(GO:0060685) negative regulation of prostatic bud formation(GO:0060686) |
| 0.3 | 0.8 | GO:0031064 | negative regulation of histone deacetylation(GO:0031064) |
| 0.3 | 3.3 | GO:2001300 | lipoxin metabolic process(GO:2001300) |
| 0.2 | 1.5 | GO:0045591 | positive regulation of regulatory T cell differentiation(GO:0045591) |
| 0.2 | 1.7 | GO:1903895 | negative regulation of IRE1-mediated unfolded protein response(GO:1903895) |
| 0.2 | 2.7 | GO:0048007 | antigen processing and presentation of lipid antigen via MHC class Ib(GO:0048003) antigen processing and presentation, exogenous lipid antigen via MHC class Ib(GO:0048007) |
| 0.2 | 3.1 | GO:2000059 | negative regulation of protein ubiquitination involved in ubiquitin-dependent protein catabolic process(GO:2000059) |
| 0.2 | 1.9 | GO:0006307 | DNA dealkylation involved in DNA repair(GO:0006307) |
| 0.2 | 8.1 | GO:0071431 | tRNA export from nucleus(GO:0006409) tRNA-containing ribonucleoprotein complex export from nucleus(GO:0071431) |
| 0.2 | 14.2 | GO:0002377 | immunoglobulin production(GO:0002377) |
| 0.2 | 1.4 | GO:0060316 | positive regulation of ryanodine-sensitive calcium-release channel activity(GO:0060316) |
| 0.2 | 5.2 | GO:0006337 | nucleosome disassembly(GO:0006337) chromatin disassembly(GO:0031498) |
| 0.2 | 16.8 | GO:0002479 | antigen processing and presentation of exogenous peptide antigen via MHC class I, TAP-dependent(GO:0002479) |
| 0.2 | 2.4 | GO:0070986 | left/right axis specification(GO:0070986) |
| 0.2 | 1.5 | GO:0045654 | positive regulation of megakaryocyte differentiation(GO:0045654) |
| 0.2 | 0.4 | GO:0048850 | hypophysis morphogenesis(GO:0048850) diencephalon morphogenesis(GO:0048852) |
| 0.2 | 4.6 | GO:0060334 | regulation of response to interferon-gamma(GO:0060330) regulation of interferon-gamma-mediated signaling pathway(GO:0060334) |
| 0.2 | 3.0 | GO:0009435 | NAD biosynthetic process(GO:0009435) |
| 0.2 | 7.4 | GO:0046655 | folic acid metabolic process(GO:0046655) |
| 0.2 | 1.3 | GO:0060972 | left/right pattern formation(GO:0060972) |
| 0.2 | 0.8 | GO:0035750 | protein localization to myelin sheath abaxonal region(GO:0035750) |
| 0.2 | 1.2 | GO:0003406 | retinal pigment epithelium development(GO:0003406) |
| 0.2 | 2.9 | GO:0098719 | sodium ion import across plasma membrane(GO:0098719) sodium ion import into cell(GO:1990118) |
| 0.2 | 2.9 | GO:0042276 | error-prone translesion synthesis(GO:0042276) |
| 0.2 | 8.0 | GO:0000027 | ribosomal large subunit assembly(GO:0000027) |
| 0.2 | 1.0 | GO:0098706 | ferric iron import(GO:0033216) ferric iron import into cell(GO:0097461) ferric iron import across plasma membrane(GO:0098706) |
| 0.2 | 25.7 | GO:0043484 | regulation of RNA splicing(GO:0043484) |
| 0.2 | 26.1 | GO:0002431 | Fc receptor mediated stimulatory signaling pathway(GO:0002431) immune response-regulating cell surface receptor signaling pathway involved in phagocytosis(GO:0002433) Fc-gamma receptor signaling pathway involved in phagocytosis(GO:0038096) |
| 0.2 | 11.4 | GO:0071357 | type I interferon signaling pathway(GO:0060337) cellular response to type I interferon(GO:0071357) |
| 0.2 | 1.6 | GO:0042094 | interleukin-2 biosynthetic process(GO:0042094) |
| 0.2 | 4.3 | GO:0000387 | spliceosomal snRNP assembly(GO:0000387) |
| 0.2 | 0.8 | GO:0046368 | GDP-L-fucose metabolic process(GO:0046368) |
| 0.2 | 1.8 | GO:0086024 | adrenergic receptor signaling pathway involved in positive regulation of heart rate(GO:0086024) |
| 0.2 | 1.4 | GO:0008295 | spermidine biosynthetic process(GO:0008295) |
| 0.2 | 2.7 | GO:0006558 | L-phenylalanine metabolic process(GO:0006558) L-phenylalanine catabolic process(GO:0006559) erythrose 4-phosphate/phosphoenolpyruvate family amino acid metabolic process(GO:1902221) erythrose 4-phosphate/phosphoenolpyruvate family amino acid catabolic process(GO:1902222) |
| 0.2 | 8.7 | GO:0038083 | peptidyl-tyrosine autophosphorylation(GO:0038083) |
| 0.2 | 0.4 | GO:0014016 | neuroblast differentiation(GO:0014016) |
| 0.2 | 1.5 | GO:1904262 | negative regulation of TORC1 signaling(GO:1904262) |
| 0.2 | 4.9 | GO:0072348 | sulfur compound transport(GO:0072348) |
| 0.2 | 5.0 | GO:0032012 | regulation of ARF protein signal transduction(GO:0032012) |
| 0.2 | 0.5 | GO:0035234 | ectopic germ cell programmed cell death(GO:0035234) |
| 0.2 | 3.5 | GO:0045948 | positive regulation of translational initiation(GO:0045948) |
| 0.2 | 1.0 | GO:0071351 | interleukin-18-mediated signaling pathway(GO:0035655) cellular response to interleukin-18(GO:0071351) |
| 0.2 | 5.8 | GO:0046856 | phosphatidylinositol dephosphorylation(GO:0046856) |
| 0.2 | 5.9 | GO:1900077 | negative regulation of insulin receptor signaling pathway(GO:0046627) negative regulation of cellular response to insulin stimulus(GO:1900077) |
| 0.2 | 1.5 | GO:0018401 | peptidyl-proline hydroxylation to 4-hydroxy-L-proline(GO:0018401) |
| 0.2 | 0.5 | GO:0036111 | very long-chain fatty-acyl-CoA metabolic process(GO:0036111) |
| 0.2 | 3.3 | GO:0019985 | translesion synthesis(GO:0019985) |
| 0.2 | 1.6 | GO:0006268 | DNA unwinding involved in DNA replication(GO:0006268) |
| 0.2 | 14.2 | GO:0043488 | regulation of mRNA stability(GO:0043488) |
| 0.2 | 7.0 | GO:0003382 | epithelial cell morphogenesis(GO:0003382) |
| 0.2 | 3.6 | GO:0030488 | tRNA methylation(GO:0030488) |
| 0.2 | 0.8 | GO:0015742 | alpha-ketoglutarate transport(GO:0015742) |
| 0.1 | 2.1 | GO:0060632 | regulation of microtubule-based movement(GO:0060632) |
| 0.1 | 1.3 | GO:0040016 | embryonic cleavage(GO:0040016) |
| 0.1 | 1.8 | GO:0044030 | regulation of DNA methylation(GO:0044030) |
| 0.1 | 6.0 | GO:0006099 | tricarboxylic acid cycle(GO:0006099) |
| 0.1 | 3.2 | GO:0060216 | definitive hemopoiesis(GO:0060216) |
| 0.1 | 0.6 | GO:0015670 | carbon dioxide transport(GO:0015670) |
| 0.1 | 2.4 | GO:0032418 | lysosome localization(GO:0032418) |
| 0.1 | 11.4 | GO:0010923 | negative regulation of phosphatase activity(GO:0010923) |
| 0.1 | 4.7 | GO:0031055 | chromatin remodeling at centromere(GO:0031055) CENP-A containing nucleosome assembly(GO:0034080) CENP-A containing chromatin organization(GO:0061641) |
| 0.1 | 1.1 | GO:0016255 | attachment of GPI anchor to protein(GO:0016255) |
| 0.1 | 0.1 | GO:0060480 | lung goblet cell differentiation(GO:0060480) |
| 0.1 | 2.3 | GO:1903830 | magnesium ion transmembrane transport(GO:1903830) |
| 0.1 | 0.8 | GO:2001023 | regulation of response to drug(GO:2001023) |
| 0.1 | 3.1 | GO:0090503 | RNA phosphodiester bond hydrolysis, exonucleolytic(GO:0090503) |
| 0.1 | 3.1 | GO:0030214 | hyaluronan catabolic process(GO:0030214) |
| 0.1 | 1.0 | GO:1900017 | positive regulation of cytokine production involved in inflammatory response(GO:1900017) |
| 0.1 | 0.2 | GO:0032431 | activation of phospholipase A2 activity(GO:0032431) |
| 0.1 | 0.6 | GO:1902412 | regulation of mitotic cytokinesis(GO:1902412) |
| 0.1 | 3.0 | GO:0034204 | lipid translocation(GO:0034204) phospholipid translocation(GO:0045332) |
| 0.1 | 1.3 | GO:2001288 | positive regulation of caveolin-mediated endocytosis(GO:2001288) |
| 0.1 | 3.8 | GO:0007140 | male meiosis(GO:0007140) |
| 0.1 | 11.5 | GO:0007062 | sister chromatid cohesion(GO:0007062) |
| 0.1 | 0.3 | GO:0097210 | response to gonadotropin-releasing hormone(GO:0097210) cellular response to gonadotropin-releasing hormone(GO:0097211) |
| 0.1 | 4.0 | GO:0017145 | stem cell division(GO:0017145) |
| 0.1 | 0.7 | GO:0002933 | lipid hydroxylation(GO:0002933) |
| 0.1 | 5.4 | GO:0072431 | DNA damage response, signal transduction by p53 class mediator resulting in cell cycle arrest(GO:0006977) signal transduction involved in mitotic cell cycle checkpoint(GO:0072413) signal transduction involved in mitotic G1 DNA damage checkpoint(GO:0072431) intracellular signal transduction involved in G1 DNA damage checkpoint(GO:1902400) signal transduction involved in mitotic DNA damage checkpoint(GO:1902402) signal transduction involved in mitotic DNA integrity checkpoint(GO:1902403) |
| 0.1 | 0.8 | GO:0006013 | mannose metabolic process(GO:0006013) |
| 0.1 | 6.6 | GO:0002181 | cytoplasmic translation(GO:0002181) |
| 0.1 | 0.8 | GO:1902748 | melanocyte migration(GO:0097324) positive regulation of lens fiber cell differentiation(GO:1902748) |
| 0.1 | 3.5 | GO:0043252 | sodium-independent organic anion transport(GO:0043252) |
| 0.1 | 0.3 | GO:0070409 | carbamoyl phosphate metabolic process(GO:0070408) carbamoyl phosphate biosynthetic process(GO:0070409) cellular response to oleic acid(GO:0071400) response to ammonia(GO:1903717) cellular response to ammonia(GO:1903718) |
| 0.1 | 0.9 | GO:2000641 | regulation of early endosome to late endosome transport(GO:2000641) |
| 0.1 | 1.6 | GO:0035520 | monoubiquitinated protein deubiquitination(GO:0035520) |
| 0.1 | 6.5 | GO:0002223 | stimulatory C-type lectin receptor signaling pathway(GO:0002223) |
| 0.1 | 4.8 | GO:0030101 | natural killer cell activation(GO:0030101) |
| 0.1 | 3.3 | GO:0042273 | ribosomal large subunit biogenesis(GO:0042273) |
| 0.1 | 0.2 | GO:0072709 | cellular response to sorbitol(GO:0072709) |
| 0.1 | 0.4 | GO:0033227 | dsRNA transport(GO:0033227) |
| 0.1 | 8.1 | GO:0035335 | peptidyl-tyrosine dephosphorylation(GO:0035335) |
| 0.1 | 0.2 | GO:0051344 | negative regulation of cyclic-nucleotide phosphodiesterase activity(GO:0051344) |
| 0.1 | 0.5 | GO:0030951 | establishment or maintenance of microtubule cytoskeleton polarity(GO:0030951) sterol regulatory element binding protein import into nucleus(GO:0035105) |
| 0.1 | 0.8 | GO:0051984 | positive regulation of chromosome segregation(GO:0051984) |
| 0.1 | 3.5 | GO:0080171 | lysosome organization(GO:0007040) lytic vacuole organization(GO:0080171) |
| 0.1 | 2.5 | GO:0019731 | antibacterial humoral response(GO:0019731) |
| 0.1 | 3.3 | GO:0045604 | regulation of epidermal cell differentiation(GO:0045604) |
| 0.1 | 1.6 | GO:0042267 | natural killer cell mediated cytotoxicity(GO:0042267) |
| 0.1 | 0.1 | GO:0016999 | antibiotic metabolic process(GO:0016999) cellular amide catabolic process(GO:0043605) |
| 0.1 | 4.1 | GO:0010507 | negative regulation of autophagy(GO:0010507) |
| 0.1 | 1.9 | GO:1904667 | negative regulation of ubiquitin-protein ligase activity involved in mitotic cell cycle(GO:0051436) positive regulation of ubiquitin-protein ligase activity involved in regulation of mitotic cell cycle transition(GO:0051437) regulation of ubiquitin-protein ligase activity involved in mitotic cell cycle(GO:0051439) negative regulation of ubiquitin protein ligase activity(GO:1904667) |
| 0.1 | 1.5 | GO:0071498 | cellular response to fluid shear stress(GO:0071498) |
| 0.1 | 1.6 | GO:0051290 | protein heterotetramerization(GO:0051290) |
| 0.1 | 0.5 | GO:0010801 | negative regulation of peptidyl-threonine phosphorylation(GO:0010801) |
| 0.1 | 3.0 | GO:0036075 | endochondral ossification(GO:0001958) replacement ossification(GO:0036075) |
| 0.1 | 1.7 | GO:1904659 | hexose transmembrane transport(GO:0035428) glucose transmembrane transport(GO:1904659) |
| 0.1 | 2.4 | GO:0051482 | positive regulation of cytosolic calcium ion concentration involved in phospholipase C-activating G-protein coupled signaling pathway(GO:0051482) |
| 0.1 | 2.7 | GO:0000413 | protein peptidyl-prolyl isomerization(GO:0000413) |
| 0.1 | 11.0 | GO:0000398 | RNA splicing, via transesterification reactions(GO:0000375) RNA splicing, via transesterification reactions with bulged adenosine as nucleophile(GO:0000377) mRNA splicing, via spliceosome(GO:0000398) |
| 0.1 | 9.7 | GO:0030216 | keratinocyte differentiation(GO:0030216) |
| 0.1 | 3.0 | GO:0015701 | bicarbonate transport(GO:0015701) |
| 0.1 | 3.6 | GO:0050853 | B cell receptor signaling pathway(GO:0050853) |
| 0.1 | 5.0 | GO:0036498 | IRE1-mediated unfolded protein response(GO:0036498) |
| 0.1 | 6.9 | GO:0006397 | mRNA processing(GO:0006397) |
| 0.1 | 3.4 | GO:0006501 | C-terminal protein lipidation(GO:0006501) |
| 0.1 | 2.4 | GO:0006654 | phosphatidic acid biosynthetic process(GO:0006654) |
| 0.1 | 0.6 | GO:0032620 | interleukin-17 production(GO:0032620) |
| 0.1 | 0.7 | GO:0060512 | prostate gland morphogenesis(GO:0060512) |
| 0.1 | 0.2 | GO:0018125 | peptidyl-cysteine methylation(GO:0018125) |
| 0.1 | 2.5 | GO:0030835 | negative regulation of actin filament depolymerization(GO:0030835) |
| 0.1 | 2.4 | GO:0045669 | positive regulation of osteoblast differentiation(GO:0045669) |
| 0.1 | 0.6 | GO:0019388 | galactose catabolic process(GO:0019388) |
| 0.1 | 0.3 | GO:0034162 | toll-like receptor 9 signaling pathway(GO:0034162) |
| 0.1 | 1.5 | GO:0010862 | positive regulation of pathway-restricted SMAD protein phosphorylation(GO:0010862) |
| 0.1 | 0.8 | GO:0034453 | microtubule anchoring(GO:0034453) |
| 0.1 | 1.7 | GO:0046426 | negative regulation of JAK-STAT cascade(GO:0046426) negative regulation of STAT cascade(GO:1904893) |
| 0.1 | 0.9 | GO:0030728 | ovulation(GO:0030728) |
| 0.0 | 1.0 | GO:0001502 | cartilage condensation(GO:0001502) |
| 0.0 | 3.3 | GO:0002062 | chondrocyte differentiation(GO:0002062) |
| 0.0 | 0.9 | GO:0016558 | protein import into peroxisome matrix(GO:0016558) |
| 0.0 | 1.0 | GO:0060612 | adipose tissue development(GO:0060612) |
| 0.0 | 0.7 | GO:0035826 | rubidium ion transport(GO:0035826) regulation of rubidium ion transport(GO:2000680) |
| 0.0 | 0.6 | GO:0042359 | vitamin D metabolic process(GO:0042359) |
| 0.0 | 1.4 | GO:0018146 | keratan sulfate biosynthetic process(GO:0018146) |
| 0.0 | 2.9 | GO:0006289 | nucleotide-excision repair(GO:0006289) |
| 0.0 | 1.0 | GO:0030208 | dermatan sulfate biosynthetic process(GO:0030208) |
| 0.0 | 2.1 | GO:0030521 | androgen receptor signaling pathway(GO:0030521) |
| 0.0 | 0.8 | GO:0034198 | cellular response to amino acid starvation(GO:0034198) |
| 0.0 | 2.0 | GO:0006120 | mitochondrial electron transport, NADH to ubiquinone(GO:0006120) |
| 0.0 | 1.4 | GO:0071377 | cellular response to glucagon stimulus(GO:0071377) |
| 0.0 | 0.5 | GO:0010248 | establishment or maintenance of transmembrane electrochemical gradient(GO:0010248) |
| 0.0 | 0.5 | GO:0060964 | regulation of gene silencing by miRNA(GO:0060964) |
| 0.0 | 0.2 | GO:0060012 | synaptic transmission, glycinergic(GO:0060012) |
| 0.0 | 0.4 | GO:0060397 | JAK-STAT cascade involved in growth hormone signaling pathway(GO:0060397) |
| 0.0 | 0.7 | GO:0006825 | copper ion transport(GO:0006825) |
| 0.0 | 0.0 | GO:0005989 | lactose metabolic process(GO:0005988) lactose biosynthetic process(GO:0005989) |
| 0.0 | 0.6 | GO:0090200 | positive regulation of release of cytochrome c from mitochondria(GO:0090200) |
| 0.0 | 0.7 | GO:0060325 | face morphogenesis(GO:0060325) |
| 0.0 | 0.5 | GO:0048485 | sympathetic nervous system development(GO:0048485) |
| 0.0 | 2.6 | GO:0006275 | regulation of DNA replication(GO:0006275) |
| 0.0 | 0.4 | GO:0031290 | retinal ganglion cell axon guidance(GO:0031290) |
| 0.0 | 0.2 | GO:0032957 | inositol trisphosphate metabolic process(GO:0032957) |
| 0.0 | 1.4 | GO:0043433 | negative regulation of sequence-specific DNA binding transcription factor activity(GO:0043433) |
| 0.0 | 0.7 | GO:0046849 | bone remodeling(GO:0046849) |
| 0.0 | 0.0 | GO:0030047 | actin modification(GO:0030047) |
| 0.0 | 0.1 | GO:0032495 | response to muramyl dipeptide(GO:0032495) |
| 0.0 | 0.1 | GO:0061737 | leukotriene signaling pathway(GO:0061737) |
| 0.0 | 0.3 | GO:0061099 | negative regulation of protein tyrosine kinase activity(GO:0061099) |
| 0.0 | 0.7 | GO:1900034 | regulation of cellular response to heat(GO:1900034) |
| 0.0 | 0.7 | GO:0030574 | collagen catabolic process(GO:0030574) |
| 0.0 | 0.4 | GO:0016266 | O-glycan processing(GO:0016266) |
| 0.0 | 0.3 | GO:1901685 | glutathione derivative metabolic process(GO:1901685) glutathione derivative biosynthetic process(GO:1901687) |
| 0.0 | 5.1 | GO:0002283 | neutrophil activation involved in immune response(GO:0002283) neutrophil degranulation(GO:0043312) |
| 0.0 | 0.2 | GO:0032516 | positive regulation of phosphoprotein phosphatase activity(GO:0032516) |
| 0.0 | 0.4 | GO:0006400 | tRNA modification(GO:0006400) |
| 0.0 | 0.2 | GO:0031572 | G2 DNA damage checkpoint(GO:0031572) |
| 0.0 | 0.4 | GO:0006953 | acute-phase response(GO:0006953) |
| 0.0 | 1.2 | GO:0016241 | regulation of macroautophagy(GO:0016241) |
Gene overrepresentation in cellular component category:
| Log-likelihood per target | Total log-likelihood | Term | Description |
|---|---|---|---|
| 4.7 | 28.3 | GO:0042721 | mitochondrial inner membrane protein insertion complex(GO:0042721) |
| 3.1 | 15.4 | GO:0036398 | TCR signalosome(GO:0036398) |
| 2.7 | 13.5 | GO:0001651 | dense fibrillar component(GO:0001651) granular component(GO:0001652) |
| 2.6 | 13.2 | GO:0043625 | delta DNA polymerase complex(GO:0043625) |
| 2.6 | 10.5 | GO:0017059 | serine C-palmitoyltransferase complex(GO:0017059) endoplasmic reticulum palmitoyltransferase complex(GO:0031211) |
| 2.5 | 10.0 | GO:1990423 | RZZ complex(GO:1990423) |
| 2.3 | 14.0 | GO:0031232 | extrinsic component of external side of plasma membrane(GO:0031232) |
| 2.1 | 6.4 | GO:0034991 | nuclear meiotic cohesin complex(GO:0034991) |
| 1.9 | 20.4 | GO:0042105 | alpha-beta T cell receptor complex(GO:0042105) |
| 1.8 | 5.5 | GO:0017109 | glutamate-cysteine ligase complex(GO:0017109) |
| 1.8 | 16.4 | GO:0072687 | microtubule minus-end(GO:0036449) meiotic spindle(GO:0072687) |
| 1.8 | 5.3 | GO:0071752 | dimeric IgA immunoglobulin complex(GO:0071750) secretory dimeric IgA immunoglobulin complex(GO:0071752) IgM immunoglobulin complex(GO:0071753) IgM immunoglobulin complex, circulating(GO:0071754) pentameric IgM immunoglobulin complex(GO:0071756) |
| 1.7 | 10.4 | GO:0005658 | alpha DNA polymerase:primase complex(GO:0005658) |
| 1.7 | 8.6 | GO:0005663 | DNA replication factor C complex(GO:0005663) |
| 1.7 | 16.8 | GO:0031595 | nuclear proteasome complex(GO:0031595) |
| 1.7 | 8.4 | GO:0008622 | epsilon DNA polymerase complex(GO:0008622) |
| 1.7 | 8.4 | GO:0070557 | PCNA-p21 complex(GO:0070557) |
| 1.6 | 6.5 | GO:0005715 | late recombination nodule(GO:0005715) |
| 1.5 | 6.0 | GO:0097179 | protease inhibitor complex(GO:0097179) |
| 1.5 | 4.4 | GO:0034515 | proteasome storage granule(GO:0034515) |
| 1.5 | 4.4 | GO:0035354 | Toll-like receptor 1-Toll-like receptor 2 protein complex(GO:0035354) |
| 1.4 | 5.5 | GO:1990876 | cytoplasmic side of nuclear pore(GO:1990876) |
| 1.3 | 5.3 | GO:0032937 | SREBP-SCAP-Insig complex(GO:0032937) |
| 1.3 | 5.2 | GO:0020003 | symbiont-containing vacuole(GO:0020003) |
| 1.3 | 5.2 | GO:0097057 | TRAF2-GSTP1 complex(GO:0097057) |
| 1.3 | 3.9 | GO:0071148 | TEAD-1-YAP complex(GO:0071148) |
| 1.3 | 7.7 | GO:0061617 | MICOS complex(GO:0061617) |
| 1.3 | 2.5 | GO:0098592 | cytoplasmic side of apical plasma membrane(GO:0098592) |
| 1.3 | 23.8 | GO:0042613 | MHC class II protein complex(GO:0042613) |
| 1.2 | 9.9 | GO:0000796 | condensin complex(GO:0000796) |
| 1.2 | 3.6 | GO:0030936 | collagen type XIII trimer(GO:0005600) transmembrane collagen trimer(GO:0030936) |
| 1.1 | 11.5 | GO:0044194 | cytolytic granule(GO:0044194) |
| 1.1 | 21.7 | GO:0000974 | Prp19 complex(GO:0000974) |
| 1.1 | 23.6 | GO:0071004 | U2-type prespliceosome(GO:0071004) |
| 1.1 | 5.5 | GO:0031205 | endoplasmic reticulum Sec complex(GO:0031205) |
| 1.1 | 8.8 | GO:0097550 | transcriptional preinitiation complex(GO:0097550) |
| 1.1 | 5.5 | GO:0034274 | Atg12-Atg5-Atg16 complex(GO:0034274) |
| 1.0 | 3.1 | GO:0031251 | PAN complex(GO:0031251) |
| 1.0 | 15.2 | GO:0070937 | CRD-mediated mRNA stability complex(GO:0070937) |
| 0.9 | 2.8 | GO:0005606 | laminin-1 complex(GO:0005606) |
| 0.9 | 2.8 | GO:0098575 | lumenal side of lysosomal membrane(GO:0098575) |
| 0.9 | 7.4 | GO:0032010 | phagolysosome(GO:0032010) |
| 0.9 | 3.7 | GO:0008540 | proteasome regulatory particle, base subcomplex(GO:0008540) |
| 0.9 | 3.6 | GO:0070876 | SOSS complex(GO:0070876) |
| 0.9 | 3.6 | GO:0000438 | core TFIIH complex portion of holo TFIIH complex(GO:0000438) |
| 0.9 | 14.6 | GO:0031080 | nuclear pore outer ring(GO:0031080) |
| 0.9 | 7.7 | GO:0031298 | replication fork protection complex(GO:0031298) |
| 0.8 | 5.0 | GO:1990357 | terminal web(GO:1990357) |
| 0.8 | 2.4 | GO:0033593 | BRCA2-MAGE-D1 complex(GO:0033593) |
| 0.8 | 5.6 | GO:0098560 | cytoplasmic side of late endosome membrane(GO:0098560) |
| 0.8 | 6.3 | GO:0000322 | storage vacuole(GO:0000322) |
| 0.8 | 6.2 | GO:0000015 | phosphopyruvate hydratase complex(GO:0000015) |
| 0.7 | 2.2 | GO:0005588 | collagen type V trimer(GO:0005588) |
| 0.7 | 4.3 | GO:0030532 | small nuclear ribonucleoprotein complex(GO:0030532) |
| 0.7 | 4.3 | GO:0031597 | cytosolic proteasome complex(GO:0031597) |
| 0.7 | 3.6 | GO:0030896 | checkpoint clamp complex(GO:0030896) |
| 0.7 | 2.0 | GO:0000445 | THO complex(GO:0000347) THO complex part of transcription export complex(GO:0000445) |
| 0.6 | 8.4 | GO:0060293 | P granule(GO:0043186) pole plasm(GO:0045495) germ plasm(GO:0060293) |
| 0.6 | 9.7 | GO:0008074 | guanylate cyclase complex, soluble(GO:0008074) |
| 0.6 | 16.1 | GO:0001891 | phagocytic cup(GO:0001891) |
| 0.6 | 18.4 | GO:0005680 | anaphase-promoting complex(GO:0005680) |
| 0.6 | 3.1 | GO:0036396 | MIS complex(GO:0036396) mRNA editing complex(GO:0045293) |
| 0.6 | 0.6 | GO:0042611 | MHC protein complex(GO:0042611) |
| 0.6 | 36.4 | GO:0001772 | immunological synapse(GO:0001772) |
| 0.5 | 4.3 | GO:0072559 | NLRP3 inflammasome complex(GO:0072559) |
| 0.5 | 4.3 | GO:0019907 | cyclin-dependent protein kinase activating kinase holoenzyme complex(GO:0019907) |
| 0.5 | 2.0 | GO:0005873 | plus-end kinesin complex(GO:0005873) |
| 0.5 | 5.0 | GO:0005785 | signal recognition particle receptor complex(GO:0005785) |
| 0.5 | 8.0 | GO:0001741 | XY body(GO:0001741) |
| 0.5 | 2.5 | GO:0000214 | tRNA-intron endonuclease complex(GO:0000214) |
| 0.5 | 1.5 | GO:0002079 | inner acrosomal membrane(GO:0002079) |
| 0.5 | 4.4 | GO:0042382 | paraspeckles(GO:0042382) |
| 0.5 | 2.9 | GO:0042575 | DNA polymerase complex(GO:0042575) |
| 0.5 | 2.9 | GO:0000439 | core TFIIH complex(GO:0000439) |
| 0.5 | 13.1 | GO:0005852 | eukaryotic translation initiation factor 3 complex(GO:0005852) |
| 0.5 | 3.7 | GO:0097504 | Gemini of coiled bodies(GO:0097504) |
| 0.5 | 3.6 | GO:0005851 | eukaryotic translation initiation factor 2B complex(GO:0005851) |
| 0.4 | 3.6 | GO:0005742 | mitochondrial outer membrane translocase complex(GO:0005742) |
| 0.4 | 2.0 | GO:0045257 | mitochondrial respiratory chain complex II, succinate dehydrogenase complex (ubiquinone)(GO:0005749) succinate dehydrogenase complex (ubiquinone)(GO:0045257) respiratory chain complex II(GO:0045273) succinate dehydrogenase complex(GO:0045281) fumarate reductase complex(GO:0045283) |
| 0.4 | 4.8 | GO:0008290 | F-actin capping protein complex(GO:0008290) |
| 0.4 | 46.9 | GO:0045335 | phagocytic vesicle(GO:0045335) |
| 0.4 | 3.3 | GO:0070652 | HAUS complex(GO:0070652) |
| 0.4 | 6.0 | GO:0031254 | uropod(GO:0001931) cell trailing edge(GO:0031254) |
| 0.3 | 2.8 | GO:0034709 | methylosome(GO:0034709) |
| 0.3 | 2.7 | GO:0000110 | nucleotide-excision repair factor 1 complex(GO:0000110) ERCC4-ERCC1 complex(GO:0070522) |
| 0.3 | 4.9 | GO:0034663 | endoplasmic reticulum chaperone complex(GO:0034663) |
| 0.3 | 2.9 | GO:0001739 | sex chromatin(GO:0001739) |
| 0.3 | 16.0 | GO:0042645 | nucleoid(GO:0009295) mitochondrial nucleoid(GO:0042645) |
| 0.3 | 8.8 | GO:0000314 | organellar small ribosomal subunit(GO:0000314) mitochondrial small ribosomal subunit(GO:0005763) |
| 0.3 | 12.1 | GO:0000315 | organellar large ribosomal subunit(GO:0000315) mitochondrial large ribosomal subunit(GO:0005762) |
| 0.3 | 4.9 | GO:0016442 | RISC complex(GO:0016442) RNAi effector complex(GO:0031332) |
| 0.3 | 3.4 | GO:0016235 | aggresome(GO:0016235) |
| 0.3 | 3.6 | GO:0097136 | Bcl-2 family protein complex(GO:0097136) |
| 0.3 | 1.8 | GO:0046696 | lipopolysaccharide receptor complex(GO:0046696) |
| 0.3 | 0.6 | GO:0034457 | Mpp10 complex(GO:0034457) |
| 0.3 | 7.1 | GO:0005665 | DNA-directed RNA polymerase II, core complex(GO:0005665) |
| 0.3 | 9.9 | GO:0005657 | replication fork(GO:0005657) |
| 0.3 | 5.3 | GO:0000242 | pericentriolar material(GO:0000242) |
| 0.3 | 127.6 | GO:0016607 | nuclear speck(GO:0016607) |
| 0.3 | 1.1 | GO:0042765 | GPI-anchor transamidase complex(GO:0042765) |
| 0.3 | 28.7 | GO:0071013 | catalytic step 2 spliceosome(GO:0071013) |
| 0.3 | 1.4 | GO:0030314 | junctional membrane complex(GO:0030314) |
| 0.3 | 0.8 | GO:0061700 | GATOR2 complex(GO:0061700) |
| 0.3 | 15.6 | GO:0005681 | spliceosomal complex(GO:0005681) |
| 0.3 | 1.8 | GO:0000788 | nuclear nucleosome(GO:0000788) |
| 0.3 | 10.5 | GO:0045095 | keratin filament(GO:0045095) |
| 0.2 | 3.7 | GO:0005652 | nuclear lamina(GO:0005652) |
| 0.2 | 2.4 | GO:0005614 | interstitial matrix(GO:0005614) |
| 0.2 | 2.9 | GO:0000177 | cytoplasmic exosome (RNase complex)(GO:0000177) |
| 0.2 | 2.8 | GO:0019773 | proteasome core complex, alpha-subunit complex(GO:0019773) |
| 0.2 | 3.7 | GO:0016281 | eukaryotic translation initiation factor 4F complex(GO:0016281) |
| 0.2 | 5.1 | GO:0030992 | intraciliary transport particle B(GO:0030992) |
| 0.2 | 0.8 | GO:0043219 | lateral loop(GO:0043219) |
| 0.2 | 2.5 | GO:0005577 | fibrinogen complex(GO:0005577) |
| 0.2 | 4.5 | GO:0031265 | CD95 death-inducing signaling complex(GO:0031265) |
| 0.2 | 7.0 | GO:0030173 | integral component of Golgi membrane(GO:0030173) |
| 0.2 | 5.5 | GO:0042629 | mast cell granule(GO:0042629) |
| 0.2 | 3.3 | GO:0005839 | proteasome core complex(GO:0005839) |
| 0.2 | 4.7 | GO:0005801 | cis-Golgi network(GO:0005801) |
| 0.2 | 26.8 | GO:0001650 | fibrillar center(GO:0001650) |
| 0.2 | 14.7 | GO:0005643 | nuclear pore(GO:0005643) |
| 0.2 | 2.4 | GO:0031083 | BLOC-1 complex(GO:0031083) |
| 0.2 | 5.0 | GO:0005719 | nuclear euchromatin(GO:0005719) |
| 0.2 | 1.4 | GO:0046581 | intercellular canaliculus(GO:0046581) |
| 0.2 | 1.5 | GO:0036513 | Derlin-1 retrotranslocation complex(GO:0036513) |
| 0.2 | 0.9 | GO:0071203 | WASH complex(GO:0071203) |
| 0.1 | 5.2 | GO:0101003 | ficolin-1-rich granule membrane(GO:0101003) |
| 0.1 | 1.6 | GO:0042555 | MCM complex(GO:0042555) |
| 0.1 | 14.6 | GO:0022625 | cytosolic large ribosomal subunit(GO:0022625) |
| 0.1 | 1.2 | GO:0005641 | nuclear envelope lumen(GO:0005641) |
| 0.1 | 4.0 | GO:0016514 | SWI/SNF complex(GO:0016514) npBAF complex(GO:0071564) |
| 0.1 | 0.9 | GO:0033018 | sarcoplasmic reticulum lumen(GO:0033018) |
| 0.1 | 4.8 | GO:0005844 | polysome(GO:0005844) |
| 0.1 | 7.0 | GO:0097610 | cleavage furrow(GO:0032154) cell surface furrow(GO:0097610) |
| 0.1 | 3.8 | GO:0071339 | MLL1/2 complex(GO:0044665) MLL1 complex(GO:0071339) |
| 0.1 | 0.9 | GO:0005587 | collagen type IV trimer(GO:0005587) |
| 0.1 | 4.6 | GO:0001533 | cornified envelope(GO:0001533) |
| 0.1 | 13.2 | GO:0016605 | PML body(GO:0016605) |
| 0.1 | 6.0 | GO:0031907 | peroxisomal matrix(GO:0005782) microbody lumen(GO:0031907) |
| 0.1 | 2.0 | GO:0005922 | connexon complex(GO:0005922) |
| 0.1 | 13.8 | GO:0035578 | azurophil granule lumen(GO:0035578) |
| 0.1 | 0.9 | GO:0071438 | invadopodium membrane(GO:0071438) |
| 0.1 | 3.3 | GO:0030687 | preribosome, large subunit precursor(GO:0030687) |
| 0.1 | 0.7 | GO:0070436 | Grb2-EGFR complex(GO:0070436) |
| 0.1 | 2.7 | GO:0044217 | other organism(GO:0044215) other organism cell(GO:0044216) other organism part(GO:0044217) |
| 0.1 | 0.3 | GO:1990023 | astral microtubule(GO:0000235) aster(GO:0005818) mitotic spindle midzone(GO:1990023) |
| 0.1 | 10.7 | GO:0005840 | ribosome(GO:0005840) |
| 0.1 | 3.7 | GO:0010494 | cytoplasmic stress granule(GO:0010494) |
| 0.1 | 1.9 | GO:0001527 | microfibril(GO:0001527) fibril(GO:0043205) |
| 0.1 | 0.9 | GO:0016593 | Cdc73/Paf1 complex(GO:0016593) |
| 0.1 | 3.2 | GO:0016592 | mediator complex(GO:0016592) |
| 0.1 | 0.5 | GO:1990796 | photoreceptor cell terminal bouton(GO:1990796) |
| 0.1 | 8.8 | GO:0070821 | tertiary granule membrane(GO:0070821) |
| 0.1 | 2.7 | GO:0008180 | COP9 signalosome(GO:0008180) |
| 0.1 | 0.6 | GO:0005956 | protein kinase CK2 complex(GO:0005956) |
| 0.1 | 2.6 | GO:0031233 | intrinsic component of external side of plasma membrane(GO:0031233) |
| 0.1 | 3.0 | GO:0002102 | podosome(GO:0002102) |
| 0.1 | 3.6 | GO:0042571 | immunoglobulin complex, circulating(GO:0042571) |
| 0.1 | 15.2 | GO:0019897 | extrinsic component of plasma membrane(GO:0019897) |
| 0.1 | 6.0 | GO:0005746 | mitochondrial respiratory chain(GO:0005746) |
| 0.1 | 4.7 | GO:0000777 | condensed chromosome kinetochore(GO:0000777) |
| 0.1 | 1.6 | GO:0016327 | apicolateral plasma membrane(GO:0016327) |
| 0.1 | 0.5 | GO:0098554 | cytoplasmic side of endoplasmic reticulum membrane(GO:0098554) |
| 0.1 | 0.7 | GO:0097487 | multivesicular body, internal vesicle(GO:0097487) |
| 0.1 | 0.7 | GO:0032059 | bleb(GO:0032059) |
| 0.1 | 3.8 | GO:0000118 | histone deacetylase complex(GO:0000118) |
| 0.0 | 0.5 | GO:0032593 | insulin-responsive compartment(GO:0032593) |
| 0.0 | 6.4 | GO:0005875 | microtubule associated complex(GO:0005875) |
| 0.0 | 0.5 | GO:0000815 | ESCRT III complex(GO:0000815) |
| 0.0 | 0.5 | GO:0005890 | sodium:potassium-exchanging ATPase complex(GO:0005890) |
| 0.0 | 0.2 | GO:0032311 | angiogenin-PRI complex(GO:0032311) |
| 0.0 | 9.8 | GO:0005743 | mitochondrial inner membrane(GO:0005743) |
| 0.0 | 4.7 | GO:0031225 | anchored component of membrane(GO:0031225) |
| 0.0 | 7.0 | GO:0009897 | external side of plasma membrane(GO:0009897) |
| 0.0 | 4.7 | GO:0101002 | ficolin-1-rich granule(GO:0101002) ficolin-1-rich granule lumen(GO:1904813) |
| 0.0 | 1.2 | GO:0005865 | striated muscle thin filament(GO:0005865) |
| 0.0 | 3.4 | GO:0005884 | actin filament(GO:0005884) |
| 0.0 | 11.9 | GO:0005667 | transcription factor complex(GO:0005667) |
| 0.0 | 0.2 | GO:0070552 | BRISC complex(GO:0070552) |
| 0.0 | 2.8 | GO:0043202 | lysosomal lumen(GO:0043202) |
| 0.0 | 0.2 | GO:0031466 | Cul5-RING ubiquitin ligase complex(GO:0031466) |
| 0.0 | 1.0 | GO:0005881 | cytoplasmic microtubule(GO:0005881) |
| 0.0 | 1.3 | GO:0005771 | multivesicular body(GO:0005771) |
| 0.0 | 0.8 | GO:0031201 | SNARE complex(GO:0031201) |
| 0.0 | 3.9 | GO:0005795 | Golgi stack(GO:0005795) |
| 0.0 | 3.6 | GO:0043209 | myelin sheath(GO:0043209) |
| 0.0 | 0.3 | GO:0005964 | phosphorylase kinase complex(GO:0005964) |
| 0.0 | 1.6 | GO:0016363 | nuclear matrix(GO:0016363) |
| 0.0 | 60.0 | GO:0005654 | nucleoplasm(GO:0005654) |
| 0.0 | 0.4 | GO:0031904 | endosome lumen(GO:0031904) |
| 0.0 | 0.4 | GO:0005639 | integral component of nuclear inner membrane(GO:0005639) intrinsic component of nuclear inner membrane(GO:0031229) nuclear membrane part(GO:0044453) |
| 0.0 | 0.4 | GO:0031235 | intrinsic component of the cytoplasmic side of the plasma membrane(GO:0031235) |
| 0.0 | 0.8 | GO:1902711 | GABA-A receptor complex(GO:1902711) |
| 0.0 | 0.4 | GO:0000790 | nuclear chromatin(GO:0000790) |
Gene overrepresentation in molecular function category:
| Log-likelihood per target | Total log-likelihood | Term | Description |
|---|---|---|---|
| 5.7 | 22.7 | GO:0008311 | double-stranded DNA 3'-5' exodeoxyribonuclease activity(GO:0008311) |
| 3.8 | 30.7 | GO:0005094 | Rho GDP-dissociation inhibitor activity(GO:0005094) |
| 3.4 | 10.1 | GO:0003896 | DNA primase activity(GO:0003896) |
| 2.8 | 14.0 | GO:0019834 | phospholipase A2 inhibitor activity(GO:0019834) |
| 2.8 | 14.0 | GO:0004905 | type I interferon receptor activity(GO:0004905) |
| 2.7 | 8.1 | GO:0005459 | UDP-galactose transmembrane transporter activity(GO:0005459) |
| 2.6 | 7.7 | GO:0003917 | DNA topoisomerase type I activity(GO:0003917) |
| 2.5 | 10.0 | GO:0004488 | methenyltetrahydrofolate cyclohydrolase activity(GO:0004477) methylenetetrahydrofolate dehydrogenase (NAD+) activity(GO:0004487) methylenetetrahydrofolate dehydrogenase (NADP+) activity(GO:0004488) |
| 2.4 | 16.5 | GO:0010997 | anaphase-promoting complex binding(GO:0010997) |
| 2.3 | 7.0 | GO:0004170 | dUTP diphosphatase activity(GO:0004170) |
| 2.3 | 6.8 | GO:0032089 | NACHT domain binding(GO:0032089) |
| 2.2 | 17.2 | GO:0004176 | ATP-dependent peptidase activity(GO:0004176) |
| 2.1 | 8.5 | GO:0031493 | nucleosomal histone binding(GO:0031493) |
| 2.0 | 8.0 | GO:0098770 | FBXO family protein binding(GO:0098770) |
| 1.9 | 7.6 | GO:0008449 | N-acetylglucosamine-6-sulfatase activity(GO:0008449) |
| 1.9 | 15.3 | GO:0070892 | lipoteichoic acid receptor activity(GO:0070892) |
| 1.9 | 7.6 | GO:0030107 | HLA-A specific inhibitory MHC class I receptor activity(GO:0030107) |
| 1.9 | 16.8 | GO:0036402 | proteasome-activating ATPase activity(GO:0036402) |
| 1.8 | 5.5 | GO:0005260 | channel-conductance-controlling ATPase activity(GO:0005260) |
| 1.8 | 5.5 | GO:0004357 | glutamate-cysteine ligase activity(GO:0004357) |
| 1.8 | 5.5 | GO:0070538 | oleic acid binding(GO:0070538) |
| 1.8 | 5.4 | GO:0005477 | pyruvate secondary active transmembrane transporter activity(GO:0005477) |
| 1.8 | 5.3 | GO:0004796 | thromboxane-A synthase activity(GO:0004796) 12-hydroxyheptadecatrienoic acid synthase activity(GO:0036134) |
| 1.8 | 5.3 | GO:0015265 | urea channel activity(GO:0015265) |
| 1.7 | 5.2 | GO:0035731 | S-nitrosoglutathione binding(GO:0035730) dinitrosyl-iron complex binding(GO:0035731) |
| 1.7 | 10.4 | GO:0043120 | tumor necrosis factor binding(GO:0043120) |
| 1.7 | 23.8 | GO:0032395 | MHC class II receptor activity(GO:0032395) |
| 1.7 | 8.4 | GO:0019912 | cyclin-dependent protein kinase activating kinase activity(GO:0019912) |
| 1.6 | 4.9 | GO:0004534 | 5'-3' exoribonuclease activity(GO:0004534) |
| 1.6 | 1.6 | GO:0030109 | HLA-B specific inhibitory MHC class I receptor activity(GO:0030109) |
| 1.6 | 4.8 | GO:0004418 | hydroxymethylbilane synthase activity(GO:0004418) |
| 1.5 | 4.6 | GO:1904455 | ubiquitin-specific protease activity involved in negative regulation of ERAD pathway(GO:1904455) |
| 1.5 | 7.4 | GO:0047280 | nicotinamide phosphoribosyltransferase activity(GO:0047280) |
| 1.5 | 4.4 | GO:0035663 | Toll-like receptor 2 binding(GO:0035663) |
| 1.4 | 2.9 | GO:0004920 | interleukin-10 receptor activity(GO:0004920) |
| 1.4 | 7.1 | GO:0016744 | transferase activity, transferring aldehyde or ketonic groups(GO:0016744) |
| 1.4 | 5.7 | GO:0004609 | phosphatidylserine decarboxylase activity(GO:0004609) |
| 1.4 | 9.6 | GO:0001591 | dopamine neurotransmitter receptor activity, coupled via Gi/Go(GO:0001591) |
| 1.4 | 15.0 | GO:0051525 | NFAT protein binding(GO:0051525) |
| 1.3 | 4.0 | GO:0016454 | serine C-palmitoyltransferase activity(GO:0004758) C-palmitoyltransferase activity(GO:0016454) |
| 1.3 | 20.4 | GO:0017128 | phospholipid scramblase activity(GO:0017128) |
| 1.2 | 8.6 | GO:0033170 | DNA clamp loader activity(GO:0003689) protein-DNA loading ATPase activity(GO:0033170) |
| 1.2 | 4.8 | GO:0003827 | alpha-1,3-mannosylglycoprotein 2-beta-N-acetylglucosaminyltransferase activity(GO:0003827) |
| 1.2 | 3.5 | GO:0004618 | phosphoglycerate kinase activity(GO:0004618) |
| 1.1 | 4.6 | GO:0004906 | interferon-gamma receptor activity(GO:0004906) |
| 1.1 | 20.0 | GO:0009931 | calcium-dependent protein serine/threonine kinase activity(GO:0009931) |
| 1.1 | 5.5 | GO:0019776 | Atg8 ligase activity(GO:0019776) |
| 1.1 | 9.8 | GO:0019869 | chloride channel inhibitor activity(GO:0019869) |
| 1.1 | 16.2 | GO:0001094 | TFIID-class transcription factor binding(GO:0001094) |
| 1.1 | 6.4 | GO:0036033 | mediator complex binding(GO:0036033) |
| 1.1 | 5.3 | GO:0019862 | IgA binding(GO:0019862) |
| 1.0 | 3.1 | GO:0016422 | mRNA (2'-O-methyladenosine-N6-)-methyltransferase activity(GO:0016422) |
| 1.0 | 28.9 | GO:0003887 | DNA-directed DNA polymerase activity(GO:0003887) |
| 1.0 | 5.0 | GO:0001010 | transcription factor activity, sequence-specific DNA binding transcription factor recruiting(GO:0001010) |
| 1.0 | 4.0 | GO:0004775 | succinate-CoA ligase (ADP-forming) activity(GO:0004775) |
| 0.9 | 7.4 | GO:0016176 | superoxide-generating NADPH oxidase activator activity(GO:0016176) |
| 0.9 | 3.7 | GO:0031726 | CCR1 chemokine receptor binding(GO:0031726) |
| 0.9 | 2.7 | GO:0045550 | geranylgeranyl reductase activity(GO:0045550) delta4-3-oxosteroid 5beta-reductase activity(GO:0047787) |
| 0.9 | 7.3 | GO:0030274 | LIM domain binding(GO:0030274) |
| 0.9 | 8.7 | GO:0050700 | CARD domain binding(GO:0050700) |
| 0.8 | 5.0 | GO:0005047 | signal recognition particle binding(GO:0005047) |
| 0.8 | 2.5 | GO:0050528 | acyloxyacyl hydrolase activity(GO:0050528) |
| 0.8 | 5.7 | GO:0004797 | thymidine kinase activity(GO:0004797) |
| 0.8 | 6.2 | GO:0004634 | phosphopyruvate hydratase activity(GO:0004634) |
| 0.7 | 9.7 | GO:0032407 | MutSalpha complex binding(GO:0032407) |
| 0.7 | 4.5 | GO:0035500 | MH2 domain binding(GO:0035500) |
| 0.7 | 2.2 | GO:0070259 | tyrosyl-DNA phosphodiesterase activity(GO:0070259) |
| 0.7 | 14.0 | GO:0016849 | phosphorus-oxygen lyase activity(GO:0016849) |
| 0.7 | 18.2 | GO:0005095 | GTPase inhibitor activity(GO:0005095) |
| 0.7 | 2.9 | GO:0032551 | pyrimidine nucleoside binding(GO:0001884) UTP binding(GO:0002134) pyrimidine ribonucleoside binding(GO:0032551) |
| 0.7 | 3.6 | GO:0004809 | tRNA (guanine-N2-)-methyltransferase activity(GO:0004809) |
| 0.7 | 11.8 | GO:0019864 | IgG binding(GO:0019864) |
| 0.7 | 2.8 | GO:0035243 | protein-arginine omega-N symmetric methyltransferase activity(GO:0035243) |
| 0.7 | 4.8 | GO:0019788 | NEDD8 transferase activity(GO:0019788) |
| 0.7 | 3.3 | GO:0004464 | leukotriene-C4 synthase activity(GO:0004464) |
| 0.7 | 3.9 | GO:0051032 | nucleic acid transmembrane transporter activity(GO:0051032) RNA transmembrane transporter activity(GO:0051033) |
| 0.6 | 5.8 | GO:0000014 | single-stranded DNA endodeoxyribonuclease activity(GO:0000014) |
| 0.6 | 2.5 | GO:0000213 | tRNA-intron endonuclease activity(GO:0000213) |
| 0.6 | 9.9 | GO:0044213 | intronic transcription regulatory region sequence-specific DNA binding(GO:0001161) intronic transcription regulatory region DNA binding(GO:0044213) |
| 0.6 | 4.3 | GO:0061133 | endopeptidase activator activity(GO:0061133) |
| 0.6 | 3.7 | GO:0008142 | oxysterol binding(GO:0008142) |
| 0.6 | 2.4 | GO:0005124 | scavenger receptor binding(GO:0005124) |
| 0.6 | 15.0 | GO:0022829 | wide pore channel activity(GO:0022829) |
| 0.6 | 18.5 | GO:0008266 | poly(U) RNA binding(GO:0008266) |
| 0.6 | 3.6 | GO:0016435 | rRNA (guanine) methyltransferase activity(GO:0016435) |
| 0.6 | 17.5 | GO:0017056 | structural constituent of nuclear pore(GO:0017056) |
| 0.6 | 14.7 | GO:0070034 | telomerase RNA binding(GO:0070034) |
| 0.5 | 12.6 | GO:0044548 | S100 protein binding(GO:0044548) |
| 0.5 | 8.3 | GO:0004000 | adenosine deaminase activity(GO:0004000) |
| 0.5 | 5.2 | GO:0070492 | oligosaccharide binding(GO:0070492) |
| 0.5 | 3.0 | GO:0004359 | glutaminase activity(GO:0004359) |
| 0.5 | 2.0 | GO:0008177 | succinate dehydrogenase (ubiquinone) activity(GO:0008177) 3 iron, 4 sulfur cluster binding(GO:0051538) |
| 0.5 | 3.0 | GO:0052650 | NADP-retinol dehydrogenase activity(GO:0052650) |
| 0.5 | 5.5 | GO:0004128 | cytochrome-b5 reductase activity, acting on NAD(P)H(GO:0004128) |
| 0.5 | 6.2 | GO:0001730 | 2'-5'-oligoadenylate synthetase activity(GO:0001730) |
| 0.5 | 1.4 | GO:0004766 | spermidine synthase activity(GO:0004766) |
| 0.4 | 3.6 | GO:0035613 | RNA stem-loop binding(GO:0035613) |
| 0.4 | 1.8 | GO:0016019 | peptidoglycan receptor activity(GO:0016019) |
| 0.4 | 1.3 | GO:0055100 | adiponectin binding(GO:0055100) |
| 0.4 | 2.6 | GO:0039552 | RIG-I binding(GO:0039552) |
| 0.4 | 1.7 | GO:0089720 | caspase binding(GO:0089720) |
| 0.4 | 1.7 | GO:0005412 | glucose:sodium symporter activity(GO:0005412) |
| 0.4 | 2.9 | GO:1990932 | 5.8S rRNA binding(GO:1990932) |
| 0.4 | 2.1 | GO:0004045 | aminoacyl-tRNA hydrolase activity(GO:0004045) |
| 0.4 | 8.1 | GO:0005337 | nucleoside transmembrane transporter activity(GO:0005337) |
| 0.4 | 70.7 | GO:0001078 | transcriptional repressor activity, RNA polymerase II core promoter proximal region sequence-specific binding(GO:0001078) |
| 0.4 | 1.5 | GO:0004687 | myosin light chain kinase activity(GO:0004687) |
| 0.4 | 2.6 | GO:0032217 | riboflavin transporter activity(GO:0032217) |
| 0.4 | 5.8 | GO:0043024 | ribosomal small subunit binding(GO:0043024) |
| 0.4 | 2.5 | GO:0010484 | H3 histone acetyltransferase activity(GO:0010484) |
| 0.4 | 1.8 | GO:0004694 | eukaryotic translation initiation factor 2alpha kinase activity(GO:0004694) |
| 0.4 | 2.8 | GO:0016997 | exo-alpha-sialidase activity(GO:0004308) alpha-sialidase activity(GO:0016997) |
| 0.4 | 11.0 | GO:0070182 | DNA polymerase binding(GO:0070182) |
| 0.3 | 1.0 | GO:0042008 | interleukin-18 receptor activity(GO:0042008) |
| 0.3 | 1.0 | GO:0047757 | chondroitin-glucuronate 5-epimerase activity(GO:0047757) |
| 0.3 | 8.2 | GO:0070717 | poly-purine tract binding(GO:0070717) |
| 0.3 | 3.4 | GO:0001206 | transcriptional repressor activity, RNA polymerase II distal enhancer sequence-specific binding(GO:0001206) |
| 0.3 | 2.0 | GO:0044547 | DNA topoisomerase binding(GO:0044547) |
| 0.3 | 1.3 | GO:0004505 | phenylalanine 4-monooxygenase activity(GO:0004505) |
| 0.3 | 8.8 | GO:0017025 | TBP-class protein binding(GO:0017025) |
| 0.3 | 1.0 | GO:0005174 | CD40 receptor binding(GO:0005174) |
| 0.3 | 3.6 | GO:0015266 | protein channel activity(GO:0015266) |
| 0.3 | 5.0 | GO:0004143 | diacylglycerol kinase activity(GO:0004143) |
| 0.3 | 3.8 | GO:0032453 | histone demethylase activity (H3-K4 specific)(GO:0032453) |
| 0.3 | 1.2 | GO:0035276 | aldehyde oxidase activity(GO:0004031) ethanol binding(GO:0035276) |
| 0.3 | 19.9 | GO:0003743 | translation initiation factor activity(GO:0003743) |
| 0.3 | 2.7 | GO:0030882 | lipid antigen binding(GO:0030882) endogenous lipid antigen binding(GO:0030883) exogenous lipid antigen binding(GO:0030884) |
| 0.3 | 1.5 | GO:1990254 | keratin filament binding(GO:1990254) |
| 0.3 | 1.2 | GO:0003990 | acetylcholinesterase activity(GO:0003990) choline binding(GO:0033265) |
| 0.3 | 2.9 | GO:0015386 | sodium:proton antiporter activity(GO:0015385) potassium:proton antiporter activity(GO:0015386) |
| 0.3 | 3.4 | GO:0030280 | structural constituent of epidermis(GO:0030280) |
| 0.3 | 11.2 | GO:0005123 | death receptor binding(GO:0005123) |
| 0.3 | 1.1 | GO:0003923 | GPI-anchor transamidase activity(GO:0003923) |
| 0.3 | 4.4 | GO:0019992 | diacylglycerol binding(GO:0019992) |
| 0.3 | 2.4 | GO:0045545 | syndecan binding(GO:0045545) |
| 0.3 | 5.8 | GO:0052629 | phosphatidylinositol-3,5-bisphosphate 3-phosphatase activity(GO:0052629) |
| 0.3 | 2.6 | GO:0005487 | nucleocytoplasmic transporter activity(GO:0005487) |
| 0.3 | 1.0 | GO:0008823 | cupric reductase activity(GO:0008823) ferric-chelate reductase (NADPH) activity(GO:0052851) |
| 0.3 | 0.8 | GO:0015616 | DNA translocase activity(GO:0015616) |
| 0.3 | 1.8 | GO:0008454 | alpha-1,3-mannosylglycoprotein 4-beta-N-acetylglucosaminyltransferase activity(GO:0008454) |
| 0.2 | 10.8 | GO:0050699 | WW domain binding(GO:0050699) |
| 0.2 | 6.3 | GO:0017166 | vinculin binding(GO:0017166) |
| 0.2 | 0.9 | GO:0071987 | WD40-repeat domain binding(GO:0071987) |
| 0.2 | 3.6 | GO:0051400 | BH domain binding(GO:0051400) |
| 0.2 | 4.7 | GO:0070330 | aromatase activity(GO:0070330) |
| 0.2 | 1.5 | GO:0019826 | oxygen sensor activity(GO:0019826) |
| 0.2 | 3.8 | GO:0016018 | cyclosporin A binding(GO:0016018) |
| 0.2 | 2.9 | GO:0046976 | histone methyltransferase activity (H3-K27 specific)(GO:0046976) |
| 0.2 | 3.1 | GO:0004535 | poly(A)-specific ribonuclease activity(GO:0004535) |
| 0.2 | 5.8 | GO:0005328 | neurotransmitter:sodium symporter activity(GO:0005328) |
| 0.2 | 9.9 | GO:0008536 | Ran GTPase binding(GO:0008536) |
| 0.2 | 0.8 | GO:0035033 | histone deacetylase regulator activity(GO:0035033) |
| 0.2 | 38.8 | GO:0003735 | structural constituent of ribosome(GO:0003735) |
| 0.2 | 3.6 | GO:0070016 | armadillo repeat domain binding(GO:0070016) |
| 0.2 | 14.2 | GO:0003730 | mRNA 3'-UTR binding(GO:0003730) |
| 0.2 | 4.5 | GO:0008301 | DNA binding, bending(GO:0008301) |
| 0.2 | 6.9 | GO:0017091 | AU-rich element binding(GO:0017091) |
| 0.2 | 0.7 | GO:0002151 | G-quadruplex RNA binding(GO:0002151) |
| 0.2 | 0.4 | GO:0008309 | double-stranded DNA exodeoxyribonuclease activity(GO:0008309) |
| 0.2 | 2.4 | GO:0016538 | cyclin-dependent protein serine/threonine kinase regulator activity(GO:0016538) |
| 0.2 | 11.3 | GO:0001784 | phosphotyrosine binding(GO:0001784) |
| 0.2 | 3.6 | GO:0008353 | RNA polymerase II carboxy-terminal domain kinase activity(GO:0008353) |
| 0.2 | 0.9 | GO:0008048 | calcium sensitive guanylate cyclase activator activity(GO:0008048) |
| 0.2 | 11.4 | GO:0019894 | kinesin binding(GO:0019894) |
| 0.2 | 9.4 | GO:0008138 | protein tyrosine/serine/threonine phosphatase activity(GO:0008138) |
| 0.2 | 3.2 | GO:0017049 | GTP-Rho binding(GO:0017049) |
| 0.2 | 39.3 | GO:0051015 | actin filament binding(GO:0051015) |
| 0.2 | 6.7 | GO:0051539 | 4 iron, 4 sulfur cluster binding(GO:0051539) |
| 0.2 | 1.6 | GO:0001135 | transcription factor activity, RNA polymerase II transcription factor recruiting(GO:0001135) |
| 0.2 | 0.5 | GO:0033989 | 3alpha,7alpha,12alpha-trihydroxy-5beta-cholest-24-enoyl-CoA hydratase activity(GO:0033989) 17-beta-hydroxysteroid dehydrogenase (NAD+) activity(GO:0044594) |
| 0.2 | 0.8 | GO:0003945 | N-acetyllactosamine synthase activity(GO:0003945) |
| 0.2 | 2.5 | GO:0005149 | interleukin-1 receptor binding(GO:0005149) |
| 0.2 | 3.1 | GO:0016832 | aldehyde-lyase activity(GO:0016832) |
| 0.2 | 1.6 | GO:0017160 | Ral GTPase binding(GO:0017160) |
| 0.2 | 4.5 | GO:0070064 | proline-rich region binding(GO:0070064) |
| 0.2 | 5.0 | GO:0005086 | ARF guanyl-nucleotide exchange factor activity(GO:0005086) |
| 0.2 | 3.6 | GO:1990841 | promoter-specific chromatin binding(GO:1990841) |
| 0.2 | 2.6 | GO:0042809 | vitamin D receptor binding(GO:0042809) |
| 0.2 | 2.6 | GO:0008327 | methyl-CpG binding(GO:0008327) |
| 0.2 | 5.2 | GO:0030296 | protein tyrosine kinase activator activity(GO:0030296) |
| 0.2 | 2.7 | GO:0098641 | cadherin binding involved in cell-cell adhesion(GO:0098641) |
| 0.1 | 4.9 | GO:0001106 | RNA polymerase II transcription corepressor activity(GO:0001106) |
| 0.1 | 4.3 | GO:0015347 | sodium-independent organic anion transmembrane transporter activity(GO:0015347) |
| 0.1 | 3.3 | GO:0070628 | proteasome binding(GO:0070628) |
| 0.1 | 18.0 | GO:0003729 | mRNA binding(GO:0003729) poly(A) RNA binding(GO:0044822) |
| 0.1 | 0.8 | GO:0042301 | phosphate ion binding(GO:0042301) |
| 0.1 | 2.6 | GO:0004697 | protein kinase C activity(GO:0004697) |
| 0.1 | 2.3 | GO:0015095 | magnesium ion transmembrane transporter activity(GO:0015095) |
| 0.1 | 8.7 | GO:0004715 | non-membrane spanning protein tyrosine kinase activity(GO:0004715) |
| 0.1 | 24.3 | GO:0042393 | histone binding(GO:0042393) |
| 0.1 | 4.7 | GO:0015269 | calcium-activated potassium channel activity(GO:0015269) |
| 0.1 | 0.4 | GO:0005148 | prolactin receptor binding(GO:0005148) |
| 0.1 | 8.3 | GO:1990782 | protein tyrosine kinase binding(GO:1990782) |
| 0.1 | 1.4 | GO:0036122 | BMP binding(GO:0036122) |
| 0.1 | 5.1 | GO:0030374 | ligand-dependent nuclear receptor transcription coactivator activity(GO:0030374) |
| 0.1 | 0.9 | GO:0008269 | growth hormone receptor binding(GO:0005131) JAK pathway signal transduction adaptor activity(GO:0008269) |
| 0.1 | 3.3 | GO:0043027 | cysteine-type endopeptidase inhibitor activity involved in apoptotic process(GO:0043027) |
| 0.1 | 3.0 | GO:0004012 | phospholipid-translocating ATPase activity(GO:0004012) |
| 0.1 | 3.8 | GO:0036002 | pre-mRNA binding(GO:0036002) |
| 0.1 | 0.8 | GO:0008379 | thioredoxin peroxidase activity(GO:0008379) |
| 0.1 | 3.8 | GO:0043539 | protein serine/threonine kinase activator activity(GO:0043539) |
| 0.1 | 4.5 | GO:0004364 | glutathione transferase activity(GO:0004364) |
| 0.1 | 3.7 | GO:0005540 | hyaluronic acid binding(GO:0005540) |
| 0.1 | 3.7 | GO:0003950 | NAD+ ADP-ribosyltransferase activity(GO:0003950) |
| 0.1 | 10.8 | GO:0004860 | protein kinase inhibitor activity(GO:0004860) |
| 0.1 | 2.8 | GO:0070003 | threonine-type endopeptidase activity(GO:0004298) threonine-type peptidase activity(GO:0070003) |
| 0.1 | 3.6 | GO:0043022 | ribosome binding(GO:0043022) |
| 0.1 | 0.6 | GO:0004839 | ubiquitin activating enzyme activity(GO:0004839) |
| 0.1 | 3.2 | GO:0005484 | SNAP receptor activity(GO:0005484) |
| 0.1 | 0.6 | GO:0004614 | phosphoglucomutase activity(GO:0004614) |
| 0.1 | 19.4 | GO:0003823 | antigen binding(GO:0003823) |
| 0.1 | 2.2 | GO:0008239 | dipeptidyl-peptidase activity(GO:0008239) |
| 0.1 | 3.5 | GO:0003727 | single-stranded RNA binding(GO:0003727) |
| 0.1 | 1.4 | GO:0016922 | ligand-dependent nuclear receptor binding(GO:0016922) |
| 0.1 | 1.3 | GO:0019871 | sodium channel inhibitor activity(GO:0019871) |
| 0.1 | 0.8 | GO:0015924 | mannosyl-oligosaccharide mannosidase activity(GO:0015924) |
| 0.1 | 0.8 | GO:0042974 | retinoic acid receptor binding(GO:0042974) |
| 0.1 | 0.7 | GO:0016724 | ferroxidase activity(GO:0004322) oxidoreductase activity, oxidizing metal ions, oxygen as acceptor(GO:0016724) |
| 0.1 | 1.2 | GO:0003708 | retinoic acid receptor activity(GO:0003708) |
| 0.1 | 4.3 | GO:0043621 | protein self-association(GO:0043621) |
| 0.1 | 0.2 | GO:0000035 | acyl binding(GO:0000035) |
| 0.1 | 0.3 | GO:0004087 | carbamoyl-phosphate synthase (ammonia) activity(GO:0004087) carbamoyl-phosphate synthase (glutamine-hydrolyzing) activity(GO:0004088) |
| 0.1 | 0.5 | GO:0008568 | microtubule-severing ATPase activity(GO:0008568) |
| 0.1 | 1.6 | GO:0042813 | Wnt-activated receptor activity(GO:0042813) |
| 0.1 | 2.7 | GO:0003755 | peptidyl-prolyl cis-trans isomerase activity(GO:0003755) |
| 0.1 | 0.3 | GO:0022865 | transmembrane electron transfer carrier(GO:0022865) |
| 0.1 | 2.1 | GO:0051721 | protein phosphatase 2A binding(GO:0051721) |
| 0.1 | 3.4 | GO:0031593 | polyubiquitin binding(GO:0031593) |
| 0.1 | 3.5 | GO:0005544 | calcium-dependent phospholipid binding(GO:0005544) |
| 0.1 | 1.4 | GO:0070273 | phosphatidylinositol-4-phosphate binding(GO:0070273) |
| 0.1 | 0.3 | GO:0004909 | interleukin-1, Type I, activating receptor activity(GO:0004909) |
| 0.1 | 17.5 | GO:0003713 | transcription coactivator activity(GO:0003713) |
| 0.1 | 0.2 | GO:0052825 | inositol tetrakisphosphate 1-kinase activity(GO:0047325) inositol tetrakisphosphate kinase activity(GO:0051765) inositol-1,3,4-trisphosphate 6-kinase activity(GO:0052725) inositol-1,3,4-trisphosphate 5-kinase activity(GO:0052726) inositol-1,3,4,5,6-pentakisphosphate 1-phosphatase activity(GO:0052825) inositol-1,3,4,6-tetrakisphosphate 6-phosphatase activity(GO:0052830) inositol-1,3,4,6-tetrakisphosphate 1-phosphatase activity(GO:0052831) inositol-3,4,6-trisphosphate 1-kinase activity(GO:0052835) |
| 0.1 | 0.5 | GO:0008046 | axon guidance receptor activity(GO:0008046) |
| 0.1 | 3.3 | GO:0005160 | transforming growth factor beta receptor binding(GO:0005160) |
| 0.1 | 0.5 | GO:1901567 | icosanoid binding(GO:0050542) icosatetraenoic acid binding(GO:0050543) arachidonic acid binding(GO:0050544) fatty acid derivative binding(GO:1901567) |
| 0.1 | 5.7 | GO:0005201 | extracellular matrix structural constituent(GO:0005201) |
| 0.1 | 4.9 | GO:0000979 | RNA polymerase II core promoter sequence-specific DNA binding(GO:0000979) |
| 0.1 | 1.9 | GO:0003785 | actin monomer binding(GO:0003785) |
| 0.1 | 1.5 | GO:0001848 | complement binding(GO:0001848) |
| 0.1 | 0.3 | GO:1904264 | ubiquitin protein ligase activity involved in ERAD pathway(GO:1904264) |
| 0.1 | 10.2 | GO:0004713 | protein tyrosine kinase activity(GO:0004713) |
| 0.1 | 0.6 | GO:0022842 | leak channel activity(GO:0022840) narrow pore channel activity(GO:0022842) |
| 0.1 | 1.6 | GO:0004003 | ATP-dependent DNA helicase activity(GO:0004003) |
| 0.1 | 0.6 | GO:0032393 | MHC class I receptor activity(GO:0032393) |
| 0.1 | 7.2 | GO:0005178 | integrin binding(GO:0005178) |
| 0.1 | 0.2 | GO:0048248 | CXCR3 chemokine receptor binding(GO:0048248) |
| 0.1 | 1.6 | GO:0030544 | Hsp70 protein binding(GO:0030544) |
| 0.1 | 5.4 | GO:0019902 | phosphatase binding(GO:0019902) |
| 0.0 | 1.7 | GO:0019887 | protein kinase regulator activity(GO:0019887) |
| 0.0 | 1.1 | GO:0001221 | transcription cofactor binding(GO:0001221) |
| 0.0 | 0.8 | GO:0008503 | benzodiazepine receptor activity(GO:0008503) |
| 0.0 | 1.8 | GO:0008173 | RNA methyltransferase activity(GO:0008173) |
| 0.0 | 0.8 | GO:0031957 | very long-chain fatty acid-CoA ligase activity(GO:0031957) |
| 0.0 | 1.5 | GO:0005164 | tumor necrosis factor receptor binding(GO:0005164) |
| 0.0 | 2.2 | GO:0004385 | guanylate kinase activity(GO:0004385) |
| 0.0 | 1.6 | GO:0016765 | transferase activity, transferring alkyl or aryl (other than methyl) groups(GO:0016765) |
| 0.0 | 3.1 | GO:0004725 | protein tyrosine phosphatase activity(GO:0004725) |
| 0.0 | 8.6 | GO:0004252 | serine-type endopeptidase activity(GO:0004252) |
| 0.0 | 0.5 | GO:0005391 | sodium:potassium-exchanging ATPase activity(GO:0005391) |
| 0.0 | 0.3 | GO:0008865 | glucokinase activity(GO:0004340) hexokinase activity(GO:0004396) fructokinase activity(GO:0008865) mannokinase activity(GO:0019158) |
| 0.0 | 0.2 | GO:0016933 | extracellular-glycine-gated ion channel activity(GO:0016933) extracellular-glycine-gated chloride channel activity(GO:0016934) |
| 0.0 | 0.4 | GO:0016857 | racemase and epimerase activity, acting on carbohydrates and derivatives(GO:0016857) |
| 0.0 | 1.8 | GO:0097110 | scaffold protein binding(GO:0097110) |
| 0.0 | 4.9 | GO:0008234 | cysteine-type peptidase activity(GO:0008234) |
| 0.0 | 0.8 | GO:0070412 | R-SMAD binding(GO:0070412) |
| 0.0 | 2.1 | GO:0003777 | microtubule motor activity(GO:0003777) |
| 0.0 | 0.0 | GO:0004461 | lactose synthase activity(GO:0004461) |
| 0.0 | 0.6 | GO:0008395 | steroid hydroxylase activity(GO:0008395) |
| 0.0 | 0.1 | GO:0001632 | leukotriene B4 receptor activity(GO:0001632) |
| 0.0 | 0.7 | GO:0033613 | activating transcription factor binding(GO:0033613) |
| 0.0 | 0.3 | GO:0004689 | phosphorylase kinase activity(GO:0004689) |
| 0.0 | 1.5 | GO:0016836 | hydro-lyase activity(GO:0016836) |
| 0.0 | 0.3 | GO:0016500 | protein-hormone receptor activity(GO:0016500) |
| 0.0 | 0.1 | GO:0019150 | D-ribulokinase activity(GO:0019150) |
| 0.0 | 25.2 | GO:0003723 | RNA binding(GO:0003723) |
| 0.0 | 0.8 | GO:0004869 | cysteine-type endopeptidase inhibitor activity(GO:0004869) |
| 0.0 | 0.3 | GO:0005344 | oxygen transporter activity(GO:0005344) |
| 0.0 | 1.2 | GO:0031072 | heat shock protein binding(GO:0031072) |
| 0.0 | 7.4 | GO:0001228 | transcriptional activator activity, RNA polymerase II transcription regulatory region sequence-specific binding(GO:0001228) |
| 0.0 | 0.2 | GO:0016594 | glycine binding(GO:0016594) |
| 0.0 | 0.7 | GO:0017112 | Rab guanyl-nucleotide exchange factor activity(GO:0017112) |
| 0.0 | 0.1 | GO:0047498 | calcium-dependent phospholipase A2 activity(GO:0047498) |
| 0.0 | 1.0 | GO:0002020 | protease binding(GO:0002020) |
| 0.0 | 0.4 | GO:0000987 | core promoter proximal region sequence-specific DNA binding(GO:0000987) |
Gene overrepresentation in curated gene sets: canonical pathways category:
| Log-likelihood per target | Total log-likelihood | Term | Description |
|---|---|---|---|
| 1.9 | 5.8 | PID GMCSF PATHWAY | GMCSF-mediated signaling events |
| 1.0 | 40.5 | SA CASPASE CASCADE | Apoptosis is mediated by caspases, cysteine proteases arranged in a proteolytic cascade. |
| 0.8 | 35.0 | PID P38 MK2 PATHWAY | p38 signaling mediated by MAPKAP kinases |
| 0.8 | 20.7 | PID IL5 PATHWAY | IL5-mediated signaling events |
| 0.7 | 39.4 | PID HIF2PATHWAY | HIF-2-alpha transcription factor network |
| 0.7 | 8.4 | SA G2 AND M PHASES | Cdc25 activates the cdc2/cyclin B complex to induce the G2/M transition. |
| 0.6 | 14.7 | PID TCR JNK PATHWAY | JNK signaling in the CD4+ TCR pathway |
| 0.6 | 29.4 | PID INTEGRIN2 PATHWAY | Beta2 integrin cell surface interactions |
| 0.6 | 44.9 | PID CASPASE PATHWAY | Caspase cascade in apoptosis |
| 0.5 | 17.3 | PID TOLL ENDOGENOUS PATHWAY | Endogenous TLR signaling |
| 0.5 | 23.4 | PID FANCONI PATHWAY | Fanconi anemia pathway |
| 0.5 | 14.5 | PID ATM PATHWAY | ATM pathway |
| 0.4 | 36.1 | PID CD8 TCR DOWNSTREAM PATHWAY | Downstream signaling in naïve CD8+ T cells |
| 0.4 | 8.4 | PID LPA4 PATHWAY | LPA4-mediated signaling events |
| 0.4 | 12.4 | SA MMP CYTOKINE CONNECTION | Cytokines can induce activation of matrix metalloproteinases, which degrade extracellular matrix. |
| 0.3 | 21.3 | PID PLK1 PATHWAY | PLK1 signaling events |
| 0.3 | 3.6 | SA PROGRAMMED CELL DEATH | Programmed cell death, or apoptosis, eliminates damaged or unneeded cells. |
| 0.3 | 4.6 | ST INTERFERON GAMMA PATHWAY | Interferon gamma pathway. |
| 0.3 | 8.8 | PID ERB GENOMIC PATHWAY | Validated nuclear estrogen receptor beta network |
| 0.3 | 12.8 | PID IL8 CXCR2 PATHWAY | IL8- and CXCR2-mediated signaling events |
| 0.3 | 15.3 | PID FCER1 PATHWAY | Fc-epsilon receptor I signaling in mast cells |
| 0.3 | 9.3 | PID SMAD2 3PATHWAY | Regulation of cytoplasmic and nuclear SMAD2/3 signaling |
| 0.3 | 6.1 | PID IL2 STAT5 PATHWAY | IL2 signaling events mediated by STAT5 |
| 0.3 | 6.3 | PID AURORA A PATHWAY | Aurora A signaling |
| 0.3 | 6.2 | SA B CELL RECEPTOR COMPLEXES | Antigen binding to B cell receptors activates protein tyrosine kinases, such as the Src family, which ultimate activate MAP kinases. |
| 0.2 | 4.7 | ST PHOSPHOINOSITIDE 3 KINASE PATHWAY | PI3K Pathway |
| 0.2 | 6.5 | PID SYNDECAN 3 PATHWAY | Syndecan-3-mediated signaling events |
| 0.2 | 5.5 | SA G1 AND S PHASES | Cdk2, 4, and 6 bind cyclin D in G1, while cdk2/cyclin E promotes the G1/S transition. |
| 0.2 | 15.0 | PID DELTA NP63 PATHWAY | Validated transcriptional targets of deltaNp63 isoforms |
| 0.2 | 3.6 | SA PTEN PATHWAY | PTEN is a tumor suppressor that dephosphorylates the lipid messenger phosphatidylinositol triphosphate. |
| 0.2 | 9.9 | PID AURORA B PATHWAY | Aurora B signaling |
| 0.2 | 4.0 | PID IL2 1PATHWAY | IL2-mediated signaling events |
| 0.2 | 12.3 | PID HDAC CLASSII PATHWAY | Signaling events mediated by HDAC Class II |
| 0.2 | 10.8 | PID SYNDECAN 1 PATHWAY | Syndecan-1-mediated signaling events |
| 0.2 | 4.8 | PID SYNDECAN 2 PATHWAY | Syndecan-2-mediated signaling events |
| 0.1 | 4.5 | PID CD8 TCR PATHWAY | TCR signaling in naïve CD8+ T cells |
| 0.1 | 8.3 | PID HNF3A PATHWAY | FOXA1 transcription factor network |
| 0.1 | 9.5 | PID SMAD2 3NUCLEAR PATHWAY | Regulation of nuclear SMAD2/3 signaling |
| 0.1 | 5.2 | PID INSULIN PATHWAY | Insulin Pathway |
| 0.1 | 2.7 | PID NFKAPPAB CANONICAL PATHWAY | Canonical NF-kappaB pathway |
| 0.1 | 7.1 | PID E2F PATHWAY | E2F transcription factor network |
| 0.1 | 3.3 | PID ANGIOPOIETIN RECEPTOR PATHWAY | Angiopoietin receptor Tie2-mediated signaling |
| 0.1 | 7.2 | PID NOTCH PATHWAY | Notch signaling pathway |
| 0.1 | 1.7 | PID CIRCADIAN PATHWAY | Circadian rhythm pathway |
| 0.1 | 5.0 | PID NFAT TFPATHWAY | Calcineurin-regulated NFAT-dependent transcription in lymphocytes |
| 0.1 | 18.5 | NABA ECM AFFILIATED | Genes encoding proteins affiliated structurally or functionally to extracellular matrix proteins |
| 0.1 | 15.4 | PID P53 DOWNSTREAM PATHWAY | Direct p53 effectors |
| 0.1 | 1.7 | ST G ALPHA S PATHWAY | G alpha s Pathway |
| 0.1 | 4.1 | PID RHOA PATHWAY | RhoA signaling pathway |
| 0.1 | 2.4 | PID INTEGRIN A9B1 PATHWAY | Alpha9 beta1 integrin signaling events |
| 0.1 | 1.6 | PID IL1 PATHWAY | IL1-mediated signaling events |
| 0.1 | 8.7 | PID BETA CATENIN NUC PATHWAY | Regulation of nuclear beta catenin signaling and target gene transcription |
| 0.1 | 1.7 | PID ALK2 PATHWAY | ALK2 signaling events |
| 0.1 | 2.1 | PID ERBB1 INTERNALIZATION PATHWAY | Internalization of ErbB1 |
| 0.1 | 2.3 | PID RB 1PATHWAY | Regulation of retinoblastoma protein |
| 0.1 | 2.0 | PID P38 MKK3 6PATHWAY | p38 MAPK signaling pathway |
| 0.1 | 4.0 | PID ERA GENOMIC PATHWAY | Validated nuclear estrogen receptor alpha network |
| 0.1 | 1.0 | PID IL12 STAT4 PATHWAY | IL12 signaling mediated by STAT4 |
| 0.1 | 1.2 | PID RETINOIC ACID PATHWAY | Retinoic acid receptors-mediated signaling |
| 0.1 | 5.1 | PID CMYB PATHWAY | C-MYB transcription factor network |
| 0.1 | 1.6 | PID WNT SIGNALING PATHWAY | Wnt signaling network |
| 0.1 | 2.9 | PID RAC1 PATHWAY | RAC1 signaling pathway |
| 0.1 | 1.1 | PID UPA UPAR PATHWAY | Urokinase-type plasminogen activator (uPA) and uPAR-mediated signaling |
| 0.1 | 1.1 | PID HEDGEHOG 2PATHWAY | Signaling events mediated by the Hedgehog family |
| 0.1 | 0.6 | PID NFKAPPAB ATYPICAL PATHWAY | Atypical NF-kappaB pathway |
| 0.0 | 1.0 | SIG PIP3 SIGNALING IN B LYMPHOCYTES | Genes related to PIP3 signaling in B lymphocytes |
| 0.0 | 0.6 | PID ATF2 PATHWAY | ATF-2 transcription factor network |
| 0.0 | 1.8 | NABA PROTEOGLYCANS | Genes encoding proteoglycans |
| 0.0 | 0.7 | PID HDAC CLASSIII PATHWAY | Signaling events mediated by HDAC Class III |
| 0.0 | 1.7 | PID HIF1 TFPATHWAY | HIF-1-alpha transcription factor network |
| 0.0 | 0.5 | PID AR NONGENOMIC PATHWAY | Nongenotropic Androgen signaling |
| 0.0 | 9.5 | NABA SECRETED FACTORS | Genes encoding secreted soluble factors |
| 0.0 | 0.9 | PID ECADHERIN STABILIZATION PATHWAY | Stabilization and expansion of the E-cadherin adherens junction |
| 0.0 | 1.3 | PID TGFBR PATHWAY | TGF-beta receptor signaling |
| 0.0 | 0.3 | PID BCR 5PATHWAY | BCR signaling pathway |
| 0.0 | 0.8 | PID AR PATHWAY | Coregulation of Androgen receptor activity |
Gene overrepresentation in curated gene sets: REACTOME pathways category:
| Log-likelihood per target | Total log-likelihood | Term | Description |
|---|---|---|---|
| 2.2 | 22.0 | REACTOME TRAF6 MEDIATED IRF7 ACTIVATION IN TLR7 8 OR 9 SIGNALING | Genes involved in TRAF6 mediated IRF7 activation in TLR7/8 or 9 signaling |
| 2.0 | 32.2 | REACTOME POL SWITCHING | Genes involved in Polymerase switching |
| 1.8 | 38.2 | REACTOME TRANSLOCATION OF ZAP 70 TO IMMUNOLOGICAL SYNAPSE | Genes involved in Translocation of ZAP-70 to Immunological synapse |
| 1.6 | 37.7 | REACTOME ACTIVATED TAK1 MEDIATES P38 MAPK ACTIVATION | Genes involved in activated TAK1 mediates p38 MAPK activation |
| 1.2 | 8.4 | REACTOME REPAIR SYNTHESIS FOR GAP FILLING BY DNA POL IN TC NER | Genes involved in Repair synthesis for gap-filling by DNA polymerase in TC-NER |
| 1.1 | 22.7 | REACTOME BASE FREE SUGAR PHOSPHATE REMOVAL VIA THE SINGLE NUCLEOTIDE REPLACEMENT PATHWAY | Genes involved in Base-free sugar-phosphate removal via the single-nucleotide replacement pathway |
| 0.8 | 28.1 | REACTOME TRANSPORT OF RIBONUCLEOPROTEINS INTO THE HOST NUCLEUS | Genes involved in Transport of Ribonucleoproteins into the Host Nucleus |
| 0.7 | 18.5 | REACTOME GENERATION OF SECOND MESSENGER MOLECULES | Genes involved in Generation of second messenger molecules |
| 0.7 | 15.0 | REACTOME IL 7 SIGNALING | Genes involved in Interleukin-7 signaling |
| 0.7 | 18.4 | REACTOME CONVERSION FROM APC C CDC20 TO APC C CDH1 IN LATE ANAPHASE | Genes involved in Conversion from APC/C:Cdc20 to APC/C:Cdh1 in late anaphase |
| 0.6 | 24.0 | REACTOME SEMA4D INDUCED CELL MIGRATION AND GROWTH CONE COLLAPSE | Genes involved in Sema4D induced cell migration and growth-cone collapse |
| 0.6 | 56.9 | REACTOME INTERFERON ALPHA BETA SIGNALING | Genes involved in Interferon alpha/beta signaling |
| 0.5 | 19.8 | REACTOME ANTIGEN PROCESSING CROSS PRESENTATION | Genes involved in Antigen processing-Cross presentation |
| 0.5 | 7.1 | REACTOME ADENYLATE CYCLASE ACTIVATING PATHWAY | Genes involved in Adenylate cyclase activating pathway |
| 0.5 | 43.7 | REACTOME P53 DEPENDENT G1 DNA DAMAGE RESPONSE | Genes involved in p53-Dependent G1 DNA Damage Response |
| 0.5 | 14.3 | REACTOME NOD1 2 SIGNALING PATHWAY | Genes involved in NOD1/2 Signaling Pathway |
| 0.5 | 14.7 | REACTOME MEIOTIC RECOMBINATION | Genes involved in Meiotic Recombination |
| 0.5 | 12.6 | REACTOME REGULATION OF COMPLEMENT CASCADE | Genes involved in Regulation of Complement cascade |
| 0.5 | 7.8 | REACTOME DESTABILIZATION OF MRNA BY BRF1 | Genes involved in Destabilization of mRNA by Butyrate Response Factor 1 (BRF1) |
| 0.5 | 28.5 | REACTOME MITOCHONDRIAL PROTEIN IMPORT | Genes involved in Mitochondrial Protein Import |
| 0.5 | 39.9 | REACTOME IMMUNOREGULATORY INTERACTIONS BETWEEN A LYMPHOID AND A NON LYMPHOID CELL | Genes involved in Immunoregulatory interactions between a Lymphoid and a non-Lymphoid cell |
| 0.5 | 20.3 | REACTOME INTRINSIC PATHWAY FOR APOPTOSIS | Genes involved in Intrinsic Pathway for Apoptosis |
| 0.4 | 6.5 | REACTOME KERATAN SULFATE DEGRADATION | Genes involved in Keratan sulfate degradation |
| 0.4 | 4.6 | REACTOME REGULATION OF IFNG SIGNALING | Genes involved in Regulation of IFNG signaling |
| 0.4 | 10.8 | REACTOME METABOLISM OF NON CODING RNA | Genes involved in Metabolism of non-coding RNA |
| 0.4 | 2.4 | REACTOME P53 INDEPENDENT G1 S DNA DAMAGE CHECKPOINT | Genes involved in p53-Independent G1/S DNA damage checkpoint |
| 0.4 | 13.1 | REACTOME TRANSPORT OF MATURE TRANSCRIPT TO CYTOPLASM | Genes involved in Transport of Mature Transcript to Cytoplasm |
| 0.4 | 44.0 | REACTOME PROCESSING OF CAPPED INTRON CONTAINING PRE MRNA | Genes involved in Processing of Capped Intron-Containing Pre-mRNA |
| 0.4 | 3.5 | REACTOME CYCLIN A B1 ASSOCIATED EVENTS DURING G2 M TRANSITION | Genes involved in Cyclin A/B1 associated events during G2/M transition |
| 0.3 | 8.3 | REACTOME PURINE SALVAGE | Genes involved in Purine salvage |
| 0.3 | 5.4 | REACTOME BILE SALT AND ORGANIC ANION SLC TRANSPORTERS | Genes involved in Bile salt and organic anion SLC transporters |
| 0.3 | 12.1 | REACTOME IL1 SIGNALING | Genes involved in Interleukin-1 signaling |
| 0.3 | 12.7 | REACTOME PYRIMIDINE METABOLISM | Genes involved in Pyrimidine metabolism |
| 0.3 | 6.0 | REACTOME ALPHA LINOLENIC ACID ALA METABOLISM | Genes involved in alpha-linolenic acid (ALA) metabolism |
| 0.3 | 11.5 | REACTOME RNA POL II TRANSCRIPTION PRE INITIATION AND PROMOTER OPENING | Genes involved in RNA Polymerase II Transcription Pre-Initiation And Promoter Opening |
| 0.3 | 6.1 | REACTOME SYNTHESIS SECRETION AND DEACYLATION OF GHRELIN | Genes involved in Synthesis, Secretion, and Deacylation of Ghrelin |
| 0.3 | 3.2 | REACTOME G2 M DNA DAMAGE CHECKPOINT | Genes involved in G2/M DNA damage checkpoint |
| 0.3 | 12.9 | REACTOME EFFECTS OF PIP2 HYDROLYSIS | Genes involved in Effects of PIP2 hydrolysis |
| 0.3 | 12.8 | REACTOME TRANSPORT OF VITAMINS NUCLEOSIDES AND RELATED MOLECULES | Genes involved in Transport of vitamins, nucleosides, and related molecules |
| 0.3 | 5.6 | REACTOME ENDOGENOUS STEROLS | Genes involved in Endogenous sterols |
| 0.3 | 12.6 | REACTOME AMYLOIDS | Genes involved in Amyloids |
| 0.3 | 2.2 | REACTOME HOMOLOGOUS RECOMBINATION REPAIR OF REPLICATION INDEPENDENT DOUBLE STRAND BREAKS | Genes involved in Homologous recombination repair of replication-independent double-strand breaks |
| 0.3 | 6.0 | REACTOME CITRIC ACID CYCLE TCA CYCLE | Genes involved in Citric acid cycle (TCA cycle) |
| 0.3 | 8.7 | REACTOME GLUTATHIONE CONJUGATION | Genes involved in Glutathione conjugation |
| 0.3 | 25.9 | REACTOME MITOTIC PROMETAPHASE | Genes involved in Mitotic Prometaphase |
| 0.2 | 7.7 | REACTOME YAP1 AND WWTR1 TAZ STIMULATED GENE EXPRESSION | Genes involved in YAP1- and WWTR1 (TAZ)-stimulated gene expression |
| 0.2 | 6.8 | REACTOME NA CL DEPENDENT NEUROTRANSMITTER TRANSPORTERS | Genes involved in Na+/Cl- dependent neurotransmitter transporters |
| 0.2 | 3.4 | REACTOME VITAMIN B5 PANTOTHENATE METABOLISM | Genes involved in Vitamin B5 (pantothenate) metabolism |
| 0.2 | 16.0 | REACTOME FORMATION OF THE TERNARY COMPLEX AND SUBSEQUENTLY THE 43S COMPLEX | Genes involved in Formation of the ternary complex, and subsequently, the 43S complex |
| 0.2 | 6.2 | REACTOME ERK MAPK TARGETS | Genes involved in ERK/MAPK targets |
| 0.2 | 2.1 | REACTOME BETA DEFENSINS | Genes involved in Beta defensins |
| 0.2 | 2.2 | REACTOME DOUBLE STRAND BREAK REPAIR | Genes involved in Double-Strand Break Repair |
| 0.2 | 5.9 | REACTOME GROWTH HORMONE RECEPTOR SIGNALING | Genes involved in Growth hormone receptor signaling |
| 0.2 | 2.7 | REACTOME TRANSCRIPTION COUPLED NER TC NER | Genes involved in Transcription-coupled NER (TC-NER) |
| 0.2 | 8.2 | REACTOME LYSOSOME VESICLE BIOGENESIS | Genes involved in Lysosome Vesicle Biogenesis |
| 0.2 | 3.6 | REACTOME G0 AND EARLY G1 | Genes involved in G0 and Early G1 |
| 0.2 | 30.0 | REACTOME SIGNALING BY RHO GTPASES | Genes involved in Signaling by Rho GTPases |
| 0.2 | 19.6 | REACTOME SRP DEPENDENT COTRANSLATIONAL PROTEIN TARGETING TO MEMBRANE | Genes involved in SRP-dependent cotranslational protein targeting to membrane |
| 0.2 | 3.8 | REACTOME PROTEOLYTIC CLEAVAGE OF SNARE COMPLEX PROTEINS | Genes involved in Proteolytic cleavage of SNARE complex proteins |
| 0.1 | 3.1 | REACTOME HYALURONAN UPTAKE AND DEGRADATION | Genes involved in Hyaluronan uptake and degradation |
| 0.1 | 2.0 | REACTOME RECYCLING PATHWAY OF L1 | Genes involved in Recycling pathway of L1 |
| 0.1 | 5.5 | REACTOME NEGATIVE REGULATORS OF RIG I MDA5 SIGNALING | Genes involved in Negative regulators of RIG-I/MDA5 signaling |
| 0.1 | 5.4 | REACTOME SYNTHESIS OF PIPS AT THE PLASMA MEMBRANE | Genes involved in Synthesis of PIPs at the plasma membrane |
| 0.1 | 6.9 | REACTOME TRANSPORT TO THE GOLGI AND SUBSEQUENT MODIFICATION | Genes involved in Transport to the Golgi and subsequent modification |
| 0.1 | 4.0 | REACTOME SPHINGOLIPID DE NOVO BIOSYNTHESIS | Genes involved in Sphingolipid de novo biosynthesis |
| 0.1 | 3.5 | REACTOME EXTRINSIC PATHWAY FOR APOPTOSIS | Genes involved in Extrinsic Pathway for Apoptosis |
| 0.1 | 1.2 | REACTOME ETHANOL OXIDATION | Genes involved in Ethanol oxidation |
| 0.1 | 3.7 | REACTOME ANTIVIRAL MECHANISM BY IFN STIMULATED GENES | Genes involved in Antiviral mechanism by IFN-stimulated genes |
| 0.1 | 9.8 | REACTOME TRANSCRIPTIONAL REGULATION OF WHITE ADIPOCYTE DIFFERENTIATION | Genes involved in Transcriptional Regulation of White Adipocyte Differentiation |
| 0.1 | 0.2 | REACTOME VIF MEDIATED DEGRADATION OF APOBEC3G | Genes involved in Vif-mediated degradation of APOBEC3G |
| 0.1 | 2.0 | REACTOME GAP JUNCTION ASSEMBLY | Genes involved in Gap junction assembly |
| 0.1 | 1.6 | REACTOME UNWINDING OF DNA | Genes involved in Unwinding of DNA |
| 0.1 | 2.0 | REACTOME KINESINS | Genes involved in Kinesins |
| 0.1 | 3.4 | REACTOME SIGNALING BY NODAL | Genes involved in Signaling by NODAL |
| 0.1 | 3.6 | REACTOME TRANSLATION | Genes involved in Translation |
| 0.1 | 6.1 | REACTOME COLLAGEN FORMATION | Genes involved in Collagen formation |
| 0.1 | 7.9 | REACTOME FACTORS INVOLVED IN MEGAKARYOCYTE DEVELOPMENT AND PLATELET PRODUCTION | Genes involved in Factors involved in megakaryocyte development and platelet production |
| 0.1 | 3.5 | REACTOME AMINE LIGAND BINDING RECEPTORS | Genes involved in Amine ligand-binding receptors |
| 0.1 | 0.7 | REACTOME SOS MEDIATED SIGNALLING | Genes involved in SOS-mediated signalling |
| 0.1 | 2.4 | REACTOME METABOLISM OF PORPHYRINS | Genes involved in Metabolism of porphyrins |
| 0.1 | 3.3 | REACTOME CYTOCHROME P450 ARRANGED BY SUBSTRATE TYPE | Genes involved in Cytochrome P450 - arranged by substrate type |
| 0.1 | 1.9 | REACTOME ADP SIGNALLING THROUGH P2RY12 | Genes involved in ADP signalling through P2Y purinoceptor 12 |
| 0.1 | 0.5 | REACTOME ACTIVATION OF IRF3 IRF7 MEDIATED BY TBK1 IKK EPSILON | Genes involved in Activation of IRF3/IRF7 mediated by TBK1/IKK epsilon |
| 0.1 | 1.4 | REACTOME METABOLISM OF POLYAMINES | Genes involved in Metabolism of polyamines |
| 0.1 | 3.5 | REACTOME ION TRANSPORT BY P TYPE ATPASES | Genes involved in Ion transport by P-type ATPases |
| 0.1 | 1.8 | REACTOME DARPP 32 EVENTS | Genes involved in DARPP-32 events |
| 0.1 | 0.6 | REACTOME AMINE COMPOUND SLC TRANSPORTERS | Genes involved in Amine compound SLC transporters |
| 0.1 | 0.8 | REACTOME HORMONE LIGAND BINDING RECEPTORS | Genes involved in Hormone ligand-binding receptors |
| 0.1 | 0.7 | REACTOME THE NLRP3 INFLAMMASOME | Genes involved in The NLRP3 inflammasome |
| 0.0 | 2.4 | REACTOME MYOGENESIS | Genes involved in Myogenesis |
| 0.0 | 2.4 | REACTOME GLUCONEOGENESIS | Genes involved in Gluconeogenesis |
| 0.0 | 0.8 | REACTOME DOWNREGULATION OF SMAD2 3 SMAD4 TRANSCRIPTIONAL ACTIVITY | Genes involved in Downregulation of SMAD2/3:SMAD4 transcriptional activity |
| 0.0 | 0.5 | REACTOME KERATAN SULFATE BIOSYNTHESIS | Genes involved in Keratan sulfate biosynthesis |
| 0.0 | 0.7 | REACTOME METABOLISM OF STEROID HORMONES AND VITAMINS A AND D | Genes involved in Metabolism of steroid hormones and vitamins A and D |
| 0.0 | 0.7 | REACTOME METAL ION SLC TRANSPORTERS | Genes involved in Metal ion SLC transporters |
| 0.0 | 1.8 | REACTOME MHC CLASS II ANTIGEN PRESENTATION | Genes involved in MHC class II antigen presentation |
| 0.0 | 0.7 | REACTOME G1 PHASE | Genes involved in G1 Phase |
| 0.0 | 0.8 | REACTOME GABA A RECEPTOR ACTIVATION | Genes involved in GABA A receptor activation |
| 0.0 | 0.6 | REACTOME SIGNAL TRANSDUCTION BY L1 | Genes involved in Signal transduction by L1 |
| 0.0 | 0.8 | REACTOME TIGHT JUNCTION INTERACTIONS | Genes involved in Tight junction interactions |
| 0.0 | 0.9 | REACTOME NUCLEAR SIGNALING BY ERBB4 | Genes involved in Nuclear signaling by ERBB4 |
| 0.0 | 0.2 | REACTOME LIGAND GATED ION CHANNEL TRANSPORT | Genes involved in Ligand-gated ion channel transport |
| 0.0 | 0.2 | REACTOME G PROTEIN ACTIVATION | Genes involved in G-protein activation |
| 0.0 | 0.3 | REACTOME GLYCOGEN BREAKDOWN GLYCOGENOLYSIS | Genes involved in Glycogen breakdown (glycogenolysis) |
| 0.0 | 0.9 | REACTOME RESPIRATORY ELECTRON TRANSPORT | Genes involved in Respiratory electron transport |
| 0.0 | 0.4 | REACTOME BASIGIN INTERACTIONS | Genes involved in Basigin interactions |