Project
GNF SymAtlas + NCI-60 cancer cell lines, human (Su, 2004; Ross, 2000)
Navigation
Downloads
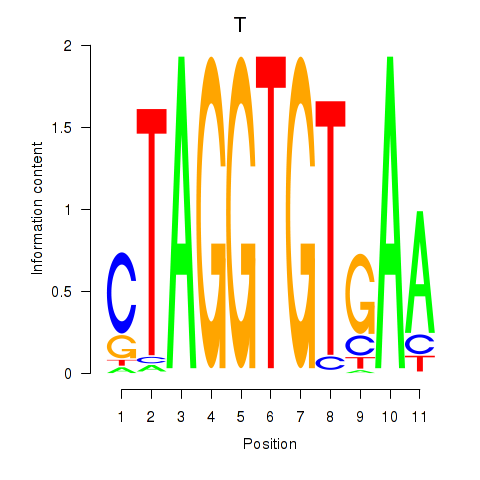
Results for T
Z-value: 0.81
Motif logo
Transcription factors associated with T
| Gene Symbol | Gene ID | Gene Info |
|---|---|---|
|
TBXT
|
ENSG00000164458.10 | TBXT |
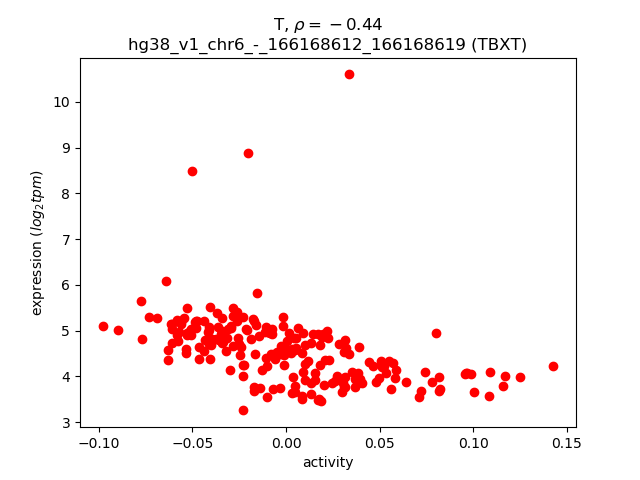
Activity-expression correlation:
| Gene | Promoter | Pearson corr. coef. | P-value | Plot |
|---|---|---|---|---|
| TBXT | hg38_v1_chr6_-_166168612_166168619, hg38_v1_chr6_-_166167832_166167861, hg38_v1_chr6_-_166168700_166168727 | -0.44 | 6.9e-12 | Click! |
Activity profile of T motif
Sorted Z-values of T motif
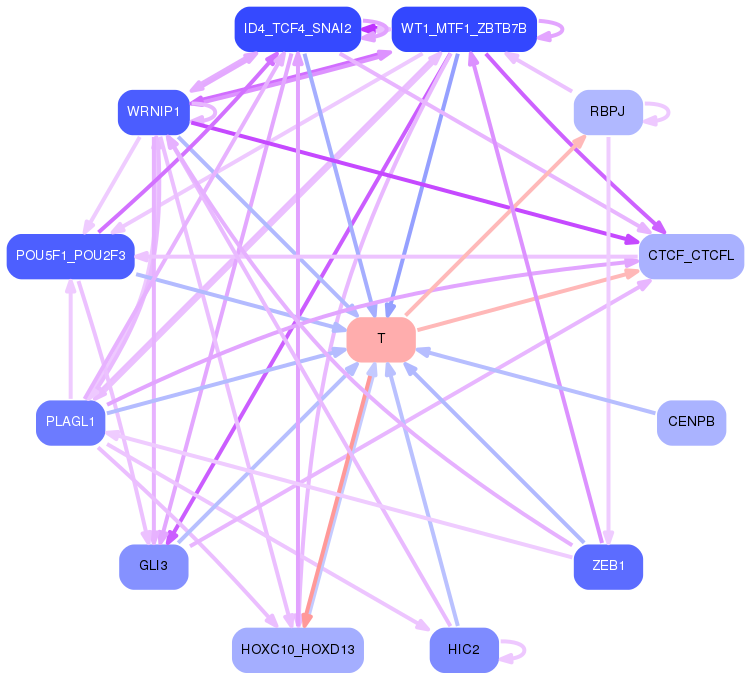
Network of associatons between targets according to the STRING database.

First level regulatory network of T
Gene Ontology Analysis
Gene overrepresentation in biological process category:
| Log-likelihood per target | Total log-likelihood | Term | Description |
|---|---|---|---|
| 4.0 | 12.1 | GO:0031550 | positive regulation of brain-derived neurotrophic factor receptor signaling pathway(GO:0031550) |
| 3.2 | 15.8 | GO:1902896 | terminal web assembly(GO:1902896) |
| 2.9 | 8.8 | GO:1904845 | response to L-glutamine(GO:1904844) cellular response to L-glutamine(GO:1904845) |
| 2.5 | 14.8 | GO:0043103 | hypoxanthine salvage(GO:0043103) |
| 2.4 | 24.2 | GO:0045716 | positive regulation of low-density lipoprotein particle receptor biosynthetic process(GO:0045716) |
| 2.0 | 6.0 | GO:0039689 | negative stranded viral RNA replication(GO:0039689) multi-organism biosynthetic process(GO:0044034) |
| 1.9 | 9.7 | GO:0040030 | regulation of molecular function, epigenetic(GO:0040030) |
| 1.9 | 24.9 | GO:0019388 | galactose catabolic process(GO:0019388) |
| 1.4 | 14.3 | GO:0060235 | lens induction in camera-type eye(GO:0060235) |
| 1.4 | 9.6 | GO:1905068 | arterial endothelial cell fate commitment(GO:0060844) blood vessel lumenization(GO:0072554) positive regulation of ephrin receptor signaling pathway(GO:1901189) positive regulation of canonical Wnt signaling pathway involved in cardiac muscle cell fate commitment(GO:1901297) positive regulation of canonical Wnt signaling pathway involved in heart development(GO:1905068) |
| 1.4 | 8.2 | GO:0061624 | fructose catabolic process(GO:0006001) fructose catabolic process to hydroxyacetone phosphate and glyceraldehyde-3-phosphate(GO:0061624) |
| 1.2 | 13.4 | GO:0021520 | spinal cord motor neuron cell fate specification(GO:0021520) |
| 1.1 | 6.5 | GO:0098838 | methotrexate transport(GO:0051958) reduced folate transmembrane transport(GO:0098838) |
| 1.1 | 6.4 | GO:0035803 | egg coat formation(GO:0035803) |
| 1.0 | 5.9 | GO:0070973 | protein localization to endoplasmic reticulum exit site(GO:0070973) |
| 1.0 | 10.6 | GO:0021902 | commitment of neuronal cell to specific neuron type in forebrain(GO:0021902) |
| 0.9 | 2.8 | GO:0048633 | response to electrical stimulus involved in regulation of muscle adaptation(GO:0014878) positive regulation of skeletal muscle tissue growth(GO:0048633) |
| 0.9 | 2.6 | GO:0038195 | urokinase plasminogen activator signaling pathway(GO:0038195) |
| 0.8 | 7.3 | GO:0045198 | establishment of epithelial cell apical/basal polarity(GO:0045198) |
| 0.8 | 14.9 | GO:0071803 | positive regulation of podosome assembly(GO:0071803) |
| 0.7 | 6.6 | GO:0009146 | purine nucleoside triphosphate catabolic process(GO:0009146) |
| 0.7 | 8.6 | GO:0051451 | myoblast migration(GO:0051451) |
| 0.7 | 4.9 | GO:0070537 | histone H2A K63-linked deubiquitination(GO:0070537) |
| 0.7 | 16.1 | GO:0048026 | positive regulation of mRNA splicing, via spliceosome(GO:0048026) |
| 0.7 | 3.9 | GO:0009753 | response to jasmonic acid(GO:0009753) cellular response to jasmonic acid stimulus(GO:0071395) |
| 0.6 | 4.5 | GO:2000002 | negative regulation of DNA damage checkpoint(GO:2000002) |
| 0.6 | 4.9 | GO:2000210 | positive regulation of anoikis(GO:2000210) |
| 0.6 | 1.8 | GO:0097252 | oligodendrocyte apoptotic process(GO:0097252) |
| 0.6 | 7.5 | GO:0048227 | plasma membrane to endosome transport(GO:0048227) |
| 0.6 | 8.6 | GO:0030422 | production of siRNA involved in RNA interference(GO:0030422) |
| 0.5 | 3.2 | GO:0021966 | corticospinal neuron axon guidance(GO:0021966) |
| 0.5 | 3.0 | GO:0016036 | cellular response to phosphate starvation(GO:0016036) positive regulation of sulfur amino acid metabolic process(GO:0031337) positive regulation of homocysteine metabolic process(GO:0050668) |
| 0.5 | 2.9 | GO:2000158 | positive regulation of ubiquitin-specific protease activity(GO:2000158) |
| 0.5 | 9.3 | GO:0006123 | mitochondrial electron transport, cytochrome c to oxygen(GO:0006123) |
| 0.5 | 5.5 | GO:0035845 | photoreceptor cell outer segment organization(GO:0035845) |
| 0.4 | 3.0 | GO:0097577 | intracellular sequestering of iron ion(GO:0006880) sequestering of iron ion(GO:0097577) |
| 0.4 | 3.7 | GO:0032057 | negative regulation of translational initiation in response to stress(GO:0032057) |
| 0.4 | 2.3 | GO:0090074 | negative regulation of protein homodimerization activity(GO:0090074) |
| 0.4 | 4.3 | GO:0051964 | negative regulation of synapse assembly(GO:0051964) |
| 0.4 | 1.8 | GO:0060800 | regulation of cell differentiation involved in embryonic placenta development(GO:0060800) |
| 0.3 | 8.4 | GO:0006491 | N-glycan processing(GO:0006491) |
| 0.3 | 4.2 | GO:2000659 | regulation of interleukin-1-mediated signaling pathway(GO:2000659) |
| 0.3 | 2.3 | GO:1902902 | negative regulation of autophagosome assembly(GO:1902902) |
| 0.3 | 25.5 | GO:0006521 | regulation of cellular amino acid metabolic process(GO:0006521) |
| 0.2 | 7.7 | GO:0019372 | lipoxygenase pathway(GO:0019372) |
| 0.2 | 2.4 | GO:2000786 | positive regulation of autophagosome assembly(GO:2000786) |
| 0.2 | 5.0 | GO:0090190 | positive regulation of branching involved in ureteric bud morphogenesis(GO:0090190) |
| 0.2 | 0.7 | GO:0035522 | monoubiquitinated histone deubiquitination(GO:0035521) monoubiquitinated histone H2A deubiquitination(GO:0035522) |
| 0.2 | 5.4 | GO:0048025 | negative regulation of mRNA splicing, via spliceosome(GO:0048025) |
| 0.2 | 1.7 | GO:0000395 | mRNA 5'-splice site recognition(GO:0000395) |
| 0.2 | 0.7 | GO:0035627 | ceramide transport(GO:0035627) |
| 0.2 | 2.1 | GO:0052697 | flavonoid glucuronidation(GO:0052696) xenobiotic glucuronidation(GO:0052697) |
| 0.1 | 4.7 | GO:0006622 | protein targeting to lysosome(GO:0006622) |
| 0.1 | 10.6 | GO:0008631 | intrinsic apoptotic signaling pathway in response to oxidative stress(GO:0008631) |
| 0.1 | 0.3 | GO:0048840 | otolith development(GO:0048840) |
| 0.1 | 0.7 | GO:1990034 | calcium ion export(GO:1901660) calcium ion export from cell(GO:1990034) |
| 0.1 | 1.1 | GO:0048007 | antigen processing and presentation of lipid antigen via MHC class Ib(GO:0048003) antigen processing and presentation, exogenous lipid antigen via MHC class Ib(GO:0048007) |
| 0.1 | 1.5 | GO:0040033 | miRNA mediated inhibition of translation(GO:0035278) negative regulation of translation, ncRNA-mediated(GO:0040033) regulation of translation, ncRNA-mediated(GO:0045974) |
| 0.1 | 7.4 | GO:0000186 | activation of MAPKK activity(GO:0000186) |
| 0.1 | 5.5 | GO:0000413 | protein peptidyl-prolyl isomerization(GO:0000413) |
| 0.1 | 1.4 | GO:0001867 | complement activation, lectin pathway(GO:0001867) |
| 0.1 | 8.2 | GO:0006890 | retrograde vesicle-mediated transport, Golgi to ER(GO:0006890) |
| 0.1 | 2.6 | GO:0050855 | regulation of B cell receptor signaling pathway(GO:0050855) |
| 0.1 | 2.2 | GO:0009235 | cobalamin metabolic process(GO:0009235) |
| 0.1 | 3.2 | GO:2000816 | negative regulation of mitotic sister chromatid separation(GO:2000816) |
| 0.1 | 3.0 | GO:0032467 | positive regulation of cytokinesis(GO:0032467) |
| 0.0 | 0.1 | GO:0032831 | regulation of CD4-positive, CD25-positive, alpha-beta regulatory T cell differentiation(GO:0032829) positive regulation of CD4-positive, CD25-positive, alpha-beta regulatory T cell differentiation(GO:0032831) negative regulation of CD4-positive, alpha-beta T cell proliferation(GO:2000562) |
| 0.0 | 2.2 | GO:0051973 | positive regulation of telomerase activity(GO:0051973) |
| 0.0 | 2.5 | GO:0001755 | neural crest cell migration(GO:0001755) |
| 0.0 | 1.9 | GO:0045104 | intermediate filament cytoskeleton organization(GO:0045104) |
| 0.0 | 11.0 | GO:0000377 | RNA splicing, via transesterification reactions with bulged adenosine as nucleophile(GO:0000377) mRNA splicing, via spliceosome(GO:0000398) |
| 0.0 | 1.1 | GO:0007585 | respiratory gaseous exchange(GO:0007585) |
Gene overrepresentation in cellular component category:
| Log-likelihood per target | Total log-likelihood | Term | Description |
|---|---|---|---|
| 2.6 | 15.8 | GO:1990357 | terminal web(GO:1990357) |
| 1.8 | 5.5 | GO:1902636 | kinociliary basal body(GO:1902636) |
| 1.5 | 13.4 | GO:0019907 | cyclin-dependent protein kinase activating kinase holoenzyme complex(GO:0019907) |
| 1.2 | 14.9 | GO:0008290 | F-actin capping protein complex(GO:0008290) |
| 1.2 | 6.0 | GO:0034274 | Atg12-Atg5-Atg16 complex(GO:0034274) |
| 1.1 | 13.7 | GO:0019773 | proteasome core complex, alpha-subunit complex(GO:0019773) |
| 1.1 | 9.6 | GO:0002193 | MAML1-RBP-Jkappa- ICN1 complex(GO:0002193) |
| 0.8 | 2.5 | GO:0043260 | laminin-10 complex(GO:0043259) laminin-11 complex(GO:0043260) |
| 0.7 | 9.3 | GO:0005751 | mitochondrial respiratory chain complex IV(GO:0005751) |
| 0.7 | 16.1 | GO:0005689 | U12-type spliceosomal complex(GO:0005689) |
| 0.6 | 4.5 | GO:0005687 | U4 snRNP(GO:0005687) |
| 0.6 | 11.8 | GO:0005839 | proteasome core complex(GO:0005839) |
| 0.6 | 8.8 | GO:0043020 | NADPH oxidase complex(GO:0043020) |
| 0.5 | 5.4 | GO:0061574 | ASAP complex(GO:0061574) |
| 0.5 | 4.7 | GO:0044754 | autolysosome(GO:0044754) |
| 0.5 | 3.7 | GO:0005851 | eukaryotic translation initiation factor 2B complex(GO:0005851) |
| 0.4 | 3.0 | GO:0044326 | dendritic spine neck(GO:0044326) |
| 0.4 | 7.4 | GO:0005662 | DNA replication factor A complex(GO:0005662) |
| 0.3 | 4.9 | GO:0070531 | BRCA1-A complex(GO:0070531) |
| 0.2 | 8.6 | GO:0090665 | dystrophin-associated glycoprotein complex(GO:0016010) glycoprotein complex(GO:0090665) |
| 0.2 | 0.7 | GO:0035517 | PR-DUB complex(GO:0035517) |
| 0.2 | 21.5 | GO:0033116 | endoplasmic reticulum-Golgi intermediate compartment membrane(GO:0033116) |
| 0.2 | 2.6 | GO:0071438 | invadopodium membrane(GO:0071438) |
| 0.2 | 5.2 | GO:0071782 | endoplasmic reticulum tubular network(GO:0071782) |
| 0.2 | 4.9 | GO:0070822 | Sin3-type complex(GO:0070822) |
| 0.2 | 2.7 | GO:0030478 | actin cap(GO:0030478) |
| 0.1 | 1.1 | GO:0097208 | alveolar lamellar body(GO:0097208) |
| 0.1 | 10.6 | GO:0000118 | histone deacetylase complex(GO:0000118) |
| 0.1 | 3.2 | GO:0001518 | voltage-gated sodium channel complex(GO:0001518) |
| 0.1 | 16.5 | GO:0005913 | cell-cell adherens junction(GO:0005913) |
| 0.1 | 7.5 | GO:0035577 | azurophil granule membrane(GO:0035577) |
| 0.1 | 0.7 | GO:0097209 | epidermal lamellar body(GO:0097209) |
| 0.1 | 3.3 | GO:0045095 | keratin filament(GO:0045095) |
| 0.1 | 1.7 | GO:0035145 | exon-exon junction complex(GO:0035145) |
| 0.1 | 9.2 | GO:0016605 | PML body(GO:0016605) |
| 0.1 | 4.3 | GO:0001725 | stress fiber(GO:0001725) contractile actin filament bundle(GO:0097517) |
| 0.1 | 3.0 | GO:0097610 | cleavage furrow(GO:0032154) cell surface furrow(GO:0097610) |
| 0.0 | 9.7 | GO:0000775 | chromosome, centromeric region(GO:0000775) |
| 0.0 | 0.7 | GO:0032591 | dendritic spine membrane(GO:0032591) |
| 0.0 | 2.4 | GO:0005776 | autophagosome(GO:0005776) |
| 0.0 | 10.2 | GO:0005788 | endoplasmic reticulum lumen(GO:0005788) |
| 0.0 | 1.9 | GO:1904724 | tertiary granule lumen(GO:1904724) |
| 0.0 | 6.5 | GO:0016323 | basolateral plasma membrane(GO:0016323) |
| 0.0 | 8.2 | GO:0016607 | nuclear speck(GO:0016607) |
| 0.0 | 3.0 | GO:0043197 | dendritic spine(GO:0043197) |
| 0.0 | 4.0 | GO:0005938 | cell cortex(GO:0005938) |
| 0.0 | 7.1 | GO:0005925 | focal adhesion(GO:0005925) |
| 0.0 | 1.1 | GO:0043202 | lysosomal lumen(GO:0043202) |
Gene overrepresentation in molecular function category:
| Log-likelihood per target | Total log-likelihood | Term | Description |
|---|---|---|---|
| 8.3 | 24.9 | GO:0003974 | UDP-N-acetylglucosamine 4-epimerase activity(GO:0003974) UDP-glucose 4-epimerase activity(GO:0003978) |
| 3.2 | 9.7 | GO:0043035 | chromatin insulator sequence binding(GO:0043035) |
| 3.0 | 12.1 | GO:0005169 | neurotrophin TRKB receptor binding(GO:0005169) |
| 2.2 | 6.6 | GO:0035529 | NADH pyrophosphatase activity(GO:0035529) |
| 1.9 | 7.7 | GO:0046573 | lactonohydrolase activity(GO:0046573) acyl-L-homoserine-lactone lactonohydrolase activity(GO:0102007) |
| 1.4 | 5.5 | GO:0002046 | opsin binding(GO:0002046) |
| 1.4 | 8.2 | GO:0018479 | benzaldehyde dehydrogenase (NAD+) activity(GO:0018479) |
| 1.2 | 6.0 | GO:0019776 | Atg8 ligase activity(GO:0019776) |
| 1.1 | 6.5 | GO:0008518 | reduced folate carrier activity(GO:0008518) methotrexate transporter activity(GO:0015350) |
| 1.0 | 7.3 | GO:1904929 | coreceptor activity involved in Wnt signaling pathway, planar cell polarity pathway(GO:1904929) |
| 0.9 | 2.8 | GO:0004711 | ribosomal protein S6 kinase activity(GO:0004711) |
| 0.8 | 2.4 | GO:0016309 | 1-phosphatidylinositol-5-phosphate 4-kinase activity(GO:0016309) |
| 0.8 | 3.9 | GO:0018636 | phenanthrene 9,10-monooxygenase activity(GO:0018636) ketosteroid monooxygenase activity(GO:0047086) trans-1,2-dihydrobenzene-1,2-diol dehydrogenase activity(GO:0047115) |
| 0.7 | 6.4 | GO:0032190 | acrosin binding(GO:0032190) |
| 0.6 | 3.2 | GO:0086062 | voltage-gated sodium channel activity involved in Purkinje myocyte action potential(GO:0086062) |
| 0.6 | 9.3 | GO:0000150 | recombinase activity(GO:0000150) |
| 0.5 | 4.5 | GO:0030621 | U4 snRNA binding(GO:0030621) |
| 0.5 | 13.7 | GO:0070003 | threonine-type endopeptidase activity(GO:0004298) threonine-type peptidase activity(GO:0070003) |
| 0.5 | 2.9 | GO:0035800 | deubiquitinase activator activity(GO:0035800) |
| 0.5 | 11.8 | GO:0070628 | proteasome binding(GO:0070628) |
| 0.4 | 8.8 | GO:0016175 | superoxide-generating NADPH oxidase activity(GO:0016175) |
| 0.4 | 4.6 | GO:0010314 | phosphatidylinositol-5-phosphate binding(GO:0010314) |
| 0.4 | 8.8 | GO:0098641 | cadherin binding involved in cell-cell adhesion(GO:0098641) |
| 0.3 | 6.6 | GO:0008432 | JUN kinase binding(GO:0008432) |
| 0.3 | 3.0 | GO:0016206 | catechol O-methyltransferase activity(GO:0016206) |
| 0.3 | 9.3 | GO:0004129 | cytochrome-c oxidase activity(GO:0004129) heme-copper terminal oxidase activity(GO:0015002) oxidoreductase activity, acting on a heme group of donors, oxygen as acceptor(GO:0016676) |
| 0.3 | 6.6 | GO:0017049 | GTP-Rho binding(GO:0017049) |
| 0.2 | 1.7 | GO:0050733 | DNA topoisomerase binding(GO:0044547) RS domain binding(GO:0050733) |
| 0.2 | 14.8 | GO:0016763 | transferase activity, transferring pentosyl groups(GO:0016763) |
| 0.2 | 7.4 | GO:0004709 | MAP kinase kinase kinase activity(GO:0004709) |
| 0.2 | 4.9 | GO:0070530 | K63-linked polyubiquitin binding(GO:0070530) |
| 0.2 | 5.5 | GO:0005527 | macrolide binding(GO:0005527) FK506 binding(GO:0005528) |
| 0.1 | 8.4 | GO:0005080 | protein kinase C binding(GO:0005080) |
| 0.1 | 0.7 | GO:0034040 | lipid-transporting ATPase activity(GO:0034040) |
| 0.1 | 3.0 | GO:0004697 | protein kinase C activity(GO:0004697) |
| 0.1 | 11.8 | GO:0004715 | non-membrane spanning protein tyrosine kinase activity(GO:0004715) |
| 0.1 | 4.9 | GO:0051059 | NF-kappaB binding(GO:0051059) |
| 0.1 | 30.6 | GO:0051015 | actin filament binding(GO:0051015) |
| 0.1 | 1.4 | GO:0030280 | structural constituent of epidermis(GO:0030280) |
| 0.1 | 1.1 | GO:0030882 | lipid antigen binding(GO:0030882) endogenous lipid antigen binding(GO:0030883) exogenous lipid antigen binding(GO:0030884) |
| 0.1 | 2.7 | GO:0005523 | tropomyosin binding(GO:0005523) |
| 0.1 | 7.5 | GO:0019003 | GDP binding(GO:0019003) |
| 0.1 | 3.0 | GO:0004198 | calcium-dependent cysteine-type endopeptidase activity(GO:0004198) |
| 0.1 | 1.8 | GO:0048018 | receptor agonist activity(GO:0048018) |
| 0.1 | 4.7 | GO:0050681 | androgen receptor binding(GO:0050681) |
| 0.1 | 2.1 | GO:0015020 | glucuronosyltransferase activity(GO:0015020) |
| 0.1 | 1.6 | GO:0008239 | dipeptidyl-peptidase activity(GO:0008239) |
| 0.1 | 8.6 | GO:0004519 | endonuclease activity(GO:0004519) |
| 0.1 | 3.7 | GO:0003743 | translation initiation factor activity(GO:0003743) |
| 0.1 | 2.3 | GO:0005484 | SNAP receptor activity(GO:0005484) |
| 0.0 | 1.8 | GO:0043539 | protein serine/threonine kinase activator activity(GO:0043539) |
| 0.0 | 5.4 | GO:0003730 | mRNA 3'-UTR binding(GO:0003730) |
| 0.0 | 0.1 | GO:0048030 | disaccharide binding(GO:0048030) |
| 0.0 | 0.6 | GO:0004185 | serine-type carboxypeptidase activity(GO:0004185) |
| 0.0 | 0.2 | GO:0004427 | inorganic diphosphatase activity(GO:0004427) |
| 0.0 | 0.3 | GO:0003958 | NADPH-hemoprotein reductase activity(GO:0003958) |
| 0.0 | 1.0 | GO:0070001 | aspartic-type endopeptidase activity(GO:0004190) aspartic-type peptidase activity(GO:0070001) |
| 0.0 | 17.5 | GO:0004674 | protein serine/threonine kinase activity(GO:0004674) |
| 0.0 | 5.7 | GO:0005516 | calmodulin binding(GO:0005516) |
| 0.0 | 0.8 | GO:0005540 | hyaluronic acid binding(GO:0005540) |
| 0.0 | 3.2 | GO:0017124 | SH3 domain binding(GO:0017124) |
Gene overrepresentation in curated gene sets: canonical pathways category:
| Log-likelihood per target | Total log-likelihood | Term | Description |
|---|---|---|---|
| 0.2 | 7.2 | PID IGF1 PATHWAY | IGF1 pathway |
| 0.1 | 17.1 | PID P75 NTR PATHWAY | p75(NTR)-mediated signaling |
| 0.1 | 9.6 | PID HES HEY PATHWAY | Notch-mediated HES/HEY network |
| 0.1 | 2.6 | SA G1 AND S PHASES | Cdk2, 4, and 6 bind cyclin D in G1, while cdk2/cyclin E promotes the G1/S transition. |
| 0.1 | 2.5 | PID INTEGRIN4 PATHWAY | Alpha6 beta4 integrin-ligand interactions |
| 0.1 | 8.8 | PID RAC1 PATHWAY | RAC1 signaling pathway |
| 0.1 | 4.9 | PID ATM PATHWAY | ATM pathway |
| 0.1 | 8.6 | PID RHOA REG PATHWAY | Regulation of RhoA activity |
| 0.1 | 14.4 | WNT SIGNALING | Genes related to Wnt-mediated signal transduction |
| 0.1 | 2.6 | PID INTEGRIN5 PATHWAY | Beta5 beta6 beta7 and beta8 integrin cell surface interactions |
| 0.1 | 3.0 | PID RHOA PATHWAY | RhoA signaling pathway |
| 0.1 | 5.5 | PID HDAC CLASSI PATHWAY | Signaling events mediated by HDAC Class I |
| 0.0 | 2.6 | PID ANGIOPOIETIN RECEPTOR PATHWAY | Angiopoietin receptor Tie2-mediated signaling |
| 0.0 | 4.7 | PID AR PATHWAY | Coregulation of Androgen receptor activity |
| 0.0 | 8.2 | NABA ECM GLYCOPROTEINS | Genes encoding structural ECM glycoproteins |
| 0.0 | 2.3 | PID ARF6 TRAFFICKING PATHWAY | Arf6 trafficking events |
| 0.0 | 5.1 | NABA ECM AFFILIATED | Genes encoding proteins affiliated structurally or functionally to extracellular matrix proteins |
| 0.0 | 1.0 | PID CERAMIDE PATHWAY | Ceramide signaling pathway |
Gene overrepresentation in curated gene sets: REACTOME pathways category:
| Log-likelihood per target | Total log-likelihood | Term | Description |
|---|---|---|---|
| 0.8 | 8.2 | REACTOME ETHANOL OXIDATION | Genes involved in Ethanol oxidation |
| 0.6 | 14.8 | REACTOME PURINE SALVAGE | Genes involved in Purine salvage |
| 0.6 | 8.4 | REACTOME CALNEXIN CALRETICULIN CYCLE | Genes involved in Calnexin/calreticulin cycle |
| 0.5 | 9.6 | REACTOME NOTCH HLH TRANSCRIPTION PATHWAY | Genes involved in Notch-HLH transcription pathway |
| 0.4 | 25.5 | REACTOME CROSS PRESENTATION OF SOLUBLE EXOGENOUS ANTIGENS ENDOSOMES | Genes involved in Cross-presentation of soluble exogenous antigens (endosomes) |
| 0.3 | 17.8 | REACTOME MRNA SPLICING MINOR PATHWAY | Genes involved in mRNA Splicing - Minor Pathway |
| 0.3 | 5.0 | REACTOME ROLE OF DCC IN REGULATING APOPTOSIS | Genes involved in Role of DCC in regulating apoptosis |
| 0.2 | 8.8 | REACTOME ANTIGEN PROCESSING CROSS PRESENTATION | Genes involved in Antigen processing-Cross presentation |
| 0.2 | 4.3 | REACTOME P130CAS LINKAGE TO MAPK SIGNALING FOR INTEGRINS | Genes involved in p130Cas linkage to MAPK signaling for integrins |
| 0.2 | 2.8 | REACTOME MTORC1 MEDIATED SIGNALLING | Genes involved in mTORC1-mediated signalling |
| 0.1 | 5.4 | REACTOME MRNA 3 END PROCESSING | Genes involved in mRNA 3'-end processing |
| 0.1 | 1.5 | REACTOME REGULATORY RNA PATHWAYS | Genes involved in Regulatory RNA pathways |
| 0.1 | 8.6 | REACTOME NRAGE SIGNALS DEATH THROUGH JNK | Genes involved in NRAGE signals death through JNK |
| 0.1 | 2.6 | REACTOME SYNTHESIS OF PIPS AT THE GOLGI MEMBRANE | Genes involved in Synthesis of PIPs at the Golgi membrane |
| 0.1 | 9.3 | REACTOME RESPIRATORY ELECTRON TRANSPORT | Genes involved in Respiratory electron transport |
| 0.1 | 2.9 | REACTOME TRAF6 MEDIATED IRF7 ACTIVATION | Genes involved in TRAF6 mediated IRF7 activation |
| 0.1 | 6.0 | REACTOME NEGATIVE REGULATORS OF RIG I MDA5 SIGNALING | Genes involved in Negative regulators of RIG-I/MDA5 signaling |
| 0.1 | 2.1 | REACTOME GLUCURONIDATION | Genes involved in Glucuronidation |
| 0.1 | 6.5 | REACTOME METABOLISM OF VITAMINS AND COFACTORS | Genes involved in Metabolism of vitamins and cofactors |
| 0.1 | 2.6 | REACTOME POST TRANSLATIONAL MODIFICATION SYNTHESIS OF GPI ANCHORED PROTEINS | Genes involved in Post-translational modification: synthesis of GPI-anchored proteins |
| 0.1 | 3.2 | REACTOME INTERACTION BETWEEN L1 AND ANKYRINS | Genes involved in Interaction between L1 and Ankyrins |
| 0.1 | 24.9 | REACTOME METABOLISM OF CARBOHYDRATES | Genes involved in Metabolism of carbohydrates |
| 0.1 | 1.8 | REACTOME SIGNALING BY HIPPO | Genes involved in Signaling by Hippo |
| 0.1 | 2.4 | REACTOME SYNTHESIS OF PIPS AT THE PLASMA MEMBRANE | Genes involved in Synthesis of PIPs at the plasma membrane |
| 0.1 | 3.6 | REACTOME MRNA SPLICING | Genes involved in mRNA Splicing |
| 0.1 | 2.4 | REACTOME SMOOTH MUSCLE CONTRACTION | Genes involved in Smooth Muscle Contraction |
| 0.1 | 3.9 | REACTOME GOLGI ASSOCIATED VESICLE BIOGENESIS | Genes involved in Golgi Associated Vesicle Biogenesis |
| 0.0 | 0.7 | REACTOME ABCA TRANSPORTERS IN LIPID HOMEOSTASIS | Genes involved in ABCA transporters in lipid homeostasis |
| 0.0 | 2.2 | REACTOME PHASE II CONJUGATION | Genes involved in Phase II conjugation |
| 0.0 | 4.1 | REACTOME TRANSLATION | Genes involved in Translation |