Project
GNF SymAtlas + NCI-60 cancer cell lines, human (Su, 2004; Ross, 2000)
Navigation
Downloads
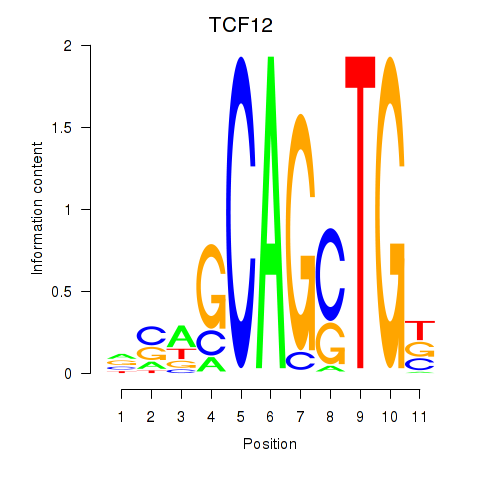
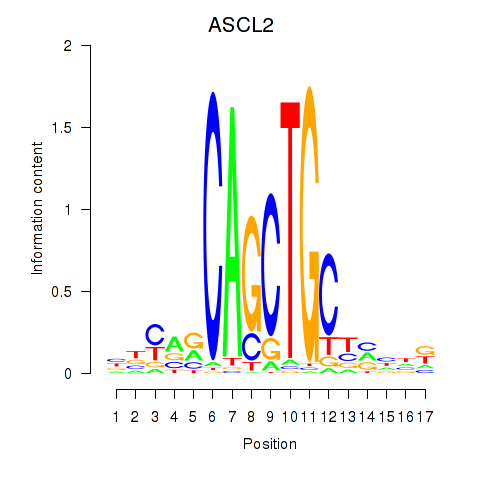
Results for TCF12_ASCL2
Z-value: 1.57
Motif logo
Transcription factors associated with TCF12_ASCL2
| Gene Symbol | Gene ID | Gene Info |
|---|---|---|
|
TCF12
|
ENSG00000140262.18 | TCF12 |
|
ASCL2
|
ENSG00000183734.5 | ASCL2 |
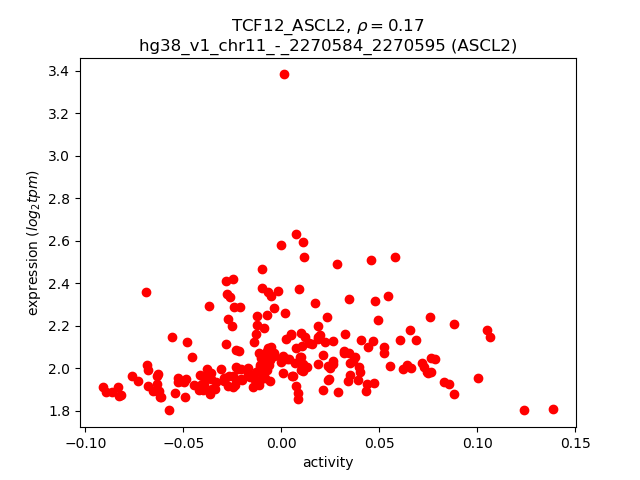
Activity-expression correlation:
| Gene | Promoter | Pearson corr. coef. | P-value | Plot |
|---|---|---|---|---|
| TCF12 | hg38_v1_chr15_+_56918763_56918832 | -0.37 | 1.3e-08 | Click! |
| ASCL2 | hg38_v1_chr11_-_2270584_2270595 | 0.17 | 1.2e-02 | Click! |
Activity profile of TCF12_ASCL2 motif
Sorted Z-values of TCF12_ASCL2 motif
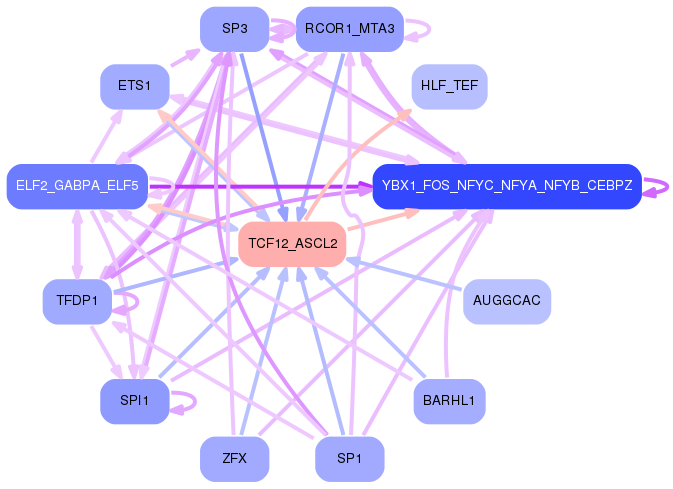
Network of associatons between targets according to the STRING database.

First level regulatory network of TCF12_ASCL2
Gene Ontology Analysis
Gene overrepresentation in biological process category:
| Log-likelihood per target | Total log-likelihood | Term | Description |
|---|---|---|---|
| 12.1 | 36.2 | GO:0000738 | DNA catabolic process, exonucleolytic(GO:0000738) |
| 6.0 | 23.8 | GO:0002277 | myeloid dendritic cell activation involved in immune response(GO:0002277) |
| 5.9 | 29.4 | GO:0050861 | positive regulation of B cell receptor signaling pathway(GO:0050861) |
| 5.7 | 17.2 | GO:0071461 | cellular response to redox state(GO:0071461) |
| 4.6 | 37.1 | GO:0070235 | regulation of activation-induced cell death of T cells(GO:0070235) negative regulation of activation-induced cell death of T cells(GO:0070236) |
| 4.6 | 13.7 | GO:0060448 | dichotomous subdivision of terminal units involved in lung branching(GO:0060448) |
| 4.5 | 13.5 | GO:0070078 | peptidyl-lysine hydroxylation to 5-hydroxy-L-lysine(GO:0018395) histone arginine demethylation(GO:0070077) histone H3-R2 demethylation(GO:0070078) histone H4-R3 demethylation(GO:0070079) |
| 4.4 | 17.5 | GO:0003366 | cell-matrix adhesion involved in ameboidal cell migration(GO:0003366) |
| 4.4 | 13.1 | GO:0043376 | regulation of CD8-positive, alpha-beta T cell differentiation(GO:0043376) |
| 4.4 | 30.6 | GO:0045079 | negative regulation of chemokine biosynthetic process(GO:0045079) |
| 4.3 | 12.9 | GO:1902309 | negative regulation of peptidyl-serine dephosphorylation(GO:1902309) |
| 4.3 | 12.9 | GO:0001794 | type IIa hypersensitivity(GO:0001794) regulation of type IIa hypersensitivity(GO:0001796) type II hypersensitivity(GO:0002445) regulation of type II hypersensitivity(GO:0002892) |
| 4.2 | 16.9 | GO:0045065 | cytotoxic T cell differentiation(GO:0045065) |
| 3.9 | 23.4 | GO:2000503 | positive regulation of natural killer cell chemotaxis(GO:2000503) |
| 3.7 | 22.4 | GO:2000405 | negative regulation of T cell migration(GO:2000405) |
| 3.7 | 11.1 | GO:1900220 | semaphorin-plexin signaling pathway involved in bone trabecula morphogenesis(GO:1900220) |
| 3.7 | 18.3 | GO:0010193 | response to ozone(GO:0010193) |
| 3.6 | 14.5 | GO:2000314 | fibroblast growth factor receptor signaling pathway involved in neural plate anterior/posterior pattern formation(GO:0060825) regulation of neural crest formation(GO:0090299) negative regulation of neural crest formation(GO:0090301) regulation of fibroblast growth factor receptor signaling pathway involved in neural plate anterior/posterior pattern formation(GO:2000313) negative regulation of fibroblast growth factor receptor signaling pathway involved in neural plate anterior/posterior pattern formation(GO:2000314) |
| 3.5 | 14.0 | GO:0005986 | sucrose biosynthetic process(GO:0005986) |
| 3.4 | 246.8 | GO:0006910 | phagocytosis, recognition(GO:0006910) |
| 3.3 | 9.8 | GO:0002818 | intracellular defense response(GO:0002818) |
| 3.3 | 26.1 | GO:1904153 | negative regulation of protein exit from endoplasmic reticulum(GO:0070862) negative regulation of retrograde protein transport, ER to cytosol(GO:1904153) |
| 3.2 | 13.0 | GO:0021571 | rhombomere 5 development(GO:0021571) |
| 3.2 | 9.6 | GO:0045911 | positive regulation of DNA recombination(GO:0045911) |
| 3.1 | 9.4 | GO:1990922 | regulation of hepatic stellate cell proliferation(GO:1904897) positive regulation of hepatic stellate cell proliferation(GO:1904899) hepatic stellate cell proliferation(GO:1990922) |
| 3.1 | 9.4 | GO:2000755 | regulation of phospholipid scramblase activity(GO:1900161) positive regulation of phospholipid scramblase activity(GO:1900163) regulation of glucosylceramide catabolic process(GO:2000752) positive regulation of glucosylceramide catabolic process(GO:2000753) regulation of sphingomyelin catabolic process(GO:2000754) positive regulation of sphingomyelin catabolic process(GO:2000755) |
| 3.0 | 27.1 | GO:0001661 | conditioned taste aversion(GO:0001661) |
| 3.0 | 18.1 | GO:0006287 | base-excision repair, gap-filling(GO:0006287) |
| 3.0 | 8.9 | GO:0021986 | epithalamus development(GO:0021538) habenula development(GO:0021986) |
| 2.9 | 11.5 | GO:0002032 | desensitization of G-protein coupled receptor protein signaling pathway by arrestin(GO:0002032) |
| 2.9 | 11.5 | GO:0052552 | induction by symbiont of host defense response(GO:0044416) induction of host immune response by virus(GO:0046730) active induction of host immune response by virus(GO:0046732) modulation by symbiont of host defense response(GO:0052031) induction by organism of defense response of other organism involved in symbiotic interaction(GO:0052251) modulation by organism of defense response of other organism involved in symbiotic interaction(GO:0052255) positive regulation by symbiont of host defense response(GO:0052509) positive regulation by organism of defense response of other organism involved in symbiotic interaction(GO:0052510) modulation by organism of immune response of other organism involved in symbiotic interaction(GO:0052552) modulation by symbiont of host immune response(GO:0052553) modulation by virus of host immune response(GO:0075528) |
| 2.9 | 8.6 | GO:1904017 | cellular response to Thyroglobulin triiodothyronine(GO:1904017) |
| 2.8 | 8.5 | GO:1902630 | regulation of membrane hyperpolarization(GO:1902630) |
| 2.8 | 16.8 | GO:2001184 | positive regulation of interleukin-12 secretion(GO:2001184) |
| 2.8 | 14.0 | GO:0014738 | regulation of muscle hyperplasia(GO:0014738) |
| 2.7 | 10.7 | GO:2000196 | positive regulation of female gonad development(GO:2000196) |
| 2.7 | 5.4 | GO:2000412 | positive regulation of thymocyte migration(GO:2000412) |
| 2.6 | 10.4 | GO:0008588 | release of cytoplasmic sequestered NF-kappaB(GO:0008588) |
| 2.6 | 5.2 | GO:0072535 | tumor necrosis factor (ligand) superfamily member 11 production(GO:0072535) regulation of tumor necrosis factor (ligand) superfamily member 11 production(GO:2000307) |
| 2.5 | 2.5 | GO:1904435 | positive regulation of iron ion transport(GO:0034758) positive regulation of iron ion transmembrane transport(GO:0034761) regulation of iron ion import(GO:1900390) regulation of ferrous iron import into cell(GO:1903989) positive regulation of ferrous iron import into cell(GO:1903991) regulation of ferrous iron binding(GO:1904432) positive regulation of ferrous iron binding(GO:1904434) regulation of transferrin receptor binding(GO:1904435) positive regulation of transferrin receptor binding(GO:1904437) regulation of ferrous iron import across plasma membrane(GO:1904438) positive regulation of ferrous iron import across plasma membrane(GO:1904440) |
| 2.5 | 10.0 | GO:1901339 | regulation of store-operated calcium channel activity(GO:1901339) |
| 2.5 | 7.5 | GO:0015917 | aminophospholipid transport(GO:0015917) |
| 2.5 | 7.5 | GO:0036292 | DNA rewinding(GO:0036292) |
| 2.4 | 28.7 | GO:0002315 | marginal zone B cell differentiation(GO:0002315) |
| 2.4 | 7.2 | GO:1904397 | negative regulation of neuromuscular junction development(GO:1904397) |
| 2.3 | 14.1 | GO:0006051 | mannosamine metabolic process(GO:0006050) N-acetylmannosamine metabolic process(GO:0006051) |
| 2.3 | 9.3 | GO:0060734 | regulation of endoplasmic reticulum stress-induced eIF2 alpha phosphorylation(GO:0060734) |
| 2.3 | 6.9 | GO:0033364 | mast cell secretory granule organization(GO:0033364) |
| 2.3 | 217.3 | GO:0006958 | complement activation, classical pathway(GO:0006958) |
| 2.3 | 11.3 | GO:0034124 | regulation of MyD88-dependent toll-like receptor signaling pathway(GO:0034124) negative regulation of macrophage apoptotic process(GO:2000110) |
| 2.2 | 6.7 | GO:0009386 | translational attenuation(GO:0009386) |
| 2.1 | 8.6 | GO:0002924 | negative regulation of humoral immune response mediated by circulating immunoglobulin(GO:0002924) |
| 2.1 | 12.8 | GO:0010936 | negative regulation of macrophage cytokine production(GO:0010936) |
| 2.1 | 6.4 | GO:0032765 | positive regulation of mast cell cytokine production(GO:0032765) vestibular reflex(GO:0060005) |
| 2.1 | 31.4 | GO:0002523 | leukocyte migration involved in inflammatory response(GO:0002523) |
| 2.1 | 8.3 | GO:0050902 | leukocyte adhesive activation(GO:0050902) |
| 2.1 | 14.4 | GO:0051388 | positive regulation of neurotrophin TRK receptor signaling pathway(GO:0051388) |
| 2.0 | 6.1 | GO:0072139 | glomerular parietal epithelial cell differentiation(GO:0072139) positive regulation of nephron tubule epithelial cell differentiation(GO:2000768) |
| 2.0 | 8.1 | GO:0002881 | negative regulation of chronic inflammatory response to non-antigenic stimulus(GO:0002881) |
| 2.0 | 11.9 | GO:2001268 | negative regulation of cysteine-type endopeptidase activity involved in apoptotic signaling pathway(GO:2001268) |
| 2.0 | 7.9 | GO:0006542 | glutamine biosynthetic process(GO:0006542) |
| 2.0 | 5.9 | GO:0043012 | regulation of fusion of sperm to egg plasma membrane(GO:0043012) |
| 2.0 | 7.8 | GO:2001274 | negative regulation of glucose import in response to insulin stimulus(GO:2001274) |
| 1.9 | 5.7 | GO:0070105 | positive regulation of interleukin-6-mediated signaling pathway(GO:0070105) |
| 1.9 | 5.7 | GO:0036047 | protein demalonylation(GO:0036046) peptidyl-lysine demalonylation(GO:0036047) protein desuccinylation(GO:0036048) peptidyl-lysine desuccinylation(GO:0036049) protein deglutarylation(GO:0061698) peptidyl-lysine deglutarylation(GO:0061699) |
| 1.9 | 20.6 | GO:0043374 | CD8-positive, alpha-beta T cell differentiation(GO:0043374) |
| 1.8 | 12.8 | GO:0000821 | regulation of arginine metabolic process(GO:0000821) |
| 1.8 | 1.8 | GO:2000410 | regulation of thymocyte migration(GO:2000410) |
| 1.8 | 8.9 | GO:0006741 | NADP biosynthetic process(GO:0006741) |
| 1.8 | 19.6 | GO:0006657 | CDP-choline pathway(GO:0006657) |
| 1.8 | 5.3 | GO:1902905 | positive regulation of fibril organization(GO:1902905) |
| 1.8 | 5.3 | GO:0002589 | regulation of antigen processing and presentation of peptide antigen via MHC class I(GO:0002589) negative regulation of antigen processing and presentation of peptide antigen via MHC class I(GO:0002590) |
| 1.8 | 10.5 | GO:1903936 | cellular response to sodium arsenite(GO:1903936) |
| 1.7 | 10.5 | GO:2001293 | malonyl-CoA metabolic process(GO:2001293) |
| 1.7 | 13.9 | GO:0006013 | mannose metabolic process(GO:0006013) |
| 1.7 | 12.1 | GO:0060770 | negative regulation of epithelial cell proliferation involved in prostate gland development(GO:0060770) |
| 1.7 | 8.4 | GO:0010813 | neuropeptide catabolic process(GO:0010813) |
| 1.7 | 3.3 | GO:0016068 | regulation of type I hypersensitivity(GO:0001810) type I hypersensitivity(GO:0016068) |
| 1.7 | 9.9 | GO:0032445 | fructose transport(GO:0015755) fructose import(GO:0032445) carbohydrate import into cell(GO:0097319) carbohydrate import across plasma membrane(GO:0098704) fructose import across plasma membrane(GO:1990539) |
| 1.6 | 6.6 | GO:0032290 | peripheral nervous system myelin formation(GO:0032290) |
| 1.6 | 3.2 | GO:0002537 | nitric oxide production involved in inflammatory response(GO:0002537) |
| 1.6 | 16.2 | GO:0002455 | humoral immune response mediated by circulating immunoglobulin(GO:0002455) |
| 1.6 | 8.1 | GO:0001315 | age-dependent response to oxidative stress(GO:0001306) age-dependent response to reactive oxygen species(GO:0001315) regulation of systemic arterial blood pressure by acetylcholine(GO:0003068) vasodilation by acetylcholine involved in regulation of systemic arterial blood pressure(GO:0003069) regulation of systemic arterial blood pressure by neurotransmitter(GO:0003070) age-dependent general metabolic decline(GO:0007571) |
| 1.6 | 6.4 | GO:0019072 | viral genome packaging(GO:0019072) viral RNA genome packaging(GO:0019074) |
| 1.6 | 6.4 | GO:0002913 | positive regulation of T cell anergy(GO:0002669) positive regulation of lymphocyte anergy(GO:0002913) |
| 1.6 | 8.0 | GO:0034699 | response to luteinizing hormone(GO:0034699) |
| 1.6 | 4.8 | GO:0035574 | histone H4-K20 demethylation(GO:0035574) |
| 1.6 | 9.6 | GO:0070829 | response to vitamin B2(GO:0033274) heterochromatin maintenance(GO:0070829) |
| 1.6 | 11.0 | GO:0045084 | positive regulation of interleukin-12 biosynthetic process(GO:0045084) |
| 1.6 | 12.5 | GO:1900113 | negative regulation of histone H3-K9 trimethylation(GO:1900113) |
| 1.6 | 4.7 | GO:0070845 | misfolded protein transport(GO:0070843) polyubiquitinated protein transport(GO:0070844) polyubiquitinated misfolded protein transport(GO:0070845) Hsp90 deacetylation(GO:0070846) |
| 1.6 | 14.0 | GO:0033088 | negative regulation of immature T cell proliferation in thymus(GO:0033088) |
| 1.5 | 26.0 | GO:0051255 | spindle midzone assembly(GO:0051255) |
| 1.5 | 3.1 | GO:0070662 | mast cell proliferation(GO:0070662) |
| 1.5 | 7.6 | GO:0090131 | mesenchyme migration(GO:0090131) |
| 1.5 | 7.6 | GO:0033625 | positive regulation of integrin activation(GO:0033625) |
| 1.5 | 4.5 | GO:0045409 | negative regulation of interleukin-6 biosynthetic process(GO:0045409) |
| 1.5 | 4.5 | GO:0002416 | IgG immunoglobulin transcytosis in epithelial cells mediated by FcRn immunoglobulin receptor(GO:0002416) |
| 1.5 | 4.5 | GO:0045553 | TRAIL biosynthetic process(GO:0045553) regulation of TRAIL biosynthetic process(GO:0045554) positive regulation of TRAIL biosynthetic process(GO:0045556) |
| 1.5 | 5.9 | GO:0060023 | soft palate development(GO:0060023) |
| 1.5 | 7.3 | GO:0045872 | positive regulation of rhodopsin gene expression(GO:0045872) |
| 1.5 | 1.5 | GO:0061056 | sclerotome development(GO:0061056) |
| 1.5 | 4.4 | GO:0048213 | Golgi vesicle prefusion complex stabilization(GO:0048213) |
| 1.5 | 4.4 | GO:1902161 | positive regulation of cyclic nucleotide-gated ion channel activity(GO:1902161) |
| 1.4 | 4.3 | GO:0033499 | galactose catabolic process via UDP-galactose(GO:0033499) |
| 1.4 | 2.9 | GO:1902809 | skeletal muscle fiber differentiation(GO:0098528) regulation of skeletal muscle fiber differentiation(GO:1902809) |
| 1.4 | 7.1 | GO:0051725 | protein de-ADP-ribosylation(GO:0051725) |
| 1.4 | 5.6 | GO:0090076 | relaxation of skeletal muscle(GO:0090076) |
| 1.4 | 20.8 | GO:0006600 | creatine metabolic process(GO:0006600) |
| 1.4 | 4.1 | GO:0060988 | lipid tube assembly(GO:0060988) |
| 1.3 | 5.4 | GO:0003241 | growth involved in heart morphogenesis(GO:0003241) |
| 1.3 | 10.7 | GO:0050713 | negative regulation of interleukin-1 beta secretion(GO:0050713) |
| 1.3 | 4.0 | GO:0002384 | hepatic immune response(GO:0002384) |
| 1.3 | 8.0 | GO:0032252 | secretory granule localization(GO:0032252) |
| 1.3 | 9.2 | GO:0045918 | negative regulation of cytolysis(GO:0045918) |
| 1.3 | 5.2 | GO:0014734 | skeletal muscle hypertrophy(GO:0014734) |
| 1.3 | 3.9 | GO:1901899 | positive regulation of relaxation of cardiac muscle(GO:1901899) |
| 1.3 | 3.9 | GO:1900275 | negative regulation of phospholipase C activity(GO:1900275) |
| 1.3 | 2.6 | GO:0002361 | CD4-positive, CD25-positive, alpha-beta regulatory T cell differentiation(GO:0002361) |
| 1.3 | 9.1 | GO:0046322 | negative regulation of fatty acid oxidation(GO:0046322) |
| 1.3 | 14.2 | GO:0045945 | positive regulation of transcription from RNA polymerase III promoter(GO:0045945) |
| 1.3 | 5.2 | GO:0032747 | positive regulation of interleukin-23 production(GO:0032747) |
| 1.3 | 1.3 | GO:0010157 | response to chlorate(GO:0010157) |
| 1.3 | 5.1 | GO:1902283 | negative regulation of primary amine oxidase activity(GO:1902283) |
| 1.3 | 10.2 | GO:0001887 | selenium compound metabolic process(GO:0001887) |
| 1.3 | 197.7 | GO:0002377 | immunoglobulin production(GO:0002377) |
| 1.2 | 5.0 | GO:1901594 | detection of temperature stimulus involved in thermoception(GO:0050960) response to capsazepine(GO:1901594) |
| 1.2 | 7.3 | GO:0051694 | pointed-end actin filament capping(GO:0051694) |
| 1.2 | 10.9 | GO:0060372 | regulation of atrial cardiac muscle cell membrane repolarization(GO:0060372) |
| 1.2 | 3.6 | GO:0035565 | regulation of pronephros size(GO:0035565) |
| 1.2 | 1.2 | GO:0071288 | cellular response to mercury ion(GO:0071288) |
| 1.2 | 4.8 | GO:1904428 | negative regulation of tubulin deacetylation(GO:1904428) |
| 1.2 | 13.2 | GO:0051195 | negative regulation of glycolytic process(GO:0045820) negative regulation of cofactor metabolic process(GO:0051195) negative regulation of coenzyme metabolic process(GO:0051198) |
| 1.2 | 6.0 | GO:0032929 | negative regulation of superoxide anion generation(GO:0032929) |
| 1.2 | 7.1 | GO:0006931 | substrate-dependent cell migration, cell attachment to substrate(GO:0006931) |
| 1.2 | 9.4 | GO:0014055 | acetylcholine secretion, neurotransmission(GO:0014055) regulation of acetylcholine secretion, neurotransmission(GO:0014056) |
| 1.2 | 3.5 | GO:0046416 | D-amino acid metabolic process(GO:0046416) |
| 1.2 | 3.5 | GO:0021558 | trochlear nerve development(GO:0021558) |
| 1.2 | 1.2 | GO:2000969 | positive regulation of alpha-amino-3-hydroxy-5-methyl-4-isoxazole propionate selective glutamate receptor activity(GO:2000969) |
| 1.1 | 6.9 | GO:0021966 | corticospinal neuron axon guidance(GO:0021966) |
| 1.1 | 4.5 | GO:0002370 | natural killer cell cytokine production(GO:0002370) regulation of natural killer cell cytokine production(GO:0002727) |
| 1.1 | 3.4 | GO:1904328 | regulation of myofibroblast contraction(GO:1904328) myofibroblast contraction(GO:1990764) |
| 1.1 | 4.5 | GO:0048496 | maintenance of organ identity(GO:0048496) |
| 1.1 | 2.2 | GO:0048852 | hypophysis morphogenesis(GO:0048850) diencephalon morphogenesis(GO:0048852) |
| 1.1 | 1.1 | GO:0097374 | sensory neuron axon guidance(GO:0097374) |
| 1.1 | 4.4 | GO:0044333 | Wnt signaling pathway involved in digestive tract morphogenesis(GO:0044333) |
| 1.1 | 14.3 | GO:0033008 | positive regulation of mast cell activation involved in immune response(GO:0033008) positive regulation of mast cell degranulation(GO:0043306) |
| 1.1 | 3.3 | GO:0098759 | response to interleukin-8(GO:0098758) cellular response to interleukin-8(GO:0098759) |
| 1.1 | 27.8 | GO:0042789 | mRNA transcription from RNA polymerase II promoter(GO:0042789) |
| 1.1 | 6.4 | GO:0032483 | regulation of Rab protein signal transduction(GO:0032483) |
| 1.1 | 24.4 | GO:0006895 | Golgi to endosome transport(GO:0006895) |
| 1.1 | 3.2 | GO:0048250 | mitochondrial iron ion transport(GO:0048250) |
| 1.1 | 3.2 | GO:1901097 | negative regulation of phosphatidylinositol 3-kinase activity(GO:0043553) negative regulation of autophagosome maturation(GO:1901097) |
| 1.0 | 3.1 | GO:0045014 | carbon catabolite repression of transcription(GO:0045013) negative regulation of transcription by glucose(GO:0045014) |
| 1.0 | 1.0 | GO:0032497 | detection of lipopolysaccharide(GO:0032497) |
| 1.0 | 7.3 | GO:0044130 | negative regulation of growth of symbiont in host(GO:0044130) |
| 1.0 | 10.4 | GO:0051152 | positive regulation of smooth muscle cell differentiation(GO:0051152) |
| 1.0 | 1.0 | GO:2000137 | negative regulation of cell proliferation involved in heart morphogenesis(GO:2000137) |
| 1.0 | 3.1 | GO:0044537 | regulation of circulating fibrinogen levels(GO:0044537) |
| 1.0 | 4.1 | GO:0015793 | glycerol transport(GO:0015793) |
| 1.0 | 4.0 | GO:0032494 | response to peptidoglycan(GO:0032494) |
| 1.0 | 1.0 | GO:0002322 | B cell proliferation involved in immune response(GO:0002322) |
| 1.0 | 16.9 | GO:0071481 | cellular response to X-ray(GO:0071481) |
| 1.0 | 8.9 | GO:0072553 | terminal button organization(GO:0072553) |
| 1.0 | 4.9 | GO:0019464 | glycine catabolic process(GO:0006546) glycine decarboxylation via glycine cleavage system(GO:0019464) |
| 1.0 | 3.9 | GO:1903413 | cellular response to bile acid(GO:1903413) |
| 1.0 | 4.9 | GO:0006041 | glucosamine metabolic process(GO:0006041) |
| 1.0 | 2.9 | GO:0035509 | negative regulation of myosin-light-chain-phosphatase activity(GO:0035509) |
| 1.0 | 3.9 | GO:0060010 | Sertoli cell fate commitment(GO:0060010) |
| 1.0 | 7.7 | GO:2001137 | positive regulation of endocytic recycling(GO:2001137) |
| 1.0 | 5.8 | GO:2000348 | regulation of CD40 signaling pathway(GO:2000348) |
| 1.0 | 3.9 | GO:0006049 | UDP-N-acetylglucosamine catabolic process(GO:0006049) |
| 1.0 | 7.7 | GO:0030997 | regulation of centriole-centriole cohesion(GO:0030997) |
| 1.0 | 14.3 | GO:0035970 | peptidyl-threonine dephosphorylation(GO:0035970) |
| 0.9 | 60.7 | GO:0030049 | muscle filament sliding(GO:0030049) actin-myosin filament sliding(GO:0033275) |
| 0.9 | 3.8 | GO:0032972 | regulation of muscle filament sliding speed(GO:0032972) |
| 0.9 | 3.7 | GO:0036369 | traversing start control point of mitotic cell cycle(GO:0007089) transcription factor catabolic process(GO:0036369) |
| 0.9 | 2.8 | GO:0042939 | glutathione transport(GO:0034635) tripeptide transport(GO:0042939) |
| 0.9 | 1.8 | GO:0009438 | methylglyoxal metabolic process(GO:0009438) |
| 0.9 | 1.8 | GO:0002884 | negative regulation of hypersensitivity(GO:0002884) |
| 0.9 | 50.5 | GO:0050853 | B cell receptor signaling pathway(GO:0050853) |
| 0.9 | 8.1 | GO:0038145 | macrophage colony-stimulating factor signaling pathway(GO:0038145) |
| 0.9 | 3.6 | GO:0015670 | carbon dioxide transport(GO:0015670) |
| 0.9 | 8.0 | GO:0031444 | slow-twitch skeletal muscle fiber contraction(GO:0031444) |
| 0.9 | 5.3 | GO:1900094 | nodal signaling pathway involved in determination of left/right asymmetry(GO:0038107) regulation of transcription from RNA polymerase II promoter involved in determination of left/right symmetry(GO:1900094) nodal signaling pathway involved in determination of lateral mesoderm left/right asymmetry(GO:1900164) |
| 0.9 | 7.0 | GO:0048535 | lymph node development(GO:0048535) |
| 0.9 | 2.6 | GO:1904751 | positive regulation of protein localization to nucleolus(GO:1904751) |
| 0.9 | 21.9 | GO:0045063 | T-helper 1 cell differentiation(GO:0045063) |
| 0.9 | 6.1 | GO:0002328 | pro-B cell differentiation(GO:0002328) |
| 0.9 | 9.5 | GO:0045008 | depyrimidination(GO:0045008) |
| 0.9 | 5.1 | GO:0015842 | aminergic neurotransmitter loading into synaptic vesicle(GO:0015842) |
| 0.8 | 5.9 | GO:0014722 | regulation of skeletal muscle contraction by calcium ion signaling(GO:0014722) |
| 0.8 | 13.5 | GO:0034497 | protein localization to pre-autophagosomal structure(GO:0034497) |
| 0.8 | 2.5 | GO:0050968 | detection of chemical stimulus involved in sensory perception of pain(GO:0050968) |
| 0.8 | 0.8 | GO:0071321 | cellular response to cGMP(GO:0071321) |
| 0.8 | 2.5 | GO:1902595 | regulation of DNA replication origin binding(GO:1902595) |
| 0.8 | 4.2 | GO:0021834 | embryonic olfactory bulb interneuron precursor migration(GO:0021831) chemorepulsion involved in embryonic olfactory bulb interneuron precursor migration(GO:0021834) |
| 0.8 | 10.8 | GO:0060742 | epithelial cell differentiation involved in prostate gland development(GO:0060742) |
| 0.8 | 17.8 | GO:0043304 | regulation of mast cell activation involved in immune response(GO:0033006) regulation of mast cell degranulation(GO:0043304) |
| 0.8 | 16.9 | GO:0008535 | respiratory chain complex IV assembly(GO:0008535) |
| 0.8 | 4.8 | GO:0021633 | optic nerve structural organization(GO:0021633) |
| 0.8 | 5.6 | GO:1904995 | negative regulation of leukocyte tethering or rolling(GO:1903237) negative regulation of leukocyte adhesion to vascular endothelial cell(GO:1904995) |
| 0.8 | 3.2 | GO:0032811 | negative regulation of epinephrine secretion(GO:0032811) epidermal growth factor-activated receptor transactivation by G-protein coupled receptor signaling pathway(GO:0035625) |
| 0.8 | 2.4 | GO:2000342 | negative regulation of chemokine (C-X-C motif) ligand 2 production(GO:2000342) |
| 0.8 | 2.4 | GO:0035672 | oligopeptide transmembrane transport(GO:0035672) |
| 0.8 | 3.1 | GO:1903633 | positive regulation of superoxide dismutase activity(GO:1901671) regulation of calcium-dependent ATPase activity(GO:1903610) negative regulation of calcium-dependent ATPase activity(GO:1903611) regulation of dUTP diphosphatase activity(GO:1903627) positive regulation of dUTP diphosphatase activity(GO:1903629) negative regulation of aminoacyl-tRNA ligase activity(GO:1903631) regulation of leucine-tRNA ligase activity(GO:1903633) negative regulation of leucine-tRNA ligase activity(GO:1903634) positive regulation of removal of superoxide radicals(GO:1904833) |
| 0.8 | 3.1 | GO:0019082 | viral protein processing(GO:0019082) regulation of nerve growth factor production(GO:0032903) negative regulation of nerve growth factor production(GO:0032904) dibasic protein processing(GO:0090472) |
| 0.8 | 2.3 | GO:0042560 | folic acid-containing compound catabolic process(GO:0009397) pteridine-containing compound catabolic process(GO:0042560) |
| 0.8 | 2.3 | GO:0097114 | NMDA glutamate receptor clustering(GO:0097114) positive regulation of postsynaptic membrane organization(GO:1901628) |
| 0.8 | 3.0 | GO:0009305 | protein biotinylation(GO:0009305) histone biotinylation(GO:0071110) |
| 0.8 | 8.3 | GO:0034770 | histone H4-K20 methylation(GO:0034770) |
| 0.8 | 1.5 | GO:0044117 | growth of symbiont in host(GO:0044117) |
| 0.7 | 2.2 | GO:1903774 | positive regulation of viral budding via host ESCRT complex(GO:1903774) |
| 0.7 | 8.9 | GO:2000271 | positive regulation of fibroblast apoptotic process(GO:2000271) |
| 0.7 | 2.2 | GO:0006701 | progesterone biosynthetic process(GO:0006701) |
| 0.7 | 1.5 | GO:0032792 | negative regulation of CREB transcription factor activity(GO:0032792) |
| 0.7 | 2.2 | GO:1900383 | regulation of synaptic plasticity by receptor localization to synapse(GO:1900383) |
| 0.7 | 6.5 | GO:0046959 | habituation(GO:0046959) |
| 0.7 | 2.2 | GO:0061760 | antifungal innate immune response(GO:0061760) |
| 0.7 | 7.3 | GO:0002230 | positive regulation of defense response to virus by host(GO:0002230) |
| 0.7 | 7.9 | GO:0051014 | actin filament severing(GO:0051014) |
| 0.7 | 2.8 | GO:0002024 | diet induced thermogenesis(GO:0002024) |
| 0.7 | 7.1 | GO:0045647 | negative regulation of erythrocyte differentiation(GO:0045647) |
| 0.7 | 4.9 | GO:0036159 | inner dynein arm assembly(GO:0036159) |
| 0.7 | 7.0 | GO:0043117 | positive regulation of vascular permeability(GO:0043117) |
| 0.7 | 9.1 | GO:0016576 | histone dephosphorylation(GO:0016576) |
| 0.7 | 2.1 | GO:0090210 | regulation of establishment of blood-brain barrier(GO:0090210) |
| 0.7 | 3.5 | GO:0016554 | cytidine to uridine editing(GO:0016554) |
| 0.7 | 2.8 | GO:1904588 | cellular response to glycoprotein(GO:1904588) cellular response to thyrotropin-releasing hormone(GO:1905229) |
| 0.7 | 0.7 | GO:0032423 | regulation of mismatch repair(GO:0032423) positive regulation of mismatch repair(GO:0032425) |
| 0.7 | 2.1 | GO:0044339 | canonical Wnt signaling pathway involved in osteoblast differentiation(GO:0044339) |
| 0.7 | 2.0 | GO:1904823 | pyrimidine nucleobase transport(GO:0015855) purine nucleobase transmembrane transport(GO:1904823) |
| 0.7 | 3.3 | GO:0090385 | phagosome-lysosome fusion(GO:0090385) |
| 0.7 | 23.8 | GO:0033198 | response to ATP(GO:0033198) |
| 0.7 | 11.2 | GO:0019800 | peptide cross-linking via chondroitin 4-sulfate glycosaminoglycan(GO:0019800) |
| 0.7 | 3.3 | GO:0097411 | hypoxia-inducible factor-1alpha signaling pathway(GO:0097411) |
| 0.7 | 2.6 | GO:0031117 | positive regulation of microtubule depolymerization(GO:0031117) |
| 0.7 | 2.0 | GO:0070634 | transepithelial ammonium transport(GO:0070634) |
| 0.6 | 1.3 | GO:0060332 | positive regulation of response to interferon-gamma(GO:0060332) positive regulation of interferon-gamma-mediated signaling pathway(GO:0060335) |
| 0.6 | 4.5 | GO:0010961 | cellular magnesium ion homeostasis(GO:0010961) |
| 0.6 | 7.8 | GO:0060670 | branching involved in labyrinthine layer morphogenesis(GO:0060670) |
| 0.6 | 2.6 | GO:0098957 | anterograde axonal transport of mitochondrion(GO:0098957) |
| 0.6 | 1.3 | GO:0051464 | positive regulation of cortisol secretion(GO:0051464) |
| 0.6 | 5.8 | GO:0060287 | epithelial cilium movement involved in determination of left/right asymmetry(GO:0060287) |
| 0.6 | 1.9 | GO:0002143 | tRNA wobble position uridine thiolation(GO:0002143) |
| 0.6 | 1.9 | GO:0070316 | regulation of G0 to G1 transition(GO:0070316) |
| 0.6 | 1.9 | GO:0090038 | negative regulation of protein kinase C signaling(GO:0090038) |
| 0.6 | 1.3 | GO:0046271 | phenylpropanoid catabolic process(GO:0046271) |
| 0.6 | 2.5 | GO:0032455 | nerve growth factor processing(GO:0032455) |
| 0.6 | 4.4 | GO:1903903 | regulation of establishment of T cell polarity(GO:1903903) |
| 0.6 | 7.6 | GO:0042635 | positive regulation of hair cycle(GO:0042635) positive regulation of hair follicle development(GO:0051798) |
| 0.6 | 17.5 | GO:0050779 | RNA destabilization(GO:0050779) |
| 0.6 | 2.5 | GO:0009440 | cyanate metabolic process(GO:0009439) cyanate catabolic process(GO:0009440) |
| 0.6 | 3.1 | GO:0006772 | thiamine metabolic process(GO:0006772) |
| 0.6 | 3.1 | GO:0038163 | thrombopoietin-mediated signaling pathway(GO:0038163) |
| 0.6 | 0.6 | GO:0045976 | negative regulation of mitotic cell cycle, embryonic(GO:0045976) |
| 0.6 | 6.8 | GO:0048003 | antigen processing and presentation of lipid antigen via MHC class Ib(GO:0048003) antigen processing and presentation, exogenous lipid antigen via MHC class Ib(GO:0048007) |
| 0.6 | 3.1 | GO:0014827 | intestine smooth muscle contraction(GO:0014827) |
| 0.6 | 2.5 | GO:0060800 | regulation of cell differentiation involved in embryonic placenta development(GO:0060800) |
| 0.6 | 3.7 | GO:1902714 | negative regulation of interferon-gamma secretion(GO:1902714) |
| 0.6 | 1.2 | GO:0003064 | regulation of heart rate by hormone(GO:0003064) |
| 0.6 | 2.4 | GO:1902938 | phospholipase C-activating G-protein coupled glutamate receptor signaling pathway(GO:0007206) regulation of intracellular calcium activated chloride channel activity(GO:1902938) |
| 0.6 | 1.8 | GO:1903027 | regulation of opsonization(GO:1903027) positive regulation of opsonization(GO:1903028) |
| 0.6 | 7.2 | GO:0060992 | response to fungicide(GO:0060992) |
| 0.6 | 2.4 | GO:2000253 | positive regulation of feeding behavior(GO:2000253) |
| 0.6 | 2.4 | GO:0002371 | dendritic cell cytokine production(GO:0002371) |
| 0.6 | 1.2 | GO:0010533 | regulation of activation of Janus kinase activity(GO:0010533) |
| 0.6 | 1.8 | GO:0009750 | response to fructose(GO:0009750) |
| 0.6 | 1.8 | GO:0035634 | response to stilbenoid(GO:0035634) |
| 0.6 | 15.3 | GO:0045730 | respiratory burst(GO:0045730) |
| 0.6 | 2.3 | GO:0019918 | peptidyl-arginine methylation, to symmetrical-dimethyl arginine(GO:0019918) |
| 0.6 | 6.4 | GO:0002710 | negative regulation of T cell mediated immunity(GO:0002710) |
| 0.6 | 1.7 | GO:0090234 | regulation of kinetochore assembly(GO:0090234) |
| 0.6 | 1.7 | GO:0034443 | negative regulation of lipoprotein oxidation(GO:0034443) regulation of plasma lipoprotein particle oxidation(GO:0034444) negative regulation of plasma lipoprotein particle oxidation(GO:0034445) |
| 0.6 | 1.7 | GO:0030200 | heparan sulfate proteoglycan catabolic process(GO:0030200) |
| 0.6 | 1.7 | GO:1901538 | DNA methylation involved in embryo development(GO:0043045) changes to DNA methylation involved in embryo development(GO:1901538) |
| 0.6 | 2.3 | GO:2000170 | regulation of renal output by angiotensin(GO:0002019) positive regulation of peptidyl-cysteine S-nitrosylation(GO:2000170) |
| 0.6 | 1.7 | GO:0046010 | positive regulation of circadian sleep/wake cycle, non-REM sleep(GO:0046010) |
| 0.6 | 3.4 | GO:0030538 | embryonic genitalia morphogenesis(GO:0030538) |
| 0.6 | 1.1 | GO:0001923 | B-1 B cell differentiation(GO:0001923) |
| 0.6 | 1.1 | GO:0060492 | foregut regionalization(GO:0060423) lung field specification(GO:0060424) lung induction(GO:0060492) positive regulation of branching involved in lung morphogenesis(GO:0061047) |
| 0.6 | 2.8 | GO:0034091 | regulation of maintenance of sister chromatid cohesion(GO:0034091) regulation of maintenance of mitotic sister chromatid cohesion(GO:0034182) |
| 0.6 | 6.1 | GO:0006032 | chitin metabolic process(GO:0006030) chitin catabolic process(GO:0006032) |
| 0.6 | 1.7 | GO:0034127 | regulation of MyD88-independent toll-like receptor signaling pathway(GO:0034127) |
| 0.5 | 6.6 | GO:0006824 | cobalt ion transport(GO:0006824) |
| 0.5 | 11.4 | GO:0001573 | ganglioside metabolic process(GO:0001573) |
| 0.5 | 10.9 | GO:0045954 | positive regulation of natural killer cell mediated immunity(GO:0002717) positive regulation of natural killer cell mediated cytotoxicity(GO:0045954) |
| 0.5 | 4.3 | GO:0032020 | ISG15-protein conjugation(GO:0032020) |
| 0.5 | 1.6 | GO:1900138 | negative regulation of icosanoid secretion(GO:0032304) negative regulation of phospholipase A2 activity(GO:1900138) |
| 0.5 | 2.7 | GO:0070375 | ERK5 cascade(GO:0070375) |
| 0.5 | 1.6 | GO:0010133 | proline catabolic process to glutamate(GO:0010133) |
| 0.5 | 6.5 | GO:0015939 | pantothenate metabolic process(GO:0015939) |
| 0.5 | 19.8 | GO:0045576 | mast cell activation(GO:0045576) |
| 0.5 | 2.1 | GO:0035610 | protein side chain deglutamylation(GO:0035610) |
| 0.5 | 2.1 | GO:0030950 | establishment or maintenance of actin cytoskeleton polarity(GO:0030950) |
| 0.5 | 1.1 | GO:1990418 | response to insulin-like growth factor stimulus(GO:1990418) |
| 0.5 | 4.2 | GO:0097688 | AMPA glutamate receptor clustering(GO:0097113) glutamate receptor clustering(GO:0097688) |
| 0.5 | 3.1 | GO:1900121 | negative regulation of receptor binding(GO:1900121) |
| 0.5 | 6.7 | GO:2001300 | lipoxin metabolic process(GO:2001300) |
| 0.5 | 3.6 | GO:0051601 | exocyst localization(GO:0051601) |
| 0.5 | 15.9 | GO:0050913 | sensory perception of bitter taste(GO:0050913) |
| 0.5 | 7.1 | GO:2001204 | regulation of osteoclast development(GO:2001204) |
| 0.5 | 3.1 | GO:0018095 | protein polyglutamylation(GO:0018095) |
| 0.5 | 2.0 | GO:0044314 | protein K27-linked ubiquitination(GO:0044314) |
| 0.5 | 4.0 | GO:0006685 | sphingomyelin catabolic process(GO:0006685) |
| 0.5 | 1.5 | GO:0071603 | endothelial cell-cell adhesion(GO:0071603) |
| 0.5 | 1.0 | GO:0038162 | erythropoietin-mediated signaling pathway(GO:0038162) |
| 0.5 | 4.0 | GO:0051026 | chiasma assembly(GO:0051026) |
| 0.5 | 3.5 | GO:0014859 | negative regulation of skeletal muscle cell proliferation(GO:0014859) negative regulation of skeletal muscle satellite cell proliferation(GO:1902723) |
| 0.5 | 3.5 | GO:0030263 | apoptotic chromosome condensation(GO:0030263) |
| 0.5 | 2.5 | GO:0042989 | sequestering of actin monomers(GO:0042989) |
| 0.5 | 2.5 | GO:0021937 | cerebellar Purkinje cell-granule cell precursor cell signaling involved in regulation of granule cell precursor cell proliferation(GO:0021937) |
| 0.5 | 0.5 | GO:0045650 | negative regulation of interferon-gamma biosynthetic process(GO:0045077) negative regulation of B cell differentiation(GO:0045578) negative regulation of macrophage differentiation(GO:0045650) |
| 0.5 | 1.9 | GO:0048842 | positive regulation of axon extension involved in axon guidance(GO:0048842) |
| 0.5 | 6.7 | GO:0006346 | methylation-dependent chromatin silencing(GO:0006346) |
| 0.5 | 3.8 | GO:0006307 | DNA dealkylation involved in DNA repair(GO:0006307) |
| 0.5 | 3.8 | GO:0015693 | magnesium ion transport(GO:0015693) |
| 0.5 | 2.4 | GO:0038170 | somatostatin receptor signaling pathway(GO:0038169) somatostatin signaling pathway(GO:0038170) |
| 0.5 | 1.4 | GO:1901165 | positive regulation of trophoblast cell migration(GO:1901165) |
| 0.5 | 2.8 | GO:1903566 | positive regulation of protein localization to cilium(GO:1903566) |
| 0.5 | 1.9 | GO:1902430 | negative regulation of beta-amyloid formation(GO:1902430) |
| 0.5 | 5.6 | GO:0048251 | elastic fiber assembly(GO:0048251) |
| 0.5 | 2.8 | GO:0032525 | somite rostral/caudal axis specification(GO:0032525) |
| 0.5 | 1.4 | GO:0055089 | fatty acid homeostasis(GO:0055089) |
| 0.5 | 2.3 | GO:0035871 | protein K11-linked deubiquitination(GO:0035871) |
| 0.5 | 1.8 | GO:0009138 | pyrimidine nucleoside diphosphate metabolic process(GO:0009138) |
| 0.5 | 8.7 | GO:0090141 | positive regulation of mitochondrial fission(GO:0090141) |
| 0.5 | 1.4 | GO:0051410 | detoxification of nitrogen compound(GO:0051410) cellular detoxification of nitrogen compound(GO:0070458) |
| 0.5 | 0.5 | GO:2000381 | negative regulation of mesoderm development(GO:2000381) |
| 0.5 | 1.4 | GO:0032490 | detection of molecule of bacterial origin(GO:0032490) |
| 0.5 | 1.4 | GO:0061034 | olfactory bulb mitral cell layer development(GO:0061034) |
| 0.5 | 3.2 | GO:0031936 | negative regulation of chromatin silencing(GO:0031936) |
| 0.4 | 4.0 | GO:2000311 | regulation of alpha-amino-3-hydroxy-5-methyl-4-isoxazole propionate selective glutamate receptor activity(GO:2000311) |
| 0.4 | 4.0 | GO:0086024 | regulation of heart rate by chemical signal(GO:0003062) adrenergic receptor signaling pathway involved in positive regulation of heart rate(GO:0086024) |
| 0.4 | 6.7 | GO:0040015 | negative regulation of multicellular organism growth(GO:0040015) |
| 0.4 | 0.4 | GO:0097017 | negative regulation of protein import into nucleus, translocation(GO:0033159) renal protein absorption(GO:0097017) |
| 0.4 | 0.4 | GO:0046015 | regulation of transcription by glucose(GO:0046015) |
| 0.4 | 2.6 | GO:0048630 | skeletal muscle tissue growth(GO:0048630) |
| 0.4 | 2.2 | GO:0008354 | germ cell migration(GO:0008354) |
| 0.4 | 1.3 | GO:0060252 | positive regulation of glial cell proliferation(GO:0060252) |
| 0.4 | 0.4 | GO:0010700 | negative regulation of norepinephrine secretion(GO:0010700) |
| 0.4 | 1.3 | GO:0072134 | nephrogenic mesenchyme morphogenesis(GO:0072134) |
| 0.4 | 0.4 | GO:1900227 | positive regulation of NLRP3 inflammasome complex assembly(GO:1900227) |
| 0.4 | 1.7 | GO:0097676 | cell migration involved in vasculogenesis(GO:0035441) histone H3-K36 dimethylation(GO:0097676) |
| 0.4 | 2.6 | GO:0097052 | L-kynurenine metabolic process(GO:0097052) |
| 0.4 | 3.0 | GO:0015705 | iodide transport(GO:0015705) |
| 0.4 | 2.1 | GO:0032571 | response to vitamin K(GO:0032571) |
| 0.4 | 5.6 | GO:0010510 | regulation of acetyl-CoA biosynthetic process from pyruvate(GO:0010510) |
| 0.4 | 1.3 | GO:0003166 | bundle of His development(GO:0003166) mammary placode formation(GO:0060596) His-Purkinje system cell differentiation(GO:0060932) |
| 0.4 | 5.9 | GO:0045475 | locomotor rhythm(GO:0045475) |
| 0.4 | 11.4 | GO:0045747 | positive regulation of Notch signaling pathway(GO:0045747) |
| 0.4 | 9.3 | GO:0010719 | negative regulation of epithelial to mesenchymal transition(GO:0010719) |
| 0.4 | 1.3 | GO:0036233 | glycine import(GO:0036233) |
| 0.4 | 1.3 | GO:0003358 | noradrenergic neuron development(GO:0003358) |
| 0.4 | 1.7 | GO:0018101 | protein citrullination(GO:0018101) histone citrullination(GO:0036414) |
| 0.4 | 4.6 | GO:0000447 | endonucleolytic cleavage in ITS1 to separate SSU-rRNA from 5.8S rRNA and LSU-rRNA from tricistronic rRNA transcript (SSU-rRNA, 5.8S rRNA, LSU-rRNA)(GO:0000447) |
| 0.4 | 9.6 | GO:0046339 | diacylglycerol metabolic process(GO:0046339) |
| 0.4 | 6.2 | GO:0007196 | adenylate cyclase-inhibiting G-protein coupled glutamate receptor signaling pathway(GO:0007196) |
| 0.4 | 1.6 | GO:0046968 | peptide antigen transport(GO:0046968) |
| 0.4 | 1.6 | GO:2000664 | positive regulation of interleukin-5 secretion(GO:2000664) |
| 0.4 | 1.6 | GO:0070278 | extracellular matrix constituent secretion(GO:0070278) |
| 0.4 | 10.9 | GO:0032012 | regulation of ARF protein signal transduction(GO:0032012) |
| 0.4 | 1.2 | GO:2000616 | negative regulation of histone H3-K9 acetylation(GO:2000616) |
| 0.4 | 10.4 | GO:0021854 | hypothalamus development(GO:0021854) |
| 0.4 | 2.4 | GO:0006021 | inositol biosynthetic process(GO:0006021) |
| 0.4 | 5.1 | GO:0090527 | actin filament reorganization(GO:0090527) |
| 0.4 | 4.7 | GO:0039536 | negative regulation of RIG-I signaling pathway(GO:0039536) |
| 0.4 | 3.5 | GO:0001955 | blood vessel maturation(GO:0001955) |
| 0.4 | 0.4 | GO:0032691 | negative regulation of interleukin-1 beta production(GO:0032691) |
| 0.4 | 5.4 | GO:0051315 | attachment of mitotic spindle microtubules to kinetochore(GO:0051315) |
| 0.4 | 1.9 | GO:0060481 | lobar bronchus epithelium development(GO:0060481) |
| 0.4 | 1.1 | GO:1900736 | regulation of phospholipase C-activating G-protein coupled receptor signaling pathway(GO:1900736) |
| 0.4 | 1.9 | GO:0060017 | parathyroid gland development(GO:0060017) |
| 0.4 | 2.2 | GO:0035434 | copper ion transmembrane transport(GO:0035434) |
| 0.4 | 2.2 | GO:0033314 | mitotic DNA replication checkpoint(GO:0033314) |
| 0.4 | 1.8 | GO:0030643 | cellular phosphate ion homeostasis(GO:0030643) cellular trivalent inorganic anion homeostasis(GO:0072502) |
| 0.4 | 2.5 | GO:0046549 | retinal cone cell differentiation(GO:0042670) retinal cone cell development(GO:0046549) |
| 0.4 | 1.1 | GO:0021722 | superior olivary nucleus development(GO:0021718) superior olivary nucleus maturation(GO:0021722) |
| 0.4 | 1.4 | GO:0090191 | negative regulation of mesonephros development(GO:0061218) negative regulation of branching involved in ureteric bud morphogenesis(GO:0090191) |
| 0.4 | 4.0 | GO:0002693 | positive regulation of cellular extravasation(GO:0002693) |
| 0.4 | 1.1 | GO:0075044 | autophagy of host cells involved in interaction with symbiont(GO:0075044) autophagy involved in symbiotic interaction(GO:0075071) |
| 0.4 | 6.4 | GO:0006071 | glycerol metabolic process(GO:0006071) |
| 0.4 | 2.5 | GO:0034551 | respiratory chain complex III assembly(GO:0017062) mitochondrial respiratory chain complex III assembly(GO:0034551) |
| 0.4 | 1.1 | GO:0018874 | benzoate metabolic process(GO:0018874) butyrate metabolic process(GO:0019605) |
| 0.3 | 19.8 | GO:0006968 | cellular defense response(GO:0006968) |
| 0.3 | 2.8 | GO:0010457 | centriole-centriole cohesion(GO:0010457) |
| 0.3 | 4.8 | GO:2000059 | negative regulation of protein ubiquitination involved in ubiquitin-dependent protein catabolic process(GO:2000059) |
| 0.3 | 4.1 | GO:0010763 | positive regulation of fibroblast migration(GO:0010763) |
| 0.3 | 3.4 | GO:0071340 | skeletal muscle acetylcholine-gated channel clustering(GO:0071340) |
| 0.3 | 0.7 | GO:0021860 | pyramidal neuron differentiation(GO:0021859) pyramidal neuron development(GO:0021860) |
| 0.3 | 3.7 | GO:0043152 | induction of bacterial agglutination(GO:0043152) |
| 0.3 | 4.0 | GO:0008340 | determination of adult lifespan(GO:0008340) |
| 0.3 | 5.0 | GO:0048642 | negative regulation of skeletal muscle tissue development(GO:0048642) |
| 0.3 | 5.7 | GO:0035090 | maintenance of apical/basal cell polarity(GO:0035090) maintenance of epithelial cell apical/basal polarity(GO:0045199) |
| 0.3 | 2.3 | GO:0021798 | forebrain dorsal/ventral pattern formation(GO:0021798) |
| 0.3 | 1.0 | GO:1901052 | sarcosine metabolic process(GO:1901052) sarcosine catabolic process(GO:1901053) |
| 0.3 | 5.3 | GO:0006004 | fucose metabolic process(GO:0006004) |
| 0.3 | 2.0 | GO:0061737 | leukotriene signaling pathway(GO:0061737) |
| 0.3 | 1.0 | GO:0018125 | peptidyl-cysteine methylation(GO:0018125) |
| 0.3 | 1.0 | GO:0000103 | sulfate assimilation(GO:0000103) |
| 0.3 | 1.6 | GO:0001867 | complement activation, lectin pathway(GO:0001867) |
| 0.3 | 1.6 | GO:2000784 | regulation of unidimensional cell growth(GO:0051510) negative regulation of unidimensional cell growth(GO:0051511) establishment of cell polarity regulating cell shape(GO:0071964) regulation of establishment or maintenance of cell polarity regulating cell shape(GO:2000769) positive regulation of establishment or maintenance of cell polarity regulating cell shape(GO:2000771) regulation of establishment of cell polarity regulating cell shape(GO:2000782) positive regulation of establishment of cell polarity regulating cell shape(GO:2000784) positive regulation of barbed-end actin filament capping(GO:2000814) |
| 0.3 | 5.8 | GO:0060134 | prepulse inhibition(GO:0060134) |
| 0.3 | 9.3 | GO:0000301 | retrograde transport, vesicle recycling within Golgi(GO:0000301) |
| 0.3 | 1.9 | GO:0035247 | peptidyl-arginine methylation, to asymmetrical-dimethyl arginine(GO:0019919) peptidyl-arginine omega-N-methylation(GO:0035247) |
| 0.3 | 1.9 | GO:0061087 | regulation of histone H3-K27 methylation(GO:0061085) positive regulation of histone H3-K27 methylation(GO:0061087) |
| 0.3 | 2.2 | GO:0034587 | piRNA metabolic process(GO:0034587) |
| 0.3 | 7.2 | GO:0002260 | lymphocyte homeostasis(GO:0002260) |
| 0.3 | 2.8 | GO:0010739 | positive regulation of protein kinase A signaling(GO:0010739) |
| 0.3 | 0.9 | GO:1990086 | lens fiber cell apoptotic process(GO:1990086) |
| 0.3 | 6.1 | GO:0090557 | establishment of endothelial intestinal barrier(GO:0090557) |
| 0.3 | 6.7 | GO:0007616 | long-term memory(GO:0007616) |
| 0.3 | 3.0 | GO:0048712 | negative regulation of astrocyte differentiation(GO:0048712) |
| 0.3 | 1.2 | GO:0007198 | adenylate cyclase-inhibiting serotonin receptor signaling pathway(GO:0007198) |
| 0.3 | 3.6 | GO:0006972 | hyperosmotic response(GO:0006972) |
| 0.3 | 4.2 | GO:1990118 | sodium ion import(GO:0097369) sodium ion import across plasma membrane(GO:0098719) sodium ion import into cell(GO:1990118) |
| 0.3 | 0.9 | GO:1903438 | regulation of cytokinetic process(GO:0032954) regulation of mitotic cytokinetic process(GO:1903436) positive regulation of mitotic cytokinetic process(GO:1903438) positive regulation of mitotic cytokinesis(GO:1903490) |
| 0.3 | 4.7 | GO:2000651 | positive regulation of sodium ion transmembrane transporter activity(GO:2000651) |
| 0.3 | 2.6 | GO:0070475 | rRNA base methylation(GO:0070475) |
| 0.3 | 1.5 | GO:0016926 | protein desumoylation(GO:0016926) |
| 0.3 | 2.0 | GO:0050910 | detection of mechanical stimulus involved in sensory perception of sound(GO:0050910) |
| 0.3 | 1.2 | GO:0071502 | cellular response to temperature stimulus(GO:0071502) |
| 0.3 | 0.6 | GO:0050748 | negative regulation of lipoprotein metabolic process(GO:0050748) |
| 0.3 | 2.3 | GO:0070995 | NADPH oxidation(GO:0070995) |
| 0.3 | 3.7 | GO:0086045 | membrane depolarization during AV node cell action potential(GO:0086045) |
| 0.3 | 0.3 | GO:0072386 | plus-end-directed vesicle transport along microtubule(GO:0072383) plus-end-directed organelle transport along microtubule(GO:0072386) |
| 0.3 | 6.8 | GO:0007597 | blood coagulation, intrinsic pathway(GO:0007597) |
| 0.3 | 1.4 | GO:0036065 | fucosylation(GO:0036065) |
| 0.3 | 0.8 | GO:0048170 | positive regulation of long-term neuronal synaptic plasticity(GO:0048170) |
| 0.3 | 2.5 | GO:0002778 | antimicrobial peptide production(GO:0002775) antibacterial peptide production(GO:0002778) |
| 0.3 | 9.9 | GO:0007585 | respiratory gaseous exchange(GO:0007585) |
| 0.3 | 1.6 | GO:0031642 | negative regulation of myelination(GO:0031642) |
| 0.3 | 3.5 | GO:0030202 | heparin metabolic process(GO:0030202) heparin biosynthetic process(GO:0030210) |
| 0.3 | 4.3 | GO:0003374 | dynamin polymerization involved in membrane fission(GO:0003373) dynamin polymerization involved in mitochondrial fission(GO:0003374) |
| 0.3 | 2.7 | GO:0048227 | plasma membrane to endosome transport(GO:0048227) |
| 0.3 | 2.4 | GO:0007168 | receptor guanylyl cyclase signaling pathway(GO:0007168) |
| 0.3 | 3.5 | GO:0000244 | spliceosomal tri-snRNP complex assembly(GO:0000244) |
| 0.3 | 1.1 | GO:0019086 | late viral transcription(GO:0019086) |
| 0.3 | 1.6 | GO:0006196 | AMP catabolic process(GO:0006196) |
| 0.3 | 0.8 | GO:0032849 | regulation of cellular pH reduction(GO:0032847) positive regulation of cellular pH reduction(GO:0032849) |
| 0.3 | 5.6 | GO:0009235 | cobalamin metabolic process(GO:0009235) |
| 0.3 | 2.6 | GO:0045163 | clustering of voltage-gated potassium channels(GO:0045163) |
| 0.3 | 4.2 | GO:0060242 | contact inhibition(GO:0060242) |
| 0.3 | 3.4 | GO:0044065 | regulation of respiratory system process(GO:0044065) |
| 0.3 | 2.1 | GO:0009052 | pentose-phosphate shunt, non-oxidative branch(GO:0009052) |
| 0.3 | 4.7 | GO:0003416 | endochondral bone growth(GO:0003416) |
| 0.3 | 0.8 | GO:1901874 | negative regulation of post-translational protein modification(GO:1901874) |
| 0.3 | 2.1 | GO:0060754 | regulation of mast cell chemotaxis(GO:0060753) positive regulation of mast cell chemotaxis(GO:0060754) |
| 0.3 | 3.1 | GO:1902187 | negative regulation of viral release from host cell(GO:1902187) |
| 0.3 | 1.0 | GO:0009233 | menaquinone metabolic process(GO:0009233) |
| 0.3 | 3.9 | GO:0045671 | negative regulation of osteoclast differentiation(GO:0045671) |
| 0.3 | 3.6 | GO:0030208 | dermatan sulfate biosynthetic process(GO:0030208) |
| 0.3 | 1.8 | GO:0099624 | atrial cardiac muscle cell membrane repolarization(GO:0099624) |
| 0.3 | 2.5 | GO:0006957 | complement activation, alternative pathway(GO:0006957) |
| 0.3 | 2.0 | GO:0038203 | TORC2 signaling(GO:0038203) |
| 0.2 | 1.0 | GO:1904706 | negative regulation of vascular smooth muscle cell proliferation(GO:1904706) |
| 0.2 | 2.0 | GO:0007256 | activation of JNKK activity(GO:0007256) |
| 0.2 | 2.2 | GO:0071361 | cellular response to ethanol(GO:0071361) |
| 0.2 | 2.2 | GO:0071073 | positive regulation of phospholipid biosynthetic process(GO:0071073) |
| 0.2 | 3.5 | GO:0006776 | vitamin A metabolic process(GO:0006776) |
| 0.2 | 0.7 | GO:0021794 | thalamus development(GO:0021794) |
| 0.2 | 7.1 | GO:0009435 | NAD biosynthetic process(GO:0009435) |
| 0.2 | 1.0 | GO:1904381 | Golgi apparatus mannose trimming(GO:1904381) |
| 0.2 | 2.7 | GO:0046597 | negative regulation of viral entry into host cell(GO:0046597) |
| 0.2 | 1.2 | GO:0015808 | L-alanine transport(GO:0015808) |
| 0.2 | 0.7 | GO:0098707 | ferrous iron import(GO:0070627) ferrous iron import into cell(GO:0097460) ferrous iron import across plasma membrane(GO:0098707) |
| 0.2 | 10.0 | GO:0048791 | calcium ion-regulated exocytosis of neurotransmitter(GO:0048791) |
| 0.2 | 27.1 | GO:0002504 | antigen processing and presentation of peptide or polysaccharide antigen via MHC class II(GO:0002504) |
| 0.2 | 1.2 | GO:0010968 | regulation of microtubule nucleation(GO:0010968) |
| 0.2 | 0.9 | GO:0070673 | response to interleukin-18(GO:0070673) |
| 0.2 | 1.2 | GO:0060012 | synaptic transmission, glycinergic(GO:0060012) |
| 0.2 | 3.2 | GO:0042340 | keratan sulfate catabolic process(GO:0042340) |
| 0.2 | 11.0 | GO:0015701 | bicarbonate transport(GO:0015701) |
| 0.2 | 0.2 | GO:2000389 | regulation of neutrophil extravasation(GO:2000389) |
| 0.2 | 0.2 | GO:0051946 | regulation of amino acid uptake involved in synaptic transmission(GO:0051941) regulation of glutamate uptake involved in transmission of nerve impulse(GO:0051946) regulation of L-glutamate import(GO:1900920) |
| 0.2 | 0.7 | GO:1990785 | response to water-immersion restraint stress(GO:1990785) |
| 0.2 | 2.9 | GO:1901748 | leukotriene D4 metabolic process(GO:1901748) leukotriene D4 biosynthetic process(GO:1901750) |
| 0.2 | 0.7 | GO:0060907 | positive regulation of macrophage cytokine production(GO:0060907) |
| 0.2 | 2.0 | GO:0097264 | self proteolysis(GO:0097264) |
| 0.2 | 1.1 | GO:2000504 | positive regulation of blood vessel remodeling(GO:2000504) |
| 0.2 | 3.5 | GO:0046838 | phosphorylated carbohydrate dephosphorylation(GO:0046838) inositol phosphate dephosphorylation(GO:0046855) |
| 0.2 | 2.0 | GO:0075525 | viral translational termination-reinitiation(GO:0075525) |
| 0.2 | 1.3 | GO:0033234 | negative regulation of protein sumoylation(GO:0033234) |
| 0.2 | 3.8 | GO:0030252 | growth hormone secretion(GO:0030252) |
| 0.2 | 0.4 | GO:0032306 | regulation of prostaglandin secretion(GO:0032306) positive regulation of prostaglandin secretion(GO:0032308) |
| 0.2 | 15.5 | GO:0006687 | glycosphingolipid metabolic process(GO:0006687) |
| 0.2 | 1.1 | GO:0070212 | protein poly-ADP-ribosylation(GO:0070212) |
| 0.2 | 1.7 | GO:0060285 | cilium-dependent cell motility(GO:0060285) |
| 0.2 | 5.0 | GO:0071218 | cellular response to misfolded protein(GO:0071218) |
| 0.2 | 1.2 | GO:0038001 | paracrine signaling(GO:0038001) |
| 0.2 | 2.3 | GO:0098780 | response to mitochondrial depolarisation(GO:0098780) |
| 0.2 | 2.5 | GO:0042753 | positive regulation of circadian rhythm(GO:0042753) |
| 0.2 | 0.6 | GO:0003344 | pericardium morphogenesis(GO:0003344) |
| 0.2 | 0.6 | GO:0034343 | type III interferon production(GO:0034343) regulation of type III interferon production(GO:0034344) |
| 0.2 | 1.8 | GO:2001224 | positive regulation of neuron migration(GO:2001224) |
| 0.2 | 1.2 | GO:0010759 | positive regulation of macrophage chemotaxis(GO:0010759) |
| 0.2 | 0.6 | GO:0090073 | positive regulation of protein homodimerization activity(GO:0090073) |
| 0.2 | 0.8 | GO:0006617 | SRP-dependent cotranslational protein targeting to membrane, signal sequence recognition(GO:0006617) |
| 0.2 | 1.6 | GO:0036444 | calcium ion transmembrane import into mitochondrion(GO:0036444) |
| 0.2 | 3.2 | GO:2000001 | regulation of DNA damage checkpoint(GO:2000001) |
| 0.2 | 1.6 | GO:0002115 | store-operated calcium entry(GO:0002115) |
| 0.2 | 2.5 | GO:0006491 | N-glycan processing(GO:0006491) |
| 0.2 | 3.7 | GO:0007202 | activation of phospholipase C activity(GO:0007202) |
| 0.2 | 3.1 | GO:0071243 | cellular response to arsenic-containing substance(GO:0071243) |
| 0.2 | 2.7 | GO:0045494 | photoreceptor cell maintenance(GO:0045494) |
| 0.2 | 6.4 | GO:0007274 | neuromuscular synaptic transmission(GO:0007274) |
| 0.2 | 1.7 | GO:0031998 | regulation of fatty acid beta-oxidation(GO:0031998) |
| 0.2 | 1.0 | GO:0034392 | negative regulation of smooth muscle cell apoptotic process(GO:0034392) |
| 0.2 | 1.3 | GO:0051570 | regulation of histone H3-K9 methylation(GO:0051570) |
| 0.2 | 4.6 | GO:0006884 | cell volume homeostasis(GO:0006884) |
| 0.2 | 3.2 | GO:0032366 | intracellular sterol transport(GO:0032366) intracellular cholesterol transport(GO:0032367) |
| 0.2 | 0.7 | GO:0036378 | calcitriol biosynthetic process from calciol(GO:0036378) |
| 0.2 | 1.1 | GO:1902731 | negative regulation of chondrocyte proliferation(GO:1902731) |
| 0.2 | 2.9 | GO:0018298 | protein-chromophore linkage(GO:0018298) |
| 0.2 | 3.7 | GO:0016254 | preassembly of GPI anchor in ER membrane(GO:0016254) |
| 0.2 | 0.9 | GO:0061743 | motor learning(GO:0061743) |
| 0.2 | 0.4 | GO:0001845 | phagolysosome assembly(GO:0001845) |
| 0.2 | 0.4 | GO:0090024 | complement component C5a signaling pathway(GO:0038178) negative regulation of granulocyte chemotaxis(GO:0071623) negative regulation of neutrophil chemotaxis(GO:0090024) negative regulation of neutrophil migration(GO:1902623) |
| 0.2 | 8.3 | GO:0035914 | skeletal muscle cell differentiation(GO:0035914) |
| 0.2 | 3.9 | GO:0016180 | snRNA processing(GO:0016180) |
| 0.2 | 0.9 | GO:2000353 | positive regulation of endothelial cell apoptotic process(GO:2000353) |
| 0.2 | 16.6 | GO:0006369 | termination of RNA polymerase II transcription(GO:0006369) |
| 0.2 | 0.7 | GO:0038003 | opioid receptor signaling pathway(GO:0038003) |
| 0.2 | 1.2 | GO:0001705 | ectoderm formation(GO:0001705) ectodermal cell fate commitment(GO:0001712) |
| 0.2 | 1.4 | GO:2000370 | positive regulation of clathrin-mediated endocytosis(GO:2000370) |
| 0.2 | 3.4 | GO:0001945 | lymph vessel development(GO:0001945) |
| 0.2 | 4.4 | GO:0032786 | positive regulation of DNA-templated transcription, elongation(GO:0032786) |
| 0.2 | 2.2 | GO:0035855 | megakaryocyte development(GO:0035855) |
| 0.2 | 0.5 | GO:0018103 | protein C-linked glycosylation(GO:0018103) peptidyl-tryptophan modification(GO:0018211) protein C-linked glycosylation via tryptophan(GO:0018317) protein C-linked glycosylation via 2'-alpha-mannosyl-L-tryptophan(GO:0018406) |
| 0.2 | 1.2 | GO:1990573 | potassium ion import across plasma membrane(GO:1990573) |
| 0.2 | 1.5 | GO:1903800 | positive regulation of production of miRNAs involved in gene silencing by miRNA(GO:1903800) |
| 0.2 | 1.2 | GO:0043569 | negative regulation of insulin-like growth factor receptor signaling pathway(GO:0043569) |
| 0.2 | 0.7 | GO:0051917 | regulation of fibrinolysis(GO:0051917) negative regulation of fibrinolysis(GO:0051918) |
| 0.2 | 0.2 | GO:0032224 | positive regulation of synaptic transmission, cholinergic(GO:0032224) |
| 0.2 | 2.1 | GO:1902236 | negative regulation of endoplasmic reticulum stress-induced intrinsic apoptotic signaling pathway(GO:1902236) |
| 0.2 | 5.7 | GO:0001706 | endoderm formation(GO:0001706) |
| 0.2 | 1.8 | GO:0006069 | ethanol oxidation(GO:0006069) |
| 0.2 | 1.6 | GO:2000637 | positive regulation of posttranscriptional gene silencing(GO:0060148) positive regulation of gene silencing by miRNA(GO:2000637) |
| 0.2 | 1.1 | GO:0017196 | N-terminal peptidyl-methionine acetylation(GO:0017196) |
| 0.2 | 0.5 | GO:0031455 | glycine betaine biosynthetic process from choline(GO:0019285) glycine betaine metabolic process(GO:0031455) glycine betaine biosynthetic process(GO:0031456) |
| 0.2 | 1.6 | GO:0038092 | nodal signaling pathway(GO:0038092) |
| 0.2 | 0.6 | GO:0042090 | interleukin-12 biosynthetic process(GO:0042090) regulation of interleukin-12 biosynthetic process(GO:0045075) |
| 0.2 | 1.2 | GO:2000346 | negative regulation of hepatocyte proliferation(GO:2000346) |
| 0.2 | 1.1 | GO:0006516 | glycoprotein catabolic process(GO:0006516) |
| 0.2 | 2.3 | GO:0006359 | regulation of transcription from RNA polymerase III promoter(GO:0006359) |
| 0.2 | 5.6 | GO:1903146 | regulation of mitophagy(GO:1903146) |
| 0.2 | 1.9 | GO:0044241 | lipid digestion(GO:0044241) |
| 0.2 | 0.9 | GO:0098989 | NMDA selective glutamate receptor signaling pathway(GO:0098989) |
| 0.2 | 0.8 | GO:0006477 | protein sulfation(GO:0006477) |
| 0.2 | 1.1 | GO:0048312 | intracellular distribution of mitochondria(GO:0048312) |
| 0.2 | 2.2 | GO:0036148 | phosphatidylglycerol acyl-chain remodeling(GO:0036148) |
| 0.2 | 1.4 | GO:0090023 | positive regulation of neutrophil chemotaxis(GO:0090023) |
| 0.2 | 1.4 | GO:0007023 | post-chaperonin tubulin folding pathway(GO:0007023) |
| 0.2 | 1.4 | GO:1901407 | regulation of phosphorylation of RNA polymerase II C-terminal domain(GO:1901407) positive regulation of phosphorylation of RNA polymerase II C-terminal domain(GO:1901409) |
| 0.2 | 3.3 | GO:0006198 | cAMP catabolic process(GO:0006198) |
| 0.2 | 2.1 | GO:0070208 | protein heterotrimerization(GO:0070208) |
| 0.1 | 2.5 | GO:0043508 | negative regulation of JUN kinase activity(GO:0043508) |
| 0.1 | 3.3 | GO:0048854 | brain morphogenesis(GO:0048854) |
| 0.1 | 5.2 | GO:0016339 | calcium-dependent cell-cell adhesion via plasma membrane cell adhesion molecules(GO:0016339) |
| 0.1 | 2.8 | GO:0046069 | cGMP catabolic process(GO:0046069) |
| 0.1 | 0.7 | GO:2000773 | negative regulation of cellular senescence(GO:2000773) |
| 0.1 | 0.6 | GO:0090344 | negative regulation of cell aging(GO:0090344) |
| 0.1 | 4.3 | GO:0031648 | protein destabilization(GO:0031648) |
| 0.1 | 2.6 | GO:0071108 | protein K48-linked deubiquitination(GO:0071108) |
| 0.1 | 0.6 | GO:0021553 | olfactory nerve development(GO:0021553) |
| 0.1 | 0.8 | GO:0010668 | ectodermal cell differentiation(GO:0010668) |
| 0.1 | 2.1 | GO:0000266 | mitochondrial fission(GO:0000266) |
| 0.1 | 1.1 | GO:0042711 | maternal behavior(GO:0042711) parental behavior(GO:0060746) |
| 0.1 | 1.2 | GO:0030206 | chondroitin sulfate biosynthetic process(GO:0030206) |
| 0.1 | 3.3 | GO:0045022 | early endosome to late endosome transport(GO:0045022) |
| 0.1 | 2.2 | GO:0010663 | positive regulation of striated muscle cell apoptotic process(GO:0010663) positive regulation of cardiac muscle cell apoptotic process(GO:0010666) |
| 0.1 | 4.5 | GO:0051568 | histone H3-K4 methylation(GO:0051568) |
| 0.1 | 0.3 | GO:0098787 | mRNA cleavage involved in mRNA processing(GO:0098787) |
| 0.1 | 0.3 | GO:0001757 | somite specification(GO:0001757) |
| 0.1 | 0.5 | GO:0001951 | intestinal D-glucose absorption(GO:0001951) |
| 0.1 | 2.5 | GO:0045947 | negative regulation of translational initiation(GO:0045947) |
| 0.1 | 0.7 | GO:0002933 | lipid hydroxylation(GO:0002933) |
| 0.1 | 1.1 | GO:0006553 | lysine metabolic process(GO:0006553) lysine catabolic process(GO:0006554) |
| 0.1 | 2.0 | GO:0033539 | fatty acid beta-oxidation using acyl-CoA dehydrogenase(GO:0033539) |
| 0.1 | 1.2 | GO:0021516 | dorsal spinal cord development(GO:0021516) |
| 0.1 | 3.7 | GO:0006040 | amino sugar metabolic process(GO:0006040) |
| 0.1 | 0.3 | GO:0018242 | protein O-linked glycosylation via serine(GO:0018242) |
| 0.1 | 3.3 | GO:0022400 | regulation of rhodopsin mediated signaling pathway(GO:0022400) |
| 0.1 | 2.5 | GO:0042347 | negative regulation of NF-kappaB import into nucleus(GO:0042347) |
| 0.1 | 1.7 | GO:0045974 | miRNA mediated inhibition of translation(GO:0035278) negative regulation of translation, ncRNA-mediated(GO:0040033) regulation of translation, ncRNA-mediated(GO:0045974) |
| 0.1 | 4.6 | GO:0019228 | neuronal action potential(GO:0019228) |
| 0.1 | 0.8 | GO:0015760 | hexose phosphate transport(GO:0015712) glucose-6-phosphate transport(GO:0015760) |
| 0.1 | 1.3 | GO:0048672 | positive regulation of collateral sprouting(GO:0048672) |
| 0.1 | 0.6 | GO:0090043 | regulation of tubulin deacetylation(GO:0090043) |
| 0.1 | 0.6 | GO:0007621 | negative regulation of female receptivity(GO:0007621) |
| 0.1 | 0.3 | GO:0060558 | regulation of vitamin D 24-hydroxylase activity(GO:0010979) positive regulation of vitamin D 24-hydroxylase activity(GO:0010980) bile acid signaling pathway(GO:0038183) regulation of calcidiol 1-monooxygenase activity(GO:0060558) |
| 0.1 | 2.9 | GO:0097352 | autophagosome maturation(GO:0097352) |
| 0.1 | 1.4 | GO:0014029 | neural crest formation(GO:0014029) |
| 0.1 | 1.2 | GO:0071447 | cellular response to hydroperoxide(GO:0071447) |
| 0.1 | 1.7 | GO:0015884 | folic acid transport(GO:0015884) |
| 0.1 | 1.4 | GO:0003341 | cilium movement(GO:0003341) |
| 0.1 | 1.3 | GO:0090154 | positive regulation of sphingolipid biosynthetic process(GO:0090154) positive regulation of ceramide biosynthetic process(GO:2000304) |
| 0.1 | 1.7 | GO:0097186 | amelogenesis(GO:0097186) |
| 0.1 | 1.5 | GO:0015812 | gamma-aminobutyric acid transport(GO:0015812) |
| 0.1 | 0.9 | GO:0050765 | negative regulation of phagocytosis(GO:0050765) |
| 0.1 | 2.3 | GO:0010574 | regulation of vascular endothelial growth factor production(GO:0010574) |
| 0.1 | 1.0 | GO:0023019 | signal transduction involved in regulation of gene expression(GO:0023019) |
| 0.1 | 1.4 | GO:1900745 | positive regulation of p38MAPK cascade(GO:1900745) |
| 0.1 | 0.8 | GO:0015747 | urate transport(GO:0015747) |
| 0.1 | 1.7 | GO:0042953 | lipoprotein transport(GO:0042953) lipoprotein localization(GO:0044872) |
| 0.1 | 1.7 | GO:0035589 | G-protein coupled purinergic nucleotide receptor signaling pathway(GO:0035589) |
| 0.1 | 1.2 | GO:0051661 | maintenance of centrosome location(GO:0051661) |
| 0.1 | 1.6 | GO:0048536 | spleen development(GO:0048536) |
| 0.1 | 1.9 | GO:0048147 | negative regulation of fibroblast proliferation(GO:0048147) |
| 0.1 | 1.8 | GO:0034656 | nucleobase-containing small molecule catabolic process(GO:0034656) |
| 0.1 | 0.5 | GO:0048133 | germ-line stem cell division(GO:0042078) male germ-line stem cell asymmetric division(GO:0048133) germline stem cell asymmetric division(GO:0098728) |
| 0.1 | 0.3 | GO:0070633 | transepithelial transport(GO:0070633) |
| 0.1 | 3.6 | GO:0007520 | myoblast fusion(GO:0007520) |
| 0.1 | 0.2 | GO:1901523 | leukotriene catabolic process(GO:0036100) leukotriene B4 catabolic process(GO:0036101) leukotriene B4 metabolic process(GO:0036102) icosanoid catabolic process(GO:1901523) fatty acid derivative catabolic process(GO:1901569) |
| 0.1 | 0.2 | GO:0048266 | behavioral response to pain(GO:0048266) |
| 0.1 | 1.4 | GO:0006646 | phosphatidylethanolamine biosynthetic process(GO:0006646) |
| 0.1 | 0.3 | GO:0060168 | regulation of adenosine receptor signaling pathway(GO:0060167) positive regulation of adenosine receptor signaling pathway(GO:0060168) |
| 0.1 | 1.1 | GO:0001569 | patterning of blood vessels(GO:0001569) |
| 0.1 | 4.6 | GO:0007214 | gamma-aminobutyric acid signaling pathway(GO:0007214) |
| 0.1 | 6.8 | GO:0006406 | mRNA export from nucleus(GO:0006406) mRNA-containing ribonucleoprotein complex export from nucleus(GO:0071427) |
| 0.1 | 1.9 | GO:0070262 | peptidyl-serine dephosphorylation(GO:0070262) |
| 0.1 | 0.7 | GO:0070127 | tRNA aminoacylation for mitochondrial protein translation(GO:0070127) |
| 0.1 | 1.1 | GO:0032897 | negative regulation of viral transcription(GO:0032897) |
| 0.1 | 0.6 | GO:0000712 | resolution of meiotic recombination intermediates(GO:0000712) |
| 0.1 | 2.1 | GO:0045776 | negative regulation of blood pressure(GO:0045776) |
| 0.1 | 0.4 | GO:0015677 | copper ion import(GO:0015677) |
| 0.1 | 2.3 | GO:0043171 | peptide catabolic process(GO:0043171) |
| 0.1 | 1.6 | GO:0045616 | regulation of keratinocyte differentiation(GO:0045616) |
| 0.1 | 1.0 | GO:0007220 | Notch receptor processing(GO:0007220) |
| 0.1 | 1.2 | GO:1901838 | positive regulation of transcription of nuclear large rRNA transcript from RNA polymerase I promoter(GO:1901838) |
| 0.1 | 5.2 | GO:0007218 | neuropeptide signaling pathway(GO:0007218) |
| 0.1 | 0.6 | GO:0030828 | positive regulation of cGMP biosynthetic process(GO:0030828) |
| 0.1 | 2.3 | GO:0015991 | energy coupled proton transmembrane transport, against electrochemical gradient(GO:0015988) ATP hydrolysis coupled proton transport(GO:0015991) |
| 0.1 | 1.3 | GO:0019511 | peptidyl-proline hydroxylation(GO:0019511) |
| 0.1 | 0.3 | GO:0038018 | Wnt receptor catabolic process(GO:0038018) |
| 0.1 | 1.1 | GO:0006705 | mineralocorticoid biosynthetic process(GO:0006705) mineralocorticoid metabolic process(GO:0008212) |
| 0.1 | 2.4 | GO:0008089 | anterograde axonal transport(GO:0008089) |
| 0.1 | 0.2 | GO:0072313 | metanephric glomerular epithelium development(GO:0072244) metanephric glomerular visceral epithelial cell differentiation(GO:0072248) metanephric glomerular visceral epithelial cell development(GO:0072249) metanephric glomerular epithelial cell differentiation(GO:0072312) metanephric glomerular epithelial cell development(GO:0072313) |
| 0.1 | 0.5 | GO:0008218 | bioluminescence(GO:0008218) |
| 0.1 | 4.5 | GO:0035722 | interleukin-12-mediated signaling pathway(GO:0035722) response to interleukin-12(GO:0070671) cellular response to interleukin-12(GO:0071349) |
| 0.1 | 0.3 | GO:0006669 | sphinganine-1-phosphate biosynthetic process(GO:0006669) |
| 0.1 | 0.6 | GO:0045603 | positive regulation of endothelial cell differentiation(GO:0045603) |
| 0.1 | 2.8 | GO:1904837 | beta-catenin-TCF complex assembly(GO:1904837) |
| 0.1 | 1.0 | GO:0000132 | establishment of mitotic spindle orientation(GO:0000132) |
| 0.1 | 0.5 | GO:0006710 | androgen catabolic process(GO:0006710) |
| 0.1 | 1.9 | GO:0046475 | glycerophospholipid catabolic process(GO:0046475) |
| 0.1 | 1.0 | GO:0043584 | nose development(GO:0043584) |
| 0.1 | 0.2 | GO:0006616 | SRP-dependent cotranslational protein targeting to membrane, translocation(GO:0006616) |
| 0.1 | 0.4 | GO:0001696 | gastric acid secretion(GO:0001696) |
| 0.1 | 0.8 | GO:0051693 | actin filament capping(GO:0051693) |
| 0.1 | 0.6 | GO:0019368 | fatty acid elongation, saturated fatty acid(GO:0019367) fatty acid elongation, unsaturated fatty acid(GO:0019368) fatty acid elongation, monounsaturated fatty acid(GO:0034625) fatty acid elongation, polyunsaturated fatty acid(GO:0034626) |
| 0.1 | 0.9 | GO:0051016 | barbed-end actin filament capping(GO:0051016) |
| 0.1 | 0.5 | GO:0042423 | catechol-containing compound biosynthetic process(GO:0009713) catecholamine biosynthetic process(GO:0042423) |
| 0.1 | 1.0 | GO:0051895 | negative regulation of focal adhesion assembly(GO:0051895) negative regulation of adherens junction organization(GO:1903392) |
| 0.1 | 1.1 | GO:0032878 | regulation of establishment or maintenance of cell polarity(GO:0032878) |
| 0.1 | 0.2 | GO:1900042 | positive regulation of interleukin-2 secretion(GO:1900042) |
| 0.1 | 0.2 | GO:1900025 | negative regulation of substrate adhesion-dependent cell spreading(GO:1900025) |
| 0.1 | 0.5 | GO:0031118 | rRNA pseudouridine synthesis(GO:0031118) |
| 0.1 | 5.1 | GO:0031338 | regulation of vesicle fusion(GO:0031338) |
| 0.1 | 0.1 | GO:2000418 | positive regulation of eosinophil migration(GO:2000418) |
| 0.1 | 0.3 | GO:0007625 | grooming behavior(GO:0007625) |
| 0.1 | 0.5 | GO:0061469 | regulation of type B pancreatic cell proliferation(GO:0061469) |
| 0.1 | 2.2 | GO:0032212 | positive regulation of telomere maintenance via telomerase(GO:0032212) |
| 0.1 | 0.6 | GO:0060272 | embryonic skeletal joint morphogenesis(GO:0060272) |
| 0.1 | 8.9 | GO:0006614 | SRP-dependent cotranslational protein targeting to membrane(GO:0006614) |
| 0.1 | 0.8 | GO:0035435 | phosphate ion transmembrane transport(GO:0035435) |
| 0.1 | 0.3 | GO:0016093 | polyprenol metabolic process(GO:0016093) |
| 0.1 | 0.1 | GO:0060385 | axonogenesis involved in innervation(GO:0060385) |
| 0.1 | 0.7 | GO:0007628 | adult walking behavior(GO:0007628) |
| 0.1 | 0.8 | GO:0090200 | positive regulation of release of cytochrome c from mitochondria(GO:0090200) |
| 0.1 | 0.3 | GO:0019509 | L-methionine biosynthetic process from methylthioadenosine(GO:0019509) |
| 0.1 | 0.9 | GO:0019373 | epoxygenase P450 pathway(GO:0019373) |
| 0.1 | 0.4 | GO:0090080 | positive regulation of MAPKKK cascade by fibroblast growth factor receptor signaling pathway(GO:0090080) |
| 0.1 | 0.3 | GO:0048680 | positive regulation of axon regeneration(GO:0048680) |
| 0.1 | 1.1 | GO:0035428 | hexose transmembrane transport(GO:0035428) glucose transmembrane transport(GO:1904659) |
| 0.1 | 0.9 | GO:0006111 | regulation of gluconeogenesis(GO:0006111) |
| 0.1 | 0.8 | GO:0009303 | rRNA transcription(GO:0009303) |
| 0.0 | 0.5 | GO:0051923 | sulfation(GO:0051923) |
| 0.0 | 0.2 | GO:0060394 | negative regulation of pathway-restricted SMAD protein phosphorylation(GO:0060394) |
| 0.0 | 0.5 | GO:0035020 | regulation of Rac protein signal transduction(GO:0035020) |
| 0.0 | 0.3 | GO:0098870 | neuronal action potential propagation(GO:0019227) action potential propagation(GO:0098870) |
| 0.0 | 0.4 | GO:0030322 | stabilization of membrane potential(GO:0030322) |
| 0.0 | 5.0 | GO:0006661 | phosphatidylinositol biosynthetic process(GO:0006661) |
| 0.0 | 0.5 | GO:0060689 | cell differentiation involved in salivary gland development(GO:0060689) |
| 0.0 | 0.6 | GO:1900151 | regulation of nuclear-transcribed mRNA catabolic process, deadenylation-dependent decay(GO:1900151) positive regulation of nuclear-transcribed mRNA catabolic process, deadenylation-dependent decay(GO:1900153) |
| 0.0 | 0.2 | GO:1990034 | calcium ion export(GO:1901660) calcium ion export from cell(GO:1990034) |
| 0.0 | 3.6 | GO:0050911 | detection of chemical stimulus involved in sensory perception of smell(GO:0050911) |
| 0.0 | 0.8 | GO:0006654 | phosphatidic acid biosynthetic process(GO:0006654) |
| 0.0 | 0.4 | GO:0006590 | thyroid hormone generation(GO:0006590) |
| 0.0 | 0.1 | GO:0038028 | insulin receptor signaling pathway via phosphatidylinositol 3-kinase(GO:0038028) |
| 0.0 | 0.3 | GO:0097009 | energy homeostasis(GO:0097009) |
| 0.0 | 0.9 | GO:0016525 | negative regulation of angiogenesis(GO:0016525) |
| 0.0 | 0.3 | GO:2000369 | regulation of clathrin-mediated endocytosis(GO:2000369) |
| 0.0 | 0.5 | GO:0015740 | C4-dicarboxylate transport(GO:0015740) |
| 0.0 | 0.2 | GO:0016075 | rRNA catabolic process(GO:0016075) |
| 0.0 | 0.4 | GO:0030166 | proteoglycan biosynthetic process(GO:0030166) |
| 0.0 | 0.5 | GO:0006891 | intra-Golgi vesicle-mediated transport(GO:0006891) |
| 0.0 | 0.6 | GO:0015695 | organic cation transport(GO:0015695) |
| 0.0 | 0.1 | GO:0046603 | negative regulation of mitotic centrosome separation(GO:0046603) |
| 0.0 | 1.1 | GO:0030101 | natural killer cell activation(GO:0030101) |
| 0.0 | 0.6 | GO:0006953 | acute-phase response(GO:0006953) |
| 0.0 | 0.5 | GO:0006308 | DNA catabolic process(GO:0006308) |
| 0.0 | 0.1 | GO:0090481 | pyrimidine nucleotide-sugar transmembrane transport(GO:0090481) |
| 0.0 | 0.3 | GO:0046513 | ceramide biosynthetic process(GO:0046513) |
| 0.0 | 0.2 | GO:0070228 | regulation of lymphocyte apoptotic process(GO:0070228) |
| 0.0 | 0.7 | GO:0051028 | mRNA transport(GO:0051028) |
| 0.0 | 0.0 | GO:2000676 | positive regulation of type B pancreatic cell apoptotic process(GO:2000676) |
| 0.0 | 0.2 | GO:0046457 | prostaglandin biosynthetic process(GO:0001516) cyclooxygenase pathway(GO:0019371) prostanoid biosynthetic process(GO:0046457) |
| 0.0 | 0.5 | GO:0016266 | O-glycan processing(GO:0016266) |
Gene overrepresentation in cellular component category:
| Log-likelihood per target | Total log-likelihood | Term | Description |
|---|---|---|---|
| 6.7 | 20.1 | GO:0071753 | IgM immunoglobulin complex(GO:0071753) IgM immunoglobulin complex, circulating(GO:0071754) pentameric IgM immunoglobulin complex(GO:0071756) |
| 6.5 | 32.4 | GO:0034688 | integrin alphaM-beta2 complex(GO:0034688) |
| 4.8 | 23.9 | GO:0005826 | actomyosin contractile ring(GO:0005826) |
| 4.4 | 17.5 | GO:0034669 | integrin alpha4-beta7 complex(GO:0034669) |
| 4.4 | 218.1 | GO:0042571 | immunoglobulin complex, circulating(GO:0042571) |
| 3.5 | 10.4 | GO:0034686 | integrin alphav-beta8 complex(GO:0034686) |
| 3.3 | 16.3 | GO:0072558 | NLRP1 inflammasome complex(GO:0072558) AIM2 inflammasome complex(GO:0097169) |
| 3.2 | 3.2 | GO:0002193 | MAML1-RBP-Jkappa- ICN1 complex(GO:0002193) |
| 2.7 | 16.4 | GO:0097013 | phagocytic vesicle lumen(GO:0097013) |
| 2.7 | 21.8 | GO:0035976 | AP1 complex(GO:0035976) |
| 2.7 | 13.4 | GO:0019815 | B cell receptor complex(GO:0019815) |
| 2.4 | 21.6 | GO:0032010 | phagolysosome(GO:0032010) |
| 2.2 | 17.7 | GO:0097208 | alveolar lamellar body(GO:0097208) |
| 2.1 | 39.6 | GO:0042613 | MHC class II protein complex(GO:0042613) |
| 2.1 | 14.4 | GO:0030121 | AP-1 adaptor complex(GO:0030121) |
| 2.0 | 9.8 | GO:0061702 | inflammasome complex(GO:0061702) NLRP3 inflammasome complex(GO:0072559) |
| 1.9 | 5.8 | GO:0097679 | other organism cytoplasm(GO:0097679) |
| 1.9 | 7.6 | GO:0005602 | complement component C1 complex(GO:0005602) |
| 1.8 | 20.0 | GO:0042105 | alpha-beta T cell receptor complex(GO:0042105) |
| 1.7 | 8.6 | GO:0032299 | ribonuclease H2 complex(GO:0032299) |
| 1.7 | 8.5 | GO:0071008 | U2-type post-mRNA release spliceosomal complex(GO:0071008) |
| 1.7 | 8.4 | GO:0031302 | intrinsic component of endosome membrane(GO:0031302) |
| 1.6 | 4.9 | GO:0005944 | phosphatidylinositol 3-kinase complex, class IB(GO:0005944) |
| 1.6 | 18.0 | GO:0060171 | stereocilium membrane(GO:0060171) |
| 1.4 | 35.8 | GO:0031095 | platelet dense tubular network membrane(GO:0031095) |
| 1.4 | 4.1 | GO:0060987 | lipid tube(GO:0060987) |
| 1.4 | 5.4 | GO:0000818 | nuclear MIS12/MIND complex(GO:0000818) |
| 1.3 | 5.1 | GO:0030895 | apolipoprotein B mRNA editing enzyme complex(GO:0030895) |
| 1.2 | 26.0 | GO:0001931 | uropod(GO:0001931) cell trailing edge(GO:0031254) |
| 1.2 | 4.9 | GO:0034365 | discoidal high-density lipoprotein particle(GO:0034365) |
| 1.2 | 8.3 | GO:0070436 | Grb2-EGFR complex(GO:0070436) |
| 1.1 | 6.8 | GO:1990682 | CSF1-CSF1R complex(GO:1990682) |
| 1.1 | 16.8 | GO:0032059 | bleb(GO:0032059) |
| 1.1 | 8.9 | GO:0030868 | smooth endoplasmic reticulum membrane(GO:0030868) smooth endoplasmic reticulum part(GO:0097425) |
| 1.0 | 8.3 | GO:0000138 | Golgi trans cisterna(GO:0000138) |
| 1.0 | 6.9 | GO:0032021 | NELF complex(GO:0032021) |
| 1.0 | 5.9 | GO:0097129 | cyclin D2-CDK4 complex(GO:0097129) |
| 1.0 | 6.8 | GO:0043196 | varicosity(GO:0043196) |
| 1.0 | 1.9 | GO:1990393 | 3M complex(GO:1990393) |
| 0.9 | 2.8 | GO:0032426 | stereocilium tip(GO:0032426) |
| 0.9 | 4.6 | GO:0031205 | endoplasmic reticulum Sec complex(GO:0031205) |
| 0.9 | 20.1 | GO:0005721 | pericentric heterochromatin(GO:0005721) |
| 0.9 | 18.2 | GO:0005796 | Golgi lumen(GO:0005796) |
| 0.9 | 4.5 | GO:0070847 | core mediator complex(GO:0070847) |
| 0.9 | 2.6 | GO:0000333 | telomerase catalytic core complex(GO:0000333) |
| 0.9 | 2.6 | GO:0032116 | SMC loading complex(GO:0032116) |
| 0.9 | 6.1 | GO:1990635 | proximal dendrite(GO:1990635) |
| 0.8 | 17.7 | GO:0005861 | troponin complex(GO:0005861) |
| 0.8 | 5.0 | GO:0044194 | cytolytic granule(GO:0044194) |
| 0.8 | 19.8 | GO:0005849 | mRNA cleavage factor complex(GO:0005849) |
| 0.8 | 8.9 | GO:0030870 | Mre11 complex(GO:0030870) |
| 0.8 | 4.8 | GO:0034673 | inhibin-betaglycan-ActRII complex(GO:0034673) |
| 0.8 | 2.4 | GO:0002139 | stereocilia coupling link(GO:0002139) |
| 0.8 | 4.0 | GO:0005896 | interleukin-6 receptor complex(GO:0005896) |
| 0.8 | 3.2 | GO:0070695 | FHF complex(GO:0070695) |
| 0.8 | 11.4 | GO:0099634 | postsynaptic specialization membrane(GO:0099634) |
| 0.8 | 6.8 | GO:0071953 | elastic fiber(GO:0071953) |
| 0.8 | 2.3 | GO:1990316 | ATG1/ULK1 kinase complex(GO:1990316) |
| 0.7 | 26.3 | GO:0042629 | mast cell granule(GO:0042629) |
| 0.7 | 9.1 | GO:0031209 | SCAR complex(GO:0031209) |
| 0.7 | 2.8 | GO:0019034 | viral replication complex(GO:0019034) |
| 0.7 | 12.2 | GO:0005865 | striated muscle thin filament(GO:0005865) |
| 0.7 | 17.6 | GO:0005720 | nuclear heterochromatin(GO:0005720) |
| 0.7 | 8.6 | GO:0005744 | mitochondrial inner membrane presequence translocase complex(GO:0005744) |
| 0.6 | 3.9 | GO:0045298 | tubulin complex(GO:0045298) |
| 0.6 | 1.9 | GO:0000801 | central element(GO:0000801) |
| 0.6 | 1.9 | GO:0035189 | Rb-E2F complex(GO:0035189) |
| 0.6 | 4.5 | GO:0045252 | oxoglutarate dehydrogenase complex(GO:0045252) |
| 0.6 | 3.2 | GO:0071797 | LUBAC complex(GO:0071797) |
| 0.6 | 5.0 | GO:0033093 | Weibel-Palade body(GO:0033093) |
| 0.6 | 5.0 | GO:0032541 | cortical endoplasmic reticulum(GO:0032541) |
| 0.6 | 1.8 | GO:0097637 | intrinsic component of autophagosome membrane(GO:0097636) integral component of autophagosome membrane(GO:0097637) |
| 0.6 | 4.7 | GO:0005593 | FACIT collagen trimer(GO:0005593) |
| 0.6 | 11.7 | GO:0031229 | integral component of nuclear inner membrane(GO:0005639) intrinsic component of nuclear inner membrane(GO:0031229) nuclear membrane part(GO:0044453) |
| 0.6 | 2.9 | GO:0042643 | actomyosin, actin portion(GO:0042643) |
| 0.6 | 16.7 | GO:0005719 | nuclear euchromatin(GO:0005719) |
| 0.6 | 7.5 | GO:0097413 | Lewy body(GO:0097413) |
| 0.6 | 8.6 | GO:0042589 | zymogen granule membrane(GO:0042589) |
| 0.6 | 1.7 | GO:0071062 | alphav-beta3 integrin-vitronectin complex(GO:0071062) |
| 0.6 | 5.1 | GO:0070083 | clathrin-sculpted monoamine transport vesicle(GO:0070081) clathrin-sculpted monoamine transport vesicle membrane(GO:0070083) |
| 0.6 | 4.0 | GO:0033018 | sarcoplasmic reticulum lumen(GO:0033018) |
| 0.6 | 11.2 | GO:0051233 | spindle midzone(GO:0051233) |
| 0.6 | 2.2 | GO:0071546 | pi-body(GO:0071546) |
| 0.5 | 3.3 | GO:0005967 | mitochondrial pyruvate dehydrogenase complex(GO:0005967) |
| 0.5 | 2.2 | GO:0035363 | histone locus body(GO:0035363) |
| 0.5 | 6.7 | GO:0005583 | fibrillar collagen trimer(GO:0005583) banded collagen fibril(GO:0098643) |
| 0.5 | 3.6 | GO:0008282 | ATP-sensitive potassium channel complex(GO:0008282) |
| 0.5 | 2.5 | GO:0031905 | early endosome lumen(GO:0031905) |
| 0.5 | 2.4 | GO:0000835 | ER ubiquitin ligase complex(GO:0000835) Hrd1p ubiquitin ligase complex(GO:0000836) |
| 0.5 | 1.0 | GO:0000805 | X chromosome(GO:0000805) |
| 0.5 | 2.4 | GO:0001652 | granular component(GO:0001652) |
| 0.5 | 6.7 | GO:0033010 | paranodal junction(GO:0033010) |
| 0.5 | 29.6 | GO:0015030 | Cajal body(GO:0015030) |
| 0.5 | 2.9 | GO:0002177 | manchette(GO:0002177) |
| 0.5 | 16.1 | GO:0030173 | integral component of Golgi membrane(GO:0030173) |
| 0.5 | 4.2 | GO:0005916 | fascia adherens(GO:0005916) |
| 0.5 | 2.8 | GO:1903440 | calcitonin family receptor complex(GO:1903439) amylin receptor complex(GO:1903440) |
| 0.5 | 8.7 | GO:0014731 | spectrin-associated cytoskeleton(GO:0014731) |
| 0.5 | 1.4 | GO:0072536 | interleukin-23 receptor complex(GO:0072536) |
| 0.5 | 22.8 | GO:0016235 | aggresome(GO:0016235) |
| 0.5 | 6.4 | GO:0032045 | guanyl-nucleotide exchange factor complex(GO:0032045) |
| 0.5 | 1.4 | GO:0035354 | Toll-like receptor 1-Toll-like receptor 2 protein complex(GO:0035354) |
| 0.4 | 7.6 | GO:0042101 | T cell receptor complex(GO:0042101) |
| 0.4 | 28.0 | GO:0008023 | transcription elongation factor complex(GO:0008023) |
| 0.4 | 12.5 | GO:0005892 | acetylcholine-gated channel complex(GO:0005892) |
| 0.4 | 2.1 | GO:0032444 | activin responsive factor complex(GO:0032444) |
| 0.4 | 3.0 | GO:0033391 | chromatoid body(GO:0033391) |
| 0.4 | 3.8 | GO:0097486 | multivesicular body lumen(GO:0097486) |
| 0.4 | 3.7 | GO:0032133 | chromosome passenger complex(GO:0032133) |
| 0.4 | 5.8 | GO:0044232 | organelle membrane contact site(GO:0044232) |
| 0.4 | 5.0 | GO:0036056 | filtration diaphragm(GO:0036056) slit diaphragm(GO:0036057) |
| 0.4 | 2.9 | GO:0042406 | extrinsic component of endoplasmic reticulum membrane(GO:0042406) |
| 0.4 | 7.4 | GO:0031089 | platelet dense granule lumen(GO:0031089) |
| 0.4 | 6.1 | GO:0008074 | guanylate cyclase complex, soluble(GO:0008074) |
| 0.4 | 4.8 | GO:0048188 | Set1C/COMPASS complex(GO:0048188) |
| 0.4 | 4.0 | GO:0043190 | ATP-binding cassette (ABC) transporter complex(GO:0043190) |
| 0.4 | 1.6 | GO:1990246 | uniplex complex(GO:1990246) |
| 0.4 | 2.0 | GO:0032807 | DNA-dependent protein kinase-DNA ligase 4 complex(GO:0005958) DNA ligase IV complex(GO:0032807) |
| 0.4 | 14.9 | GO:0005859 | muscle myosin complex(GO:0005859) |
| 0.4 | 1.2 | GO:0035525 | NF-kappaB p50/p65 complex(GO:0035525) |
| 0.4 | 5.8 | GO:0031045 | dense core granule(GO:0031045) |
| 0.4 | 1.1 | GO:0030689 | Noc complex(GO:0030689) |
| 0.4 | 5.4 | GO:0033270 | paranode region of axon(GO:0033270) |
| 0.4 | 1.1 | GO:0005745 | m-AAA complex(GO:0005745) |
| 0.4 | 2.2 | GO:0044327 | dendritic spine head(GO:0044327) |
| 0.4 | 1.4 | GO:0048179 | activin receptor complex(GO:0048179) |
| 0.4 | 1.8 | GO:0005854 | nascent polypeptide-associated complex(GO:0005854) |
| 0.4 | 3.9 | GO:0032039 | integrator complex(GO:0032039) |
| 0.3 | 12.5 | GO:0005902 | microvillus(GO:0005902) |
| 0.3 | 1.0 | GO:0044214 | spanning component of plasma membrane(GO:0044214) spanning component of membrane(GO:0089717) |
| 0.3 | 1.7 | GO:0005577 | fibrinogen complex(GO:0005577) |
| 0.3 | 3.7 | GO:0010009 | cytoplasmic side of endosome membrane(GO:0010009) |
| 0.3 | 2.3 | GO:0030991 | intraciliary transport particle A(GO:0030991) |
| 0.3 | 6.3 | GO:0034045 | pre-autophagosomal structure membrane(GO:0034045) |
| 0.3 | 6.6 | GO:0031528 | microvillus membrane(GO:0031528) |
| 0.3 | 1.0 | GO:0042588 | zymogen granule(GO:0042588) |
| 0.3 | 3.2 | GO:0030061 | mitochondrial crista(GO:0030061) |
| 0.3 | 16.3 | GO:0005782 | peroxisomal matrix(GO:0005782) microbody lumen(GO:0031907) |
| 0.3 | 11.6 | GO:1904724 | tertiary granule lumen(GO:1904724) |
| 0.3 | 6.8 | GO:0001518 | voltage-gated sodium channel complex(GO:0001518) |
| 0.3 | 2.1 | GO:0005827 | polar microtubule(GO:0005827) |
| 0.3 | 1.2 | GO:0044307 | dendritic branch(GO:0044307) |
| 0.3 | 5.5 | GO:0000242 | pericentriolar material(GO:0000242) |
| 0.3 | 3.0 | GO:0042567 | insulin-like growth factor ternary complex(GO:0042567) |
| 0.3 | 1.5 | GO:0030896 | checkpoint clamp complex(GO:0030896) |
| 0.3 | 21.1 | GO:0035580 | specific granule lumen(GO:0035580) |
| 0.3 | 3.4 | GO:0005858 | axonemal dynein complex(GO:0005858) |
| 0.3 | 1.1 | GO:0032449 | CBM complex(GO:0032449) |
| 0.3 | 4.7 | GO:0097440 | apical dendrite(GO:0097440) |
| 0.3 | 1.7 | GO:0009331 | glycerol-3-phosphate dehydrogenase complex(GO:0009331) |
| 0.3 | 3.6 | GO:0005589 | collagen type VI trimer(GO:0005589) collagen beaded filament(GO:0098647) |
| 0.3 | 45.8 | GO:0072562 | blood microparticle(GO:0072562) |
| 0.3 | 1.4 | GO:0030314 | junctional membrane complex(GO:0030314) |
| 0.3 | 1.6 | GO:0070765 | gamma-secretase complex(GO:0070765) |
| 0.3 | 1.9 | GO:1990745 | EARP complex(GO:1990745) |
| 0.3 | 3.2 | GO:0043240 | Fanconi anaemia nuclear complex(GO:0043240) |
| 0.3 | 7.4 | GO:0044298 | neuronal cell body membrane(GO:0032809) cell body membrane(GO:0044298) |
| 0.3 | 0.8 | GO:0031228 | intrinsic component of Golgi membrane(GO:0031228) |
| 0.2 | 2.2 | GO:0000813 | ESCRT I complex(GO:0000813) |
| 0.2 | 1.2 | GO:1902937 | inward rectifier potassium channel complex(GO:1902937) |
| 0.2 | 1.7 | GO:0031464 | Cul4A-RING E3 ubiquitin ligase complex(GO:0031464) |
| 0.2 | 6.0 | GO:0032391 | photoreceptor connecting cilium(GO:0032391) |
| 0.2 | 3.1 | GO:0044322 | endoplasmic reticulum quality control compartment(GO:0044322) |
| 0.2 | 1.9 | GO:0046658 | anchored component of plasma membrane(GO:0046658) |
| 0.2 | 1.4 | GO:0046696 | lipopolysaccharide receptor complex(GO:0046696) |
| 0.2 | 3.6 | GO:0034663 | endoplasmic reticulum chaperone complex(GO:0034663) |
| 0.2 | 6.0 | GO:0031307 | integral component of mitochondrial outer membrane(GO:0031307) |
| 0.2 | 25.1 | GO:0035579 | specific granule membrane(GO:0035579) |
| 0.2 | 2.1 | GO:0031527 | filopodium membrane(GO:0031527) |
| 0.2 | 2.9 | GO:0017119 | Golgi transport complex(GO:0017119) |
| 0.2 | 4.4 | GO:0080008 | Cul4-RING E3 ubiquitin ligase complex(GO:0080008) |
| 0.2 | 1.1 | GO:1990031 | pinceau fiber(GO:1990031) |
| 0.2 | 23.4 | GO:0034705 | voltage-gated potassium channel complex(GO:0008076) potassium channel complex(GO:0034705) |
| 0.2 | 1.1 | GO:0016533 | cyclin-dependent protein kinase 5 holoenzyme complex(GO:0016533) |
| 0.2 | 0.6 | GO:0001940 | male pronucleus(GO:0001940) |
| 0.2 | 3.6 | GO:0031332 | RISC complex(GO:0016442) RNAi effector complex(GO:0031332) |
| 0.2 | 2.3 | GO:0002116 | semaphorin receptor complex(GO:0002116) |
| 0.2 | 2.7 | GO:0031235 | intrinsic component of the cytoplasmic side of the plasma membrane(GO:0031235) |
| 0.2 | 3.4 | GO:0016471 | vacuolar proton-transporting V-type ATPase complex(GO:0016471) |
| 0.2 | 20.4 | GO:0005814 | centriole(GO:0005814) |
| 0.2 | 4.1 | GO:0097381 | photoreceptor disc membrane(GO:0097381) |
| 0.2 | 1.1 | GO:1990712 | HFE-transferrin receptor complex(GO:1990712) |
| 0.2 | 1.1 | GO:0032584 | growth cone membrane(GO:0032584) |
| 0.2 | 4.2 | GO:0001891 | phagocytic cup(GO:0001891) |
| 0.2 | 2.2 | GO:0030008 | TRAPP complex(GO:0030008) |
| 0.2 | 0.5 | GO:0035517 | PR-DUB complex(GO:0035517) |
| 0.2 | 2.1 | GO:0097427 | microtubule bundle(GO:0097427) |
| 0.2 | 13.9 | GO:0101003 | ficolin-1-rich granule membrane(GO:0101003) |
| 0.2 | 8.1 | GO:0005637 | nuclear inner membrane(GO:0005637) |
| 0.2 | 4.3 | GO:0005697 | telomerase holoenzyme complex(GO:0005697) |
| 0.2 | 0.5 | GO:0033185 | dolichol-phosphate-mannose synthase complex(GO:0033185) |
| 0.2 | 1.4 | GO:0090576 | RNA polymerase III transcription factor complex(GO:0090576) |
| 0.2 | 1.9 | GO:0016013 | syntrophin complex(GO:0016013) |
| 0.2 | 2.3 | GO:0031083 | BLOC-1 complex(GO:0031083) |
| 0.1 | 5.2 | GO:0090545 | NuRD complex(GO:0016581) CHD-type complex(GO:0090545) |
| 0.1 | 0.3 | GO:0002079 | inner acrosomal membrane(GO:0002079) |
| 0.1 | 3.6 | GO:0031264 | death-inducing signaling complex(GO:0031264) |
| 0.1 | 1.6 | GO:1990909 | Wnt signalosome(GO:1990909) |
| 0.1 | 0.9 | GO:0090543 | Flemming body(GO:0090543) |
| 0.1 | 1.1 | GO:0031414 | N-terminal protein acetyltransferase complex(GO:0031414) |
| 0.1 | 9.6 | GO:0031225 | anchored component of membrane(GO:0031225) |
| 0.1 | 1.4 | GO:0031462 | Cul2-RING ubiquitin ligase complex(GO:0031462) |
| 0.1 | 1.4 | GO:1990907 | beta-catenin-TCF complex(GO:1990907) |
| 0.1 | 9.6 | GO:0035578 | azurophil granule lumen(GO:0035578) |
| 0.1 | 0.5 | GO:0036396 | MIS complex(GO:0036396) mRNA editing complex(GO:0045293) |
| 0.1 | 17.2 | GO:0009897 | external side of plasma membrane(GO:0009897) |
| 0.1 | 7.3 | GO:0022627 | cytosolic small ribosomal subunit(GO:0022627) |
| 0.1 | 2.7 | GO:0030673 | axolemma(GO:0030673) |
| 0.1 | 2.0 | GO:0031932 | TORC2 complex(GO:0031932) |
| 0.1 | 0.5 | GO:0016580 | Sin3 complex(GO:0016580) |
| 0.1 | 1.6 | GO:0005922 | connexon complex(GO:0005922) |
| 0.1 | 3.1 | GO:1902711 | GABA-A receptor complex(GO:1902711) |
| 0.1 | 0.8 | GO:0005786 | signal recognition particle, endoplasmic reticulum targeting(GO:0005786) |
| 0.1 | 0.4 | GO:0033553 | rDNA heterochromatin(GO:0033553) |
| 0.1 | 0.4 | GO:0044614 | nuclear pore cytoplasmic filaments(GO:0044614) |
| 0.1 | 0.8 | GO:0017146 | NMDA selective glutamate receptor complex(GO:0017146) |
| 0.1 | 0.5 | GO:0032433 | filopodium tip(GO:0032433) |
| 0.1 | 2.1 | GO:1990391 | DNA repair complex(GO:1990391) |
| 0.1 | 9.3 | GO:0043202 | lysosomal lumen(GO:0043202) |
| 0.1 | 5.2 | GO:0071013 | catalytic step 2 spliceosome(GO:0071013) |
| 0.1 | 0.3 | GO:0043194 | axon initial segment(GO:0043194) |
| 0.1 | 3.7 | GO:0005581 | collagen trimer(GO:0005581) |
| 0.1 | 0.7 | GO:0032389 | MutLalpha complex(GO:0032389) |
| 0.1 | 0.5 | GO:0019907 | cyclin-dependent protein kinase activating kinase holoenzyme complex(GO:0019907) |
| 0.1 | 7.2 | GO:0005777 | peroxisome(GO:0005777) microbody(GO:0042579) |
| 0.1 | 0.3 | GO:0045179 | apical cortex(GO:0045179) |
| 0.1 | 6.5 | GO:0016605 | PML body(GO:0016605) |
| 0.1 | 40.6 | GO:0016604 | nuclear body(GO:0016604) |
| 0.1 | 0.6 | GO:0032591 | dendritic spine membrane(GO:0032591) |
| 0.1 | 0.5 | GO:0044292 | dendrite terminus(GO:0044292) dendritic growth cone(GO:0044294) |
| 0.1 | 3.6 | GO:0005891 | voltage-gated calcium channel complex(GO:0005891) |
| 0.1 | 1.0 | GO:0031011 | Ino80 complex(GO:0031011) DNA helicase complex(GO:0033202) |
| 0.1 | 0.3 | GO:0005833 | hemoglobin complex(GO:0005833) |
| 0.1 | 0.8 | GO:0035631 | CD40 receptor complex(GO:0035631) |
| 0.1 | 0.7 | GO:0000145 | exocyst(GO:0000145) |
| 0.1 | 68.1 | GO:0005615 | extracellular space(GO:0005615) |
| 0.0 | 1.9 | GO:0000159 | protein phosphatase type 2A complex(GO:0000159) |
| 0.0 | 15.6 | GO:0005667 | transcription factor complex(GO:0005667) |
| 0.0 | 0.7 | GO:0030992 | intraciliary transport particle B(GO:0030992) |
| 0.0 | 0.1 | GO:0097123 | cyclin A1-CDK2 complex(GO:0097123) |
| 0.0 | 0.2 | GO:0070652 | HAUS complex(GO:0070652) |
| 0.0 | 0.1 | GO:0005682 | U5 snRNP(GO:0005682) |
| 0.0 | 0.5 | GO:0016514 | SWI/SNF complex(GO:0016514) |
| 0.0 | 0.6 | GO:0030687 | preribosome, large subunit precursor(GO:0030687) |
| 0.0 | 0.1 | GO:0033263 | CORVET complex(GO:0033263) |
| 0.0 | 0.8 | GO:1902493 | histone acetyltransferase complex(GO:0000123) protein acetyltransferase complex(GO:0031248) acetyltransferase complex(GO:1902493) |
| 0.0 | 0.2 | GO:0071437 | invadopodium(GO:0071437) |
Gene overrepresentation in molecular function category:
| Log-likelihood per target | Total log-likelihood | Term | Description |
|---|---|---|---|
| 12.1 | 36.2 | GO:0008859 | exoribonuclease II activity(GO:0008859) |
| 7.0 | 28.1 | GO:0033829 | O-fucosylpeptide 3-beta-N-acetylglucosaminyltransferase activity(GO:0033829) |
| 6.9 | 27.5 | GO:0004698 | calcium-dependent protein kinase C activity(GO:0004698) |
| 5.9 | 23.4 | GO:0031726 | CCR1 chemokine receptor binding(GO:0031726) |
| 5.4 | 16.3 | GO:0032090 | Pyrin domain binding(GO:0032090) |
| 4.9 | 34.1 | GO:0030369 | ICAM-3 receptor activity(GO:0030369) |
| 4.8 | 23.9 | GO:0034988 | Fc-gamma receptor I complex binding(GO:0034988) |
| 4.5 | 13.5 | GO:0033746 | histone demethylase activity (H3-R2 specific)(GO:0033746) histone demethylase activity (H4-R3 specific)(GO:0033749) |
| 4.4 | 241.4 | GO:0034987 | immunoglobulin receptor binding(GO:0034987) |
| 4.2 | 37.5 | GO:0043426 | MRF binding(GO:0043426) |
| 3.7 | 11.1 | GO:0008330 | protein tyrosine/threonine phosphatase activity(GO:0008330) |
| 3.5 | 14.1 | GO:0045127 | N-acetylglucosamine kinase activity(GO:0045127) |
| 3.5 | 14.0 | GO:0042132 | fructose 1,6-bisphosphate 1-phosphatase activity(GO:0042132) |
| 3.5 | 10.5 | GO:0033142 | progesterone receptor binding(GO:0033142) |
| 3.5 | 3.5 | GO:0008269 | JAK pathway signal transduction adaptor activity(GO:0008269) |
| 3.3 | 9.8 | GO:0032089 | NACHT domain binding(GO:0032089) |
| 3.1 | 43.6 | GO:0032395 | MHC class II receptor activity(GO:0032395) |
| 2.8 | 13.8 | GO:0004920 | interleukin-10 receptor activity(GO:0004920) |
| 2.7 | 16.0 | GO:0032038 | myosin II heavy chain binding(GO:0032038) |
| 2.6 | 10.4 | GO:1990430 | extracellular matrix protein binding(GO:1990430) |
| 2.6 | 7.8 | GO:0008321 | Ral guanyl-nucleotide exchange factor activity(GO:0008321) |
| 2.5 | 7.6 | GO:0061752 | telomeric repeat-containing RNA binding(GO:0061752) |
| 2.5 | 20.4 | GO:0070892 | lipoteichoic acid receptor activity(GO:0070892) |
| 2.4 | 7.3 | GO:0005011 | macrophage colony-stimulating factor receptor activity(GO:0005011) |
| 2.4 | 12.1 | GO:0043208 | glycosphingolipid binding(GO:0043208) |
| 2.4 | 9.4 | GO:0032184 | SUMO polymer binding(GO:0032184) |
| 2.3 | 11.5 | GO:0031691 | alpha-1A adrenergic receptor binding(GO:0031691) follicle-stimulating hormone receptor binding(GO:0031762) |
| 2.3 | 6.8 | GO:0004307 | ethanolaminephosphotransferase activity(GO:0004307) |
| 2.2 | 12.9 | GO:0004305 | ethanolamine kinase activity(GO:0004305) |
| 2.1 | 17.1 | GO:0019763 | immunoglobulin receptor activity(GO:0019763) |
| 2.1 | 12.7 | GO:0004046 | aminoacylase activity(GO:0004046) |
| 2.1 | 6.3 | GO:0004047 | aminomethyltransferase activity(GO:0004047) |
| 2.0 | 16.2 | GO:0016176 | superoxide-generating NADPH oxidase activator activity(GO:0016176) |
| 2.0 | 8.1 | GO:0016495 | C-X3-C chemokine receptor activity(GO:0016495) |
| 2.0 | 7.9 | GO:0004356 | glutamate-ammonia ligase activity(GO:0004356) ammonia ligase activity(GO:0016211) acid-ammonia (or amide) ligase activity(GO:0016880) |
| 2.0 | 25.7 | GO:0042608 | T cell receptor binding(GO:0042608) |
| 2.0 | 336.4 | GO:0003823 | antigen binding(GO:0003823) |
| 1.9 | 5.8 | GO:0016154 | thymidine phosphorylase activity(GO:0009032) pyrimidine-nucleoside phosphorylase activity(GO:0016154) |
| 1.9 | 5.7 | GO:0061697 | protein-malonyllysine demalonylase activity(GO:0036054) protein-succinyllysine desuccinylase activity(GO:0036055) protein-glutaryllysine deglutarylase activity(GO:0061697) |
| 1.9 | 5.6 | GO:0086059 | voltage-gated calcium channel activity involved SA node cell action potential(GO:0086059) |
| 1.9 | 35.3 | GO:0038191 | neuropilin binding(GO:0038191) |
| 1.8 | 16.1 | GO:0051575 | 5'-deoxyribose-5-phosphate lyase activity(GO:0051575) |
| 1.7 | 5.1 | GO:0004144 | diacylglycerol O-acyltransferase activity(GO:0004144) |
| 1.7 | 9.9 | GO:0005353 | fructose transmembrane transporter activity(GO:0005353) |
| 1.6 | 3.3 | GO:0035014 | phosphatidylinositol 3-kinase regulator activity(GO:0035014) 1-phosphatidylinositol-3-kinase regulator activity(GO:0046935) |
| 1.6 | 6.5 | GO:0017159 | pantetheine hydrolase activity(GO:0017159) |
| 1.6 | 8.1 | GO:0001010 | transcription factor activity, sequence-specific DNA binding transcription factor recruiting(GO:0001010) |
| 1.6 | 8.0 | GO:0070097 | delta-catenin binding(GO:0070097) |
| 1.6 | 4.8 | GO:0035575 | histone demethylase activity (H4-K20 specific)(GO:0035575) |
| 1.6 | 9.6 | GO:0004489 | methylenetetrahydrofolate reductase (NAD(P)H) activity(GO:0004489) |
| 1.6 | 9.4 | GO:0061665 | SUMO ligase activity(GO:0061665) |
| 1.6 | 9.4 | GO:0004699 | calcium-independent protein kinase C activity(GO:0004699) |
| 1.5 | 16.6 | GO:0051525 | NFAT protein binding(GO:0051525) |
| 1.5 | 12.0 | GO:0004645 | phosphorylase activity(GO:0004645) |
| 1.5 | 11.9 | GO:0005094 | Rho GDP-dissociation inhibitor activity(GO:0005094) |
| 1.5 | 5.9 | GO:0015222 | serotonin transmembrane transporter activity(GO:0015222) |
| 1.5 | 4.4 | GO:0008294 | calcium- and calmodulin-responsive adenylate cyclase activity(GO:0008294) |
| 1.5 | 5.8 | GO:0048248 | CXCR3 chemokine receptor binding(GO:0048248) |
| 1.5 | 4.4 | GO:0005260 | channel-conductance-controlling ATPase activity(GO:0005260) |
| 1.4 | 6.9 | GO:0086062 | voltage-gated sodium channel activity involved in Purkinje myocyte action potential(GO:0086062) |
| 1.4 | 9.6 | GO:0086089 | voltage-gated potassium channel activity involved in atrial cardiac muscle cell action potential repolarization(GO:0086089) |
| 1.3 | 8.1 | GO:0031735 | CCR10 chemokine receptor binding(GO:0031735) |
| 1.3 | 4.0 | GO:0070119 | ciliary neurotrophic factor binding(GO:0070119) |
| 1.3 | 5.2 | GO:0015207 | ATP:ADP antiporter activity(GO:0005471) adenine transmembrane transporter activity(GO:0015207) |
| 1.3 | 3.9 | GO:0004874 | aryl hydrocarbon receptor activity(GO:0004874) |
| 1.3 | 5.2 | GO:0035473 | lipase binding(GO:0035473) |
| 1.3 | 5.2 | GO:0061769 | ribosylnicotinamide kinase activity(GO:0050262) ribosylnicotinate kinase activity(GO:0061769) |
| 1.3 | 6.4 | GO:0097603 | temperature-gated ion channel activity(GO:0097603) |
| 1.3 | 5.1 | GO:0052594 | tryptamine:oxygen oxidoreductase (deaminating) activity(GO:0052593) aminoacetone:oxygen oxidoreductase(deaminating) activity(GO:0052594) aliphatic-amine oxidase activity(GO:0052595) phenethylamine:oxygen oxidoreductase (deaminating) activity(GO:0052596) |
| 1.3 | 5.1 | GO:0004741 | [pyruvate dehydrogenase (lipoamide)] phosphatase activity(GO:0004741) |
| 1.3 | 8.9 | GO:0003828 | alpha-N-acetylneuraminate alpha-2,8-sialyltransferase activity(GO:0003828) |
| 1.2 | 6.2 | GO:0004464 | leukotriene-C4 synthase activity(GO:0004464) |
| 1.2 | 15.9 | GO:0070324 | thyroid hormone binding(GO:0070324) |
| 1.2 | 8.4 | GO:0030368 | interleukin-17 receptor activity(GO:0030368) |
| 1.2 | 2.4 | GO:0015440 | peptide-transporting ATPase activity(GO:0015440) |
| 1.2 | 19.9 | GO:0016594 | glycine binding(GO:0016594) |
| 1.2 | 12.8 | GO:0001135 | transcription factor activity, RNA polymerase II transcription factor recruiting(GO:0001135) |
| 1.2 | 7.0 | GO:0016416 | O-palmitoyltransferase activity(GO:0016416) |
| 1.2 | 3.5 | GO:0004782 | sulfinoalanine decarboxylase activity(GO:0004782) |
| 1.1 | 13.7 | GO:0015174 | basic amino acid transmembrane transporter activity(GO:0015174) |
| 1.1 | 9.0 | GO:0004111 | creatine kinase activity(GO:0004111) |
| 1.1 | 4.5 | GO:0016314 | phosphatidylinositol-3,4,5-trisphosphate 3-phosphatase activity(GO:0016314) |
| 1.1 | 2.2 | GO:0000822 | inositol hexakisphosphate binding(GO:0000822) |
| 1.1 | 10.1 | GO:0004565 | beta-galactosidase activity(GO:0004565) |
| 1.1 | 3.3 | GO:0019959 | interleukin-8 binding(GO:0019959) |
| 1.1 | 4.4 | GO:0003875 | ADP-ribosylarginine hydrolase activity(GO:0003875) |
| 1.1 | 11.7 | GO:0035381 | extracellular ATP-gated cation channel activity(GO:0004931) ATP-gated ion channel activity(GO:0035381) |
| 1.1 | 14.8 | GO:0004559 | alpha-mannosidase activity(GO:0004559) |
| 1.1 | 3.2 | GO:0004938 | alpha2-adrenergic receptor activity(GO:0004938) |
| 1.0 | 3.1 | GO:0070290 | N-acylphosphatidylethanolamine-specific phospholipase D activity(GO:0070290) |
| 1.0 | 11.5 | GO:0008429 | phosphatidylethanolamine binding(GO:0008429) |
| 1.0 | 4.1 | GO:0050119 | N-acetylglucosamine deacetylase activity(GO:0050119) |
| 1.0 | 6.2 | GO:0004359 | glutaminase activity(GO:0004359) |
| 1.0 | 4.1 | GO:0015254 | glycerol channel activity(GO:0015254) |
| 1.0 | 5.0 | GO:0030348 | syntaxin-3 binding(GO:0030348) |
| 1.0 | 4.8 | GO:0004995 | tachykinin receptor activity(GO:0004995) |
| 1.0 | 3.9 | GO:0003827 | alpha-1,3-mannosylglycoprotein 2-beta-N-acetylglucosaminyltransferase activity(GO:0003827) |
| 0.9 | 4.7 | GO:0042903 | tubulin deacetylase activity(GO:0042903) |
| 0.9 | 2.8 | GO:0004430 | 1-phosphatidylinositol 4-kinase activity(GO:0004430) |
| 0.9 | 5.5 | GO:0008853 | exodeoxyribonuclease III activity(GO:0008853) |
| 0.9 | 26.7 | GO:0005388 | calcium-transporting ATPase activity(GO:0005388) |
| 0.9 | 2.7 | GO:0017098 | sulfonylurea receptor binding(GO:0017098) |
| 0.9 | 4.5 | GO:0004591 | oxoglutarate dehydrogenase (succinyl-transferring) activity(GO:0004591) |
| 0.9 | 2.6 | GO:0030343 | vitamin D3 25-hydroxylase activity(GO:0030343) vitamin D 25-hydroxylase activity(GO:0070643) |
| 0.9 | 4.3 | GO:0004999 | vasoactive intestinal polypeptide receptor activity(GO:0004999) |
| 0.8 | 5.9 | GO:0015252 | hydrogen ion channel activity(GO:0015252) |
| 0.8 | 4.2 | GO:0004694 | eukaryotic translation initiation factor 2alpha kinase activity(GO:0004694) |
| 0.8 | 3.3 | GO:0022850 | serotonin-gated cation channel activity(GO:0022850) |
| 0.8 | 24.1 | GO:0005035 | tumor necrosis factor-activated receptor activity(GO:0005031) death receptor activity(GO:0005035) |
| 0.8 | 5.8 | GO:0001515 | opioid peptide activity(GO:0001515) |
| 0.8 | 5.8 | GO:0042799 | histone methyltransferase activity (H4-K20 specific)(GO:0042799) |
| 0.8 | 1.6 | GO:0043813 | phosphatidylinositol-3,5-bisphosphate 5-phosphatase activity(GO:0043813) |
| 0.8 | 9.0 | GO:0051864 | histone demethylase activity (H3-K36 specific)(GO:0051864) |
| 0.8 | 8.2 | GO:0016286 | small conductance calcium-activated potassium channel activity(GO:0016286) |
| 0.8 | 50.3 | GO:0001102 | RNA polymerase II activating transcription factor binding(GO:0001102) |
| 0.8 | 8.1 | GO:0016721 | superoxide dismutase activity(GO:0004784) oxidoreductase activity, acting on superoxide radicals as acceptor(GO:0016721) |
| 0.8 | 3.1 | GO:0004341 | gluconolactonase activity(GO:0004341) |
| 0.8 | 8.6 | GO:0004523 | RNA-DNA hybrid ribonuclease activity(GO:0004523) |
| 0.8 | 3.9 | GO:0031871 | proteinase activated receptor binding(GO:0031871) |
| 0.8 | 3.1 | GO:0004802 | transketolase activity(GO:0004802) |
| 0.8 | 2.3 | GO:0035241 | protein-arginine omega-N monomethyltransferase activity(GO:0035241) |
| 0.8 | 2.3 | GO:0052810 | 1-phosphatidylinositol-5-kinase activity(GO:0052810) |
| 0.8 | 3.9 | GO:0010861 | thyroid hormone receptor activator activity(GO:0010861) thyroid hormone receptor coactivator activity(GO:0030375) |
| 0.8 | 4.5 | GO:0031708 | endothelin B receptor binding(GO:0031708) |
| 0.8 | 2.3 | GO:0070326 | very-low-density lipoprotein particle receptor binding(GO:0070326) |
| 0.8 | 3.0 | GO:0004077 | biotin-[acetyl-CoA-carboxylase] ligase activity(GO:0004077) biotin-[methylcrotonoyl-CoA-carboxylase] ligase activity(GO:0004078) biotin-[methylmalonyl-CoA-carboxytransferase] ligase activity(GO:0004079) biotin-[propionyl-CoA-carboxylase (ATP-hydrolyzing)] ligase activity(GO:0004080) biotin-protein ligase activity(GO:0018271) |
| 0.7 | 5.2 | GO:0050291 | sphingosine N-acyltransferase activity(GO:0050291) |
| 0.7 | 6.6 | GO:0043533 | inositol 1,3,4,5 tetrakisphosphate binding(GO:0043533) |
| 0.7 | 9.5 | GO:0003906 | DNA-(apurinic or apyrimidinic site) lyase activity(GO:0003906) |
| 0.7 | 41.6 | GO:0001784 | phosphotyrosine binding(GO:0001784) |
| 0.7 | 20.3 | GO:0051959 | dynein light intermediate chain binding(GO:0051959) |
| 0.7 | 6.5 | GO:0001609 | G-protein coupled adenosine receptor activity(GO:0001609) |
| 0.7 | 6.5 | GO:0005114 | type II transforming growth factor beta receptor binding(GO:0005114) |
| 0.7 | 3.6 | GO:0008889 | glycerophosphodiester phosphodiesterase activity(GO:0008889) |
| 0.7 | 2.1 | GO:0035663 | Toll-like receptor 2 binding(GO:0035663) |
| 0.7 | 2.8 | GO:0003680 | AT DNA binding(GO:0003680) |
| 0.7 | 8.5 | GO:0004875 | complement receptor activity(GO:0004875) |
| 0.7 | 8.4 | GO:0004887 | thyroid hormone receptor activity(GO:0004887) |
| 0.7 | 2.0 | GO:0005345 | purine nucleobase transmembrane transporter activity(GO:0005345) pyrimidine nucleobase transmembrane transporter activity(GO:0005350) pyrimidine- and adenine-specific:sodium symporter activity(GO:0015389) |
| 0.7 | 9.5 | GO:0031014 | troponin T binding(GO:0031014) |
| 0.7 | 5.4 | GO:0009008 | DNA-methyltransferase activity(GO:0009008) |
| 0.7 | 2.7 | GO:0030172 | troponin C binding(GO:0030172) |
| 0.7 | 4.7 | GO:0004983 | neuropeptide Y receptor activity(GO:0004983) |
| 0.7 | 9.2 | GO:0086008 | voltage-gated potassium channel activity involved in cardiac muscle cell action potential repolarization(GO:0086008) |
| 0.7 | 17.7 | GO:0032794 | GTPase activating protein binding(GO:0032794) |
| 0.6 | 5.2 | GO:0008430 | selenium binding(GO:0008430) |
| 0.6 | 7.1 | GO:0036310 | annealing helicase activity(GO:0036310) |
| 0.6 | 2.6 | GO:0070546 | cysteine-S-conjugate beta-lyase activity(GO:0047804) L-phenylalanine aminotransferase activity(GO:0070546) |
| 0.6 | 1.9 | GO:0052811 | 1-phosphatidylinositol-5-phosphate 4-kinase activity(GO:0016309) 1-phosphatidylinositol-3-phosphate 4-kinase activity(GO:0052811) |
| 0.6 | 5.7 | GO:0019158 | glucokinase activity(GO:0004340) hexokinase activity(GO:0004396) fructokinase activity(GO:0008865) mannokinase activity(GO:0019158) |
| 0.6 | 7.6 | GO:0015250 | water channel activity(GO:0015250) |
| 0.6 | 1.3 | GO:0015187 | glycine transmembrane transporter activity(GO:0015187) |
| 0.6 | 2.5 | GO:0005163 | nerve growth factor receptor binding(GO:0005163) |
| 0.6 | 2.5 | GO:0035033 | histone deacetylase regulator activity(GO:0035033) |
| 0.6 | 3.7 | GO:0004740 | pyruvate dehydrogenase (acetyl-transferring) kinase activity(GO:0004740) |
| 0.6 | 13.0 | GO:0004185 | serine-type carboxypeptidase activity(GO:0004185) |
| 0.6 | 3.1 | GO:0070740 | tubulin-glutamic acid ligase activity(GO:0070740) |
| 0.6 | 1.8 | GO:0001069 | regulatory region RNA binding(GO:0001069) |
| 0.6 | 10.3 | GO:0004143 | diacylglycerol kinase activity(GO:0004143) |
| 0.6 | 1.8 | GO:0052739 | phosphatidylserine 1-acylhydrolase activity(GO:0052739) |
| 0.6 | 6.5 | GO:0035612 | AP-2 adaptor complex binding(GO:0035612) |
| 0.6 | 5.3 | GO:0046920 | alpha-(1->3)-fucosyltransferase activity(GO:0046920) |
| 0.6 | 1.8 | GO:1904455 | ubiquitin-specific protease activity involved in negative regulation of ERAD pathway(GO:1904455) |
| 0.6 | 6.5 | GO:0003951 | NAD+ kinase activity(GO:0003951) |
| 0.6 | 5.3 | GO:0046974 | histone methyltransferase activity (H3-K9 specific)(GO:0046974) |
| 0.6 | 3.5 | GO:0008420 | CTD phosphatase activity(GO:0008420) |
| 0.6 | 2.3 | GO:0019828 | aspartic-type endopeptidase inhibitor activity(GO:0019828) |
| 0.6 | 5.1 | GO:0035174 | histone serine kinase activity(GO:0035174) |
| 0.6 | 7.9 | GO:0008140 | cAMP response element binding protein binding(GO:0008140) |
| 0.6 | 2.3 | GO:0000182 | rDNA binding(GO:0000182) |
| 0.6 | 2.8 | GO:0047844 | deoxycytidine deaminase activity(GO:0047844) |
| 0.6 | 1.7 | GO:0016784 | 3-mercaptopyruvate sulfurtransferase activity(GO:0016784) |
| 0.6 | 6.1 | GO:0008061 | chitinase activity(GO:0004568) chitin binding(GO:0008061) |
| 0.6 | 5.0 | GO:0034711 | inhibin binding(GO:0034711) |
| 0.5 | 1.6 | GO:0030158 | protein xylosyltransferase activity(GO:0030158) |
| 0.5 | 7.0 | GO:0043522 | leucine zipper domain binding(GO:0043522) |
| 0.5 | 11.8 | GO:0046965 | retinoid X receptor binding(GO:0046965) |
| 0.5 | 3.7 | GO:0019788 | NEDD8 transferase activity(GO:0019788) |
| 0.5 | 5.3 | GO:0032027 | myosin light chain binding(GO:0032027) |
| 0.5 | 2.6 | GO:0004800 | thyroxine 5'-deiodinase activity(GO:0004800) |
| 0.5 | 2.6 | GO:0036033 | mediator complex binding(GO:0036033) |
| 0.5 | 6.3 | GO:0070700 | BMP receptor binding(GO:0070700) |
| 0.5 | 4.2 | GO:0031811 | G-protein coupled nucleotide receptor binding(GO:0031811) P2Y1 nucleotide receptor binding(GO:0031812) |
| 0.5 | 2.6 | GO:0047374 | sterol esterase activity(GO:0004771) methylumbelliferyl-acetate deacetylase activity(GO:0047374) |
| 0.5 | 2.1 | GO:0000995 | transcription factor activity, core RNA polymerase III binding(GO:0000995) transcription factor activity, RNA polymerase III transcription factor binding(GO:0001007) |
| 0.5 | 17.7 | GO:0071889 | 14-3-3 protein binding(GO:0071889) |
| 0.5 | 2.0 | GO:0004706 | JUN kinase kinase kinase activity(GO:0004706) |
| 0.5 | 2.5 | GO:0004666 | prostaglandin-endoperoxide synthase activity(GO:0004666) |
| 0.5 | 2.0 | GO:0071532 | ankyrin repeat binding(GO:0071532) |
| 0.5 | 2.0 | GO:0003910 | DNA ligase (ATP) activity(GO:0003910) |
| 0.5 | 2.0 | GO:0001632 | leukotriene B4 receptor activity(GO:0001632) |
| 0.5 | 2.9 | GO:0017040 | ceramidase activity(GO:0017040) |
| 0.5 | 7.7 | GO:0016849 | phosphorus-oxygen lyase activity(GO:0016849) |
| 0.5 | 1.4 | GO:0017153 | sodium:dicarboxylate symporter activity(GO:0017153) |
| 0.5 | 1.9 | GO:0004905 | type I interferon receptor activity(GO:0004905) |
| 0.5 | 3.8 | GO:0031685 | adenosine receptor binding(GO:0031685) |
| 0.5 | 2.4 | GO:0004994 | somatostatin receptor activity(GO:0004994) |
| 0.5 | 10.0 | GO:0099604 | calcium-release channel activity(GO:0015278) ligand-gated calcium channel activity(GO:0099604) |
| 0.5 | 1.9 | GO:0071558 | histone demethylase activity (H3-K27 specific)(GO:0071558) |
| 0.5 | 7.0 | GO:0005344 | oxygen transporter activity(GO:0005344) |
| 0.5 | 10.3 | GO:0005095 | GTPase inhibitor activity(GO:0005095) |
| 0.5 | 4.2 | GO:0048495 | Roundabout binding(GO:0048495) |
| 0.5 | 2.8 | GO:0010997 | anaphase-promoting complex binding(GO:0010997) |
| 0.5 | 5.0 | GO:0051378 | amine binding(GO:0043176) serotonin binding(GO:0051378) |
| 0.5 | 11.0 | GO:0043325 | phosphatidylinositol-3,4-bisphosphate binding(GO:0043325) |
| 0.5 | 1.4 | GO:0042019 | interleukin-23 binding(GO:0042019) interleukin-23 receptor activity(GO:0042020) |
| 0.5 | 2.3 | GO:0031711 | tripeptidyl-peptidase activity(GO:0008240) peptidyl-dipeptidase activity(GO:0008241) bradykinin receptor binding(GO:0031711) metallodipeptidase activity(GO:0070573) |
| 0.5 | 7.3 | GO:0005523 | tropomyosin binding(GO:0005523) |
| 0.5 | 5.9 | GO:0005131 | growth hormone receptor binding(GO:0005131) |
| 0.5 | 5.0 | GO:0070915 | lysophosphatidic acid receptor activity(GO:0070915) |
| 0.4 | 4.0 | GO:0004767 | sphingomyelin phosphodiesterase activity(GO:0004767) |
| 0.4 | 3.1 | GO:0050693 | LBD domain binding(GO:0050693) |
| 0.4 | 2.2 | GO:0022897 | peptide:proton symporter activity(GO:0015333) proton-dependent peptide secondary active transmembrane transporter activity(GO:0022897) |
| 0.4 | 11.7 | GO:0004435 | phosphatidylinositol phospholipase C activity(GO:0004435) |
| 0.4 | 1.3 | GO:0097677 | STAT family protein binding(GO:0097677) |
| 0.4 | 11.6 | GO:0004012 | phospholipid-translocating ATPase activity(GO:0004012) |
| 0.4 | 1.7 | GO:0042954 | lipoprotein transporter activity(GO:0042954) |
| 0.4 | 1.7 | GO:0004668 | protein-arginine deiminase activity(GO:0004668) |
| 0.4 | 4.2 | GO:0015385 | sodium:proton antiporter activity(GO:0015385) potassium:proton antiporter activity(GO:0015386) |
| 0.4 | 6.7 | GO:0080025 | phosphatidylinositol-3,5-bisphosphate binding(GO:0080025) |
| 0.4 | 6.3 | GO:1990380 | Lys48-specific deubiquitinase activity(GO:1990380) |
| 0.4 | 2.1 | GO:0043183 | vascular endothelial growth factor receptor 1 binding(GO:0043183) |
| 0.4 | 0.8 | GO:0004792 | thiosulfate sulfurtransferase activity(GO:0004792) |
| 0.4 | 7.4 | GO:0005112 | Notch binding(GO:0005112) |
| 0.4 | 2.8 | GO:0098988 | adenylate cyclase inhibiting G-protein coupled glutamate receptor activity(GO:0001640) G-protein coupled glutamate receptor activity(GO:0098988) |
| 0.4 | 5.7 | GO:0030284 | estrogen receptor activity(GO:0030284) |
| 0.4 | 8.0 | GO:0050786 | RAGE receptor binding(GO:0050786) |
| 0.4 | 13.6 | GO:0017147 | Wnt-protein binding(GO:0017147) |
| 0.4 | 27.0 | GO:0043621 | protein self-association(GO:0043621) |
| 0.4 | 1.2 | GO:0022858 | L-alanine transmembrane transporter activity(GO:0015180) alanine transmembrane transporter activity(GO:0022858) |
| 0.4 | 5.5 | GO:0009931 | calcium-dependent protein serine/threonine kinase activity(GO:0009931) |
| 0.4 | 4.7 | GO:0015271 | outward rectifier potassium channel activity(GO:0015271) |
| 0.4 | 3.1 | GO:0044323 | retinoic acid-responsive element binding(GO:0044323) |
| 0.4 | 1.9 | GO:0030197 | extracellular matrix constituent, lubricant activity(GO:0030197) |
| 0.4 | 1.9 | GO:0008048 | calcium sensitive guanylate cyclase activator activity(GO:0008048) |
| 0.4 | 1.5 | GO:0016019 | peptidoglycan receptor activity(GO:0016019) |
| 0.4 | 15.7 | GO:0015026 | coreceptor activity(GO:0015026) |
| 0.4 | 4.1 | GO:0003964 | telomerase activity(GO:0003720) RNA-directed DNA polymerase activity(GO:0003964) |
| 0.4 | 6.0 | GO:0005041 | low-density lipoprotein receptor activity(GO:0005041) |
| 0.4 | 2.2 | GO:0046625 | sphingolipid binding(GO:0046625) |
| 0.4 | 2.2 | GO:0042392 | sphingosine-1-phosphate phosphatase activity(GO:0042392) |
| 0.4 | 1.1 | GO:0016534 | cyclin-dependent protein kinase 5 activator activity(GO:0016534) |
| 0.4 | 1.8 | GO:0005237 | inhibitory extracellular ligand-gated ion channel activity(GO:0005237) |
| 0.4 | 3.3 | GO:0030020 | extracellular matrix structural constituent conferring tensile strength(GO:0030020) |
| 0.4 | 2.2 | GO:0039552 | RIG-I binding(GO:0039552) |
| 0.4 | 2.5 | GO:0008454 | alpha-1,3-mannosylglycoprotein 4-beta-N-acetylglucosaminyltransferase activity(GO:0008454) |
| 0.4 | 11.2 | GO:0005086 | ARF guanyl-nucleotide exchange factor activity(GO:0005086) |
| 0.4 | 1.1 | GO:0016422 | mRNA (2'-O-methyladenosine-N6-)-methyltransferase activity(GO:0016422) |
| 0.4 | 9.1 | GO:0042166 | acetylcholine binding(GO:0042166) |
| 0.4 | 11.6 | GO:0015301 | anion:anion antiporter activity(GO:0015301) |
| 0.4 | 1.1 | GO:0034056 | estrogen response element binding(GO:0034056) |
| 0.3 | 7.3 | GO:0005247 | voltage-gated chloride channel activity(GO:0005247) |
| 0.3 | 1.4 | GO:0002046 | opsin binding(GO:0002046) |
| 0.3 | 4.8 | GO:0042800 | histone methyltransferase activity (H3-K4 specific)(GO:0042800) |
| 0.3 | 1.0 | GO:0004772 | sterol O-acyltransferase activity(GO:0004772) cholesterol O-acyltransferase activity(GO:0034736) |
| 0.3 | 1.7 | GO:0046975 | histone methyltransferase activity (H3-K36 specific)(GO:0046975) |
| 0.3 | 4.1 | GO:0019911 | structural constituent of myelin sheath(GO:0019911) |
| 0.3 | 1.4 | GO:0004306 | ethanolamine-phosphate cytidylyltransferase activity(GO:0004306) |
| 0.3 | 2.4 | GO:0017002 | activin-activated receptor activity(GO:0017002) |
| 0.3 | 11.5 | GO:0005326 | neurotransmitter transporter activity(GO:0005326) |
| 0.3 | 76.0 | GO:0004252 | serine-type endopeptidase activity(GO:0004252) |
| 0.3 | 4.7 | GO:0031419 | cobalamin binding(GO:0031419) |
| 0.3 | 2.0 | GO:0016402 | pristanoyl-CoA oxidase activity(GO:0016402) |
| 0.3 | 1.7 | GO:0004126 | cytidine deaminase activity(GO:0004126) |
| 0.3 | 1.0 | GO:0008480 | sarcosine dehydrogenase activity(GO:0008480) oxidoreductase activity, acting on the CH-NH group of donors, flavin as acceptor(GO:0046997) |
| 0.3 | 3.9 | GO:0030280 | structural constituent of epidermis(GO:0030280) |
| 0.3 | 1.3 | GO:0016230 | sphingomyelin phosphodiesterase activator activity(GO:0016230) |
| 0.3 | 1.6 | GO:0035326 | enhancer binding(GO:0035326) |
| 0.3 | 2.3 | GO:0008440 | inositol-1,4,5-trisphosphate 3-kinase activity(GO:0008440) |
| 0.3 | 6.8 | GO:0031210 | phosphatidylcholine binding(GO:0031210) |
| 0.3 | 1.6 | GO:0001594 | trace-amine receptor activity(GO:0001594) |
| 0.3 | 6.4 | GO:0017127 | cholesterol transporter activity(GO:0017127) |
| 0.3 | 3.2 | GO:0004321 | fatty-acyl-CoA synthase activity(GO:0004321) |
| 0.3 | 2.2 | GO:0004499 | N,N-dimethylaniline monooxygenase activity(GO:0004499) |
| 0.3 | 10.3 | GO:0003950 | NAD+ ADP-ribosyltransferase activity(GO:0003950) |
| 0.3 | 3.4 | GO:0016861 | intramolecular oxidoreductase activity, interconverting aldoses and ketoses(GO:0016861) |
| 0.3 | 4.4 | GO:0015379 | potassium:chloride symporter activity(GO:0015379) potassium ion symporter activity(GO:0022820) |
| 0.3 | 1.5 | GO:0070180 | large ribosomal subunit rRNA binding(GO:0070180) |
| 0.3 | 1.8 | GO:0045134 | uridine-diphosphatase activity(GO:0045134) |
| 0.3 | 9.6 | GO:0033613 | activating transcription factor binding(GO:0033613) |
| 0.3 | 3.9 | GO:0042809 | vitamin D receptor binding(GO:0042809) |
| 0.3 | 2.4 | GO:0052833 | inositol monophosphate 1-phosphatase activity(GO:0008934) inositol monophosphate 3-phosphatase activity(GO:0052832) inositol monophosphate 4-phosphatase activity(GO:0052833) inositol monophosphate phosphatase activity(GO:0052834) |
| 0.3 | 3.6 | GO:0008020 | G-protein coupled photoreceptor activity(GO:0008020) |
| 0.3 | 10.9 | GO:0017091 | AU-rich element binding(GO:0017091) |
| 0.3 | 5.3 | GO:0004089 | carbonate dehydratase activity(GO:0004089) |
| 0.3 | 2.6 | GO:0004117 | calmodulin-dependent cyclic-nucleotide phosphodiesterase activity(GO:0004117) |
| 0.3 | 6.6 | GO:0019865 | immunoglobulin binding(GO:0019865) |
| 0.3 | 8.3 | GO:0004180 | carboxypeptidase activity(GO:0004180) |
| 0.3 | 2.3 | GO:0004996 | thyroid-stimulating hormone receptor activity(GO:0004996) |
| 0.3 | 5.7 | GO:0015037 | peptide disulfide oxidoreductase activity(GO:0015037) |
| 0.3 | 1.1 | GO:0043184 | vascular endothelial growth factor receptor 2 binding(GO:0043184) |
| 0.3 | 13.1 | GO:0005164 | tumor necrosis factor receptor binding(GO:0005164) |
| 0.3 | 2.4 | GO:0099583 | neurotransmitter receptor activity involved in regulation of postsynaptic cytosolic calcium ion concentration(GO:0099583) |
| 0.3 | 2.4 | GO:0004727 | prenylated protein tyrosine phosphatase activity(GO:0004727) |
| 0.3 | 2.4 | GO:0097322 | 7SK snRNA binding(GO:0097322) |
| 0.3 | 2.1 | GO:0030618 | transforming growth factor beta receptor, pathway-specific cytoplasmic mediator activity(GO:0030618) |
| 0.3 | 1.1 | GO:0005324 | long-chain fatty acid transporter activity(GO:0005324) |
| 0.3 | 12.5 | GO:0001205 | transcriptional activator activity, RNA polymerase II distal enhancer sequence-specific binding(GO:0001205) |
| 0.3 | 0.8 | GO:0008332 | low voltage-gated calcium channel activity(GO:0008332) |
| 0.3 | 1.0 | GO:0048403 | brain-derived neurotrophic factor binding(GO:0048403) |
| 0.3 | 3.3 | GO:0032266 | phosphatidylinositol-3-phosphate binding(GO:0032266) |
| 0.3 | 4.1 | GO:0048156 | tau protein binding(GO:0048156) |
| 0.3 | 6.0 | GO:0043014 | alpha-tubulin binding(GO:0043014) |
| 0.2 | 0.7 | GO:0052796 | exo-alpha-sialidase activity(GO:0004308) alpha-sialidase activity(GO:0016997) exo-alpha-(2->3)-sialidase activity(GO:0052794) exo-alpha-(2->6)-sialidase activity(GO:0052795) exo-alpha-(2->8)-sialidase activity(GO:0052796) |
| 0.2 | 1.0 | GO:0004909 | interleukin-1, Type I, activating receptor activity(GO:0004909) |
| 0.2 | 1.5 | GO:0016929 | SUMO-specific protease activity(GO:0016929) |
| 0.2 | 0.7 | GO:0010521 | telomerase inhibitor activity(GO:0010521) |
| 0.2 | 1.0 | GO:0035402 | histone kinase activity (H3-T11 specific)(GO:0035402) |
| 0.2 | 1.2 | GO:0004910 | interleukin-1, Type II, blocking receptor activity(GO:0004910) |
| 0.2 | 2.9 | GO:0004065 | arylsulfatase activity(GO:0004065) |
| 0.2 | 2.1 | GO:0015279 | store-operated calcium channel activity(GO:0015279) |
| 0.2 | 1.2 | GO:0044547 | DNA topoisomerase binding(GO:0044547) |
| 0.2 | 2.1 | GO:0010385 | double-stranded methylated DNA binding(GO:0010385) |
| 0.2 | 3.1 | GO:0004716 | receptor signaling protein tyrosine kinase activity(GO:0004716) |
| 0.2 | 1.9 | GO:0004865 | protein serine/threonine phosphatase inhibitor activity(GO:0004865) |
| 0.2 | 0.9 | GO:0047685 | amine sulfotransferase activity(GO:0047685) |
| 0.2 | 3.2 | GO:0030247 | pattern binding(GO:0001871) polysaccharide binding(GO:0030247) |
| 0.2 | 0.7 | GO:0008900 | hydrogen:potassium-exchanging ATPase activity(GO:0008900) |
| 0.2 | 0.7 | GO:0009378 | four-way junction helicase activity(GO:0009378) |
| 0.2 | 2.9 | GO:0036374 | glutathione hydrolase activity(GO:0036374) |
| 0.2 | 9.2 | GO:0017112 | Rab guanyl-nucleotide exchange factor activity(GO:0017112) |
| 0.2 | 1.8 | GO:0004024 | alcohol dehydrogenase activity, zinc-dependent(GO:0004024) |
| 0.2 | 8.9 | GO:0004115 | 3',5'-cyclic-AMP phosphodiesterase activity(GO:0004115) |
| 0.2 | 0.9 | GO:0052591 | sn-glycerol-3-phosphate:ubiquinone oxidoreductase activity(GO:0052590) sn-glycerol-3-phosphate:ubiquinone-8 oxidoreductase activity(GO:0052591) |
| 0.2 | 75.2 | GO:0005096 | GTPase activator activity(GO:0005096) |
| 0.2 | 1.1 | GO:0008381 | mechanically-gated ion channel activity(GO:0008381) mechanically gated channel activity(GO:0022833) |
| 0.2 | 1.5 | GO:0050294 | steroid sulfotransferase activity(GO:0050294) |
| 0.2 | 0.9 | GO:0008281 | sulfonylurea receptor activity(GO:0008281) |
| 0.2 | 2.2 | GO:0047498 | calcium-dependent phospholipase A2 activity(GO:0047498) |
| 0.2 | 1.3 | GO:0004839 | ubiquitin activating enzyme activity(GO:0004839) |
| 0.2 | 2.1 | GO:0019957 | C-C chemokine binding(GO:0019957) |
| 0.2 | 3.3 | GO:0005149 | interleukin-1 receptor binding(GO:0005149) |
| 0.2 | 0.4 | GO:0002060 | purine nucleobase binding(GO:0002060) |
| 0.2 | 2.7 | GO:0005078 | MAP-kinase scaffold activity(GO:0005078) |
| 0.2 | 0.8 | GO:0019797 | procollagen-proline 3-dioxygenase activity(GO:0019797) |
| 0.2 | 5.9 | GO:0008395 | steroid hydroxylase activity(GO:0008395) |
| 0.2 | 1.1 | GO:0005315 | inorganic phosphate transmembrane transporter activity(GO:0005315) |
| 0.2 | 2.2 | GO:0005375 | copper ion transmembrane transporter activity(GO:0005375) |
| 0.2 | 1.1 | GO:0005025 | transforming growth factor beta receptor activity, type I(GO:0005025) |
| 0.2 | 1.1 | GO:0047696 | beta-adrenergic receptor kinase activity(GO:0047696) |
| 0.2 | 1.8 | GO:0017110 | nucleoside-diphosphatase activity(GO:0017110) |
| 0.2 | 0.7 | GO:0098770 | FBXO family protein binding(GO:0098770) |
| 0.2 | 10.2 | GO:0004712 | protein serine/threonine/tyrosine kinase activity(GO:0004712) |
| 0.2 | 4.5 | GO:0008066 | glutamate receptor activity(GO:0008066) |
| 0.2 | 1.6 | GO:0047623 | AMP deaminase activity(GO:0003876) adenosine-phosphate deaminase activity(GO:0047623) |
| 0.2 | 1.2 | GO:0008510 | sodium:bicarbonate symporter activity(GO:0008510) |
| 0.2 | 1.7 | GO:0050700 | CARD domain binding(GO:0050700) |
| 0.2 | 1.2 | GO:0004873 | asialoglycoprotein receptor activity(GO:0004873) |
| 0.2 | 0.5 | GO:0004582 | dolichyl-phosphate beta-D-mannosyltransferase activity(GO:0004582) |
| 0.2 | 1.7 | GO:0035005 | 1-phosphatidylinositol-4-phosphate 3-kinase activity(GO:0035005) |
| 0.2 | 14.1 | GO:0005201 | extracellular matrix structural constituent(GO:0005201) |
| 0.2 | 1.0 | GO:0004035 | alkaline phosphatase activity(GO:0004035) |
| 0.2 | 0.3 | GO:0015205 | nucleobase transmembrane transporter activity(GO:0015205) |
| 0.2 | 2.7 | GO:0015095 | magnesium ion transmembrane transporter activity(GO:0015095) |
| 0.2 | 1.1 | GO:1903763 | gap junction channel activity involved in cell communication by electrical coupling(GO:1903763) |
| 0.2 | 0.5 | GO:0015016 | [heparan sulfate]-glucosamine N-sulfotransferase activity(GO:0015016) |
| 0.2 | 15.5 | GO:0004222 | metalloendopeptidase activity(GO:0004222) |
| 0.2 | 1.9 | GO:0032036 | myosin heavy chain binding(GO:0032036) |
| 0.2 | 0.8 | GO:0043995 | histone acetyltransferase activity (H4-K5 specific)(GO:0043995) histone acetyltransferase activity (H4-K8 specific)(GO:0043996) histone acetyltransferase activity (H4-K16 specific)(GO:0046972) |
| 0.2 | 4.6 | GO:0004709 | MAP kinase kinase kinase activity(GO:0004709) |
| 0.2 | 8.6 | GO:0017022 | myosin binding(GO:0017022) |
| 0.2 | 1.5 | GO:0016175 | superoxide-generating NADPH oxidase activity(GO:0016175) |
| 0.2 | 3.6 | GO:0008093 | cytoskeletal adaptor activity(GO:0008093) |
| 0.1 | 0.7 | GO:0051373 | FATZ binding(GO:0051373) |
| 0.1 | 0.4 | GO:0004963 | follicle-stimulating hormone receptor activity(GO:0004963) |
| 0.1 | 2.9 | GO:0018024 | histone-lysine N-methyltransferase activity(GO:0018024) |
| 0.1 | 0.4 | GO:0033878 | hormone-sensitive lipase activity(GO:0033878) |
| 0.1 | 2.0 | GO:0000979 | RNA polymerase II core promoter sequence-specific DNA binding(GO:0000979) |
| 0.1 | 0.7 | GO:0039706 | co-receptor binding(GO:0039706) |
| 0.1 | 0.7 | GO:0018479 | benzaldehyde dehydrogenase (NAD+) activity(GO:0018479) |
| 0.1 | 4.2 | GO:0000993 | RNA polymerase II core binding(GO:0000993) |
| 0.1 | 7.6 | GO:0019213 | deacetylase activity(GO:0019213) |
| 0.1 | 1.4 | GO:0045236 | CXCR chemokine receptor binding(GO:0045236) |
| 0.1 | 1.4 | GO:0042054 | histone methyltransferase activity(GO:0042054) |
| 0.1 | 124.1 | GO:0000981 | RNA polymerase II transcription factor activity, sequence-specific DNA binding(GO:0000981) |
| 0.1 | 0.4 | GO:0004566 | beta-glucuronidase activity(GO:0004566) |
| 0.1 | 0.5 | GO:0005412 | glucose:sodium symporter activity(GO:0005412) |
| 0.1 | 0.5 | GO:0015106 | bicarbonate transmembrane transporter activity(GO:0015106) |
| 0.1 | 1.7 | GO:0048018 | receptor agonist activity(GO:0048018) |
| 0.1 | 10.9 | GO:0005089 | Rho guanyl-nucleotide exchange factor activity(GO:0005089) |
| 0.1 | 0.4 | GO:0008511 | sodium:potassium:chloride symporter activity(GO:0008511) |
| 0.1 | 0.8 | GO:0015143 | urate transmembrane transporter activity(GO:0015143) salt transmembrane transporter activity(GO:1901702) |
| 0.1 | 0.4 | GO:0050698 | proteoglycan sulfotransferase activity(GO:0050698) |
| 0.1 | 0.9 | GO:0016713 | oxidoreductase activity, acting on paired donors, with incorporation or reduction of molecular oxygen, reduced iron-sulfur protein as one donor, and incorporation of one atom of oxygen(GO:0016713) |
| 0.1 | 1.4 | GO:0008097 | 5S rRNA binding(GO:0008097) |
| 0.1 | 65.1 | GO:0001071 | nucleic acid binding transcription factor activity(GO:0001071) transcription factor activity, sequence-specific DNA binding(GO:0003700) |
| 0.1 | 1.1 | GO:0016174 | NAD(P)H oxidase activity(GO:0016174) |
| 0.1 | 4.0 | GO:0000978 | RNA polymerase II core promoter proximal region sequence-specific DNA binding(GO:0000978) |
| 0.1 | 2.9 | GO:0030331 | estrogen receptor binding(GO:0030331) |
| 0.1 | 2.6 | GO:0030371 | translation repressor activity(GO:0030371) |
| 0.1 | 14.6 | GO:0019903 | protein phosphatase binding(GO:0019903) |
| 0.1 | 0.5 | GO:0004966 | galanin receptor activity(GO:0004966) |
| 0.1 | 3.3 | GO:0004364 | glutathione transferase activity(GO:0004364) |
| 0.1 | 0.1 | GO:0038049 | transcription factor activity, ligand-activated RNA polymerase II transcription factor binding(GO:0038049) |
| 0.1 | 0.6 | GO:0005166 | neurotrophin p75 receptor binding(GO:0005166) |
| 0.1 | 12.9 | GO:0005179 | hormone activity(GO:0005179) |
| 0.1 | 6.4 | GO:0008080 | N-acetyltransferase activity(GO:0008080) |
| 0.1 | 1.7 | GO:0005542 | folic acid binding(GO:0005542) |
| 0.1 | 0.2 | GO:0050051 | leukotriene-B4 20-monooxygenase activity(GO:0050051) tocopherol omega-hydroxylase activity(GO:0052870) alpha-tocopherol omega-hydroxylase activity(GO:0052871) 20-hydroxy-leukotriene B4 omega oxidase activity(GO:0097258) 20-aldehyde-leukotriene B4 20-monooxygenase activity(GO:0097259) |
| 0.1 | 0.2 | GO:0004142 | diacylglycerol cholinephosphotransferase activity(GO:0004142) |
| 0.1 | 0.7 | GO:0001517 | N-acetylglucosamine 6-O-sulfotransferase activity(GO:0001517) |
| 0.1 | 1.6 | GO:0043274 | phospholipase binding(GO:0043274) |
| 0.1 | 0.7 | GO:0045125 | bioactive lipid receptor activity(GO:0045125) |
| 0.1 | 1.7 | GO:0001608 | G-protein coupled nucleotide receptor activity(GO:0001608) G-protein coupled purinergic nucleotide receptor activity(GO:0045028) |
| 0.1 | 2.0 | GO:0001046 | core promoter sequence-specific DNA binding(GO:0001046) |
| 0.1 | 0.4 | GO:0008823 | cupric reductase activity(GO:0008823) ferric-chelate reductase (NADPH) activity(GO:0052851) |
| 0.1 | 9.6 | GO:0004896 | cytokine receptor activity(GO:0004896) |
| 0.1 | 2.0 | GO:0008519 | ammonium transmembrane transporter activity(GO:0008519) |
| 0.1 | 1.8 | GO:0043495 | protein anchor(GO:0043495) |
| 0.1 | 1.4 | GO:0005537 | mannose binding(GO:0005537) |
| 0.1 | 3.3 | GO:0004198 | calcium-dependent cysteine-type endopeptidase activity(GO:0004198) |
| 0.1 | 1.9 | GO:0052629 | phosphatidylinositol-3,5-bisphosphate 3-phosphatase activity(GO:0052629) |
| 0.1 | 1.7 | GO:0070412 | R-SMAD binding(GO:0070412) |
| 0.1 | 1.2 | GO:0005049 | nuclear export signal receptor activity(GO:0005049) |
| 0.1 | 0.8 | GO:0008312 | 7S RNA binding(GO:0008312) |
| 0.1 | 1.2 | GO:0015125 | bile acid transmembrane transporter activity(GO:0015125) |
| 0.1 | 2.8 | GO:0001085 | RNA polymerase II transcription factor binding(GO:0001085) |
| 0.1 | 0.4 | GO:0043422 | protein kinase B binding(GO:0043422) |
| 0.1 | 1.4 | GO:0004623 | phospholipase A2 activity(GO:0004623) |
| 0.1 | 0.9 | GO:0015926 | glucosidase activity(GO:0015926) |
| 0.1 | 1.1 | GO:0015145 | monosaccharide transmembrane transporter activity(GO:0015145) |
| 0.1 | 1.1 | GO:0001530 | lipopolysaccharide binding(GO:0001530) |
| 0.1 | 0.5 | GO:1990841 | promoter-specific chromatin binding(GO:1990841) |
| 0.1 | 1.7 | GO:0008235 | metalloexopeptidase activity(GO:0008235) |
| 0.1 | 1.2 | GO:0004029 | aldehyde dehydrogenase (NAD) activity(GO:0004029) |
| 0.1 | 1.3 | GO:0004659 | prenyltransferase activity(GO:0004659) |
| 0.1 | 0.5 | GO:0005243 | gap junction channel activity(GO:0005243) |
| 0.1 | 0.6 | GO:0004957 | prostaglandin E receptor activity(GO:0004957) |
| 0.1 | 0.8 | GO:0008253 | 5'-nucleotidase activity(GO:0008253) |
| 0.1 | 0.5 | GO:0003707 | steroid hormone receptor activity(GO:0003707) |
| 0.1 | 0.5 | GO:0022840 | leak channel activity(GO:0022840) potassium ion leak channel activity(GO:0022841) narrow pore channel activity(GO:0022842) |
| 0.1 | 0.4 | GO:0004969 | histamine receptor activity(GO:0004969) |
| 0.1 | 0.7 | GO:0070513 | death domain binding(GO:0070513) |
| 0.0 | 0.7 | GO:0004861 | cyclin-dependent protein serine/threonine kinase inhibitor activity(GO:0004861) |
| 0.0 | 0.7 | GO:0004985 | opioid receptor activity(GO:0004985) |
| 0.0 | 5.1 | GO:0000149 | SNARE binding(GO:0000149) |
| 0.0 | 0.5 | GO:0009982 | pseudouridine synthase activity(GO:0009982) |
| 0.0 | 1.2 | GO:0051879 | Hsp90 protein binding(GO:0051879) |
| 0.0 | 0.7 | GO:0016881 | acid-amino acid ligase activity(GO:0016881) |
| 0.0 | 1.7 | GO:0004601 | peroxidase activity(GO:0004601) |
| 0.0 | 0.9 | GO:0070577 | lysine-acetylated histone binding(GO:0070577) |
| 0.0 | 0.5 | GO:0047035 | testosterone dehydrogenase (NAD+) activity(GO:0047035) |
| 0.0 | 0.2 | GO:0008948 | malate dehydrogenase (decarboxylating) (NAD+) activity(GO:0004471) malate dehydrogenase (decarboxylating) (NADP+) activity(GO:0004473) oxaloacetate decarboxylase activity(GO:0008948) |
| 0.0 | 0.4 | GO:0004114 | 3',5'-cyclic-nucleotide phosphodiesterase activity(GO:0004114) |
| 0.0 | 0.9 | GO:0050321 | tau-protein kinase activity(GO:0050321) |
| 0.0 | 0.1 | GO:0050613 | delta14-sterol reductase activity(GO:0050613) |
| 0.0 | 0.6 | GO:0015269 | calcium-activated potassium channel activity(GO:0015269) |
| 0.0 | 1.3 | GO:0004890 | GABA-A receptor activity(GO:0004890) |
| 0.0 | 1.8 | GO:0008173 | RNA methyltransferase activity(GO:0008173) |
| 0.0 | 3.6 | GO:0004984 | olfactory receptor activity(GO:0004984) |
| 0.0 | 0.2 | GO:0004370 | glycerol kinase activity(GO:0004370) |
| 0.0 | 1.7 | GO:0016782 | transferase activity, transferring sulfur-containing groups(GO:0016782) |
| 0.0 | 2.7 | GO:0019208 | phosphatase regulator activity(GO:0019208) |
| 0.0 | 2.3 | GO:0005249 | voltage-gated potassium channel activity(GO:0005249) |
| 0.0 | 0.0 | GO:0015018 | galactosylgalactosylxylosylprotein 3-beta-glucuronosyltransferase activity(GO:0015018) |
| 0.0 | 1.0 | GO:0035064 | methylated histone binding(GO:0035064) |
| 0.0 | 0.3 | GO:0045504 | dynein heavy chain binding(GO:0045504) |
| 0.0 | 0.3 | GO:0016279 | lysine N-methyltransferase activity(GO:0016278) protein-lysine N-methyltransferase activity(GO:0016279) |
| 0.0 | 0.3 | GO:0005044 | scavenger receptor activity(GO:0005044) |
| 0.0 | 0.1 | GO:0016015 | morphogen activity(GO:0016015) |
| 0.0 | 0.2 | GO:0050811 | GABA receptor binding(GO:0050811) |
| 0.0 | 0.3 | GO:0016409 | palmitoyltransferase activity(GO:0016409) |
| 0.0 | 0.2 | GO:0000175 | 3'-5'-exoribonuclease activity(GO:0000175) |
Gene overrepresentation in curated gene sets: canonical pathways category:
| Log-likelihood per target | Total log-likelihood | Term | Description |
|---|---|---|---|
| 2.3 | 50.1 | PID TCR RAS PATHWAY | Ras signaling in the CD4+ TCR pathway |
| 1.8 | 114.9 | PID AMB2 NEUTROPHILS PATHWAY | amb2 Integrin signaling |
| 1.0 | 24.7 | PID INTEGRIN5 PATHWAY | Beta5 beta6 beta7 and beta8 integrin cell surface interactions |
| 1.0 | 30.1 | PID NFKAPPAB ATYPICAL PATHWAY | Atypical NF-kappaB pathway |
| 1.0 | 10.6 | SA B CELL RECEPTOR COMPLEXES | Antigen binding to B cell receptors activates protein tyrosine kinases, such as the Src family, which ultimate activate MAP kinases. |
| 1.0 | 20.0 | PID DNA PK PATHWAY | DNA-PK pathway in nonhomologous end joining |
| 1.0 | 68.5 | PID CD8 TCR PATHWAY | TCR signaling in naïve CD8+ T cells |
| 0.9 | 12.1 | PID IL2 PI3K PATHWAY | IL2 signaling events mediated by PI3K |
| 0.9 | 3.6 | PID PS1 PATHWAY | Presenilin action in Notch and Wnt signaling |
| 0.8 | 8.2 | ST JAK STAT PATHWAY | Jak-STAT Pathway |
| 0.8 | 47.4 | SIG PIP3 SIGNALING IN B LYMPHOCYTES | Genes related to PIP3 signaling in B lymphocytes |
| 0.8 | 11.0 | PID THROMBIN PAR4 PATHWAY | PAR4-mediated thrombin signaling events |
| 0.8 | 3.0 | PID IL23 PATHWAY | IL23-mediated signaling events |
| 0.8 | 2.3 | ST GRANULE CELL SURVIVAL PATHWAY | Granule Cell Survival Pathway is a specific case of more general PAC1 Receptor Pathway. |
| 0.7 | 5.9 | ST TYPE I INTERFERON PATHWAY | Type I Interferon (alpha/beta IFN) Pathway |
| 0.7 | 26.5 | SA MMP CYTOKINE CONNECTION | Cytokines can induce activation of matrix metalloproteinases, which degrade extracellular matrix. |
| 0.7 | 22.2 | PID BCR 5PATHWAY | BCR signaling pathway |
| 0.6 | 30.8 | PID IL2 STAT5 PATHWAY | IL2 signaling events mediated by STAT5 |
| 0.6 | 9.9 | PID EPO PATHWAY | EPO signaling pathway |
| 0.5 | 2.2 | PID S1P S1P2 PATHWAY | S1P2 pathway |
| 0.5 | 14.6 | PID ERB GENOMIC PATHWAY | Validated nuclear estrogen receptor beta network |
| 0.5 | 16.1 | PID IL8 CXCR2 PATHWAY | IL8- and CXCR2-mediated signaling events |
| 0.5 | 5.2 | PID RAC1 PATHWAY | RAC1 signaling pathway |
| 0.5 | 7.3 | PID KIT PATHWAY | Signaling events mediated by Stem cell factor receptor (c-Kit) |
| 0.4 | 2.2 | PID S1P S1P3 PATHWAY | S1P3 pathway |
| 0.4 | 24.6 | PID IL12 2PATHWAY | IL12-mediated signaling events |
| 0.4 | 14.0 | PID INTEGRIN2 PATHWAY | Beta2 integrin cell surface interactions |
| 0.4 | 6.1 | PID TOLL ENDOGENOUS PATHWAY | Endogenous TLR signaling |
| 0.4 | 4.9 | PID LYSOPHOSPHOLIPID PATHWAY | LPA receptor mediated events |
| 0.4 | 11.1 | PID PI3KCI PATHWAY | Class I PI3K signaling events |
| 0.4 | 10.7 | PID P38 ALPHA BETA PATHWAY | Regulation of p38-alpha and p38-beta |
| 0.4 | 22.8 | PID CERAMIDE PATHWAY | Ceramide signaling pathway |
| 0.4 | 2.6 | SA PROGRAMMED CELL DEATH | Programmed cell death, or apoptosis, eliminates damaged or unneeded cells. |
| 0.4 | 8.8 | PID CONE PATHWAY | Visual signal transduction: Cones |
| 0.3 | 1.4 | PID WNT CANONICAL PATHWAY | Canonical Wnt signaling pathway |
| 0.3 | 3.1 | SA TRKA RECEPTOR | The TrkA receptor binds nerve growth factor to activate MAP kinase pathways and promote cell growth. |
| 0.3 | 2.0 | PID SYNDECAN 4 PATHWAY | Syndecan-4-mediated signaling events |
| 0.3 | 10.7 | PID UPA UPAR PATHWAY | Urokinase-type plasminogen activator (uPA) and uPAR-mediated signaling |
| 0.3 | 17.4 | PID PDGFRB PATHWAY | PDGFR-beta signaling pathway |
| 0.3 | 10.0 | PID WNT SIGNALING PATHWAY | Wnt signaling network |
| 0.3 | 13.9 | PID IL4 2PATHWAY | IL4-mediated signaling events |
| 0.3 | 5.3 | PID TCPTP PATHWAY | Signaling events mediated by TCPTP |
| 0.3 | 4.8 | PID CD40 PATHWAY | CD40/CD40L signaling |
| 0.3 | 18.1 | PID AR TF PATHWAY | Regulation of Androgen receptor activity |
| 0.3 | 3.1 | PID CD8 TCR DOWNSTREAM PATHWAY | Downstream signaling in naïve CD8+ T cells |
| 0.2 | 15.0 | PID HNF3A PATHWAY | FOXA1 transcription factor network |
| 0.2 | 12.4 | NABA PROTEOGLYCANS | Genes encoding proteoglycans |
| 0.2 | 8.5 | PID RB 1PATHWAY | Regulation of retinoblastoma protein |
| 0.2 | 9.8 | PID HIF2PATHWAY | HIF-2-alpha transcription factor network |
| 0.2 | 2.8 | PID VEGF VEGFR PATHWAY | VEGF and VEGFR signaling network |
| 0.2 | 6.1 | PID FRA PATHWAY | Validated transcriptional targets of AP1 family members Fra1 and Fra2 |
| 0.2 | 8.5 | PID ENDOTHELIN PATHWAY | Endothelins |
| 0.2 | 6.7 | PID SMAD2 3PATHWAY | Regulation of cytoplasmic and nuclear SMAD2/3 signaling |
| 0.2 | 2.4 | PID HIF1A PATHWAY | Hypoxic and oxygen homeostasis regulation of HIF-1-alpha |
| 0.2 | 3.1 | PID TCR PATHWAY | TCR signaling in naïve CD4+ T cells |
| 0.2 | 1.3 | PID HDAC CLASSIII PATHWAY | Signaling events mediated by HDAC Class III |
| 0.2 | 13.6 | PID RAC1 REG PATHWAY | Regulation of RAC1 activity |
| 0.2 | 18.7 | PID ERBB1 DOWNSTREAM PATHWAY | ErbB1 downstream signaling |
| 0.2 | 5.1 | PID CXCR3 PATHWAY | CXCR3-mediated signaling events |
| 0.2 | 5.5 | PID HIV NEF PATHWAY | HIV-1 Nef: Negative effector of Fas and TNF-alpha |
| 0.2 | 35.3 | NABA ECM AFFILIATED | Genes encoding proteins affiliated structurally or functionally to extracellular matrix proteins |
| 0.2 | 1.6 | SA FAS SIGNALING | The TNF-type receptor Fas induces apoptosis on ligand binding. |
| 0.2 | 1.2 | PID MET PATHWAY | Signaling events mediated by Hepatocyte Growth Factor Receptor (c-Met) |
| 0.2 | 3.3 | PID PI3K PLC TRK PATHWAY | Trk receptor signaling mediated by PI3K and PLC-gamma |
| 0.2 | 2.9 | PID INTEGRIN A9B1 PATHWAY | Alpha9 beta1 integrin signaling events |
| 0.2 | 1.8 | PID TRAIL PATHWAY | TRAIL signaling pathway |
| 0.2 | 7.5 | NABA COLLAGENS | Genes encoding collagen proteins |
| 0.2 | 3.1 | ST ERK1 ERK2 MAPK PATHWAY | ERK1/ERK2 MAPK Pathway |
| 0.2 | 1.8 | PID PTP1B PATHWAY | Signaling events mediated by PTP1B |
| 0.2 | 6.5 | PID AP1 PATHWAY | AP-1 transcription factor network |
| 0.2 | 2.6 | ST JNK MAPK PATHWAY | JNK MAPK Pathway |
| 0.2 | 13.9 | WNT SIGNALING | Genes related to Wnt-mediated signal transduction |
| 0.2 | 6.7 | PID RXR VDR PATHWAY | RXR and RAR heterodimerization with other nuclear receptor |
| 0.2 | 7.5 | PID MTOR 4PATHWAY | mTOR signaling pathway |
| 0.1 | 1.5 | PID HDAC CLASSII PATHWAY | Signaling events mediated by HDAC Class II |
| 0.1 | 46.2 | NABA SECRETED FACTORS | Genes encoding secreted soluble factors |
| 0.1 | 1.5 | PID GMCSF PATHWAY | GMCSF-mediated signaling events |
| 0.1 | 3.9 | PID ARF6 PATHWAY | Arf6 signaling events |
| 0.1 | 0.5 | PID PDGFRA PATHWAY | PDGFR-alpha signaling pathway |
| 0.1 | 1.2 | PID ANTHRAX PATHWAY | Cellular roles of Anthrax toxin |
| 0.1 | 5.6 | PID DELTA NP63 PATHWAY | Validated transcriptional targets of deltaNp63 isoforms |
| 0.1 | 1.3 | PID ALK1 PATHWAY | ALK1 signaling events |
| 0.1 | 2.3 | PID RAS PATHWAY | Regulation of Ras family activation |
| 0.1 | 3.3 | PID ERBB4 PATHWAY | ErbB4 signaling events |
| 0.1 | 2.0 | PID HEDGEHOG 2PATHWAY | Signaling events mediated by the Hedgehog family |
| 0.1 | 4.1 | PID REG GR PATHWAY | Glucocorticoid receptor regulatory network |
| 0.1 | 4.6 | PID SMAD2 3NUCLEAR PATHWAY | Regulation of nuclear SMAD2/3 signaling |
| 0.1 | 1.9 | PID IL1 PATHWAY | IL1-mediated signaling events |
| 0.1 | 1.4 | PID ATM PATHWAY | ATM pathway |
| 0.1 | 2.6 | PID FGF PATHWAY | FGF signaling pathway |
| 0.1 | 4.7 | PID BETA CATENIN NUC PATHWAY | Regulation of nuclear beta catenin signaling and target gene transcription |
| 0.1 | 1.6 | PID NFAT TFPATHWAY | Calcineurin-regulated NFAT-dependent transcription in lymphocytes |
| 0.1 | 3.7 | PID MYC REPRESS PATHWAY | Validated targets of C-MYC transcriptional repression |
| 0.1 | 4.1 | PID HDAC CLASSI PATHWAY | Signaling events mediated by HDAC Class I |
| 0.1 | 2.6 | PID CMYB PATHWAY | C-MYB transcription factor network |
| 0.0 | 0.9 | PID RHODOPSIN PATHWAY | Visual signal transduction: Rods |
| 0.0 | 1.9 | PID NOTCH PATHWAY | Notch signaling pathway |
| 0.0 | 0.2 | PID NECTIN PATHWAY | Nectin adhesion pathway |
| 0.0 | 0.5 | PID FOXO PATHWAY | FoxO family signaling |
| 0.0 | 0.2 | PID AVB3 INTEGRIN PATHWAY | Integrins in angiogenesis |
| 0.0 | 0.2 | PID REELIN PATHWAY | Reelin signaling pathway |
Gene overrepresentation in curated gene sets: REACTOME pathways category:
| Log-likelihood per target | Total log-likelihood | Term | Description |
|---|---|---|---|
| 2.2 | 58.6 | REACTOME PRE NOTCH PROCESSING IN GOLGI | Genes involved in Pre-NOTCH Processing in Golgi |
| 1.6 | 49.1 | REACTOME PLATELET SENSITIZATION BY LDL | Genes involved in Platelet sensitization by LDL |
| 1.6 | 8.1 | REACTOME G BETA GAMMA SIGNALLING THROUGH PLC BETA | Genes involved in G beta:gamma signalling through PLC beta |
| 1.4 | 35.5 | REACTOME OTHER SEMAPHORIN INTERACTIONS | Genes involved in Other semaphorin interactions |
| 1.3 | 21.1 | REACTOME SYNTHESIS OF PE | Genes involved in Synthesis of PE |
| 1.3 | 12.9 | REACTOME PLATELET ADHESION TO EXPOSED COLLAGEN | Genes involved in Platelet Adhesion to exposed collagen |
| 1.2 | 18.0 | REACTOME PURINE CATABOLISM | Genes involved in Purine catabolism |
| 1.0 | 101.0 | REACTOME IMMUNOREGULATORY INTERACTIONS BETWEEN A LYMPHOID AND A NON LYMPHOID CELL | Genes involved in Immunoregulatory interactions between a Lymphoid and a non-Lymphoid cell |
| 1.0 | 18.2 | REACTOME COMMON PATHWAY | Genes involved in Common Pathway |
| 1.0 | 23.9 | REACTOME REGULATION OF KIT SIGNALING | Genes involved in Regulation of KIT signaling |
| 1.0 | 21.9 | REACTOME ACTIVATION OF THE AP1 FAMILY OF TRANSCRIPTION FACTORS | Genes involved in Activation of the AP-1 family of transcription factors |
| 1.0 | 33.3 | REACTOME ANTIGEN ACTIVATES B CELL RECEPTOR LEADING TO GENERATION OF SECOND MESSENGERS | Genes involved in Antigen Activates B Cell Receptor Leading to Generation of Second Messengers |
| 0.9 | 6.4 | REACTOME THE ROLE OF NEF IN HIV1 REPLICATION AND DISEASE PATHOGENESIS | Genes involved in The role of Nef in HIV-1 replication and disease pathogenesis |
| 0.9 | 24.3 | REACTOME SIGNALING BY FGFR1 FUSION MUTANTS | Genes involved in Signaling by FGFR1 fusion mutants |
| 0.9 | 9.9 | REACTOME IL 6 SIGNALING | Genes involved in Interleukin-6 signaling |
| 0.9 | 32.0 | REACTOME DEGRADATION OF THE EXTRACELLULAR MATRIX | Genes involved in Degradation of the extracellular matrix |
| 0.9 | 17.5 | REACTOME PROCESSING OF INTRONLESS PRE MRNAS | Genes involved in Processing of Intronless Pre-mRNAs |
| 0.9 | 9.5 | REACTOME REGULATION OF IFNG SIGNALING | Genes involved in Regulation of IFNG signaling |
| 0.9 | 12.8 | REACTOME SEMA3A PLEXIN REPULSION SIGNALING BY INHIBITING INTEGRIN ADHESION | Genes involved in SEMA3A-Plexin repulsion signaling by inhibiting Integrin adhesion |
| 0.8 | 11.0 | REACTOME THROMBIN SIGNALLING THROUGH PROTEINASE ACTIVATED RECEPTORS PARS | Genes involved in Thrombin signalling through proteinase activated receptors (PARs) |
| 0.8 | 10.9 | REACTOME THE NLRP3 INFLAMMASOME | Genes involved in The NLRP3 inflammasome |
| 0.7 | 8.0 | REACTOME CREATION OF C4 AND C2 ACTIVATORS | Genes involved in Creation of C4 and C2 activators |
| 0.7 | 46.9 | REACTOME STRIATED MUSCLE CONTRACTION | Genes involved in Striated Muscle Contraction |
| 0.6 | 5.8 | REACTOME PYRIMIDINE CATABOLISM | Genes involved in Pyrimidine catabolism |
| 0.6 | 8.3 | REACTOME PASSIVE TRANSPORT BY AQUAPORINS | Genes involved in Passive Transport by Aquaporins |
| 0.6 | 8.9 | REACTOME CTNNB1 PHOSPHORYLATION CASCADE | Genes involved in Beta-catenin phosphorylation cascade |
| 0.6 | 45.0 | REACTOME G ALPHA Z SIGNALLING EVENTS | Genes involved in G alpha (z) signalling events |
| 0.6 | 55.4 | REACTOME INTERFERON ALPHA BETA SIGNALING | Genes involved in Interferon alpha/beta signaling |
| 0.6 | 6.6 | REACTOME IRAK2 MEDIATED ACTIVATION OF TAK1 COMPLEX UPON TLR7 8 OR 9 STIMULATION | Genes involved in IRAK2 mediated activation of TAK1 complex upon TLR7/8 or 9 stimulation |
| 0.6 | 1.7 | REACTOME PRE NOTCH TRANSCRIPTION AND TRANSLATION | Genes involved in Pre-NOTCH Transcription and Translation |
| 0.5 | 3.3 | REACTOME PLATELET AGGREGATION PLUG FORMATION | Genes involved in Platelet Aggregation (Plug Formation) |
| 0.5 | 11.3 | REACTOME PRESYNAPTIC NICOTINIC ACETYLCHOLINE RECEPTORS | Genes involved in Presynaptic nicotinic acetylcholine receptors |
| 0.5 | 34.7 | REACTOME CHEMOKINE RECEPTORS BIND CHEMOKINES | Genes involved in Chemokine receptors bind chemokines |
| 0.5 | 8.8 | REACTOME REGULATION OF PYRUVATE DEHYDROGENASE PDH COMPLEX | Genes involved in Regulation of pyruvate dehydrogenase (PDH) complex |
| 0.5 | 7.2 | REACTOME G PROTEIN BETA GAMMA SIGNALLING | Genes involved in G-protein beta:gamma signalling |
| 0.5 | 5.6 | REACTOME GLUCOSE TRANSPORT | Genes involved in Glucose transport |
| 0.5 | 1.0 | REACTOME INSULIN RECEPTOR RECYCLING | Genes involved in Insulin receptor recycling |
| 0.5 | 6.4 | REACTOME GPVI MEDIATED ACTIVATION CASCADE | Genes involved in GPVI-mediated activation cascade |
| 0.5 | 6.6 | REACTOME SEROTONIN RECEPTORS | Genes involved in Serotonin receptors |
| 0.5 | 3.3 | REACTOME INITIAL TRIGGERING OF COMPLEMENT | Genes involved in Initial triggering of complement |
| 0.5 | 5.1 | REACTOME APOBEC3G MEDIATED RESISTANCE TO HIV1 INFECTION | Genes involved in APOBEC3G mediated resistance to HIV-1 infection |
| 0.4 | 9.4 | REACTOME FACILITATIVE NA INDEPENDENT GLUCOSE TRANSPORTERS | Genes involved in Facilitative Na+-independent glucose transporters |
| 0.4 | 19.4 | REACTOME LATENT INFECTION OF HOMO SAPIENS WITH MYCOBACTERIUM TUBERCULOSIS | Genes involved in Latent infection of Homo sapiens with Mycobacterium tuberculosis |
| 0.4 | 14.1 | REACTOME EFFECTS OF PIP2 HYDROLYSIS | Genes involved in Effects of PIP2 hydrolysis |
| 0.4 | 0.4 | REACTOME ADP SIGNALLING THROUGH P2RY1 | Genes involved in ADP signalling through P2Y purinoceptor 1 |
| 0.4 | 3.7 | REACTOME AKT PHOSPHORYLATES TARGETS IN THE CYTOSOL | Genes involved in AKT phosphorylates targets in the cytosol |
| 0.4 | 11.6 | REACTOME CLASS B 2 SECRETIN FAMILY RECEPTORS | Genes involved in Class B/2 (Secretin family receptors) |
| 0.4 | 1.9 | REACTOME CROSS PRESENTATION OF SOLUBLE EXOGENOUS ANTIGENS ENDOSOMES | Genes involved in Cross-presentation of soluble exogenous antigens (endosomes) |
| 0.4 | 1.9 | REACTOME REGULATION OF SIGNALING BY CBL | Genes involved in Regulation of signaling by CBL |
| 0.4 | 6.8 | REACTOME P38MAPK EVENTS | Genes involved in p38MAPK events |
| 0.4 | 4.3 | REACTOME G ALPHA1213 SIGNALLING EVENTS | Genes involved in G alpha (12/13) signalling events |
| 0.3 | 2.8 | REACTOME NRAGE SIGNALS DEATH THROUGH JNK | Genes involved in NRAGE signals death through JNK |
| 0.3 | 16.6 | REACTOME G1 PHASE | Genes involved in G1 Phase |
| 0.3 | 3.8 | REACTOME REGULATION OF INSULIN SECRETION BY GLUCAGON LIKE PEPTIDE1 | Genes involved in Regulation of Insulin Secretion by Glucagon-like Peptide-1 |
| 0.3 | 41.1 | REACTOME POTASSIUM CHANNELS | Genes involved in Potassium Channels |
| 0.3 | 1.0 | REACTOME SHC RELATED EVENTS | Genes involved in SHC-related events |
| 0.3 | 5.9 | REACTOME ORGANIC CATION ANION ZWITTERION TRANSPORT | Genes involved in Organic cation/anion/zwitterion transport |
| 0.3 | 5.3 | REACTOME REVERSIBLE HYDRATION OF CARBON DIOXIDE | Genes involved in Reversible Hydration of Carbon Dioxide |
| 0.3 | 3.2 | REACTOME KERATAN SULFATE DEGRADATION | Genes involved in Keratan sulfate degradation |
| 0.3 | 2.2 | REACTOME MEMBRANE BINDING AND TARGETTING OF GAG PROTEINS | Genes involved in Membrane binding and targetting of GAG proteins |
| 0.3 | 2.2 | REACTOME REGULATION OF BETA CELL DEVELOPMENT | Genes involved in Regulation of beta-cell development |
| 0.3 | 3.8 | REACTOME SIGNAL REGULATORY PROTEIN SIRP FAMILY INTERACTIONS | Genes involved in Signal regulatory protein (SIRP) family interactions |
| 0.3 | 7.1 | REACTOME ABCA TRANSPORTERS IN LIPID HOMEOSTASIS | Genes involved in ABCA transporters in lipid homeostasis |
| 0.3 | 3.3 | REACTOME PLATELET CALCIUM HOMEOSTASIS | Genes involved in Platelet calcium homeostasis |
| 0.3 | 54.2 | REACTOME SIGNALING BY RHO GTPASES | Genes involved in Signaling by Rho GTPases |
| 0.3 | 4.1 | REACTOME HORMONE LIGAND BINDING RECEPTORS | Genes involved in Hormone ligand-binding receptors |
| 0.3 | 0.6 | REACTOME PECAM1 INTERACTIONS | Genes involved in PECAM1 interactions |
| 0.3 | 32.6 | REACTOME TRANSCRIPTIONAL REGULATION OF WHITE ADIPOCYTE DIFFERENTIATION | Genes involved in Transcriptional Regulation of White Adipocyte Differentiation |
| 0.3 | 4.4 | REACTOME CLASS C 3 METABOTROPIC GLUTAMATE PHEROMONE RECEPTORS | Genes involved in Class C/3 (Metabotropic glutamate/pheromone receptors) |
| 0.3 | 2.9 | REACTOME OPSINS | Genes involved in Opsins |
| 0.3 | 6.8 | REACTOME CITRIC ACID CYCLE TCA CYCLE | Genes involved in Citric acid cycle (TCA cycle) |
| 0.3 | 24.9 | REACTOME NUCLEAR RECEPTOR TRANSCRIPTION PATHWAY | Genes involved in Nuclear Receptor transcription pathway |
| 0.3 | 8.1 | REACTOME REGULATION OF GENE EXPRESSION IN BETA CELLS | Genes involved in Regulation of gene expression in beta cells |
| 0.3 | 2.8 | REACTOME POST NMDA RECEPTOR ACTIVATION EVENTS | Genes involved in Post NMDA receptor activation events |
| 0.3 | 2.0 | REACTOME EICOSANOID LIGAND BINDING RECEPTORS | Genes involved in Eicosanoid ligand-binding receptors |
| 0.3 | 1.8 | REACTOME ABACAVIR TRANSPORT AND METABOLISM | Genes involved in Abacavir transport and metabolism |
| 0.3 | 2.5 | REACTOME ELONGATION ARREST AND RECOVERY | Genes involved in Elongation arrest and recovery |
| 0.2 | 7.6 | REACTOME CHONDROITIN SULFATE BIOSYNTHESIS | Genes involved in Chondroitin sulfate biosynthesis |
| 0.2 | 8.9 | REACTOME METABOLISM OF STEROID HORMONES AND VITAMINS A AND D | Genes involved in Metabolism of steroid hormones and vitamins A and D |
| 0.2 | 1.9 | REACTOME SIGNALING BY FGFR IN DISEASE | Genes involved in Signaling by FGFR in disease |
| 0.2 | 3.9 | REACTOME MITOCHONDRIAL FATTY ACID BETA OXIDATION | Genes involved in Mitochondrial Fatty Acid Beta-Oxidation |
| 0.2 | 2.0 | REACTOME INTEGRATION OF PROVIRUS | Genes involved in Integration of provirus |
| 0.2 | 2.4 | REACTOME NGF SIGNALLING VIA TRKA FROM THE PLASMA MEMBRANE | Genes involved in NGF signalling via TRKA from the plasma membrane |
| 0.2 | 8.4 | REACTOME PERK REGULATED GENE EXPRESSION | Genes involved in PERK regulated gene expression |
| 0.2 | 1.9 | REACTOME DSCAM INTERACTIONS | Genes involved in DSCAM interactions |
| 0.2 | 4.7 | REACTOME RAS ACTIVATION UOPN CA2 INFUX THROUGH NMDA RECEPTOR | Genes involved in Ras activation uopn Ca2+ infux through NMDA receptor |
| 0.2 | 1.4 | REACTOME BETA DEFENSINS | Genes involved in Beta defensins |
| 0.2 | 3.0 | REACTOME SYNTHESIS OF PIPS AT THE LATE ENDOSOME MEMBRANE | Genes involved in Synthesis of PIPs at the late endosome membrane |
| 0.2 | 1.1 | REACTOME DOWNSTREAM TCR SIGNALING | Genes involved in Downstream TCR signaling |
| 0.2 | 3.9 | REACTOME GLUCAGON TYPE LIGAND RECEPTORS | Genes involved in Glucagon-type ligand receptors |
| 0.2 | 0.6 | REACTOME ROLE OF SECOND MESSENGERS IN NETRIN1 SIGNALING | Genes involved in Role of second messengers in netrin-1 signaling |
| 0.2 | 7.0 | REACTOME AMINE COMPOUND SLC TRANSPORTERS | Genes involved in Amine compound SLC transporters |
| 0.2 | 15.7 | REACTOME MYD88 MAL CASCADE INITIATED ON PLASMA MEMBRANE | Genes involved in MyD88:Mal cascade initiated on plasma membrane |
| 0.2 | 7.5 | REACTOME ION TRANSPORT BY P TYPE ATPASES | Genes involved in Ion transport by P-type ATPases |
| 0.2 | 1.6 | REACTOME ROLE OF DCC IN REGULATING APOPTOSIS | Genes involved in Role of DCC in regulating apoptosis |
| 0.2 | 3.2 | REACTOME XENOBIOTICS | Genes involved in Xenobiotics |
| 0.2 | 6.7 | REACTOME INTERACTIONS OF VPR WITH HOST CELLULAR PROTEINS | Genes involved in Interactions of Vpr with host cellular proteins |
| 0.2 | 3.7 | REACTOME SYNTHESIS OF GLYCOSYLPHOSPHATIDYLINOSITOL GPI | Genes involved in Synthesis of glycosylphosphatidylinositol (GPI) |
| 0.2 | 5.8 | REACTOME NEGATIVE REGULATORS OF RIG I MDA5 SIGNALING | Genes involved in Negative regulators of RIG-I/MDA5 signaling |
| 0.2 | 2.2 | REACTOME THE ACTIVATION OF ARYLSULFATASES | Genes involved in The activation of arylsulfatases |
| 0.2 | 2.2 | REACTOME APOPTOSIS INDUCED DNA FRAGMENTATION | Genes involved in Apoptosis induced DNA fragmentation |
| 0.2 | 2.6 | REACTOME REGULATION OF COMPLEMENT CASCADE | Genes involved in Regulation of Complement cascade |
| 0.2 | 1.3 | REACTOME REGULATION OF THE FANCONI ANEMIA PATHWAY | Genes involved in Regulation of the Fanconi anemia pathway |
| 0.2 | 2.3 | REACTOME ACTIVATION OF BH3 ONLY PROTEINS | Genes involved in Activation of BH3-only proteins |
| 0.2 | 6.0 | REACTOME GLYCOSPHINGOLIPID METABOLISM | Genes involved in Glycosphingolipid metabolism |
| 0.1 | 4.5 | REACTOME SIGNALING BY NODAL | Genes involved in Signaling by NODAL |
| 0.1 | 0.6 | REACTOME SIGNALLING TO RAS | Genes involved in Signalling to RAS |
| 0.1 | 0.8 | REACTOME ACETYLCHOLINE BINDING AND DOWNSTREAM EVENTS | Genes involved in Acetylcholine Binding And Downstream Events |
| 0.1 | 2.7 | REACTOME AMINE DERIVED HORMONES | Genes involved in Amine-derived hormones |
| 0.1 | 1.9 | REACTOME ABC FAMILY PROTEINS MEDIATED TRANSPORT | Genes involved in ABC-family proteins mediated transport |
| 0.1 | 1.5 | REACTOME NEF MEDIATED DOWNREGULATION OF MHC CLASS I COMPLEX CELL SURFACE EXPRESSION | Genes involved in Nef mediated downregulation of MHC class I complex cell surface expression |
| 0.1 | 4.9 | REACTOME INTERACTION BETWEEN L1 AND ANKYRINS | Genes involved in Interaction between L1 and Ankyrins |
| 0.1 | 12.4 | REACTOME G ALPHA S SIGNALLING EVENTS | Genes involved in G alpha (s) signalling events |
| 0.1 | 1.7 | REACTOME ACYL CHAIN REMODELLING OF PS | Genes involved in Acyl chain remodelling of PS |
| 0.1 | 2.9 | REACTOME INSULIN SYNTHESIS AND PROCESSING | Genes involved in Insulin Synthesis and Processing |
| 0.1 | 3.6 | REACTOME EXTRINSIC PATHWAY FOR APOPTOSIS | Genes involved in Extrinsic Pathway for Apoptosis |
| 0.1 | 2.1 | REACTOME PROLACTIN RECEPTOR SIGNALING | Genes involved in Prolactin receptor signaling |
| 0.1 | 2.4 | REACTOME CYTOSOLIC SULFONATION OF SMALL MOLECULES | Genes involved in Cytosolic sulfonation of small molecules |
| 0.1 | 11.6 | REACTOME PEPTIDE LIGAND BINDING RECEPTORS | Genes involved in Peptide ligand-binding receptors |
| 0.1 | 2.2 | REACTOME N GLYCAN ANTENNAE ELONGATION | Genes involved in N-Glycan antennae elongation |
| 0.1 | 12.1 | REACTOME TRANSPORT OF INORGANIC CATIONS ANIONS AND AMINO ACIDS OLIGOPEPTIDES | Genes involved in Transport of inorganic cations/anions and amino acids/oligopeptides |
| 0.1 | 10.8 | REACTOME MHC CLASS II ANTIGEN PRESENTATION | Genes involved in MHC class II antigen presentation |
| 0.1 | 3.8 | REACTOME LIGAND GATED ION CHANNEL TRANSPORT | Genes involved in Ligand-gated ion channel transport |
| 0.1 | 1.6 | REACTOME GAP JUNCTION ASSEMBLY | Genes involved in Gap junction assembly |
| 0.1 | 3.3 | REACTOME TIGHT JUNCTION INTERACTIONS | Genes involved in Tight junction interactions |
| 0.1 | 4.5 | REACTOME PHASE1 FUNCTIONALIZATION OF COMPOUNDS | Genes involved in Phase 1 - Functionalization of compounds |
| 0.1 | 0.4 | REACTOME NFKB ACTIVATION THROUGH FADD RIP1 PATHWAY MEDIATED BY CASPASE 8 AND10 | Genes involved in NF-kB activation through FADD/RIP-1 pathway mediated by caspase-8 and -10 |
| 0.1 | 0.4 | REACTOME HORMONE SENSITIVE LIPASE HSL MEDIATED TRIACYLGLYCEROL HYDROLYSIS | Genes involved in Hormone-sensitive lipase (HSL)-mediated triacylglycerol hydrolysis |
| 0.1 | 0.8 | REACTOME NUCLEOTIDE LIKE PURINERGIC RECEPTORS | Genes involved in Nucleotide-like (purinergic) receptors |
| 0.1 | 1.5 | REACTOME REGULATION OF HYPOXIA INDUCIBLE FACTOR HIF BY OXYGEN | Genes involved in Regulation of Hypoxia-inducible Factor (HIF) by Oxygen |
| 0.1 | 0.7 | REACTOME KERATAN SULFATE BIOSYNTHESIS | Genes involved in Keratan sulfate biosynthesis |
| 0.1 | 4.2 | REACTOME NCAM1 INTERACTIONS | Genes involved in NCAM1 interactions |
| 0.1 | 1.4 | REACTOME CIRCADIAN CLOCK | Genes involved in Circadian Clock |
| 0.1 | 17.2 | REACTOME GENERIC TRANSCRIPTION PATHWAY | Genes involved in Generic Transcription Pathway |
| 0.1 | 0.9 | REACTOME CGMP EFFECTS | Genes involved in cGMP effects |
| 0.1 | 0.5 | REACTOME DEFENSINS | Genes involved in Defensins |
| 0.1 | 7.9 | REACTOME PEPTIDE CHAIN ELONGATION | Genes involved in Peptide chain elongation |
| 0.0 | 1.0 | REACTOME SIGNAL TRANSDUCTION BY L1 | Genes involved in Signal transduction by L1 |
| 0.0 | 0.8 | REACTOME REGULATION OF INSULIN LIKE GROWTH FACTOR IGF ACTIVITY BY INSULIN LIKE GROWTH FACTOR BINDING PROTEINS IGFBPS | Genes involved in Regulation of Insulin-like Growth Factor (IGF) Activity by Insulin-like Growth Factor Binding Proteins (IGFBPs) |
| 0.0 | 2.4 | REACTOME G ALPHA I SIGNALLING EVENTS | Genes involved in G alpha (i) signalling events |
| 0.0 | 1.3 | REACTOME ACTIVATED AMPK STIMULATES FATTY ACID OXIDATION IN MUSCLE | Genes involved in Activated AMPK stimulates fatty-acid oxidation in muscle |
| 0.0 | 3.6 | REACTOME OLFACTORY SIGNALING PATHWAY | Genes involved in Olfactory Signaling Pathway |
| 0.0 | 0.7 | REACTOME CHYLOMICRON MEDIATED LIPID TRANSPORT | Genes involved in Chylomicron-mediated lipid transport |
| 0.0 | 0.2 | REACTOME ER PHAGOSOME PATHWAY | Genes involved in ER-Phagosome pathway |
| 0.0 | 1.4 | REACTOME HEPARAN SULFATE HEPARIN HS GAG METABOLISM | Genes involved in Heparan sulfate/heparin (HS-GAG) metabolism |
| 0.0 | 0.3 | REACTOME POST TRANSLATIONAL MODIFICATION SYNTHESIS OF GPI ANCHORED PROTEINS | Genes involved in Post-translational modification: synthesis of GPI-anchored proteins |
| 0.0 | 0.2 | REACTOME TIE2 SIGNALING | Genes involved in Tie2 Signaling |
| 0.0 | 0.4 | REACTOME MRNA DECAY BY 5 TO 3 EXORIBONUCLEASE | Genes involved in mRNA Decay by 5' to 3' Exoribonuclease |
| 0.0 | 0.7 | REACTOME NOTCH1 INTRACELLULAR DOMAIN REGULATES TRANSCRIPTION | Genes involved in NOTCH1 Intracellular Domain Regulates Transcription |