Project
GNF SymAtlas + NCI-60 cancer cell lines, human (Su, 2004; Ross, 2000)
Navigation
Downloads
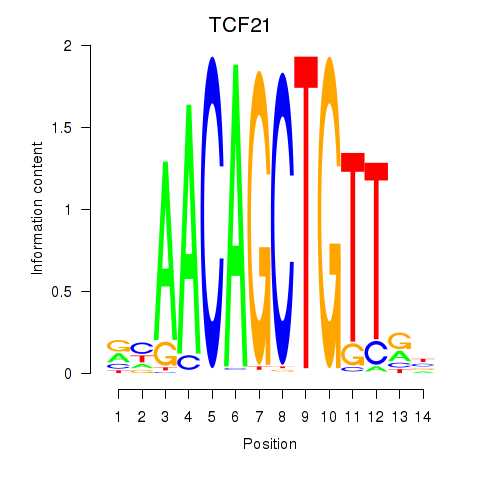
Results for TCF21
Z-value: 0.74
Motif logo
Transcription factors associated with TCF21
| Gene Symbol | Gene ID | Gene Info |
|---|---|---|
|
TCF21
|
ENSG00000118526.7 | TCF21 |
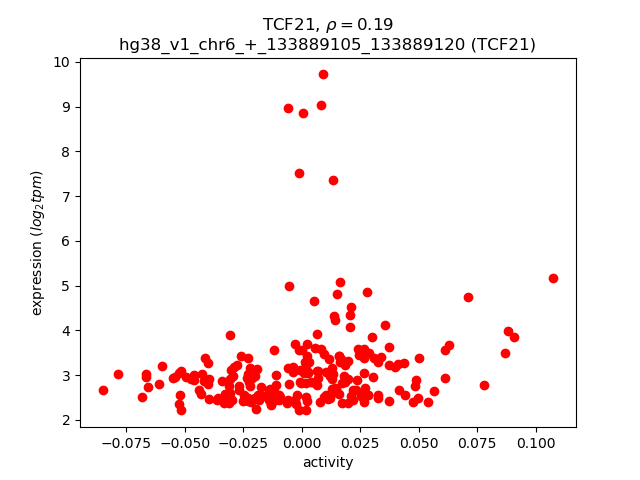
Activity-expression correlation:
| Gene | Promoter | Pearson corr. coef. | P-value | Plot |
|---|---|---|---|---|
| TCF21 | hg38_v1_chr6_+_133889105_133889120 | 0.19 | 4.9e-03 | Click! |
Activity profile of TCF21 motif
Sorted Z-values of TCF21 motif
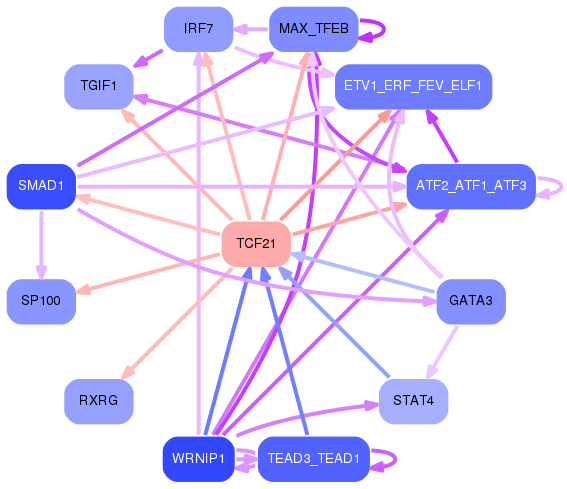
Network of associatons between targets according to the STRING database.

First level regulatory network of TCF21
Gene Ontology Analysis
Gene overrepresentation in biological process category:
| Log-likelihood per target | Total log-likelihood | Term | Description |
|---|---|---|---|
| 3.7 | 18.7 | GO:0003065 | positive regulation of heart rate by epinephrine(GO:0003065) |
| 2.1 | 6.2 | GO:0090341 | negative regulation of secretion of lysosomal enzymes(GO:0090341) |
| 1.4 | 4.3 | GO:0061011 | hepatic duct development(GO:0061011) |
| 1.3 | 4.0 | GO:0061394 | regulation of transcription from RNA polymerase II promoter in response to arsenic-containing substance(GO:0061394) |
| 1.3 | 10.6 | GO:1902219 | negative regulation of intrinsic apoptotic signaling pathway in response to osmotic stress(GO:1902219) |
| 1.1 | 5.7 | GO:0070295 | renal water absorption(GO:0070295) |
| 1.1 | 4.5 | GO:0060023 | soft palate development(GO:0060023) |
| 1.0 | 4.9 | GO:1902044 | regulation of Fas signaling pathway(GO:1902044) |
| 0.8 | 2.5 | GO:2000661 | positive regulation of interleukin-1-mediated signaling pathway(GO:2000661) |
| 0.8 | 2.5 | GO:0034769 | basement membrane disassembly(GO:0034769) |
| 0.8 | 4.1 | GO:0033277 | abortive mitotic cell cycle(GO:0033277) |
| 0.8 | 3.2 | GO:0051697 | protein delipidation(GO:0051697) |
| 0.8 | 2.4 | GO:0033499 | galactose catabolic process via UDP-galactose(GO:0033499) |
| 0.8 | 1.6 | GO:0072249 | metanephric glomerular epithelium development(GO:0072244) metanephric glomerular visceral epithelial cell differentiation(GO:0072248) metanephric glomerular visceral epithelial cell development(GO:0072249) metanephric glomerular epithelial cell differentiation(GO:0072312) metanephric glomerular epithelial cell development(GO:0072313) |
| 0.8 | 4.7 | GO:0097319 | fructose transport(GO:0015755) fructose import(GO:0032445) carbohydrate import into cell(GO:0097319) carbohydrate import across plasma membrane(GO:0098704) fructose import across plasma membrane(GO:1990539) |
| 0.7 | 3.3 | GO:0001315 | age-dependent response to oxidative stress(GO:0001306) age-dependent response to reactive oxygen species(GO:0001315) regulation of systemic arterial blood pressure by acetylcholine(GO:0003068) vasodilation by acetylcholine involved in regulation of systemic arterial blood pressure(GO:0003069) regulation of systemic arterial blood pressure by neurotransmitter(GO:0003070) age-dependent general metabolic decline(GO:0007571) |
| 0.7 | 4.0 | GO:0016554 | cytidine to uridine editing(GO:0016554) |
| 0.7 | 3.3 | GO:0035645 | enteric smooth muscle cell differentiation(GO:0035645) |
| 0.6 | 2.5 | GO:1903413 | cellular response to bile acid(GO:1903413) |
| 0.6 | 1.7 | GO:0006121 | mitochondrial electron transport, succinate to ubiquinone(GO:0006121) |
| 0.5 | 3.3 | GO:0015842 | aminergic neurotransmitter loading into synaptic vesicle(GO:0015842) |
| 0.5 | 4.8 | GO:2000334 | response to linoleic acid(GO:0070543) blood microparticle formation(GO:0072564) regulation of blood microparticle formation(GO:2000332) positive regulation of blood microparticle formation(GO:2000334) |
| 0.5 | 2.6 | GO:0034124 | regulation of MyD88-dependent toll-like receptor signaling pathway(GO:0034124) |
| 0.5 | 1.6 | GO:0001732 | formation of cytoplasmic translation initiation complex(GO:0001732) |
| 0.5 | 2.6 | GO:0036115 | fatty-acyl-CoA catabolic process(GO:0036115) |
| 0.5 | 2.0 | GO:1902283 | negative regulation of primary amine oxidase activity(GO:1902283) |
| 0.5 | 7.5 | GO:0006600 | creatine metabolic process(GO:0006600) |
| 0.5 | 1.4 | GO:0035995 | detection of muscle stretch(GO:0035995) |
| 0.5 | 3.7 | GO:1900113 | negative regulation of histone H3-K9 trimethylation(GO:1900113) |
| 0.4 | 3.5 | GO:0048014 | Tie signaling pathway(GO:0048014) |
| 0.4 | 1.3 | GO:0009386 | translational attenuation(GO:0009386) |
| 0.4 | 7.4 | GO:0006527 | arginine catabolic process(GO:0006527) |
| 0.4 | 2.9 | GO:0000821 | regulation of arginine metabolic process(GO:0000821) basic amino acid transmembrane transport(GO:1990822) |
| 0.4 | 1.6 | GO:1990414 | replication-born double-strand break repair via sister chromatid exchange(GO:1990414) |
| 0.4 | 1.2 | GO:1900226 | negative regulation of NLRP3 inflammasome complex assembly(GO:1900226) |
| 0.4 | 3.0 | GO:0070995 | NADPH oxidation(GO:0070995) |
| 0.4 | 5.0 | GO:1904706 | negative regulation of vascular smooth muscle cell proliferation(GO:1904706) |
| 0.4 | 1.4 | GO:0042369 | vitamin D catabolic process(GO:0042369) |
| 0.4 | 7.2 | GO:0006123 | mitochondrial electron transport, cytochrome c to oxygen(GO:0006123) |
| 0.3 | 1.0 | GO:0060005 | vestibular reflex(GO:0060005) |
| 0.3 | 3.0 | GO:0072513 | positive regulation of secondary heart field cardioblast proliferation(GO:0072513) |
| 0.3 | 12.8 | GO:0002026 | regulation of the force of heart contraction(GO:0002026) |
| 0.3 | 1.7 | GO:0034154 | toll-like receptor 7 signaling pathway(GO:0034154) |
| 0.3 | 2.0 | GO:0071896 | protein localization to adherens junction(GO:0071896) |
| 0.3 | 1.0 | GO:1901656 | glucoside transport(GO:0042946) glycoside transport(GO:1901656) |
| 0.3 | 5.9 | GO:0015671 | oxygen transport(GO:0015671) |
| 0.3 | 1.2 | GO:0019086 | late viral transcription(GO:0019086) |
| 0.3 | 20.1 | GO:0006910 | phagocytosis, recognition(GO:0006910) |
| 0.3 | 1.4 | GO:0060800 | regulation of cell differentiation involved in embryonic placenta development(GO:0060800) |
| 0.3 | 0.9 | GO:0060406 | positive regulation of penile erection(GO:0060406) |
| 0.3 | 3.4 | GO:1903071 | positive regulation of ER-associated ubiquitin-dependent protein catabolic process(GO:1903071) |
| 0.3 | 3.4 | GO:0030322 | stabilization of membrane potential(GO:0030322) |
| 0.3 | 1.1 | GO:0010760 | negative regulation of macrophage chemotaxis(GO:0010760) |
| 0.3 | 4.9 | GO:0045199 | maintenance of apical/basal cell polarity(GO:0035090) maintenance of epithelial cell apical/basal polarity(GO:0045199) |
| 0.3 | 2.2 | GO:0070236 | regulation of activation-induced cell death of T cells(GO:0070235) negative regulation of activation-induced cell death of T cells(GO:0070236) |
| 0.3 | 0.8 | GO:0060278 | regulation of ovulation(GO:0060278) positive regulation of ovulation(GO:0060279) |
| 0.3 | 1.6 | GO:0036112 | medium-chain fatty-acyl-CoA metabolic process(GO:0036112) |
| 0.3 | 2.6 | GO:0001574 | ganglioside biosynthetic process(GO:0001574) |
| 0.3 | 0.8 | GO:0006391 | transcription initiation from mitochondrial promoter(GO:0006391) |
| 0.3 | 6.6 | GO:2000001 | regulation of DNA damage checkpoint(GO:2000001) |
| 0.2 | 1.0 | GO:0042710 | biofilm formation(GO:0042710) single-species biofilm formation(GO:0044010) single-species biofilm formation in or on host organism(GO:0044407) regulation of single-species biofilm formation(GO:1900190) negative regulation of single-species biofilm formation(GO:1900191) regulation of single-species biofilm formation in or on host organism(GO:1900228) negative regulation of single-species biofilm formation in or on host organism(GO:1900229) |
| 0.2 | 2.2 | GO:0043619 | regulation of transcription from RNA polymerase II promoter in response to oxidative stress(GO:0043619) |
| 0.2 | 1.0 | GO:0006049 | UDP-N-acetylglucosamine catabolic process(GO:0006049) |
| 0.2 | 0.7 | GO:1904383 | response to sodium phosphate(GO:1904383) |
| 0.2 | 2.8 | GO:0006824 | cobalt ion transport(GO:0006824) |
| 0.2 | 0.9 | GO:0035407 | histone H3-T11 phosphorylation(GO:0035407) |
| 0.2 | 4.3 | GO:0008535 | respiratory chain complex IV assembly(GO:0008535) |
| 0.2 | 0.9 | GO:0032290 | peripheral nervous system myelin formation(GO:0032290) |
| 0.2 | 0.7 | GO:1901674 | histone H3-K27 acetylation(GO:0043974) regulation of histone H3-K27 acetylation(GO:1901674) |
| 0.2 | 2.9 | GO:0040016 | embryonic cleavage(GO:0040016) |
| 0.2 | 0.7 | GO:2000525 | regulation of T cell costimulation(GO:2000523) positive regulation of T cell costimulation(GO:2000525) |
| 0.2 | 5.2 | GO:0050855 | regulation of B cell receptor signaling pathway(GO:0050855) |
| 0.2 | 0.6 | GO:0090158 | endoplasmic reticulum membrane organization(GO:0090158) |
| 0.2 | 1.9 | GO:0006167 | AMP biosynthetic process(GO:0006167) |
| 0.2 | 2.1 | GO:0035871 | protein K11-linked deubiquitination(GO:0035871) |
| 0.2 | 3.5 | GO:1903830 | magnesium ion transmembrane transport(GO:1903830) |
| 0.2 | 1.4 | GO:0002051 | osteoblast fate commitment(GO:0002051) |
| 0.2 | 0.6 | GO:0002949 | tRNA threonylcarbamoyladenosine modification(GO:0002949) |
| 0.2 | 1.8 | GO:0036066 | protein O-linked fucosylation(GO:0036066) |
| 0.2 | 0.9 | GO:0051643 | endoplasmic reticulum localization(GO:0051643) |
| 0.2 | 1.6 | GO:0007042 | lysosomal lumen acidification(GO:0007042) |
| 0.2 | 1.0 | GO:1903232 | melanosome assembly(GO:1903232) |
| 0.2 | 1.8 | GO:0006685 | sphingomyelin catabolic process(GO:0006685) |
| 0.2 | 2.2 | GO:0007175 | negative regulation of epidermal growth factor-activated receptor activity(GO:0007175) |
| 0.1 | 1.8 | GO:0052697 | flavonoid glucuronidation(GO:0052696) xenobiotic glucuronidation(GO:0052697) |
| 0.1 | 0.6 | GO:1990086 | lens fiber cell apoptotic process(GO:1990086) |
| 0.1 | 0.9 | GO:0031438 | negative regulation of mRNA cleavage(GO:0031438) negative regulation of mRNA endonucleolytic cleavage involved in unfolded protein response(GO:1904721) |
| 0.1 | 2.1 | GO:0048298 | regulation of isotype switching to IgA isotypes(GO:0048296) positive regulation of isotype switching to IgA isotypes(GO:0048298) |
| 0.1 | 1.2 | GO:0032776 | DNA methylation on cytosine(GO:0032776) |
| 0.1 | 1.1 | GO:0001887 | selenium compound metabolic process(GO:0001887) |
| 0.1 | 0.4 | GO:0036378 | calcitriol biosynthetic process from calciol(GO:0036378) |
| 0.1 | 2.7 | GO:0019371 | cyclooxygenase pathway(GO:0019371) |
| 0.1 | 0.9 | GO:0001550 | ovarian cumulus expansion(GO:0001550) fused antrum stage(GO:0048165) negative regulation of chondrocyte proliferation(GO:1902731) |
| 0.1 | 1.6 | GO:0046415 | urate metabolic process(GO:0046415) |
| 0.1 | 0.7 | GO:0006931 | substrate-dependent cell migration, cell attachment to substrate(GO:0006931) |
| 0.1 | 2.2 | GO:0017121 | phospholipid scrambling(GO:0017121) |
| 0.1 | 0.8 | GO:0033211 | adiponectin-activated signaling pathway(GO:0033211) |
| 0.1 | 1.2 | GO:0016576 | histone dephosphorylation(GO:0016576) |
| 0.1 | 0.3 | GO:0043449 | cellular alkene metabolic process(GO:0043449) |
| 0.1 | 0.9 | GO:0070166 | enamel mineralization(GO:0070166) |
| 0.1 | 2.5 | GO:0070828 | heterochromatin organization(GO:0070828) |
| 0.1 | 5.6 | GO:0006730 | one-carbon metabolic process(GO:0006730) |
| 0.1 | 1.2 | GO:0042373 | vitamin K metabolic process(GO:0042373) |
| 0.1 | 1.6 | GO:0018298 | protein-chromophore linkage(GO:0018298) |
| 0.1 | 0.6 | GO:0035803 | egg coat formation(GO:0035803) |
| 0.1 | 1.0 | GO:2000766 | negative regulation of cytoplasmic translation(GO:2000766) |
| 0.1 | 0.5 | GO:0071051 | polyadenylation-dependent snoRNA 3'-end processing(GO:0071051) |
| 0.1 | 0.8 | GO:0045040 | protein import into mitochondrial outer membrane(GO:0045040) |
| 0.1 | 2.3 | GO:0000185 | activation of MAPKKK activity(GO:0000185) |
| 0.1 | 1.0 | GO:0090043 | regulation of tubulin deacetylation(GO:0090043) |
| 0.1 | 0.9 | GO:0006268 | DNA unwinding involved in DNA replication(GO:0006268) |
| 0.1 | 0.5 | GO:2001107 | negative regulation of establishment of T cell polarity(GO:1903904) negative regulation of Rho guanyl-nucleotide exchange factor activity(GO:2001107) |
| 0.1 | 0.5 | GO:0035356 | cellular triglyceride homeostasis(GO:0035356) |
| 0.1 | 0.4 | GO:0050902 | leukocyte adhesive activation(GO:0050902) |
| 0.1 | 1.7 | GO:0033540 | fatty acid beta-oxidation using acyl-CoA oxidase(GO:0033540) |
| 0.1 | 0.8 | GO:0001996 | positive regulation of heart rate by epinephrine-norepinephrine(GO:0001996) |
| 0.1 | 3.9 | GO:0080171 | lysosome organization(GO:0007040) lytic vacuole organization(GO:0080171) |
| 0.1 | 2.8 | GO:1901522 | positive regulation of transcription from RNA polymerase II promoter involved in cellular response to chemical stimulus(GO:1901522) |
| 0.1 | 1.6 | GO:2001046 | positive regulation of integrin-mediated signaling pathway(GO:2001046) |
| 0.1 | 0.7 | GO:0046459 | short-chain fatty acid metabolic process(GO:0046459) |
| 0.1 | 0.7 | GO:0006707 | cholesterol catabolic process(GO:0006707) sterol catabolic process(GO:0016127) |
| 0.1 | 4.8 | GO:0010761 | fibroblast migration(GO:0010761) |
| 0.1 | 2.7 | GO:0043252 | sodium-independent organic anion transport(GO:0043252) |
| 0.1 | 1.1 | GO:0042340 | keratan sulfate catabolic process(GO:0042340) |
| 0.1 | 2.0 | GO:0090083 | regulation of inclusion body assembly(GO:0090083) |
| 0.1 | 1.7 | GO:0072321 | chaperone-mediated protein transport(GO:0072321) |
| 0.1 | 5.4 | GO:0050881 | multicellular organismal movement(GO:0050879) musculoskeletal movement(GO:0050881) |
| 0.1 | 1.1 | GO:0008340 | determination of adult lifespan(GO:0008340) |
| 0.1 | 2.4 | GO:0034080 | chromatin remodeling at centromere(GO:0031055) CENP-A containing nucleosome assembly(GO:0034080) CENP-A containing chromatin organization(GO:0061641) |
| 0.1 | 1.4 | GO:0032354 | response to follicle-stimulating hormone(GO:0032354) |
| 0.1 | 0.5 | GO:1903433 | regulation of constitutive secretory pathway(GO:1903433) |
| 0.1 | 3.0 | GO:0010039 | response to iron ion(GO:0010039) |
| 0.1 | 3.8 | GO:0001895 | retina homeostasis(GO:0001895) |
| 0.1 | 1.0 | GO:0051256 | mitotic spindle midzone assembly(GO:0051256) |
| 0.1 | 0.4 | GO:0098967 | exocytic insertion of neurotransmitter receptor to plasma membrane(GO:0098881) exocytic insertion of neurotransmitter receptor to postsynaptic membrane(GO:0098967) |
| 0.1 | 1.4 | GO:0006895 | Golgi to endosome transport(GO:0006895) |
| 0.1 | 0.6 | GO:0071872 | cellular response to epinephrine stimulus(GO:0071872) |
| 0.1 | 2.1 | GO:0032467 | positive regulation of cytokinesis(GO:0032467) |
| 0.1 | 2.8 | GO:0030212 | hyaluronan metabolic process(GO:0030212) |
| 0.1 | 2.0 | GO:0008053 | mitochondrial fusion(GO:0008053) |
| 0.1 | 0.6 | GO:0060363 | cranial suture morphogenesis(GO:0060363) |
| 0.1 | 1.1 | GO:0015721 | bile acid and bile salt transport(GO:0015721) |
| 0.1 | 8.0 | GO:0002377 | immunoglobulin production(GO:0002377) |
| 0.1 | 0.7 | GO:0045475 | locomotor rhythm(GO:0045475) |
| 0.1 | 3.9 | GO:1902017 | regulation of cilium assembly(GO:1902017) |
| 0.0 | 0.6 | GO:2000096 | positive regulation of Wnt signaling pathway, planar cell polarity pathway(GO:2000096) |
| 0.0 | 1.0 | GO:0007095 | mitotic G2 DNA damage checkpoint(GO:0007095) |
| 0.0 | 4.5 | GO:0050672 | negative regulation of mononuclear cell proliferation(GO:0032945) negative regulation of lymphocyte proliferation(GO:0050672) |
| 0.0 | 3.1 | GO:1904893 | negative regulation of JAK-STAT cascade(GO:0046426) negative regulation of STAT cascade(GO:1904893) |
| 0.0 | 1.4 | GO:0007398 | ectoderm development(GO:0007398) |
| 0.0 | 0.4 | GO:0006346 | methylation-dependent chromatin silencing(GO:0006346) |
| 0.0 | 0.5 | GO:0001867 | complement activation, lectin pathway(GO:0001867) |
| 0.0 | 1.7 | GO:0046676 | negative regulation of insulin secretion(GO:0046676) |
| 0.0 | 1.5 | GO:0016578 | histone deubiquitination(GO:0016578) |
| 0.0 | 5.2 | GO:0035335 | peptidyl-tyrosine dephosphorylation(GO:0035335) |
| 0.0 | 0.5 | GO:2001288 | positive regulation of caveolin-mediated endocytosis(GO:2001288) |
| 0.0 | 0.8 | GO:0030277 | maintenance of gastrointestinal epithelium(GO:0030277) |
| 0.0 | 0.8 | GO:0034204 | lipid translocation(GO:0034204) phospholipid translocation(GO:0045332) |
| 0.0 | 4.9 | GO:0002062 | chondrocyte differentiation(GO:0002062) |
| 0.0 | 3.3 | GO:0002819 | regulation of adaptive immune response(GO:0002819) |
| 0.0 | 0.2 | GO:0050893 | sensory processing(GO:0050893) |
| 0.0 | 0.6 | GO:0002360 | T cell lineage commitment(GO:0002360) |
| 0.0 | 4.0 | GO:0051225 | spindle assembly(GO:0051225) |
| 0.0 | 0.7 | GO:0043011 | myeloid dendritic cell differentiation(GO:0043011) |
| 0.0 | 2.9 | GO:0070527 | platelet aggregation(GO:0070527) |
| 0.0 | 0.2 | GO:0061143 | alveolar primary septum development(GO:0061143) |
| 0.0 | 2.5 | GO:0006749 | glutathione metabolic process(GO:0006749) |
| 0.0 | 0.9 | GO:0046339 | diacylglycerol metabolic process(GO:0046339) |
| 0.0 | 0.5 | GO:0042737 | drug catabolic process(GO:0042737) |
| 0.0 | 0.1 | GO:0038043 | interleukin-5-mediated signaling pathway(GO:0038043) |
| 0.0 | 0.9 | GO:0033198 | response to ATP(GO:0033198) purinergic nucleotide receptor signaling pathway(GO:0035590) |
| 0.0 | 4.1 | GO:1990830 | response to leukemia inhibitory factor(GO:1990823) cellular response to leukemia inhibitory factor(GO:1990830) |
| 0.0 | 0.7 | GO:0048147 | negative regulation of fibroblast proliferation(GO:0048147) |
| 0.0 | 1.3 | GO:0010862 | positive regulation of pathway-restricted SMAD protein phosphorylation(GO:0010862) |
| 0.0 | 0.2 | GO:0035879 | plasma membrane lactate transport(GO:0035879) |
| 0.0 | 0.9 | GO:0007520 | myoblast fusion(GO:0007520) |
| 0.0 | 4.4 | GO:0007519 | skeletal muscle tissue development(GO:0007519) |
| 0.0 | 0.5 | GO:0005513 | detection of calcium ion(GO:0005513) |
| 0.0 | 0.8 | GO:0042554 | superoxide anion generation(GO:0042554) |
| 0.0 | 0.4 | GO:0051639 | actin filament network formation(GO:0051639) |
| 0.0 | 1.1 | GO:0048384 | retinoic acid receptor signaling pathway(GO:0048384) |
| 0.0 | 1.5 | GO:0006958 | humoral immune response mediated by circulating immunoglobulin(GO:0002455) complement activation, classical pathway(GO:0006958) |
| 0.0 | 1.2 | GO:0018279 | protein N-linked glycosylation via asparagine(GO:0018279) |
| 0.0 | 1.9 | GO:0002181 | cytoplasmic translation(GO:0002181) |
| 0.0 | 0.4 | GO:0007597 | blood coagulation, intrinsic pathway(GO:0007597) |
| 0.0 | 0.1 | GO:0006015 | 5-phosphoribose 1-diphosphate biosynthetic process(GO:0006015) 5-phosphoribose 1-diphosphate metabolic process(GO:0046391) |
| 0.0 | 2.4 | GO:0008203 | cholesterol metabolic process(GO:0008203) |
| 0.0 | 0.3 | GO:0045292 | mRNA cis splicing, via spliceosome(GO:0045292) |
| 0.0 | 0.4 | GO:0071425 | hematopoietic stem cell proliferation(GO:0071425) |
| 0.0 | 0.2 | GO:0010719 | negative regulation of epithelial to mesenchymal transition(GO:0010719) |
| 0.0 | 0.1 | GO:0006995 | cellular response to nitrogen starvation(GO:0006995) cellular response to nitrogen levels(GO:0043562) |
| 0.0 | 0.8 | GO:0006501 | C-terminal protein lipidation(GO:0006501) |
| 0.0 | 1.3 | GO:0000070 | mitotic sister chromatid segregation(GO:0000070) |
| 0.0 | 0.4 | GO:0000462 | maturation of SSU-rRNA from tricistronic rRNA transcript (SSU-rRNA, 5.8S rRNA, LSU-rRNA)(GO:0000462) |
| 0.0 | 1.3 | GO:0002576 | platelet degranulation(GO:0002576) |
| 0.0 | 2.0 | GO:0030041 | actin filament polymerization(GO:0030041) |
| 0.0 | 0.1 | GO:0032328 | alanine transport(GO:0032328) |
| 0.0 | 0.1 | GO:0046598 | positive regulation of viral entry into host cell(GO:0046598) |
Gene overrepresentation in cellular component category:
| Log-likelihood per target | Total log-likelihood | Term | Description |
|---|---|---|---|
| 1.3 | 4.0 | GO:1990622 | CHOP-ATF3 complex(GO:1990622) |
| 1.3 | 18.7 | GO:0005862 | muscle thin filament tropomyosin(GO:0005862) |
| 1.3 | 6.6 | GO:0032299 | ribonuclease H2 complex(GO:0032299) |
| 1.0 | 4.0 | GO:0030895 | apolipoprotein B mRNA editing enzyme complex(GO:0030895) |
| 0.8 | 3.2 | GO:0005602 | complement component C1 complex(GO:0005602) |
| 0.6 | 9.2 | GO:0045277 | respiratory chain complex IV(GO:0045277) |
| 0.5 | 2.1 | GO:0070695 | FHF complex(GO:0070695) |
| 0.5 | 3.4 | GO:1990037 | Lewy body core(GO:1990037) |
| 0.5 | 4.2 | GO:0070652 | HAUS complex(GO:0070652) |
| 0.5 | 1.4 | GO:0005592 | collagen type XI trimer(GO:0005592) |
| 0.4 | 4.9 | GO:0030870 | Mre11 complex(GO:0030870) |
| 0.4 | 5.9 | GO:0005833 | hemoglobin complex(GO:0005833) |
| 0.4 | 4.1 | GO:0042105 | alpha-beta T cell receptor complex(GO:0042105) |
| 0.4 | 3.3 | GO:0070083 | clathrin-sculpted monoamine transport vesicle(GO:0070081) clathrin-sculpted monoamine transport vesicle membrane(GO:0070083) |
| 0.4 | 2.5 | GO:0036021 | endolysosome lumen(GO:0036021) |
| 0.3 | 1.7 | GO:0045257 | mitochondrial respiratory chain complex II, succinate dehydrogenase complex (ubiquinone)(GO:0005749) succinate dehydrogenase complex (ubiquinone)(GO:0045257) respiratory chain complex II(GO:0045273) succinate dehydrogenase complex(GO:0045281) fumarate reductase complex(GO:0045283) |
| 0.3 | 2.9 | GO:0036449 | microtubule minus-end(GO:0036449) |
| 0.3 | 14.8 | GO:0042571 | immunoglobulin complex, circulating(GO:0042571) |
| 0.3 | 0.8 | GO:0043511 | inhibin complex(GO:0043511) inhibin A complex(GO:0043512) |
| 0.2 | 4.9 | GO:0014731 | spectrin-associated cytoskeleton(GO:0014731) |
| 0.2 | 1.0 | GO:0031905 | early endosome lumen(GO:0031905) |
| 0.2 | 1.3 | GO:1990635 | proximal dendrite(GO:1990635) |
| 0.2 | 1.7 | GO:0042719 | mitochondrial intermembrane space protein transporter complex(GO:0042719) |
| 0.2 | 2.6 | GO:0070938 | contractile ring(GO:0070938) |
| 0.2 | 18.8 | GO:0016459 | myosin complex(GO:0016459) |
| 0.2 | 11.4 | GO:0005844 | polysome(GO:0005844) |
| 0.2 | 1.4 | GO:0000138 | Golgi trans cisterna(GO:0000138) |
| 0.2 | 3.6 | GO:0005861 | troponin complex(GO:0005861) |
| 0.2 | 3.7 | GO:0005721 | pericentric heterochromatin(GO:0005721) |
| 0.2 | 1.8 | GO:0098799 | outer mitochondrial membrane protein complex(GO:0098799) |
| 0.2 | 1.6 | GO:0071541 | eukaryotic translation initiation factor 3 complex, eIF3m(GO:0071541) |
| 0.1 | 0.6 | GO:0032937 | SREBP-SCAP-Insig complex(GO:0032937) |
| 0.1 | 2.5 | GO:0000786 | nucleosome(GO:0000786) |
| 0.1 | 1.1 | GO:0005579 | membrane attack complex(GO:0005579) |
| 0.1 | 4.9 | GO:0031092 | platelet alpha granule membrane(GO:0031092) |
| 0.1 | 1.6 | GO:0036057 | filtration diaphragm(GO:0036056) slit diaphragm(GO:0036057) |
| 0.1 | 1.3 | GO:0005638 | lamin filament(GO:0005638) |
| 0.1 | 2.3 | GO:0031089 | platelet dense granule lumen(GO:0031089) |
| 0.1 | 0.6 | GO:0000408 | EKC/KEOPS complex(GO:0000408) |
| 0.1 | 1.2 | GO:0070449 | elongin complex(GO:0070449) |
| 0.1 | 0.9 | GO:0035032 | phosphatidylinositol 3-kinase complex, class III(GO:0035032) |
| 0.1 | 1.6 | GO:0000800 | lateral element(GO:0000800) |
| 0.1 | 2.0 | GO:0097025 | MPP7-DLG1-LIN7 complex(GO:0097025) |
| 0.1 | 1.1 | GO:0043203 | axon hillock(GO:0043203) |
| 0.1 | 3.5 | GO:0009925 | basal plasma membrane(GO:0009925) |
| 0.1 | 0.8 | GO:0016012 | dystroglycan complex(GO:0016011) sarcoglycan complex(GO:0016012) |
| 0.1 | 3.2 | GO:0080008 | Cul4-RING E3 ubiquitin ligase complex(GO:0080008) |
| 0.1 | 0.8 | GO:0032010 | phagolysosome(GO:0032010) |
| 0.1 | 0.4 | GO:0034388 | Pwp2p-containing subcomplex of 90S preribosome(GO:0034388) |
| 0.1 | 0.4 | GO:1990796 | photoreceptor cell terminal bouton(GO:1990796) |
| 0.1 | 4.4 | GO:0005782 | peroxisomal matrix(GO:0005782) microbody lumen(GO:0031907) |
| 0.1 | 0.9 | GO:1990712 | HFE-transferrin receptor complex(GO:1990712) |
| 0.1 | 0.5 | GO:0060171 | stereocilium membrane(GO:0060171) |
| 0.1 | 0.9 | GO:0042555 | MCM complex(GO:0042555) |
| 0.1 | 1.6 | GO:0090665 | dystrophin-associated glycoprotein complex(GO:0016010) glycoprotein complex(GO:0090665) |
| 0.1 | 1.4 | GO:0071141 | SMAD protein complex(GO:0071141) |
| 0.1 | 0.7 | GO:0042589 | zymogen granule membrane(GO:0042589) |
| 0.1 | 1.3 | GO:0035371 | microtubule plus-end(GO:0035371) |
| 0.1 | 1.6 | GO:0097381 | photoreceptor disc membrane(GO:0097381) |
| 0.0 | 6.7 | GO:0032993 | protein-DNA complex(GO:0032993) |
| 0.0 | 9.7 | GO:0090575 | RNA polymerase II transcription factor complex(GO:0090575) |
| 0.0 | 1.0 | GO:1990124 | messenger ribonucleoprotein complex(GO:1990124) |
| 0.0 | 0.9 | GO:0043220 | Schmidt-Lanterman incisure(GO:0043220) |
| 0.0 | 0.9 | GO:0005639 | integral component of nuclear inner membrane(GO:0005639) intrinsic component of nuclear inner membrane(GO:0031229) nuclear membrane part(GO:0044453) |
| 0.0 | 0.9 | GO:0035098 | ESC/E(Z) complex(GO:0035098) |
| 0.0 | 0.2 | GO:0061617 | MICOS complex(GO:0061617) |
| 0.0 | 0.5 | GO:0000176 | nuclear exosome (RNase complex)(GO:0000176) |
| 0.0 | 6.4 | GO:0001650 | fibrillar center(GO:0001650) |
| 0.0 | 2.7 | GO:0001750 | photoreceptor outer segment(GO:0001750) |
| 0.0 | 2.8 | GO:1904724 | tertiary granule lumen(GO:1904724) |
| 0.0 | 0.6 | GO:0005952 | cAMP-dependent protein kinase complex(GO:0005952) |
| 0.0 | 5.2 | GO:0031225 | anchored component of membrane(GO:0031225) |
| 0.0 | 2.9 | GO:0005604 | basement membrane(GO:0005604) |
| 0.0 | 0.5 | GO:0036038 | MKS complex(GO:0036038) |
| 0.0 | 4.1 | GO:0008076 | voltage-gated potassium channel complex(GO:0008076) potassium channel complex(GO:0034705) |
| 0.0 | 1.0 | GO:0042629 | mast cell granule(GO:0042629) |
| 0.0 | 1.7 | GO:0030880 | DNA-directed RNA polymerase complex(GO:0000428) RNA polymerase complex(GO:0030880) |
| 0.0 | 2.4 | GO:0035579 | specific granule membrane(GO:0035579) |
| 0.0 | 0.4 | GO:0001931 | uropod(GO:0001931) cell trailing edge(GO:0031254) |
| 0.0 | 2.0 | GO:0042734 | presynaptic membrane(GO:0042734) |
| 0.0 | 1.0 | GO:0045171 | intercellular bridge(GO:0045171) |
| 0.0 | 1.9 | GO:0022625 | cytosolic large ribosomal subunit(GO:0022625) |
| 0.0 | 0.5 | GO:0005892 | acetylcholine-gated channel complex(GO:0005892) |
| 0.0 | 2.0 | GO:0005884 | actin filament(GO:0005884) |
| 0.0 | 1.0 | GO:0005581 | collagen trimer(GO:0005581) |
| 0.0 | 0.4 | GO:0090545 | NuRD complex(GO:0016581) CHD-type complex(GO:0090545) |
| 0.0 | 1.3 | GO:0031093 | platelet alpha granule lumen(GO:0031093) |
| 0.0 | 0.6 | GO:0015934 | large ribosomal subunit(GO:0015934) |
| 0.0 | 0.2 | GO:0017146 | NMDA selective glutamate receptor complex(GO:0017146) |
| 0.0 | 0.8 | GO:0005891 | voltage-gated calcium channel complex(GO:0005891) |
| 0.0 | 2.3 | GO:0005578 | proteinaceous extracellular matrix(GO:0005578) |
| 0.0 | 0.0 | GO:0099634 | postsynaptic specialization membrane(GO:0099634) |
| 0.0 | 2.4 | GO:0009897 | external side of plasma membrane(GO:0009897) |
Gene overrepresentation in molecular function category:
| Log-likelihood per target | Total log-likelihood | Term | Description |
|---|---|---|---|
| 2.2 | 13.0 | GO:0032038 | myosin II heavy chain binding(GO:0032038) |
| 1.6 | 6.2 | GO:0032810 | sterol response element binding(GO:0032810) |
| 1.4 | 5.7 | GO:0015254 | glycerol channel activity(GO:0015254) |
| 1.1 | 7.4 | GO:0016403 | dimethylargininase activity(GO:0016403) |
| 0.9 | 7.5 | GO:0004111 | creatine kinase activity(GO:0004111) |
| 0.8 | 3.3 | GO:0015222 | serotonin transmembrane transporter activity(GO:0015222) |
| 0.8 | 4.7 | GO:0005353 | fructose transmembrane transporter activity(GO:0005353) |
| 0.7 | 2.2 | GO:0004874 | aryl hydrocarbon receptor activity(GO:0004874) |
| 0.7 | 2.8 | GO:0004886 | 9-cis retinoic acid receptor activity(GO:0004886) |
| 0.6 | 2.5 | GO:0004909 | interleukin-1, Type I, activating receptor activity(GO:0004909) |
| 0.6 | 4.8 | GO:0070892 | lipoteichoic acid receptor activity(GO:0070892) |
| 0.6 | 6.6 | GO:0004523 | RNA-DNA hybrid ribonuclease activity(GO:0004523) |
| 0.6 | 3.6 | GO:0030172 | troponin C binding(GO:0030172) |
| 0.5 | 2.7 | GO:0004666 | prostaglandin-endoperoxide synthase activity(GO:0004666) |
| 0.5 | 1.6 | GO:0009032 | thymidine phosphorylase activity(GO:0009032) pyrimidine-nucleoside phosphorylase activity(GO:0016154) |
| 0.5 | 1.6 | GO:0098808 | mRNA cap binding(GO:0098808) |
| 0.5 | 2.0 | GO:0052595 | tryptamine:oxygen oxidoreductase (deaminating) activity(GO:0052593) aminoacetone:oxygen oxidoreductase(deaminating) activity(GO:0052594) aliphatic-amine oxidase activity(GO:0052595) phenethylamine:oxygen oxidoreductase (deaminating) activity(GO:0052596) |
| 0.5 | 3.5 | GO:0004499 | N,N-dimethylaniline monooxygenase activity(GO:0004499) |
| 0.5 | 2.4 | GO:0070576 | vitamin D 24-hydroxylase activity(GO:0070576) |
| 0.5 | 3.3 | GO:0004962 | endothelin receptor activity(GO:0004962) |
| 0.4 | 1.7 | GO:0008177 | succinate dehydrogenase (ubiquinone) activity(GO:0008177) |
| 0.4 | 4.9 | GO:0070087 | chromo shadow domain binding(GO:0070087) |
| 0.4 | 0.4 | GO:0070643 | vitamin D3 25-hydroxylase activity(GO:0030343) vitamin D 25-hydroxylase activity(GO:0070643) |
| 0.4 | 5.9 | GO:0005344 | oxygen transporter activity(GO:0005344) |
| 0.4 | 2.6 | GO:0003828 | alpha-N-acetylneuraminate alpha-2,8-sialyltransferase activity(GO:0003828) |
| 0.3 | 2.8 | GO:0004645 | phosphorylase activity(GO:0004645) |
| 0.3 | 3.4 | GO:0022841 | potassium ion leak channel activity(GO:0022841) |
| 0.3 | 3.3 | GO:0016721 | superoxide dismutase activity(GO:0004784) oxidoreductase activity, acting on superoxide radicals as acceptor(GO:0016721) |
| 0.3 | 1.0 | GO:0042947 | glucoside transmembrane transporter activity(GO:0042947) |
| 0.3 | 1.0 | GO:0035651 | AP-1 adaptor complex binding(GO:0035650) AP-3 adaptor complex binding(GO:0035651) |
| 0.3 | 9.2 | GO:0004129 | cytochrome-c oxidase activity(GO:0004129) heme-copper terminal oxidase activity(GO:0015002) oxidoreductase activity, acting on a heme group of donors, oxygen as acceptor(GO:0016676) |
| 0.3 | 5.6 | GO:0004089 | carbonate dehydratase activity(GO:0004089) |
| 0.3 | 0.8 | GO:0055100 | adiponectin binding(GO:0055100) |
| 0.3 | 1.1 | GO:0008449 | N-acetylglucosamine-6-sulfatase activity(GO:0008449) |
| 0.3 | 1.1 | GO:0008508 | bile acid:sodium symporter activity(GO:0008508) |
| 0.3 | 3.7 | GO:0051864 | histone demethylase activity (H3-K36 specific)(GO:0051864) |
| 0.3 | 5.3 | GO:0038187 | signaling pattern recognition receptor activity(GO:0008329) pattern recognition receptor activity(GO:0038187) |
| 0.2 | 4.9 | GO:0008093 | cytoskeletal adaptor activity(GO:0008093) |
| 0.2 | 14.8 | GO:0034987 | immunoglobulin receptor binding(GO:0034987) |
| 0.2 | 2.4 | GO:0070569 | uridylyltransferase activity(GO:0070569) |
| 0.2 | 2.2 | GO:0043426 | MRF binding(GO:0043426) |
| 0.2 | 1.0 | GO:0003827 | alpha-1,3-mannosylglycoprotein 2-beta-N-acetylglucosaminyltransferase activity(GO:0003827) |
| 0.2 | 2.9 | GO:0015174 | basic amino acid transmembrane transporter activity(GO:0015174) |
| 0.2 | 0.9 | GO:0035402 | histone kinase activity (H3-T11 specific)(GO:0035402) |
| 0.2 | 4.3 | GO:0008190 | eukaryotic initiation factor 4E binding(GO:0008190) |
| 0.2 | 23.1 | GO:0008307 | structural constituent of muscle(GO:0008307) |
| 0.2 | 0.7 | GO:0004980 | melanocyte-stimulating hormone receptor activity(GO:0004980) |
| 0.2 | 1.1 | GO:0061676 | importin-alpha family protein binding(GO:0061676) |
| 0.2 | 1.3 | GO:0016402 | pristanoyl-CoA oxidase activity(GO:0016402) |
| 0.2 | 1.9 | GO:0016842 | amidine-lyase activity(GO:0016842) |
| 0.2 | 3.5 | GO:0015095 | magnesium ion transmembrane transporter activity(GO:0015095) |
| 0.2 | 2.8 | GO:0031419 | cobalamin binding(GO:0031419) |
| 0.2 | 1.8 | GO:0004767 | sphingomyelin phosphodiesterase activity(GO:0004767) |
| 0.2 | 1.2 | GO:0047057 | oxidoreductase activity, acting on the CH-OH group of donors, disulfide as acceptor(GO:0016900) vitamin-K-epoxide reductase (warfarin-sensitive) activity(GO:0047057) |
| 0.2 | 1.4 | GO:0071253 | connexin binding(GO:0071253) |
| 0.2 | 1.2 | GO:0004873 | asialoglycoprotein receptor activity(GO:0004873) |
| 0.2 | 1.6 | GO:0043142 | single-stranded DNA-dependent ATPase activity(GO:0043142) |
| 0.2 | 1.6 | GO:0004321 | fatty-acyl-CoA synthase activity(GO:0004321) |
| 0.2 | 0.5 | GO:0004165 | dodecenoyl-CoA delta-isomerase activity(GO:0004165) |
| 0.2 | 1.4 | GO:0030020 | extracellular matrix structural constituent conferring tensile strength(GO:0030020) |
| 0.1 | 2.2 | GO:0017128 | phospholipid scramblase activity(GO:0017128) |
| 0.1 | 0.7 | GO:0004090 | carbonyl reductase (NADPH) activity(GO:0004090) |
| 0.1 | 1.6 | GO:0008020 | G-protein coupled photoreceptor activity(GO:0008020) |
| 0.1 | 1.2 | GO:0033192 | calmodulin-dependent protein phosphatase activity(GO:0033192) |
| 0.1 | 4.1 | GO:0019198 | transmembrane receptor protein tyrosine phosphatase activity(GO:0005001) transmembrane receptor protein phosphatase activity(GO:0019198) |
| 0.1 | 0.9 | GO:0060698 | endoribonuclease inhibitor activity(GO:0060698) |
| 0.1 | 0.6 | GO:0004910 | interleukin-1, Type II, blocking receptor activity(GO:0004910) |
| 0.1 | 2.1 | GO:0008320 | protein transmembrane transporter activity(GO:0008320) |
| 0.1 | 3.2 | GO:0070410 | co-SMAD binding(GO:0070410) |
| 0.1 | 0.8 | GO:0016176 | superoxide-generating NADPH oxidase activator activity(GO:0016176) |
| 0.1 | 0.8 | GO:0070697 | activin receptor binding(GO:0070697) type II activin receptor binding(GO:0070699) |
| 0.1 | 0.8 | GO:0015232 | heme transporter activity(GO:0015232) |
| 0.1 | 11.6 | GO:0003730 | mRNA 3'-UTR binding(GO:0003730) |
| 0.1 | 2.4 | GO:0001223 | transcription coactivator binding(GO:0001223) |
| 0.1 | 0.9 | GO:0031685 | G-protein coupled adenosine receptor activity(GO:0001609) adenosine receptor binding(GO:0031685) |
| 0.1 | 0.8 | GO:0015321 | sodium-dependent phosphate transmembrane transporter activity(GO:0015321) |
| 0.1 | 2.1 | GO:0005537 | mannose binding(GO:0005537) |
| 0.1 | 2.5 | GO:0003746 | translation elongation factor activity(GO:0003746) |
| 0.1 | 1.1 | GO:0008430 | selenium binding(GO:0008430) |
| 0.1 | 1.6 | GO:0008349 | MAP kinase kinase kinase kinase activity(GO:0008349) |
| 0.1 | 5.1 | GO:0008138 | protein tyrosine/serine/threonine phosphatase activity(GO:0008138) |
| 0.1 | 2.7 | GO:0015347 | sodium-independent organic anion transmembrane transporter activity(GO:0015347) |
| 0.1 | 1.3 | GO:0030247 | pattern binding(GO:0001871) polysaccharide binding(GO:0030247) |
| 0.1 | 3.1 | GO:0015269 | calcium-activated potassium channel activity(GO:0015269) |
| 0.1 | 0.9 | GO:0035381 | extracellular ATP-gated cation channel activity(GO:0004931) ATP-gated ion channel activity(GO:0035381) |
| 0.1 | 2.5 | GO:0001968 | fibronectin binding(GO:0001968) |
| 0.1 | 0.9 | GO:0005025 | transforming growth factor beta receptor activity, type I(GO:0005025) |
| 0.1 | 1.1 | GO:0008140 | cAMP response element binding protein binding(GO:0008140) |
| 0.1 | 0.9 | GO:0019911 | structural constituent of myelin sheath(GO:0019911) |
| 0.1 | 2.1 | GO:0051959 | dynein light intermediate chain binding(GO:0051959) |
| 0.1 | 0.6 | GO:0032190 | acrosin binding(GO:0032190) |
| 0.1 | 0.5 | GO:0008158 | hedgehog receptor activity(GO:0008158) |
| 0.1 | 0.7 | GO:0001135 | transcription factor activity, RNA polymerase II transcription factor recruiting(GO:0001135) |
| 0.1 | 1.7 | GO:0070064 | proline-rich region binding(GO:0070064) |
| 0.1 | 1.1 | GO:0070006 | metalloaminopeptidase activity(GO:0070006) |
| 0.1 | 1.8 | GO:0001972 | retinoic acid binding(GO:0001972) |
| 0.1 | 0.9 | GO:0004143 | diacylglycerol kinase activity(GO:0004143) |
| 0.1 | 0.2 | GO:0071532 | ankyrin repeat binding(GO:0071532) |
| 0.0 | 1.3 | GO:0005521 | lamin binding(GO:0005521) |
| 0.0 | 6.2 | GO:0004222 | metalloendopeptidase activity(GO:0004222) |
| 0.0 | 3.1 | GO:0004725 | protein tyrosine phosphatase activity(GO:0004725) |
| 0.0 | 0.4 | GO:0050544 | icosanoid binding(GO:0050542) arachidonic acid binding(GO:0050544) fatty acid derivative binding(GO:1901567) |
| 0.0 | 2.6 | GO:0016831 | carboxy-lyase activity(GO:0016831) |
| 0.0 | 1.0 | GO:0008574 | ATP-dependent microtubule motor activity, plus-end-directed(GO:0008574) |
| 0.0 | 0.6 | GO:0004691 | cAMP-dependent protein kinase activity(GO:0004691) |
| 0.0 | 2.5 | GO:0050840 | extracellular matrix binding(GO:0050840) |
| 0.0 | 2.4 | GO:0005544 | calcium-dependent phospholipid binding(GO:0005544) |
| 0.0 | 1.7 | GO:0043425 | bHLH transcription factor binding(GO:0043425) |
| 0.0 | 1.1 | GO:0001784 | phosphotyrosine binding(GO:0001784) |
| 0.0 | 1.3 | GO:0043539 | protein serine/threonine kinase activator activity(GO:0043539) |
| 0.0 | 1.7 | GO:0034062 | DNA-directed RNA polymerase activity(GO:0003899) RNA polymerase activity(GO:0034062) |
| 0.0 | 7.9 | GO:0004252 | serine-type endopeptidase activity(GO:0004252) |
| 0.0 | 4.0 | GO:0003725 | double-stranded RNA binding(GO:0003725) |
| 0.0 | 1.7 | GO:0051539 | 4 iron, 4 sulfur cluster binding(GO:0051539) |
| 0.0 | 2.3 | GO:0031491 | nucleosome binding(GO:0031491) |
| 0.0 | 0.1 | GO:0004914 | interleukin-5 receptor activity(GO:0004914) |
| 0.0 | 0.5 | GO:0019871 | sodium channel inhibitor activity(GO:0019871) |
| 0.0 | 0.8 | GO:0004012 | phospholipid-translocating ATPase activity(GO:0004012) |
| 0.0 | 1.5 | GO:0018024 | histone-lysine N-methyltransferase activity(GO:0018024) |
| 0.0 | 0.2 | GO:0004614 | phosphoglucomutase activity(GO:0004614) |
| 0.0 | 0.8 | GO:0031698 | beta-2 adrenergic receptor binding(GO:0031698) |
| 0.0 | 1.3 | GO:0003777 | microtubule motor activity(GO:0003777) |
| 0.0 | 0.8 | GO:0051059 | NF-kappaB binding(GO:0051059) |
| 0.0 | 1.1 | GO:0005184 | neuropeptide hormone activity(GO:0005184) |
| 0.0 | 0.6 | GO:0008242 | omega peptidase activity(GO:0008242) |
| 0.0 | 3.1 | GO:0004860 | protein kinase inhibitor activity(GO:0004860) |
| 0.0 | 5.2 | GO:0001046 | core promoter sequence-specific DNA binding(GO:0001046) |
| 0.0 | 4.0 | GO:0001078 | transcriptional repressor activity, RNA polymerase II core promoter proximal region sequence-specific binding(GO:0001078) |
| 0.0 | 0.9 | GO:0004003 | ATP-dependent DNA helicase activity(GO:0004003) |
| 0.0 | 3.3 | GO:0035591 | signaling adaptor activity(GO:0035591) |
| 0.0 | 0.8 | GO:0042162 | telomeric DNA binding(GO:0042162) |
| 0.0 | 1.3 | GO:0005160 | transforming growth factor beta receptor binding(GO:0005160) |
| 0.0 | 1.1 | GO:0005164 | tumor necrosis factor receptor binding(GO:0005164) |
| 0.0 | 1.1 | GO:0008009 | chemokine activity(GO:0008009) |
| 0.0 | 0.4 | GO:0070182 | DNA polymerase binding(GO:0070182) |
| 0.0 | 2.3 | GO:0001227 | transcriptional repressor activity, RNA polymerase II transcription regulatory region sequence-specific binding(GO:0001227) |
| 0.0 | 0.5 | GO:0005328 | neurotransmitter:sodium symporter activity(GO:0005328) |
| 0.0 | 5.9 | GO:0000978 | RNA polymerase II core promoter proximal region sequence-specific DNA binding(GO:0000978) |
| 0.0 | 0.2 | GO:0015129 | lactate transmembrane transporter activity(GO:0015129) |
| 0.0 | 0.5 | GO:0015278 | calcium-release channel activity(GO:0015278) ligand-gated calcium channel activity(GO:0099604) |
| 0.0 | 0.5 | GO:0022848 | acetylcholine-gated cation channel activity(GO:0022848) acetylcholine binding(GO:0042166) |
| 0.0 | 2.3 | GO:0019838 | growth factor binding(GO:0019838) |
| 0.0 | 0.6 | GO:0005484 | SNAP receptor activity(GO:0005484) |
| 0.0 | 0.4 | GO:0030515 | snoRNA binding(GO:0030515) |
| 0.0 | 0.5 | GO:0000175 | 3'-5'-exoribonuclease activity(GO:0000175) |
| 0.0 | 3.5 | GO:0005516 | calmodulin binding(GO:0005516) |
| 0.0 | 0.2 | GO:0047617 | acyl-CoA hydrolase activity(GO:0047617) |
| 0.0 | 0.9 | GO:0004712 | protein serine/threonine/tyrosine kinase activity(GO:0004712) |
| 0.0 | 0.6 | GO:0001047 | core promoter binding(GO:0001047) |
| 0.0 | 0.2 | GO:0005132 | type I interferon receptor binding(GO:0005132) |
| 0.0 | 1.9 | GO:0008234 | cysteine-type peptidase activity(GO:0008234) |
| 0.0 | 0.1 | GO:0004169 | dolichyl-phosphate-mannose-protein mannosyltransferase activity(GO:0004169) |
Gene overrepresentation in curated gene sets: canonical pathways category:
| Log-likelihood per target | Total log-likelihood | Term | Description |
|---|---|---|---|
| 0.2 | 9.0 | PID RXR VDR PATHWAY | RXR and RAR heterodimerization with other nuclear receptor |
| 0.1 | 13.3 | PID RB 1PATHWAY | Regulation of retinoblastoma protein |
| 0.1 | 4.9 | PID INTEGRIN2 PATHWAY | Beta2 integrin cell surface interactions |
| 0.1 | 2.2 | PID HIF1A PATHWAY | Hypoxic and oxygen homeostasis regulation of HIF-1-alpha |
| 0.1 | 0.9 | SA G2 AND M PHASES | Cdc25 activates the cdc2/cyclin B complex to induce the G2/M transition. |
| 0.1 | 1.4 | SA B CELL RECEPTOR COMPLEXES | Antigen binding to B cell receptors activates protein tyrosine kinases, such as the Src family, which ultimate activate MAP kinases. |
| 0.1 | 9.4 | PID AR PATHWAY | Coregulation of Androgen receptor activity |
| 0.1 | 1.4 | PID PDGFRA PATHWAY | PDGFR-alpha signaling pathway |
| 0.1 | 1.4 | PID ALK2 PATHWAY | ALK2 signaling events |
| 0.1 | 7.7 | PID SMAD2 3NUCLEAR PATHWAY | Regulation of nuclear SMAD2/3 signaling |
| 0.1 | 2.5 | PID AURORA A PATHWAY | Aurora A signaling |
| 0.1 | 5.0 | PID ILK PATHWAY | Integrin-linked kinase signaling |
| 0.1 | 3.8 | PID EPO PATHWAY | EPO signaling pathway |
| 0.1 | 2.5 | ST P38 MAPK PATHWAY | p38 MAPK Pathway |
| 0.1 | 2.1 | PID FOXO PATHWAY | FoxO family signaling |
| 0.1 | 2.5 | PID ATR PATHWAY | ATR signaling pathway |
| 0.0 | 3.5 | PID SHP2 PATHWAY | SHP2 signaling |
| 0.0 | 3.1 | PID NFAT TFPATHWAY | Calcineurin-regulated NFAT-dependent transcription in lymphocytes |
| 0.0 | 1.7 | PID ECADHERIN STABILIZATION PATHWAY | Stabilization and expansion of the E-cadherin adherens junction |
| 0.0 | 1.6 | PID NEPHRIN NEPH1 PATHWAY | Nephrin/Neph1 signaling in the kidney podocyte |
| 0.0 | 3.3 | PID ARF6 TRAFFICKING PATHWAY | Arf6 trafficking events |
| 0.0 | 8.2 | NABA ECM AFFILIATED | Genes encoding proteins affiliated structurally or functionally to extracellular matrix proteins |
| 0.0 | 2.0 | PID ALPHA SYNUCLEIN PATHWAY | Alpha-synuclein signaling |
| 0.0 | 4.4 | PID ERBB1 DOWNSTREAM PATHWAY | ErbB1 downstream signaling |
| 0.0 | 1.0 | PID FANCONI PATHWAY | Fanconi anemia pathway |
| 0.0 | 1.0 | ST PHOSPHOINOSITIDE 3 KINASE PATHWAY | PI3K Pathway |
| 0.0 | 1.3 | ST WNT BETA CATENIN PATHWAY | Wnt/beta-catenin Pathway |
| 0.0 | 0.7 | PID P38 MKK3 6PATHWAY | p38 MAPK signaling pathway |
| 0.0 | 1.0 | PID DELTA NP63 PATHWAY | Validated transcriptional targets of deltaNp63 isoforms |
| 0.0 | 2.1 | PID ERA GENOMIC PATHWAY | Validated nuclear estrogen receptor alpha network |
| 0.0 | 0.6 | PID ALK1 PATHWAY | ALK1 signaling events |
| 0.0 | 1.4 | NABA COLLAGENS | Genes encoding collagen proteins |
| 0.0 | 0.8 | PID HIF2PATHWAY | HIF-2-alpha transcription factor network |
| 0.0 | 1.3 | NABA PROTEOGLYCANS | Genes encoding proteoglycans |
| 0.0 | 0.8 | PID RAC1 PATHWAY | RAC1 signaling pathway |
| 0.0 | 0.9 | PID BMP PATHWAY | BMP receptor signaling |
| 0.0 | 0.1 | PID IL5 PATHWAY | IL5-mediated signaling events |
| 0.0 | 0.4 | PID AMB2 NEUTROPHILS PATHWAY | amb2 Integrin signaling |
| 0.0 | 0.6 | PID BCR 5PATHWAY | BCR signaling pathway |
| 0.0 | 1.0 | PID RHOA REG PATHWAY | Regulation of RhoA activity |
| 0.0 | 0.5 | PID TGFBR PATHWAY | TGF-beta receptor signaling |
| 0.0 | 4.1 | NABA SECRETED FACTORS | Genes encoding secreted soluble factors |
Gene overrepresentation in curated gene sets: REACTOME pathways category:
| Log-likelihood per target | Total log-likelihood | Term | Description |
|---|---|---|---|
| 0.5 | 31.7 | REACTOME STRIATED MUSCLE CONTRACTION | Genes involved in Striated Muscle Contraction |
| 0.4 | 5.7 | REACTOME PASSIVE TRANSPORT BY AQUAPORINS | Genes involved in Passive Transport by Aquaporins |
| 0.3 | 5.6 | REACTOME REVERSIBLE HYDRATION OF CARBON DIOXIDE | Genes involved in Reversible Hydration of Carbon Dioxide |
| 0.3 | 3.7 | REACTOME CREATION OF C4 AND C2 ACTIVATORS | Genes involved in Creation of C4 and C2 activators |
| 0.3 | 2.6 | REACTOME TRAF6 MEDIATED IRF7 ACTIVATION IN TLR7 8 OR 9 SIGNALING | Genes involved in TRAF6 mediated IRF7 activation in TLR7/8 or 9 signaling |
| 0.2 | 4.1 | REACTOME PECAM1 INTERACTIONS | Genes involved in PECAM1 interactions |
| 0.2 | 4.7 | REACTOME FACILITATIVE NA INDEPENDENT GLUCOSE TRANSPORTERS | Genes involved in Facilitative Na+-independent glucose transporters |
| 0.2 | 2.5 | REACTOME ENDOSOMAL VACUOLAR PATHWAY | Genes involved in Endosomal/Vacuolar pathway |
| 0.2 | 7.9 | REACTOME ACTIVATION OF GENES BY ATF4 | Genes involved in Activation of Genes by ATF4 |
| 0.2 | 2.3 | REACTOME DIGESTION OF DIETARY CARBOHYDRATE | Genes involved in Digestion of dietary carbohydrate |
| 0.2 | 2.0 | REACTOME GLYCOPROTEIN HORMONES | Genes involved in Glycoprotein hormones |
| 0.1 | 1.6 | REACTOME OPSINS | Genes involved in Opsins |
| 0.1 | 3.5 | REACTOME METAL ION SLC TRANSPORTERS | Genes involved in Metal ion SLC transporters |
| 0.1 | 2.3 | REACTOME ORGANIC CATION ANION ZWITTERION TRANSPORT | Genes involved in Organic cation/anion/zwitterion transport |
| 0.1 | 1.9 | REACTOME PURINE RIBONUCLEOSIDE MONOPHOSPHATE BIOSYNTHESIS | Genes involved in Purine ribonucleoside monophosphate biosynthesis |
| 0.1 | 4.9 | REACTOME INTERACTION BETWEEN L1 AND ANKYRINS | Genes involved in Interaction between L1 and Ankyrins |
| 0.1 | 3.3 | REACTOME NA CL DEPENDENT NEUROTRANSMITTER TRANSPORTERS | Genes involved in Na+/Cl- dependent neurotransmitter transporters |
| 0.1 | 3.5 | REACTOME TIE2 SIGNALING | Genes involved in Tie2 Signaling |
| 0.1 | 2.6 | REACTOME N GLYCAN ANTENNAE ELONGATION | Genes involved in N-Glycan antennae elongation |
| 0.1 | 1.6 | REACTOME PYRIMIDINE CATABOLISM | Genes involved in Pyrimidine catabolism |
| 0.1 | 2.4 | REACTOME DEPOSITION OF NEW CENPA CONTAINING NUCLEOSOMES AT THE CENTROMERE | Genes involved in Deposition of New CENPA-containing Nucleosomes at the Centromere |
| 0.1 | 4.9 | REACTOME AMYLOIDS | Genes involved in Amyloids |
| 0.1 | 10.9 | REACTOME NUCLEAR RECEPTOR TRANSCRIPTION PATHWAY | Genes involved in Nuclear Receptor transcription pathway |
| 0.1 | 7.9 | REACTOME PHASE1 FUNCTIONALIZATION OF COMPOUNDS | Genes involved in Phase 1 - Functionalization of compounds |
| 0.1 | 1.2 | REACTOME THE NLRP3 INFLAMMASOME | Genes involved in The NLRP3 inflammasome |
| 0.1 | 0.8 | REACTOME ABACAVIR TRANSPORT AND METABOLISM | Genes involved in Abacavir transport and metabolism |
| 0.1 | 3.0 | REACTOME AMINO ACID TRANSPORT ACROSS THE PLASMA MEMBRANE | Genes involved in Amino acid transport across the plasma membrane |
| 0.1 | 1.1 | REACTOME KERATAN SULFATE DEGRADATION | Genes involved in Keratan sulfate degradation |
| 0.1 | 1.8 | REACTOME GLUCURONIDATION | Genes involved in Glucuronidation |
| 0.1 | 2.2 | REACTOME REGULATION OF HYPOXIA INDUCIBLE FACTOR HIF BY OXYGEN | Genes involved in Regulation of Hypoxia-inducible Factor (HIF) by Oxygen |
| 0.1 | 3.1 | REACTOME CGMP EFFECTS | Genes involved in cGMP effects |
| 0.1 | 1.1 | REACTOME RECYCLING OF BILE ACIDS AND SALTS | Genes involved in Recycling of bile acids and salts |
| 0.1 | 1.2 | REACTOME GAMMA CARBOXYLATION TRANSPORT AND AMINO TERMINAL CLEAVAGE OF PROTEINS | Genes involved in Gamma-carboxylation, transport, and amino-terminal cleavage of proteins |
| 0.1 | 1.7 | REACTOME CITRIC ACID CYCLE TCA CYCLE | Genes involved in Citric acid cycle (TCA cycle) |
| 0.1 | 4.4 | REACTOME CELL SURFACE INTERACTIONS AT THE VASCULAR WALL | Genes involved in Cell surface interactions at the vascular wall |
| 0.1 | 1.6 | REACTOME HOMOLOGOUS RECOMBINATION REPAIR OF REPLICATION INDEPENDENT DOUBLE STRAND BREAKS | Genes involved in Homologous recombination repair of replication-independent double-strand breaks |
| 0.1 | 1.4 | REACTOME REGULATION OF INSULIN LIKE GROWTH FACTOR IGF ACTIVITY BY INSULIN LIKE GROWTH FACTOR BINDING PROTEINS IGFBPS | Genes involved in Regulation of Insulin-like Growth Factor (IGF) Activity by Insulin-like Growth Factor Binding Proteins (IGFBPs) |
| 0.1 | 0.9 | REACTOME UNWINDING OF DNA | Genes involved in Unwinding of DNA |
| 0.1 | 0.4 | REACTOME PLATELET ADHESION TO EXPOSED COLLAGEN | Genes involved in Platelet Adhesion to exposed collagen |
| 0.1 | 1.4 | REACTOME SIGNALING BY HIPPO | Genes involved in Signaling by Hippo |
| 0.1 | 2.3 | REACTOME SIGNALING BY BMP | Genes involved in Signaling by BMP |
| 0.1 | 0.8 | REACTOME G2 M DNA DAMAGE CHECKPOINT | Genes involved in G2/M DNA damage checkpoint |
| 0.1 | 4.9 | REACTOME INTERFERON GAMMA SIGNALING | Genes involved in Interferon gamma signaling |
| 0.0 | 4.6 | REACTOME ANTIGEN PROCESSING CROSS PRESENTATION | Genes involved in Antigen processing-Cross presentation |
| 0.0 | 2.5 | REACTOME IL1 SIGNALING | Genes involved in Interleukin-1 signaling |
| 0.0 | 2.5 | REACTOME MITOCHONDRIAL PROTEIN IMPORT | Genes involved in Mitochondrial Protein Import |
| 0.0 | 0.6 | REACTOME IL 7 SIGNALING | Genes involved in Interleukin-7 signaling |
| 0.0 | 0.6 | REACTOME CDC6 ASSOCIATION WITH THE ORC ORIGIN COMPLEX | Genes involved in CDC6 association with the ORC:origin complex |
| 0.0 | 0.9 | REACTOME P2Y RECEPTORS | Genes involved in P2Y receptors |
| 0.0 | 0.7 | REACTOME MITOCHONDRIAL FATTY ACID BETA OXIDATION | Genes involved in Mitochondrial Fatty Acid Beta-Oxidation |
| 0.0 | 0.8 | REACTOME TERMINATION OF O GLYCAN BIOSYNTHESIS | Genes involved in Termination of O-glycan biosynthesis |
| 0.0 | 1.3 | REACTOME PEROXISOMAL LIPID METABOLISM | Genes involved in Peroxisomal lipid metabolism |
| 0.0 | 1.8 | REACTOME SMAD2 SMAD3 SMAD4 HETEROTRIMER REGULATES TRANSCRIPTION | Genes involved in SMAD2/SMAD3:SMAD4 heterotrimer regulates transcription |
| 0.0 | 6.0 | REACTOME FACTORS INVOLVED IN MEGAKARYOCYTE DEVELOPMENT AND PLATELET PRODUCTION | Genes involved in Factors involved in megakaryocyte development and platelet production |
| 0.0 | 1.1 | REACTOME ANTIGEN ACTIVATES B CELL RECEPTOR LEADING TO GENERATION OF SECOND MESSENGERS | Genes involved in Antigen Activates B Cell Receptor Leading to Generation of Second Messengers |
| 0.0 | 1.1 | REACTOME COMPLEMENT CASCADE | Genes involved in Complement cascade |
| 0.0 | 2.1 | REACTOME REGULATION OF MRNA STABILITY BY PROTEINS THAT BIND AU RICH ELEMENTS | Genes involved in Regulation of mRNA Stability by Proteins that Bind AU-rich Elements |
| 0.0 | 7.2 | REACTOME TRANSLATION | Genes involved in Translation |
| 0.0 | 1.0 | REACTOME TRANSPORT TO THE GOLGI AND SUBSEQUENT MODIFICATION | Genes involved in Transport to the Golgi and subsequent modification |
| 0.0 | 1.7 | REACTOME VOLTAGE GATED POTASSIUM CHANNELS | Genes involved in Voltage gated Potassium channels |
| 0.0 | 0.4 | REACTOME TRANSPORT OF ORGANIC ANIONS | Genes involved in Transport of organic anions |
| 0.0 | 0.8 | REACTOME AMINO ACID AND OLIGOPEPTIDE SLC TRANSPORTERS | Genes involved in Amino acid and oligopeptide SLC transporters |
| 0.0 | 0.8 | REACTOME NONSENSE MEDIATED DECAY ENHANCED BY THE EXON JUNCTION COMPLEX | Genes involved in Nonsense Mediated Decay Enhanced by the Exon Junction Complex |
| 0.0 | 0.9 | REACTOME EFFECTS OF PIP2 HYDROLYSIS | Genes involved in Effects of PIP2 hydrolysis |
| 0.0 | 0.5 | REACTOME PRESYNAPTIC NICOTINIC ACETYLCHOLINE RECEPTORS | Genes involved in Presynaptic nicotinic acetylcholine receptors |
| 0.0 | 1.4 | REACTOME COLLAGEN FORMATION | Genes involved in Collagen formation |
| 0.0 | 0.5 | REACTOME DARPP 32 EVENTS | Genes involved in DARPP-32 events |
| 0.0 | 3.6 | REACTOME METABOLISM OF AMINO ACIDS AND DERIVATIVES | Genes involved in Metabolism of amino acids and derivatives |
| 0.0 | 3.9 | REACTOME PEPTIDE LIGAND BINDING RECEPTORS | Genes involved in Peptide ligand-binding receptors |
| 0.0 | 0.8 | REACTOME ION TRANSPORT BY P TYPE ATPASES | Genes involved in Ion transport by P-type ATPases |
| 0.0 | 0.4 | REACTOME PROTEOLYTIC CLEAVAGE OF SNARE COMPLEX PROTEINS | Genes involved in Proteolytic cleavage of SNARE complex proteins |