Project
GNF SymAtlas + NCI-60 cancer cell lines, human (Su, 2004; Ross, 2000)
Navigation
Downloads
Results for TFAP4_MSC
Z-value: 1.13
Motif logo
Transcription factors associated with TFAP4_MSC
| Gene Symbol | Gene ID | Gene Info |
|---|---|---|
|
TFAP4
|
ENSG00000090447.12 | TFAP4 |
|
MSC
|
ENSG00000178860.9 | MSC |
Activity-expression correlation:
| Gene | Promoter | Pearson corr. coef. | P-value | Plot |
|---|---|---|---|---|
| TFAP4 | hg38_v1_chr16_-_4273014_4273065 | 0.01 | 8.5e-01 | Click! |
| MSC | hg38_v1_chr8_-_71844402_71844429 | -0.00 | 9.9e-01 | Click! |
Activity profile of TFAP4_MSC motif
Sorted Z-values of TFAP4_MSC motif
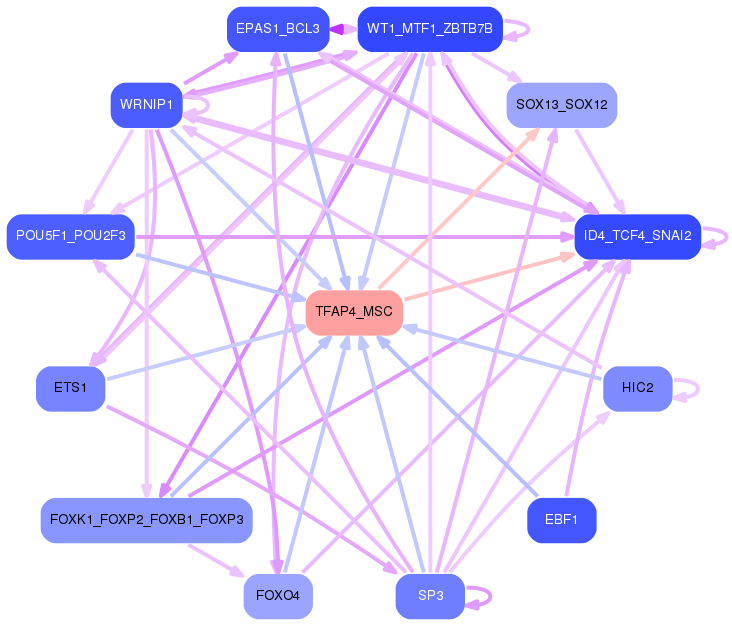
Network of associatons between targets according to the STRING database.

First level regulatory network of TFAP4_MSC
Gene Ontology Analysis
Gene overrepresentation in biological process category:
| Log-likelihood per target | Total log-likelihood | Term | Description |
|---|---|---|---|
| 4.9 | 43.8 | GO:0070315 | G1 to G0 transition involved in cell differentiation(GO:0070315) |
| 3.5 | 21.2 | GO:1903690 | negative regulation of wound healing, spreading of epidermal cells(GO:1903690) |
| 3.2 | 19.2 | GO:0014005 | microglia differentiation(GO:0014004) microglia development(GO:0014005) collateral sprouting in absence of injury(GO:0048669) smooth endoplasmic reticulum calcium ion homeostasis(GO:0051563) cellular response to norepinephrine stimulus(GO:0071874) |
| 2.7 | 10.7 | GO:0001519 | peptide amidation(GO:0001519) protein amidation(GO:0018032) peptide modification(GO:0031179) |
| 2.6 | 12.8 | GO:1904209 | regulation of chemokine (C-C motif) ligand 2 secretion(GO:1904207) positive regulation of chemokine (C-C motif) ligand 2 secretion(GO:1904209) |
| 2.2 | 19.4 | GO:0061302 | smooth muscle cell-matrix adhesion(GO:0061302) |
| 2.0 | 8.1 | GO:0043314 | negative regulation of neutrophil degranulation(GO:0043314) |
| 2.0 | 8.0 | GO:2000638 | regulation of SREBP signaling pathway(GO:2000638) negative regulation of SREBP signaling pathway(GO:2000639) |
| 1.9 | 19.2 | GO:0036309 | protein localization to M-band(GO:0036309) protein localization to T-tubule(GO:0036371) |
| 1.6 | 27.8 | GO:0007021 | tubulin complex assembly(GO:0007021) |
| 1.6 | 12.6 | GO:0060373 | regulation of ventricular cardiac muscle cell membrane depolarization(GO:0060373) |
| 1.5 | 4.6 | GO:1901420 | negative regulation of response to alcohol(GO:1901420) |
| 1.5 | 8.8 | GO:0002036 | regulation of L-glutamate transport(GO:0002036) |
| 1.4 | 15.5 | GO:0016127 | cholesterol catabolic process(GO:0006707) sterol catabolic process(GO:0016127) |
| 1.4 | 5.5 | GO:0019072 | viral genome packaging(GO:0019072) viral RNA genome packaging(GO:0019074) |
| 1.4 | 4.1 | GO:1903892 | negative regulation of ATF6-mediated unfolded protein response(GO:1903892) |
| 1.3 | 5.1 | GO:0099558 | maintenance of synapse structure(GO:0099558) |
| 1.3 | 16.4 | GO:0006554 | lysine catabolic process(GO:0006554) thyroid hormone transport(GO:0070327) |
| 1.2 | 3.7 | GO:0034092 | negative regulation of maintenance of sister chromatid cohesion(GO:0034092) negative regulation of maintenance of mitotic sister chromatid cohesion(GO:0034183) protein auto-ADP-ribosylation(GO:0070213) maintenance of mitotic sister chromatid cohesion, telomeric(GO:0099403) mitotic sister chromatid cohesion, telomeric(GO:0099404) regulation of telomeric DNA binding(GO:1904742) regulation of maintenance of mitotic sister chromatid cohesion, telomeric(GO:1904907) negative regulation of maintenance of mitotic sister chromatid cohesion, telomeric(GO:1904908) |
| 1.2 | 5.0 | GO:0043474 | eye pigment biosynthetic process(GO:0006726) eye pigment metabolic process(GO:0042441) pigment metabolic process involved in developmental pigmentation(GO:0043324) pigment metabolic process involved in pigmentation(GO:0043474) |
| 1.2 | 7.4 | GO:1903284 | negative regulation of dopamine uptake involved in synaptic transmission(GO:0051585) norepinephrine uptake(GO:0051620) regulation of norepinephrine uptake(GO:0051621) negative regulation of norepinephrine uptake(GO:0051622) negative regulation of catecholamine uptake involved in synaptic transmission(GO:0051945) regulation of glutathione peroxidase activity(GO:1903282) positive regulation of glutathione peroxidase activity(GO:1903284) positive regulation of hydrogen peroxide catabolic process(GO:1903285) regulation of peroxidase activity(GO:2000468) positive regulation of peroxidase activity(GO:2000470) |
| 1.2 | 4.9 | GO:1900147 | Schwann cell migration(GO:0036135) regulation of Schwann cell migration(GO:1900147) |
| 1.1 | 6.6 | GO:0035063 | nuclear speck organization(GO:0035063) |
| 1.1 | 3.3 | GO:0016476 | calcium-dependent cell-matrix adhesion(GO:0016340) regulation of embryonic cell shape(GO:0016476) |
| 1.1 | 15.9 | GO:0021702 | cerebellar Purkinje cell layer formation(GO:0021694) cerebellar Purkinje cell differentiation(GO:0021702) |
| 1.0 | 5.1 | GO:0019087 | transformation of host cell by virus(GO:0019087) |
| 0.9 | 18.9 | GO:0034389 | lipid particle organization(GO:0034389) |
| 0.9 | 5.6 | GO:0001920 | negative regulation of receptor recycling(GO:0001920) |
| 0.9 | 11.0 | GO:0042373 | vitamin K metabolic process(GO:0042373) |
| 0.9 | 6.8 | GO:0090063 | positive regulation of microtubule nucleation(GO:0090063) |
| 0.8 | 3.1 | GO:2000343 | positive regulation of chemokine (C-X-C motif) ligand 2 production(GO:2000343) |
| 0.8 | 26.2 | GO:0090383 | phagosome acidification(GO:0090383) |
| 0.8 | 6.1 | GO:0010138 | pyrimidine ribonucleotide salvage(GO:0010138) pyrimidine nucleotide salvage(GO:0032262) UMP salvage(GO:0044206) |
| 0.7 | 0.7 | GO:0036152 | phosphatidylethanolamine acyl-chain remodeling(GO:0036152) |
| 0.7 | 2.2 | GO:0061026 | cardiac muscle tissue regeneration(GO:0061026) |
| 0.7 | 2.1 | GO:1903336 | negative regulation of vacuolar transport(GO:1903336) |
| 0.7 | 4.1 | GO:0086047 | corticospinal neuron axon guidance(GO:0021966) Purkinje myocyte action potential(GO:0086017) membrane depolarization during Purkinje myocyte cell action potential(GO:0086047) |
| 0.6 | 2.6 | GO:0048690 | regulation of sprouting of injured axon(GO:0048686) regulation of axon extension involved in regeneration(GO:0048690) |
| 0.6 | 11.9 | GO:1900038 | negative regulation of vascular permeability(GO:0043116) negative regulation of cellular response to hypoxia(GO:1900038) |
| 0.6 | 8.6 | GO:1901387 | positive regulation of voltage-gated calcium channel activity(GO:1901387) |
| 0.6 | 5.5 | GO:0072656 | maintenance of protein location in mitochondrion(GO:0072656) |
| 0.6 | 2.4 | GO:0009838 | abscission(GO:0009838) |
| 0.6 | 3.5 | GO:0071442 | positive regulation of histone H3-K14 acetylation(GO:0071442) |
| 0.6 | 4.6 | GO:0030091 | protein repair(GO:0030091) |
| 0.6 | 8.6 | GO:0031115 | negative regulation of microtubule polymerization(GO:0031115) |
| 0.6 | 1.7 | GO:0061591 | calcium activated phospholipid scrambling(GO:0061588) calcium activated phosphatidylcholine scrambling(GO:0061590) calcium activated galactosylceramide scrambling(GO:0061591) |
| 0.5 | 0.5 | GO:0014718 | regulation of satellite cell activation involved in skeletal muscle regeneration(GO:0014717) positive regulation of satellite cell activation involved in skeletal muscle regeneration(GO:0014718) satellite cell activation involved in skeletal muscle regeneration(GO:0014901) |
| 0.5 | 1.1 | GO:0035973 | aggrephagy(GO:0035973) |
| 0.5 | 2.1 | GO:1904715 | negative regulation of chaperone-mediated autophagy(GO:1904715) |
| 0.5 | 4.2 | GO:0042866 | pyruvate biosynthetic process(GO:0042866) |
| 0.5 | 7.3 | GO:0035826 | rubidium ion transport(GO:0035826) regulation of rubidium ion transport(GO:2000680) |
| 0.5 | 38.6 | GO:2000649 | regulation of sodium ion transmembrane transporter activity(GO:2000649) |
| 0.5 | 4.9 | GO:0045176 | apical protein localization(GO:0045176) |
| 0.5 | 4.4 | GO:0042118 | endothelial cell activation(GO:0042118) |
| 0.5 | 5.5 | GO:0002315 | marginal zone B cell differentiation(GO:0002315) |
| 0.4 | 1.3 | GO:0090273 | regulation of somatostatin secretion(GO:0090273) positive regulation of somatostatin secretion(GO:0090274) |
| 0.4 | 1.3 | GO:0036292 | DNA rewinding(GO:0036292) |
| 0.4 | 0.4 | GO:0046959 | habituation(GO:0046959) |
| 0.4 | 9.3 | GO:0060736 | prostate gland growth(GO:0060736) |
| 0.4 | 2.8 | GO:1901314 | negative regulation of histone ubiquitination(GO:0033183) negative regulation of protein K63-linked ubiquitination(GO:1900045) regulation of histone H2A K63-linked ubiquitination(GO:1901314) negative regulation of histone H2A K63-linked ubiquitination(GO:1901315) negative regulation of protein polyubiquitination(GO:1902915) |
| 0.4 | 1.2 | GO:0035732 | nitric oxide storage(GO:0035732) |
| 0.4 | 3.1 | GO:1905247 | positive regulation of aspartic-type endopeptidase activity involved in amyloid precursor protein catabolic process(GO:1902961) positive regulation of aspartic-type peptidase activity(GO:1905247) |
| 0.4 | 5.3 | GO:0006995 | cellular response to nitrogen starvation(GO:0006995) cellular response to nitrogen levels(GO:0043562) |
| 0.4 | 5.9 | GO:1900119 | positive regulation of execution phase of apoptosis(GO:1900119) |
| 0.4 | 64.7 | GO:0006261 | DNA-dependent DNA replication(GO:0006261) |
| 0.4 | 1.8 | GO:0060480 | lung goblet cell differentiation(GO:0060480) |
| 0.3 | 2.4 | GO:0045586 | regulation of gamma-delta T cell differentiation(GO:0045586) |
| 0.3 | 1.4 | GO:1904428 | negative regulation of tubulin deacetylation(GO:1904428) |
| 0.3 | 10.4 | GO:0000470 | maturation of LSU-rRNA(GO:0000470) |
| 0.3 | 2.7 | GO:0010637 | negative regulation of mitochondrial fusion(GO:0010637) |
| 0.3 | 3.4 | GO:1902474 | positive regulation of protein localization to synapse(GO:1902474) |
| 0.3 | 5.0 | GO:0006600 | creatine metabolic process(GO:0006600) |
| 0.3 | 9.6 | GO:0070886 | positive regulation of calcineurin-NFAT signaling cascade(GO:0070886) |
| 0.3 | 1.0 | GO:1901355 | response to rapamycin(GO:1901355) |
| 0.3 | 11.5 | GO:0008045 | motor neuron axon guidance(GO:0008045) |
| 0.3 | 0.9 | GO:0021778 | spinal cord oligodendrocyte cell differentiation(GO:0021529) spinal cord oligodendrocyte cell fate specification(GO:0021530) oligodendrocyte cell fate specification(GO:0021778) oligodendrocyte cell fate commitment(GO:0021779) glial cell fate specification(GO:0021780) |
| 0.3 | 0.8 | GO:0098928 | presynaptic signal transduction(GO:0098928) presynapse to nucleus signaling pathway(GO:0099526) |
| 0.3 | 2.4 | GO:0097084 | vascular smooth muscle cell development(GO:0097084) |
| 0.3 | 1.6 | GO:0048050 | post-embryonic eye morphogenesis(GO:0048050) |
| 0.3 | 4.6 | GO:0019800 | peptide cross-linking via chondroitin 4-sulfate glycosaminoglycan(GO:0019800) |
| 0.3 | 1.0 | GO:1902774 | late endosome to lysosome transport(GO:1902774) |
| 0.3 | 2.9 | GO:0098914 | membrane repolarization during atrial cardiac muscle cell action potential(GO:0098914) |
| 0.3 | 4.2 | GO:0045116 | protein neddylation(GO:0045116) |
| 0.3 | 1.0 | GO:1902954 | regulation of early endosome to recycling endosome transport(GO:1902954) |
| 0.3 | 18.9 | GO:0097031 | NADH dehydrogenase complex assembly(GO:0010257) mitochondrial respiratory chain complex I assembly(GO:0032981) mitochondrial respiratory chain complex I biogenesis(GO:0097031) |
| 0.3 | 0.5 | GO:1905073 | occluding junction disassembly(GO:1905071) regulation of occluding junction disassembly(GO:1905073) positive regulation of occluding junction disassembly(GO:1905075) |
| 0.2 | 2.9 | GO:0036010 | protein localization to endosome(GO:0036010) |
| 0.2 | 3.6 | GO:1903286 | regulation of potassium ion import(GO:1903286) regulation of voltage-gated potassium channel activity involved in ventricular cardiac muscle cell action potential repolarization(GO:1903760) regulation of potassium ion export across plasma membrane(GO:1903764) regulation of membrane repolarization during ventricular cardiac muscle cell action potential(GO:1905024) |
| 0.2 | 1.1 | GO:0044855 | plasma membrane raft distribution(GO:0044855) plasma membrane raft localization(GO:0044856) plasma membrane raft polarization(GO:0044858) regulation of plasma membrane raft polarization(GO:1903906) |
| 0.2 | 2.0 | GO:0098903 | regulation of membrane repolarization during action potential(GO:0098903) |
| 0.2 | 3.1 | GO:0051127 | positive regulation of actin nucleation(GO:0051127) |
| 0.2 | 1.7 | GO:0050713 | negative regulation of interleukin-1 beta secretion(GO:0050713) |
| 0.2 | 1.0 | GO:1902361 | mitochondrial pyruvate transport(GO:0006850) mitochondrial pyruvate transmembrane transport(GO:1902361) |
| 0.2 | 0.6 | GO:1902723 | negative regulation of skeletal muscle cell proliferation(GO:0014859) negative regulation of skeletal muscle satellite cell proliferation(GO:1902723) |
| 0.2 | 1.1 | GO:0035803 | egg coat formation(GO:0035803) |
| 0.2 | 7.2 | GO:0043268 | positive regulation of potassium ion transport(GO:0043268) |
| 0.2 | 1.3 | GO:0090050 | positive regulation of cell migration involved in sprouting angiogenesis(GO:0090050) |
| 0.2 | 2.7 | GO:0007258 | JUN phosphorylation(GO:0007258) |
| 0.2 | 0.7 | GO:1904381 | Golgi apparatus mannose trimming(GO:1904381) |
| 0.2 | 14.5 | GO:0061178 | regulation of insulin secretion involved in cellular response to glucose stimulus(GO:0061178) |
| 0.2 | 0.9 | GO:0097498 | endothelial tube lumen extension(GO:0097498) |
| 0.2 | 2.0 | GO:0016559 | peroxisome fission(GO:0016559) |
| 0.2 | 2.2 | GO:0042355 | fucose catabolic process(GO:0019317) L-fucose metabolic process(GO:0042354) L-fucose catabolic process(GO:0042355) |
| 0.2 | 2.2 | GO:0036500 | ATF6-mediated unfolded protein response(GO:0036500) |
| 0.2 | 1.0 | GO:1903862 | positive regulation of oxidative phosphorylation(GO:1903862) |
| 0.2 | 4.5 | GO:0089711 | L-glutamate transmembrane transport(GO:0089711) |
| 0.2 | 2.4 | GO:2000480 | negative regulation of cAMP-dependent protein kinase activity(GO:2000480) |
| 0.2 | 1.9 | GO:0030321 | transepithelial chloride transport(GO:0030321) |
| 0.2 | 1.3 | GO:0048630 | skeletal muscle tissue growth(GO:0048630) |
| 0.2 | 1.7 | GO:1902083 | negative regulation of peptidyl-cysteine S-nitrosylation(GO:1902083) |
| 0.2 | 0.9 | GO:0006651 | diacylglycerol biosynthetic process(GO:0006651) |
| 0.2 | 3.0 | GO:0002467 | germinal center formation(GO:0002467) |
| 0.1 | 3.5 | GO:0031111 | negative regulation of microtubule polymerization or depolymerization(GO:0031111) |
| 0.1 | 4.1 | GO:0097067 | cellular response to thyroid hormone stimulus(GO:0097067) |
| 0.1 | 1.7 | GO:0040034 | regulation of development, heterochronic(GO:0040034) regulation of timing of cell differentiation(GO:0048505) |
| 0.1 | 5.6 | GO:0071353 | cellular response to interleukin-4(GO:0071353) |
| 0.1 | 10.6 | GO:0000381 | regulation of alternative mRNA splicing, via spliceosome(GO:0000381) |
| 0.1 | 0.5 | GO:0061086 | negative regulation of histone H3-K27 methylation(GO:0061086) |
| 0.1 | 3.3 | GO:0036151 | phosphatidylcholine acyl-chain remodeling(GO:0036151) |
| 0.1 | 0.5 | GO:0023021 | termination of signal transduction(GO:0023021) |
| 0.1 | 2.6 | GO:0006895 | Golgi to endosome transport(GO:0006895) |
| 0.1 | 3.5 | GO:0043252 | sodium-independent organic anion transport(GO:0043252) |
| 0.1 | 1.2 | GO:0031987 | locomotion involved in locomotory behavior(GO:0031987) |
| 0.1 | 1.9 | GO:1903830 | magnesium ion transmembrane transport(GO:1903830) |
| 0.1 | 4.2 | GO:0071625 | vocalization behavior(GO:0071625) |
| 0.1 | 0.9 | GO:0050910 | detection of mechanical stimulus involved in sensory perception of sound(GO:0050910) |
| 0.1 | 1.4 | GO:0033572 | transferrin transport(GO:0033572) |
| 0.1 | 1.4 | GO:2000251 | positive regulation of actin cytoskeleton reorganization(GO:2000251) |
| 0.1 | 2.9 | GO:1901522 | positive regulation of transcription from RNA polymerase II promoter involved in cellular response to chemical stimulus(GO:1901522) |
| 0.1 | 0.4 | GO:0090080 | positive regulation of MAPKKK cascade by fibroblast growth factor receptor signaling pathway(GO:0090080) |
| 0.1 | 4.3 | GO:0000281 | mitotic cytokinesis(GO:0000281) |
| 0.1 | 1.5 | GO:0046514 | ceramide catabolic process(GO:0046514) |
| 0.1 | 7.0 | GO:0060997 | dendritic spine morphogenesis(GO:0060997) |
| 0.1 | 1.1 | GO:0006657 | CDP-choline pathway(GO:0006657) |
| 0.1 | 12.6 | GO:0008286 | insulin receptor signaling pathway(GO:0008286) |
| 0.1 | 0.6 | GO:0042539 | hypotonic salinity response(GO:0042539) cellular hypotonic salinity response(GO:0071477) |
| 0.1 | 0.3 | GO:0010286 | heat acclimation(GO:0010286) cellular heat acclimation(GO:0070370) |
| 0.1 | 0.7 | GO:2000507 | positive regulation of energy homeostasis(GO:2000507) |
| 0.1 | 3.5 | GO:0071377 | cellular response to glucagon stimulus(GO:0071377) |
| 0.1 | 3.1 | GO:0060765 | regulation of androgen receptor signaling pathway(GO:0060765) |
| 0.1 | 1.5 | GO:0031112 | positive regulation of microtubule polymerization or depolymerization(GO:0031112) positive regulation of microtubule polymerization(GO:0031116) |
| 0.1 | 2.8 | GO:0034142 | toll-like receptor 4 signaling pathway(GO:0034142) |
| 0.1 | 0.2 | GO:0061743 | motor learning(GO:0061743) |
| 0.1 | 5.3 | GO:0051865 | protein autoubiquitination(GO:0051865) |
| 0.1 | 0.6 | GO:0008295 | spermidine biosynthetic process(GO:0008295) |
| 0.1 | 4.9 | GO:0032784 | regulation of DNA-templated transcription, elongation(GO:0032784) |
| 0.1 | 2.1 | GO:0007216 | G-protein coupled glutamate receptor signaling pathway(GO:0007216) |
| 0.1 | 4.4 | GO:0006904 | vesicle docking involved in exocytosis(GO:0006904) |
| 0.1 | 5.9 | GO:0030574 | collagen catabolic process(GO:0030574) |
| 0.1 | 1.7 | GO:0090162 | establishment of epithelial cell polarity(GO:0090162) |
| 0.1 | 2.5 | GO:0030866 | cortical actin cytoskeleton organization(GO:0030866) |
| 0.1 | 0.4 | GO:0010909 | regulation of heparan sulfate proteoglycan biosynthetic process(GO:0010908) positive regulation of heparan sulfate proteoglycan biosynthetic process(GO:0010909) canonical Wnt signaling pathway involved in positive regulation of epithelial to mesenchymal transition(GO:0044334) positive regulation of proteoglycan biosynthetic process(GO:1902730) |
| 0.1 | 0.3 | GO:0007042 | lysosomal lumen acidification(GO:0007042) |
| 0.1 | 2.9 | GO:0007214 | gamma-aminobutyric acid signaling pathway(GO:0007214) |
| 0.1 | 0.6 | GO:0090161 | Golgi ribbon formation(GO:0090161) |
| 0.1 | 0.5 | GO:0035457 | cellular response to interferon-alpha(GO:0035457) |
| 0.1 | 0.8 | GO:0006086 | acetyl-CoA biosynthetic process from pyruvate(GO:0006086) regulation of acetyl-CoA biosynthetic process from pyruvate(GO:0010510) |
| 0.1 | 5.3 | GO:0007422 | peripheral nervous system development(GO:0007422) |
| 0.1 | 9.4 | GO:0030705 | cytoskeleton-dependent intracellular transport(GO:0030705) |
| 0.1 | 1.0 | GO:0097062 | dendritic spine maintenance(GO:0097062) |
| 0.1 | 10.8 | GO:0043523 | regulation of neuron apoptotic process(GO:0043523) |
| 0.1 | 1.5 | GO:0006418 | tRNA aminoacylation for protein translation(GO:0006418) |
| 0.0 | 2.3 | GO:1901880 | negative regulation of protein depolymerization(GO:1901880) |
| 0.0 | 1.8 | GO:0010738 | regulation of protein kinase A signaling(GO:0010738) |
| 0.0 | 0.7 | GO:0007095 | mitotic G2 DNA damage checkpoint(GO:0007095) |
| 0.0 | 0.8 | GO:0010919 | regulation of inositol phosphate biosynthetic process(GO:0010919) positive regulation of inositol phosphate biosynthetic process(GO:0060732) |
| 0.0 | 0.4 | GO:2000059 | negative regulation of protein ubiquitination involved in ubiquitin-dependent protein catabolic process(GO:2000059) |
| 0.0 | 1.2 | GO:0007040 | lysosome organization(GO:0007040) lytic vacuole organization(GO:0080171) |
| 0.0 | 0.5 | GO:0060019 | radial glial cell differentiation(GO:0060019) |
| 0.0 | 2.5 | GO:0070527 | platelet aggregation(GO:0070527) |
| 0.0 | 2.7 | GO:0006487 | protein N-linked glycosylation(GO:0006487) |
| 0.0 | 0.6 | GO:0002003 | angiotensin maturation(GO:0002003) |
| 0.0 | 0.3 | GO:0070584 | mitochondrion morphogenesis(GO:0070584) |
| 0.0 | 3.5 | GO:0034605 | cellular response to heat(GO:0034605) |
| 0.0 | 0.4 | GO:0070534 | protein K63-linked ubiquitination(GO:0070534) |
| 0.0 | 0.1 | GO:0000101 | sulfur amino acid transport(GO:0000101) L-cystine transport(GO:0015811) |
| 0.0 | 0.3 | GO:0007130 | synaptonemal complex assembly(GO:0007130) synaptonemal complex organization(GO:0070193) |
| 0.0 | 1.2 | GO:0042147 | retrograde transport, endosome to Golgi(GO:0042147) |
| 0.0 | 0.4 | GO:0046785 | microtubule polymerization(GO:0046785) |
| 0.0 | 0.2 | GO:0007342 | fusion of sperm to egg plasma membrane(GO:0007342) |
| 0.0 | 0.4 | GO:0010719 | negative regulation of epithelial to mesenchymal transition(GO:0010719) |
| 0.0 | 1.0 | GO:0070125 | mitochondrial translational elongation(GO:0070125) |
| 0.0 | 0.9 | GO:0036498 | IRE1-mediated unfolded protein response(GO:0036498) |
| 0.0 | 0.3 | GO:2000369 | regulation of clathrin-mediated endocytosis(GO:2000369) |
Gene overrepresentation in cellular component category:
| Log-likelihood per target | Total log-likelihood | Term | Description |
|---|---|---|---|
| 3.6 | 21.4 | GO:0033269 | internode region of axon(GO:0033269) |
| 2.1 | 19.2 | GO:1990761 | growth cone lamellipodium(GO:1990761) |
| 2.1 | 21.2 | GO:0045180 | basal cortex(GO:0045180) |
| 1.7 | 10.4 | GO:0070545 | PeBoW complex(GO:0070545) |
| 1.7 | 27.2 | GO:0097512 | cardiac myofibril(GO:0097512) |
| 1.1 | 8.0 | GO:1990452 | Parkin-FBXW7-Cul1 ubiquitin ligase complex(GO:1990452) |
| 1.0 | 3.1 | GO:0045323 | interleukin-1 receptor complex(GO:0045323) |
| 1.0 | 14.7 | GO:0097433 | dense body(GO:0097433) |
| 0.9 | 26.5 | GO:0033176 | proton-transporting V-type ATPase complex(GO:0033176) |
| 0.7 | 17.7 | GO:0001518 | voltage-gated sodium channel complex(GO:0001518) |
| 0.6 | 59.5 | GO:0030315 | T-tubule(GO:0030315) |
| 0.6 | 2.3 | GO:0070044 | synaptobrevin 2-SNAP-25-syntaxin-1a complex(GO:0070044) |
| 0.6 | 5.7 | GO:0016011 | dystroglycan complex(GO:0016011) |
| 0.5 | 21.2 | GO:0005640 | nuclear outer membrane(GO:0005640) |
| 0.5 | 2.6 | GO:0072534 | perineuronal net(GO:0072534) |
| 0.5 | 6.8 | GO:0005869 | dynactin complex(GO:0005869) |
| 0.5 | 4.3 | GO:0046696 | lipopolysaccharide receptor complex(GO:0046696) |
| 0.4 | 9.3 | GO:0032433 | filopodium tip(GO:0032433) |
| 0.4 | 7.3 | GO:0031088 | platelet dense granule membrane(GO:0031088) |
| 0.4 | 1.5 | GO:0005899 | insulin receptor complex(GO:0005899) |
| 0.3 | 2.7 | GO:0044294 | dendritic growth cone(GO:0044294) |
| 0.3 | 5.1 | GO:0043083 | synaptic cleft(GO:0043083) |
| 0.3 | 2.6 | GO:0000138 | Golgi trans cisterna(GO:0000138) |
| 0.3 | 5.0 | GO:0098563 | integral component of synaptic vesicle membrane(GO:0030285) intrinsic component of synaptic vesicle membrane(GO:0098563) |
| 0.3 | 16.3 | GO:0031907 | peroxisomal matrix(GO:0005782) microbody lumen(GO:0031907) |
| 0.3 | 1.2 | GO:0097057 | TRAF2-GSTP1 complex(GO:0097057) |
| 0.3 | 5.3 | GO:0097225 | sperm midpiece(GO:0097225) |
| 0.3 | 4.9 | GO:0044295 | axonal growth cone(GO:0044295) |
| 0.3 | 0.8 | GO:0098831 | cytoskeleton of presynaptic active zone(GO:0048788) presynaptic active zone cytoplasmic component(GO:0098831) presynaptic cytoskeleton(GO:0099569) |
| 0.3 | 3.8 | GO:0030123 | AP-3 adaptor complex(GO:0030123) |
| 0.3 | 2.1 | GO:0098575 | lumenal side of lysosomal membrane(GO:0098575) |
| 0.2 | 1.7 | GO:0042406 | extrinsic component of endoplasmic reticulum membrane(GO:0042406) |
| 0.2 | 1.0 | GO:0034667 | integrin alpha3-beta1 complex(GO:0034667) |
| 0.2 | 0.9 | GO:0002139 | stereocilia coupling link(GO:0002139) |
| 0.2 | 5.1 | GO:0031362 | anchored component of external side of plasma membrane(GO:0031362) |
| 0.2 | 5.5 | GO:0097228 | sperm principal piece(GO:0097228) |
| 0.2 | 1.1 | GO:0034274 | Atg12-Atg5-Atg16 complex(GO:0034274) |
| 0.2 | 2.1 | GO:0032009 | early phagosome(GO:0032009) |
| 0.2 | 1.0 | GO:0000313 | organellar ribosome(GO:0000313) mitochondrial ribosome(GO:0005761) |
| 0.2 | 3.0 | GO:0005883 | neurofilament(GO:0005883) |
| 0.2 | 3.6 | GO:0097025 | MPP7-DLG1-LIN7 complex(GO:0097025) |
| 0.2 | 3.4 | GO:0097431 | mitotic spindle pole(GO:0097431) |
| 0.2 | 3.1 | GO:0030904 | retromer complex(GO:0030904) |
| 0.2 | 7.2 | GO:0035577 | azurophil granule membrane(GO:0035577) |
| 0.2 | 10.6 | GO:0005881 | cytoplasmic microtubule(GO:0005881) |
| 0.1 | 4.3 | GO:0031143 | pseudopodium(GO:0031143) |
| 0.1 | 5.4 | GO:0031430 | M band(GO:0031430) |
| 0.1 | 0.4 | GO:0035370 | UBC13-UEV1A complex(GO:0035370) |
| 0.1 | 7.3 | GO:0045271 | mitochondrial respiratory chain complex I(GO:0005747) NADH dehydrogenase complex(GO:0030964) respiratory chain complex I(GO:0045271) |
| 0.1 | 1.0 | GO:0031931 | TORC1 complex(GO:0031931) |
| 0.1 | 0.4 | GO:0097427 | microtubule bundle(GO:0097427) |
| 0.1 | 9.6 | GO:0016328 | lateral plasma membrane(GO:0016328) |
| 0.1 | 37.5 | GO:0031965 | nuclear membrane(GO:0031965) |
| 0.1 | 17.0 | GO:0030176 | integral component of endoplasmic reticulum membrane(GO:0030176) |
| 0.1 | 1.4 | GO:0090543 | Flemming body(GO:0090543) |
| 0.1 | 2.7 | GO:0030057 | desmosome(GO:0030057) |
| 0.1 | 5.9 | GO:0005901 | caveola(GO:0005901) |
| 0.1 | 2.5 | GO:0005682 | U5 snRNP(GO:0005682) |
| 0.1 | 81.6 | GO:0048471 | perinuclear region of cytoplasm(GO:0048471) |
| 0.1 | 9.5 | GO:0055037 | recycling endosome(GO:0055037) |
| 0.1 | 4.9 | GO:0005834 | heterotrimeric G-protein complex(GO:0005834) |
| 0.1 | 1.1 | GO:0043220 | Schmidt-Lanterman incisure(GO:0043220) |
| 0.1 | 3.3 | GO:0030134 | ER to Golgi transport vesicle(GO:0030134) |
| 0.1 | 2.8 | GO:0032588 | trans-Golgi network membrane(GO:0032588) |
| 0.1 | 5.1 | GO:0008023 | transcription elongation factor complex(GO:0008023) |
| 0.1 | 7.0 | GO:0043204 | perikaryon(GO:0043204) |
| 0.1 | 8.3 | GO:0044309 | dendritic spine(GO:0043197) neuron spine(GO:0044309) |
| 0.1 | 0.4 | GO:0071664 | beta-catenin-TCF7L2 complex(GO:0070369) catenin-TCF7L2 complex(GO:0071664) |
| 0.1 | 1.9 | GO:0045178 | basal part of cell(GO:0045178) |
| 0.1 | 5.5 | GO:0031985 | Golgi cisterna(GO:0031985) |
| 0.0 | 20.6 | GO:0019866 | organelle inner membrane(GO:0019866) |
| 0.0 | 0.7 | GO:0016281 | eukaryotic translation initiation factor 4F complex(GO:0016281) |
| 0.0 | 0.4 | GO:0002193 | MAML1-RBP-Jkappa- ICN1 complex(GO:0002193) |
| 0.0 | 5.0 | GO:0043209 | myelin sheath(GO:0043209) |
| 0.0 | 3.9 | GO:0005802 | trans-Golgi network(GO:0005802) |
| 0.0 | 9.3 | GO:0045121 | membrane raft(GO:0045121) membrane microdomain(GO:0098857) |
| 0.0 | 2.6 | GO:0030864 | cortical actin cytoskeleton(GO:0030864) |
| 0.0 | 1.7 | GO:0043195 | terminal bouton(GO:0043195) |
| 0.0 | 0.5 | GO:0042599 | lamellar body(GO:0042599) |
| 0.0 | 5.8 | GO:0031966 | mitochondrial membrane(GO:0031966) |
| 0.0 | 2.0 | GO:0005903 | brush border(GO:0005903) |
| 0.0 | 0.6 | GO:0043679 | axon terminus(GO:0043679) |
| 0.0 | 16.6 | GO:0005789 | endoplasmic reticulum membrane(GO:0005789) |
| 0.0 | 0.7 | GO:0031594 | neuromuscular junction(GO:0031594) |
| 0.0 | 1.6 | GO:0035097 | histone methyltransferase complex(GO:0035097) |
| 0.0 | 1.0 | GO:0000922 | spindle pole(GO:0000922) |
| 0.0 | 1.0 | GO:0072686 | mitotic spindle(GO:0072686) |
| 0.0 | 1.5 | GO:0036064 | ciliary basal body(GO:0036064) |
| 0.0 | 1.3 | GO:0005604 | basement membrane(GO:0005604) |
| 0.0 | 0.4 | GO:0005838 | proteasome regulatory particle(GO:0005838) |
| 0.0 | 4.8 | GO:0005813 | centrosome(GO:0005813) |
| 0.0 | 0.3 | GO:0042645 | nucleoid(GO:0009295) mitochondrial nucleoid(GO:0042645) |
| 0.0 | 0.5 | GO:0005643 | nuclear pore(GO:0005643) |
Gene overrepresentation in molecular function category:
| Log-likelihood per target | Total log-likelihood | Term | Description |
|---|---|---|---|
| 4.1 | 16.4 | GO:0016639 | oxidoreductase activity, acting on the CH-NH2 group of donors, NAD or NADP as acceptor(GO:0016639) |
| 3.2 | 19.4 | GO:0038062 | protein tyrosine kinase collagen receptor activity(GO:0038062) |
| 2.8 | 14.0 | GO:0008553 | hydrogen-exporting ATPase activity, phosphorylative mechanism(GO:0008553) |
| 2.7 | 10.7 | GO:0004504 | peptidylglycine monooxygenase activity(GO:0004504) peptidylamidoglycolate lyase activity(GO:0004598) |
| 2.6 | 43.4 | GO:0031432 | titin binding(GO:0031432) |
| 2.3 | 50.2 | GO:0016805 | dipeptidase activity(GO:0016805) |
| 2.2 | 17.7 | GO:0086006 | voltage-gated sodium channel activity involved in cardiac muscle cell action potential(GO:0086006) |
| 1.8 | 11.0 | GO:0016900 | oxidoreductase activity, acting on the CH-OH group of donors, disulfide as acceptor(GO:0016900) vitamin-K-epoxide reductase (warfarin-sensitive) activity(GO:0047057) |
| 1.8 | 18.2 | GO:0051425 | PTB domain binding(GO:0051425) |
| 1.8 | 70.5 | GO:0070182 | DNA polymerase binding(GO:0070182) |
| 1.5 | 4.5 | GO:0005280 | hydrogen:amino acid symporter activity(GO:0005280) |
| 1.2 | 7.4 | GO:0060961 | phospholipase D inhibitor activity(GO:0060961) |
| 1.2 | 9.3 | GO:0060002 | plus-end directed microfilament motor activity(GO:0060002) |
| 1.1 | 12.8 | GO:0019911 | structural constituent of myelin sheath(GO:0019911) |
| 1.0 | 3.1 | GO:0005150 | interleukin-1, Type I receptor binding(GO:0005150) |
| 1.0 | 4.2 | GO:0004743 | pyruvate kinase activity(GO:0004743) |
| 1.0 | 9.3 | GO:0004565 | beta-galactosidase activity(GO:0004565) |
| 1.0 | 5.1 | GO:0033906 | hyaluronoglucuronidase activity(GO:0033906) |
| 1.0 | 8.0 | GO:0050816 | phosphothreonine binding(GO:0050816) |
| 0.9 | 24.5 | GO:0002162 | dystroglycan binding(GO:0002162) |
| 0.9 | 27.0 | GO:0005212 | structural constituent of eye lens(GO:0005212) |
| 0.9 | 5.3 | GO:0003998 | acylphosphatase activity(GO:0003998) |
| 0.8 | 9.6 | GO:0038132 | neuregulin binding(GO:0038132) |
| 0.7 | 3.7 | GO:0010340 | carboxyl-O-methyltransferase activity(GO:0010340) protein carboxyl O-methyltransferase activity(GO:0051998) |
| 0.7 | 2.9 | GO:0004886 | 9-cis retinoic acid receptor activity(GO:0004886) |
| 0.7 | 2.1 | GO:0030156 | benzodiazepine receptor binding(GO:0030156) |
| 0.7 | 39.5 | GO:0017080 | sodium channel regulator activity(GO:0017080) |
| 0.7 | 2.0 | GO:0052816 | medium-chain acyl-CoA hydrolase activity(GO:0052815) long-chain acyl-CoA hydrolase activity(GO:0052816) |
| 0.6 | 3.1 | GO:0004167 | dopachrome isomerase activity(GO:0004167) |
| 0.6 | 5.5 | GO:0019158 | glucokinase activity(GO:0004340) hexokinase activity(GO:0004396) fructokinase activity(GO:0008865) mannokinase activity(GO:0019158) |
| 0.6 | 4.2 | GO:0070739 | protein-glutamic acid ligase activity(GO:0070739) |
| 0.5 | 1.4 | GO:0010698 | acetyltransferase activator activity(GO:0010698) |
| 0.5 | 5.5 | GO:0004075 | biotin carboxylase activity(GO:0004075) |
| 0.4 | 1.8 | GO:0050508 | glucuronosyl-N-acetylglucosaminyl-proteoglycan 4-alpha-N-acetylglucosaminyltransferase activity(GO:0050508) |
| 0.4 | 15.0 | GO:0008395 | steroid hydroxylase activity(GO:0008395) |
| 0.4 | 3.0 | GO:0030160 | GKAP/Homer scaffold activity(GO:0030160) |
| 0.4 | 14.7 | GO:0017075 | syntaxin-1 binding(GO:0017075) |
| 0.4 | 1.2 | GO:0035730 | S-nitrosoglutathione binding(GO:0035730) dinitrosyl-iron complex binding(GO:0035731) |
| 0.4 | 5.0 | GO:0022851 | GABA-gated chloride ion channel activity(GO:0022851) |
| 0.3 | 2.1 | GO:0016997 | exo-alpha-sialidase activity(GO:0004308) alpha-sialidase activity(GO:0016997) |
| 0.3 | 19.7 | GO:0030507 | spectrin binding(GO:0030507) |
| 0.3 | 2.4 | GO:0016403 | dimethylargininase activity(GO:0016403) |
| 0.3 | 16.1 | GO:0046875 | ephrin receptor binding(GO:0046875) |
| 0.3 | 8.0 | GO:0044548 | S100 protein binding(GO:0044548) |
| 0.3 | 5.3 | GO:0031702 | type 1 angiotensin receptor binding(GO:0031702) |
| 0.3 | 6.9 | GO:0070530 | K63-linked polyubiquitin binding(GO:0070530) |
| 0.3 | 3.4 | GO:0019869 | chloride channel inhibitor activity(GO:0019869) |
| 0.3 | 5.3 | GO:0050811 | GABA receptor binding(GO:0050811) |
| 0.3 | 3.1 | GO:0010314 | phosphatidylinositol-5-phosphate binding(GO:0010314) |
| 0.3 | 0.8 | GO:0070984 | SET domain binding(GO:0070984) |
| 0.2 | 2.2 | GO:0046920 | alpha-(1->3)-fucosyltransferase activity(GO:0046920) |
| 0.2 | 0.9 | GO:0008422 | beta-glucosidase activity(GO:0008422) |
| 0.2 | 6.3 | GO:0031434 | mitogen-activated protein kinase kinase binding(GO:0031434) |
| 0.2 | 1.1 | GO:0004105 | choline-phosphate cytidylyltransferase activity(GO:0004105) |
| 0.2 | 4.6 | GO:0008191 | metalloendopeptidase inhibitor activity(GO:0008191) |
| 0.2 | 0.8 | GO:0004741 | [pyruvate dehydrogenase (lipoamide)] phosphatase activity(GO:0004741) |
| 0.2 | 0.6 | GO:0017153 | sodium:dicarboxylate symporter activity(GO:0017153) |
| 0.2 | 2.8 | GO:0005229 | intracellular calcium activated chloride channel activity(GO:0005229) |
| 0.2 | 0.6 | GO:0004766 | spermidine synthase activity(GO:0004766) |
| 0.2 | 6.8 | GO:0070840 | dynein complex binding(GO:0070840) |
| 0.2 | 2.6 | GO:0015280 | ligand-gated sodium channel activity(GO:0015280) |
| 0.2 | 3.3 | GO:0008093 | cytoskeletal adaptor activity(GO:0008093) |
| 0.2 | 4.1 | GO:0070016 | armadillo repeat domain binding(GO:0070016) |
| 0.2 | 1.0 | GO:0017040 | ceramidase activity(GO:0017040) |
| 0.2 | 2.9 | GO:0030898 | actin-dependent ATPase activity(GO:0030898) |
| 0.2 | 0.8 | GO:0004991 | parathyroid hormone receptor activity(GO:0004991) |
| 0.2 | 5.0 | GO:0016769 | transferase activity, transferring nitrogenous groups(GO:0016769) |
| 0.1 | 2.6 | GO:0017166 | vinculin binding(GO:0017166) |
| 0.1 | 2.1 | GO:0035256 | G-protein coupled glutamate receptor binding(GO:0035256) |
| 0.1 | 4.3 | GO:0001530 | lipopolysaccharide binding(GO:0001530) |
| 0.1 | 7.3 | GO:0050136 | NADH dehydrogenase (ubiquinone) activity(GO:0008137) NADH dehydrogenase (quinone) activity(GO:0050136) |
| 0.1 | 3.3 | GO:0004806 | triglyceride lipase activity(GO:0004806) |
| 0.1 | 1.1 | GO:0047499 | calcium-independent phospholipase A2 activity(GO:0047499) |
| 0.1 | 1.1 | GO:0032190 | acrosin binding(GO:0032190) |
| 0.1 | 2.4 | GO:0015467 | G-protein activated inward rectifier potassium channel activity(GO:0015467) |
| 0.1 | 16.7 | GO:0005200 | structural constituent of cytoskeleton(GO:0005200) |
| 0.1 | 1.0 | GO:0050833 | pyruvate transmembrane transporter activity(GO:0050833) |
| 0.1 | 1.1 | GO:0097322 | 7SK snRNA binding(GO:0097322) |
| 0.1 | 3.5 | GO:0015347 | sodium-independent organic anion transmembrane transporter activity(GO:0015347) |
| 0.1 | 1.4 | GO:0005381 | iron ion transmembrane transporter activity(GO:0005381) |
| 0.1 | 1.9 | GO:0015095 | magnesium ion transmembrane transporter activity(GO:0015095) |
| 0.1 | 2.4 | GO:0004862 | cAMP-dependent protein kinase inhibitor activity(GO:0004862) |
| 0.1 | 0.7 | GO:0001515 | opioid peptide activity(GO:0001515) |
| 0.1 | 5.1 | GO:0042169 | SH2 domain binding(GO:0042169) |
| 0.1 | 0.5 | GO:0034714 | type III transforming growth factor beta receptor binding(GO:0034714) |
| 0.1 | 3.1 | GO:0031624 | ubiquitin conjugating enzyme binding(GO:0031624) |
| 0.1 | 1.4 | GO:0003993 | acid phosphatase activity(GO:0003993) |
| 0.1 | 0.7 | GO:0004571 | mannosyl-oligosaccharide 1,2-alpha-mannosidase activity(GO:0004571) |
| 0.1 | 1.7 | GO:0008190 | eukaryotic initiation factor 4E binding(GO:0008190) |
| 0.1 | 1.9 | GO:0036442 | hydrogen-exporting ATPase activity(GO:0036442) ATPase activity, coupled to transmembrane movement of ions, rotational mechanism(GO:0044769) proton-transporting ATPase activity, rotational mechanism(GO:0046961) |
| 0.1 | 12.0 | GO:0017048 | Rho GTPase binding(GO:0017048) |
| 0.1 | 0.4 | GO:0047134 | protein-disulfide reductase activity(GO:0047134) |
| 0.1 | 1.7 | GO:0032183 | SUMO binding(GO:0032183) |
| 0.1 | 0.5 | GO:0004563 | beta-N-acetylhexosaminidase activity(GO:0004563) |
| 0.1 | 6.8 | GO:0042626 | ATPase activity, coupled to transmembrane movement of substances(GO:0042626) |
| 0.1 | 2.0 | GO:0004602 | glutathione peroxidase activity(GO:0004602) |
| 0.1 | 1.5 | GO:0016875 | aminoacyl-tRNA ligase activity(GO:0004812) ligase activity, forming carbon-oxygen bonds(GO:0016875) ligase activity, forming aminoacyl-tRNA and related compounds(GO:0016876) |
| 0.1 | 1.1 | GO:0005545 | 1-phosphatidylinositol binding(GO:0005545) |
| 0.1 | 4.2 | GO:0016763 | transferase activity, transferring pentosyl groups(GO:0016763) |
| 0.1 | 0.5 | GO:0000990 | transcription factor activity, core RNA polymerase binding(GO:0000990) |
| 0.1 | 1.5 | GO:0034237 | protein kinase A regulatory subunit binding(GO:0034237) |
| 0.1 | 1.4 | GO:0070006 | metalloaminopeptidase activity(GO:0070006) |
| 0.1 | 0.4 | GO:1903763 | gap junction channel activity involved in cell communication by electrical coupling(GO:1903763) |
| 0.1 | 0.5 | GO:0004767 | sphingomyelin phosphodiesterase activity(GO:0004767) |
| 0.1 | 2.2 | GO:0008188 | neuropeptide receptor activity(GO:0008188) |
| 0.1 | 5.8 | GO:0008013 | beta-catenin binding(GO:0008013) |
| 0.1 | 4.1 | GO:0051117 | ATPase binding(GO:0051117) |
| 0.1 | 2.2 | GO:0005154 | epidermal growth factor receptor binding(GO:0005154) |
| 0.0 | 0.8 | GO:0005522 | profilin binding(GO:0005522) |
| 0.0 | 21.0 | GO:0004842 | ubiquitin-protein transferase activity(GO:0004842) |
| 0.0 | 6.4 | GO:0017124 | SH3 domain binding(GO:0017124) |
| 0.0 | 1.2 | GO:0097109 | neuroligin family protein binding(GO:0097109) |
| 0.0 | 0.2 | GO:0008449 | N-acetylglucosamine-6-sulfatase activity(GO:0008449) |
| 0.0 | 0.6 | GO:0015379 | potassium:chloride symporter activity(GO:0015379) potassium ion symporter activity(GO:0022820) |
| 0.0 | 1.2 | GO:0005184 | neuropeptide hormone activity(GO:0005184) |
| 0.0 | 0.9 | GO:0070001 | aspartic-type endopeptidase activity(GO:0004190) aspartic-type peptidase activity(GO:0070001) |
| 0.0 | 0.4 | GO:0035612 | AP-2 adaptor complex binding(GO:0035612) |
| 0.0 | 1.9 | GO:0001105 | RNA polymerase II transcription coactivator activity(GO:0001105) |
| 0.0 | 3.4 | GO:0005089 | Rho guanyl-nucleotide exchange factor activity(GO:0005089) |
| 0.0 | 0.5 | GO:0005049 | nuclear export signal receptor activity(GO:0005049) |
| 0.0 | 0.9 | GO:0004435 | phosphatidylinositol phospholipase C activity(GO:0004435) |
| 0.0 | 0.4 | GO:0000150 | recombinase activity(GO:0000150) |
| 0.0 | 0.4 | GO:0005095 | GTPase inhibitor activity(GO:0005095) |
| 0.0 | 0.8 | GO:0005104 | fibroblast growth factor receptor binding(GO:0005104) |
| 0.0 | 2.6 | GO:0004867 | serine-type endopeptidase inhibitor activity(GO:0004867) |
| 0.0 | 3.3 | GO:0044325 | ion channel binding(GO:0044325) |
| 0.0 | 0.6 | GO:0004181 | metallocarboxypeptidase activity(GO:0004181) |
| 0.0 | 0.9 | GO:0005080 | protein kinase C binding(GO:0005080) |
| 0.0 | 0.4 | GO:0005132 | type I interferon receptor binding(GO:0005132) |
| 0.0 | 0.1 | GO:0015184 | L-cystine transmembrane transporter activity(GO:0015184) |
| 0.0 | 4.7 | GO:0005085 | guanyl-nucleotide exchange factor activity(GO:0005085) |
| 0.0 | 0.6 | GO:0005484 | SNAP receptor activity(GO:0005484) |
| 0.0 | 0.1 | GO:0003726 | double-stranded RNA adenosine deaminase activity(GO:0003726) |
Gene overrepresentation in curated gene sets: canonical pathways category:
| Log-likelihood per target | Total log-likelihood | Term | Description |
|---|---|---|---|
| 0.8 | 86.8 | ST FAS SIGNALING PATHWAY | Fas Signaling Pathway |
| 0.4 | 19.7 | PID GLYPICAN 1PATHWAY | Glypican 1 network |
| 0.4 | 14.6 | PID CDC42 REG PATHWAY | Regulation of CDC42 activity |
| 0.3 | 11.8 | PID ERBB NETWORK PATHWAY | ErbB receptor signaling network |
| 0.3 | 21.3 | PID RAC1 REG PATHWAY | Regulation of RAC1 activity |
| 0.3 | 3.3 | ST PAC1 RECEPTOR PATHWAY | PAC1 Receptor Pathway |
| 0.2 | 9.3 | PID NETRIN PATHWAY | Netrin-mediated signaling events |
| 0.2 | 7.4 | PID ALPHA SYNUCLEIN PATHWAY | Alpha-synuclein signaling |
| 0.2 | 5.6 | PID PRL SIGNALING EVENTS PATHWAY | Signaling events mediated by PRL |
| 0.2 | 7.9 | PID NCADHERIN PATHWAY | N-cadherin signaling events |
| 0.1 | 6.9 | ST T CELL SIGNAL TRANSDUCTION | T Cell Signal Transduction |
| 0.1 | 3.3 | PID ERB GENOMIC PATHWAY | Validated nuclear estrogen receptor beta network |
| 0.1 | 6.5 | PID RHOA PATHWAY | RhoA signaling pathway |
| 0.1 | 3.7 | PID TELOMERASE PATHWAY | Regulation of Telomerase |
| 0.1 | 3.6 | PID ECADHERIN NASCENT AJ PATHWAY | E-cadherin signaling in the nascent adherens junction |
| 0.1 | 2.5 | PID PI3K PLC TRK PATHWAY | Trk receptor signaling mediated by PI3K and PLC-gamma |
| 0.1 | 2.9 | PID RETINOIC ACID PATHWAY | Retinoic acid receptors-mediated signaling |
| 0.1 | 4.3 | PID TRKR PATHWAY | Neurotrophic factor-mediated Trk receptor signaling |
| 0.1 | 3.9 | PID KIT PATHWAY | Signaling events mediated by Stem cell factor receptor (c-Kit) |
| 0.1 | 1.3 | PID EPHA FWDPATHWAY | EPHA forward signaling |
| 0.1 | 2.5 | PID SYNDECAN 4 PATHWAY | Syndecan-4-mediated signaling events |
| 0.1 | 3.0 | NABA PROTEOGLYCANS | Genes encoding proteoglycans |
| 0.1 | 2.2 | PID IL1 PATHWAY | IL1-mediated signaling events |
| 0.0 | 2.2 | PID FGF PATHWAY | FGF signaling pathway |
| 0.0 | 1.5 | PID INSULIN PATHWAY | Insulin Pathway |
| 0.0 | 2.8 | PID RHOA REG PATHWAY | Regulation of RhoA activity |
| 0.0 | 2.6 | PID MYC REPRESS PATHWAY | Validated targets of C-MYC transcriptional repression |
| 0.0 | 0.7 | PID ERBB2 ERBB3 PATHWAY | ErbB2/ErbB3 signaling events |
| 0.0 | 1.0 | PID REELIN PATHWAY | Reelin signaling pathway |
| 0.0 | 0.7 | PID P38 MKK3 6PATHWAY | p38 MAPK signaling pathway |
| 0.0 | 0.9 | PID RAS PATHWAY | Regulation of Ras family activation |
| 0.0 | 1.6 | PID VEGFR1 2 PATHWAY | Signaling events mediated by VEGFR1 and VEGFR2 |
| 0.0 | 1.7 | PID MTOR 4PATHWAY | mTOR signaling pathway |
| 0.0 | 0.8 | PID NOTCH PATHWAY | Notch signaling pathway |
| 0.0 | 6.1 | NABA ECM REGULATORS | Genes encoding enzymes and their regulators involved in the remodeling of the extracellular matrix |
| 0.0 | 0.6 | PID AR TF PATHWAY | Regulation of Androgen receptor activity |
| 0.0 | 0.7 | PID MYC ACTIV PATHWAY | Validated targets of C-MYC transcriptional activation |
| 0.0 | 0.4 | PID HES HEY PATHWAY | Notch-mediated HES/HEY network |
| 0.0 | 0.3 | PID AP1 PATHWAY | AP-1 transcription factor network |
Gene overrepresentation in curated gene sets: REACTOME pathways category:
| Log-likelihood per target | Total log-likelihood | Term | Description |
|---|---|---|---|
| 1.3 | 15.5 | REACTOME SYNTHESIS OF BILE ACIDS AND BILE SALTS VIA 24 HYDROXYCHOLESTEROL | Genes involved in Synthesis of bile acids and bile salts via 24-hydroxycholesterol |
| 1.1 | 19.2 | REACTOME THE NLRP3 INFLAMMASOME | Genes involved in The NLRP3 inflammasome |
| 0.9 | 26.2 | REACTOME INSULIN RECEPTOR RECYCLING | Genes involved in Insulin receptor recycling |
| 0.6 | 10.8 | REACTOME GAMMA CARBOXYLATION TRANSPORT AND AMINO TERMINAL CLEAVAGE OF PROTEINS | Genes involved in Gamma-carboxylation, transport, and amino-terminal cleavage of proteins |
| 0.5 | 14.2 | REACTOME POST CHAPERONIN TUBULIN FOLDING PATHWAY | Genes involved in Post-chaperonin tubulin folding pathway |
| 0.4 | 6.1 | REACTOME PYRIMIDINE CATABOLISM | Genes involved in Pyrimidine catabolism |
| 0.4 | 16.8 | REACTOME INTERACTION BETWEEN L1 AND ANKYRINS | Genes involved in Interaction between L1 and Ankyrins |
| 0.4 | 1.4 | REACTOME TRANSFERRIN ENDOCYTOSIS AND RECYCLING | Genes involved in Transferrin endocytosis and recycling |
| 0.3 | 9.6 | REACTOME DOWNREGULATION OF ERBB2 ERBB3 SIGNALING | Genes involved in Downregulation of ERBB2:ERBB3 signaling |
| 0.2 | 5.1 | REACTOME HYALURONAN UPTAKE AND DEGRADATION | Genes involved in Hyaluronan uptake and degradation |
| 0.2 | 12.3 | REACTOME GLYCOSPHINGOLIPID METABOLISM | Genes involved in Glycosphingolipid metabolism |
| 0.2 | 8.2 | REACTOME ASSOCIATION OF TRIC CCT WITH TARGET PROTEINS DURING BIOSYNTHESIS | Genes involved in Association of TriC/CCT with target proteins during biosynthesis |
| 0.2 | 2.0 | REACTOME SYNTHESIS OF BILE ACIDS AND BILE SALTS VIA 7ALPHA HYDROXYCHOLESTEROL | Genes involved in Synthesis of bile acids and bile salts via 7alpha-hydroxycholesterol |
| 0.2 | 2.9 | REACTOME ORGANIC CATION ANION ZWITTERION TRANSPORT | Genes involved in Organic cation/anion/zwitterion transport |
| 0.2 | 5.9 | REACTOME INHIBITION OF VOLTAGE GATED CA2 CHANNELS VIA GBETA GAMMA SUBUNITS | Genes involved in Inhibition of voltage gated Ca2+ channels via Gbeta/gamma subunits |
| 0.2 | 3.9 | REACTOME PROTEOLYTIC CLEAVAGE OF SNARE COMPLEX PROTEINS | Genes involved in Proteolytic cleavage of SNARE complex proteins |
| 0.1 | 2.2 | REACTOME ACTIVATION OF CHAPERONES BY ATF6 ALPHA | Genes involved in Activation of Chaperones by ATF6-alpha |
| 0.1 | 9.3 | REACTOME NETRIN1 SIGNALING | Genes involved in Netrin-1 signaling |
| 0.1 | 10.0 | REACTOME ACTIVATION OF CHAPERONE GENES BY XBP1S | Genes involved in Activation of Chaperone Genes by XBP1(S) |
| 0.1 | 22.1 | REACTOME SIGNALING BY RHO GTPASES | Genes involved in Signaling by Rho GTPases |
| 0.1 | 5.5 | REACTOME GLUCONEOGENESIS | Genes involved in Gluconeogenesis |
| 0.1 | 2.2 | REACTOME SHC1 EVENTS IN ERBB4 SIGNALING | Genes involved in SHC1 events in ERBB4 signaling |
| 0.1 | 14.7 | REACTOME FACTORS INVOLVED IN MEGAKARYOCYTE DEVELOPMENT AND PLATELET PRODUCTION | Genes involved in Factors involved in megakaryocyte development and platelet production |
| 0.1 | 4.5 | REACTOME GLUCOSE TRANSPORT | Genes involved in Glucose transport |
| 0.1 | 2.9 | REACTOME GABA A RECEPTOR ACTIVATION | Genes involved in GABA A receptor activation |
| 0.1 | 7.3 | REACTOME RESPIRATORY ELECTRON TRANSPORT | Genes involved in Respiratory electron transport |
| 0.1 | 2.5 | REACTOME CELL EXTRACELLULAR MATRIX INTERACTIONS | Genes involved in Cell-extracellular matrix interactions |
| 0.1 | 2.0 | REACTOME INHIBITION OF INSULIN SECRETION BY ADRENALINE NORADRENALINE | Genes involved in Inhibition of Insulin Secretion by Adrenaline/Noradrenaline |
| 0.1 | 1.3 | REACTOME FGFR4 LIGAND BINDING AND ACTIVATION | Genes involved in FGFR4 ligand binding and activation |
| 0.1 | 3.8 | REACTOME TRAFFICKING OF AMPA RECEPTORS | Genes involved in Trafficking of AMPA receptors |
| 0.1 | 2.5 | REACTOME AMYLOIDS | Genes involved in Amyloids |
| 0.1 | 0.7 | REACTOME G PROTEIN ACTIVATION | Genes involved in G-protein activation |
| 0.1 | 0.9 | REACTOME SHC MEDIATED CASCADE | Genes involved in SHC-mediated cascade |
| 0.0 | 1.1 | REACTOME ACYL CHAIN REMODELLING OF PE | Genes involved in Acyl chain remodelling of PE |
| 0.0 | 0.8 | REACTOME REGULATION OF PYRUVATE DEHYDROGENASE PDH COMPLEX | Genes involved in Regulation of pyruvate dehydrogenase (PDH) complex |
| 0.0 | 0.7 | REACTOME MTORC1 MEDIATED SIGNALLING | Genes involved in mTORC1-mediated signalling |
| 0.0 | 1.1 | REACTOME SYNTHESIS OF PC | Genes involved in Synthesis of PC |
| 0.0 | 0.6 | REACTOME BILE SALT AND ORGANIC ANION SLC TRANSPORTERS | Genes involved in Bile salt and organic anion SLC transporters |
| 0.0 | 1.0 | REACTOME SPHINGOLIPID DE NOVO BIOSYNTHESIS | Genes involved in Sphingolipid de novo biosynthesis |
| 0.0 | 1.3 | REACTOME GLUCAGON TYPE LIGAND RECEPTORS | Genes involved in Glucagon-type ligand receptors |
| 0.0 | 1.2 | REACTOME GLUTATHIONE CONJUGATION | Genes involved in Glutathione conjugation |
| 0.0 | 0.7 | REACTOME HIGHLY CALCIUM PERMEABLE POSTSYNAPTIC NICOTINIC ACETYLCHOLINE RECEPTORS | Genes involved in Highly calcium permeable postsynaptic nicotinic acetylcholine receptors |
| 0.0 | 0.6 | REACTOME METABOLISM OF POLYAMINES | Genes involved in Metabolism of polyamines |
| 0.0 | 1.6 | REACTOME IL1 SIGNALING | Genes involved in Interleukin-1 signaling |
| 0.0 | 0.4 | REACTOME NOTCH HLH TRANSCRIPTION PATHWAY | Genes involved in Notch-HLH transcription pathway |
| 0.0 | 1.3 | REACTOME SMOOTH MUSCLE CONTRACTION | Genes involved in Smooth Muscle Contraction |
| 0.0 | 0.4 | REACTOME GAP JUNCTION ASSEMBLY | Genes involved in Gap junction assembly |
| 0.0 | 1.5 | REACTOME INTERFERON GAMMA SIGNALING | Genes involved in Interferon gamma signaling |
| 0.0 | 1.1 | REACTOME MHC CLASS II ANTIGEN PRESENTATION | Genes involved in MHC class II antigen presentation |
| 0.0 | 3.3 | REACTOME ANTIGEN PROCESSING UBIQUITINATION PROTEASOME DEGRADATION | Genes involved in Antigen processing: Ubiquitination & Proteasome degradation |
| 0.0 | 0.8 | REACTOME CLASS B 2 SECRETIN FAMILY RECEPTORS | Genes involved in Class B/2 (Secretin family receptors) |
| 0.0 | 0.4 | REACTOME EFFECTS OF PIP2 HYDROLYSIS | Genes involved in Effects of PIP2 hydrolysis |