Project
GNF SymAtlas + NCI-60 cancer cell lines, human (Su, 2004; Ross, 2000)
Navigation
Downloads
Results for UAUUGCU
Z-value: 0.82
Motif logo

miRNA associated with seed UAUUGCU
| Name | miRBASE accession |
|---|---|
|
hsa-miR-137
|
MIMAT0000429 |
Activity profile of UAUUGCU motif
Sorted Z-values of UAUUGCU motif
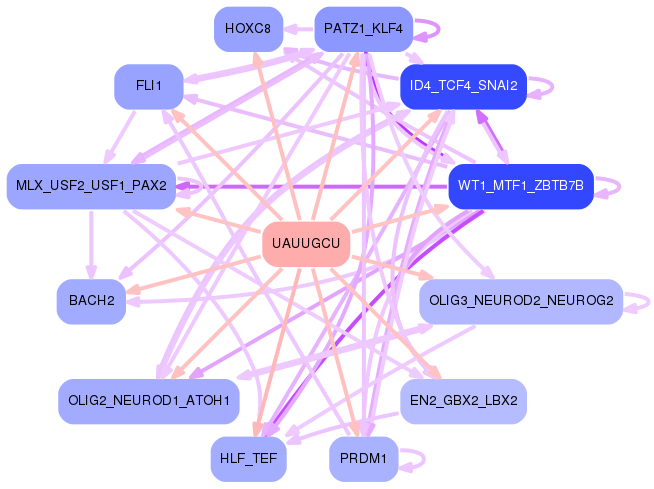
Network of associatons between targets according to the STRING database.

First level regulatory network of UAUUGCU
| Promoter | Score | Transcript | Gene | Gene Info |
|---|---|---|---|---|
| chr5_-_131796921 | 16.52 |
ENST00000307968.11
ENST00000307954.12 |
FNIP1
|
folliculin interacting protein 1 |
| chr2_+_112275588 | 15.53 |
ENST00000409871.6
ENST00000343936.4 |
ZC3H6
|
zinc finger CCCH-type containing 6 |
| chr11_-_113875555 | 14.76 |
ENST00000003302.8
ENST00000545540.5 |
USP28
|
ubiquitin specific peptidase 28 |
| chr6_+_11537738 | 11.33 |
ENST00000379426.2
|
TMEM170B
|
transmembrane protein 170B |
| chr18_-_61892997 | 9.41 |
ENST00000312828.4
|
RNF152
|
ring finger protein 152 |
| chr4_+_7043315 | 8.81 |
ENST00000310074.8
ENST00000512388.1 |
TADA2B
|
transcriptional adaptor 2B |
| chr7_+_139231225 | 8.74 |
ENST00000473989.8
|
UBN2
|
ubinuclein 2 |
| chr22_+_41381923 | 8.68 |
ENST00000266304.9
|
TEF
|
TEF transcription factor, PAR bZIP family member |
| chr17_-_76240478 | 8.28 |
ENST00000269391.11
|
RNF157
|
ring finger protein 157 |
| chr19_+_1205761 | 8.12 |
ENST00000326873.12
ENST00000586243.5 |
STK11
|
serine/threonine kinase 11 |
| chr8_+_141391989 | 8.10 |
ENST00000520105.5
ENST00000523147.5 ENST00000521578.6 |
PTP4A3
|
protein tyrosine phosphatase 4A3 |
| chr5_-_172771187 | 7.83 |
ENST00000239223.4
|
DUSP1
|
dual specificity phosphatase 1 |
| chr7_-_35695120 | 7.69 |
ENST00000311350.8
ENST00000396081.5 |
HERPUD2
|
HERPUD family member 2 |
| chr20_+_56358938 | 7.69 |
ENST00000371384.4
ENST00000437418.1 |
FAM210B
|
family with sequence similarity 210 member B |
| chr1_+_236686454 | 7.67 |
ENST00000542672.6
ENST00000366578.6 ENST00000682015.1 ENST00000651275.1 |
ACTN2
|
actinin alpha 2 |
| chr11_-_18634332 | 7.29 |
ENST00000336349.6
|
SPTY2D1
|
SPT2 chromatin protein domain containing 1 |
| chr8_-_65842051 | 7.21 |
ENST00000401827.8
|
PDE7A
|
phosphodiesterase 7A |
| chr8_+_38176802 | 7.03 |
ENST00000287322.5
|
BAG4
|
BAG cochaperone 4 |
| chr12_-_42144823 | 6.97 |
ENST00000398675.8
|
GXYLT1
|
glucoside xylosyltransferase 1 |
| chr1_+_43650118 | 6.90 |
ENST00000372396.4
|
KDM4A
|
lysine demethylase 4A |
| chr4_+_127965394 | 6.81 |
ENST00000645843.2
ENST00000388795.9 |
ABHD18
|
abhydrolase domain containing 18 |
| chr14_-_44961889 | 6.79 |
ENST00000579157.1
ENST00000396128.9 ENST00000556500.1 |
KLHL28
|
kelch like family member 28 |
| chr19_-_11481044 | 6.78 |
ENST00000359227.8
|
ELAVL3
|
ELAV like RNA binding protein 3 |
| chrX_+_129779930 | 6.77 |
ENST00000356892.4
|
SASH3
|
SAM and SH3 domain containing 3 |
| chr7_-_44885446 | 6.76 |
ENST00000395699.5
|
PURB
|
purine rich element binding protein B |
| chr18_+_46334007 | 6.53 |
ENST00000269439.12
ENST00000590330.1 |
RNF165
|
ring finger protein 165 |
| chr18_-_76495191 | 6.46 |
ENST00000443185.7
|
ZNF516
|
zinc finger protein 516 |
| chr2_-_9003657 | 6.42 |
ENST00000462696.1
ENST00000305997.8 |
MBOAT2
|
membrane bound O-acyltransferase domain containing 2 |
| chr15_-_58065703 | 6.20 |
ENST00000249750.9
|
ALDH1A2
|
aldehyde dehydrogenase 1 family member A2 |
| chr2_-_201071579 | 6.19 |
ENST00000453765.5
ENST00000452799.5 ENST00000446678.5 ENST00000418596.7 ENST00000681958.1 |
FAM126B
|
family with sequence similarity 126 member B |
| chr6_+_57090069 | 6.18 |
ENST00000370708.8
ENST00000370702.5 |
ZNF451
|
zinc finger protein 451 |
| chr2_+_10043524 | 6.18 |
ENST00000305883.6
|
KLF11
|
Kruppel like factor 11 |
| chr17_-_1628808 | 6.16 |
ENST00000301335.10
|
SLC43A2
|
solute carrier family 43 member 2 |
| chr19_+_4007714 | 6.12 |
ENST00000262971.3
|
PIAS4
|
protein inhibitor of activated STAT 4 |
| chr12_+_119668109 | 6.05 |
ENST00000229328.10
ENST00000630317.1 |
PRKAB1
|
protein kinase AMP-activated non-catalytic subunit beta 1 |
| chr17_-_65056659 | 5.99 |
ENST00000439174.7
|
GNA13
|
G protein subunit alpha 13 |
| chrX_+_111096136 | 5.85 |
ENST00000372007.10
|
PAK3
|
p21 (RAC1) activated kinase 3 |
| chr2_-_25252251 | 5.83 |
ENST00000380746.8
ENST00000402667.1 |
DNMT3A
|
DNA methyltransferase 3 alpha |
| chr9_-_107489754 | 5.83 |
ENST00000610832.1
ENST00000374672.5 |
KLF4
|
Kruppel like factor 4 |
| chr22_+_29480211 | 5.72 |
ENST00000310624.7
|
NEFH
|
neurofilament heavy |
| chr1_-_155562693 | 5.69 |
ENST00000368346.7
ENST00000392403.8 ENST00000679333.1 ENST00000679133.1 |
ASH1L
|
ASH1 like histone lysine methyltransferase |
| chr5_-_65722094 | 5.66 |
ENST00000381007.9
|
SGTB
|
small glutamine rich tetratricopeptide repeat containing beta |
| chr20_+_24469623 | 5.65 |
ENST00000376862.4
|
SYNDIG1
|
synapse differentiation inducing 1 |
| chrX_-_40735476 | 5.63 |
ENST00000324817.6
|
MED14
|
mediator complex subunit 14 |
| chr2_+_69915100 | 5.59 |
ENST00000264444.7
|
MXD1
|
MAX dimerization protein 1 |
| chr6_+_106098933 | 5.49 |
ENST00000369089.3
|
PRDM1
|
PR/SET domain 1 |
| chr12_+_69470349 | 5.48 |
ENST00000547219.5
ENST00000550316.5 ENST00000548154.5 ENST00000547414.5 ENST00000549921.6 ENST00000550389.5 ENST00000550937.5 ENST00000549092.5 ENST00000550169.5 |
FRS2
|
fibroblast growth factor receptor substrate 2 |
| chr14_+_92923143 | 5.44 |
ENST00000216492.10
ENST00000334654.4 |
CHGA
|
chromogranin A |
| chr4_-_152536045 | 5.40 |
ENST00000603548.6
ENST00000281708.10 |
FBXW7
|
F-box and WD repeat domain containing 7 |
| chr18_+_9136757 | 5.39 |
ENST00000262126.9
ENST00000577992.1 |
ANKRD12
|
ankyrin repeat domain 12 |
| chr11_+_121452291 | 5.38 |
ENST00000260197.12
|
SORL1
|
sortilin related receptor 1 |
| chr12_+_54008961 | 5.34 |
ENST00000040584.6
|
HOXC8
|
homeobox C8 |
| chr19_-_45160815 | 5.31 |
ENST00000317951.6
|
NKPD1
|
NTPase KAP family P-loop domain containing 1 |
| chr20_+_46029206 | 5.31 |
ENST00000243964.7
|
SLC12A5
|
solute carrier family 12 member 5 |
| chr15_-_34336749 | 5.24 |
ENST00000397707.6
ENST00000560611.5 |
SLC12A6
|
solute carrier family 12 member 6 |
| chr7_-_122886706 | 5.22 |
ENST00000313070.11
ENST00000334010.11 ENST00000615869.4 |
CADPS2
|
calcium dependent secretion activator 2 |
| chr4_+_54657918 | 5.06 |
ENST00000412167.6
ENST00000288135.6 |
KIT
|
KIT proto-oncogene, receptor tyrosine kinase |
| chr9_-_120714457 | 5.04 |
ENST00000373930.4
|
MEGF9
|
multiple EGF like domains 9 |
| chr11_-_66568524 | 5.03 |
ENST00000679160.1
ENST00000678305.1 ENST00000310325.10 ENST00000677896.1 ENST00000677587.1 ENST00000679347.1 ENST00000677005.1 ENST00000678872.1 ENST00000679024.1 ENST00000678471.1 ENST00000524994.6 |
CTSF
|
cathepsin F |
| chr17_-_39607876 | 4.98 |
ENST00000302584.5
|
NEUROD2
|
neuronal differentiation 2 |
| chr7_-_140176970 | 4.90 |
ENST00000397560.7
|
KDM7A
|
lysine demethylase 7A |
| chr7_-_44490609 | 4.86 |
ENST00000355451.8
|
NUDCD3
|
NudC domain containing 3 |
| chr12_-_120369156 | 4.85 |
ENST00000257552.7
|
MSI1
|
musashi RNA binding protein 1 |
| chr1_-_38005484 | 4.82 |
ENST00000373016.4
|
FHL3
|
four and a half LIM domains 3 |
| chr3_-_21751189 | 4.77 |
ENST00000281523.8
|
ZNF385D
|
zinc finger protein 385D |
| chr20_+_38805686 | 4.77 |
ENST00000299824.6
ENST00000373331.2 |
PPP1R16B
|
protein phosphatase 1 regulatory subunit 16B |
| chr7_+_107044689 | 4.76 |
ENST00000265717.5
|
PRKAR2B
|
protein kinase cAMP-dependent type II regulatory subunit beta |
| chr12_+_104064520 | 4.69 |
ENST00000229330.9
|
HCFC2
|
host cell factor C2 |
| chrX_+_21839599 | 4.56 |
ENST00000379484.10
|
MBTPS2
|
membrane bound transcription factor peptidase, site 2 |
| chr20_-_44311142 | 4.55 |
ENST00000396825.4
|
FITM2
|
fat storage inducing transmembrane protein 2 |
| chr2_-_181680490 | 4.53 |
ENST00000684145.1
ENST00000295108.4 ENST00000684079.1 ENST00000683430.1 |
CERKL
NEUROD1
|
ceramide kinase like neuronal differentiation 1 |
| chr17_-_44503369 | 4.50 |
ENST00000585614.1
ENST00000591680.6 |
GPATCH8
|
G-patch domain containing 8 |
| chr3_+_49554436 | 4.48 |
ENST00000296452.5
|
BSN
|
bassoon presynaptic cytomatrix protein |
| chr1_+_89995102 | 4.46 |
ENST00000340281.9
ENST00000361911.9 ENST00000370447.3 |
ZNF326
|
zinc finger protein 326 |
| chr11_-_73598183 | 4.44 |
ENST00000064778.8
|
FAM168A
|
family with sequence similarity 168 member A |
| chr19_+_48619489 | 4.40 |
ENST00000245222.9
|
SPHK2
|
sphingosine kinase 2 |
| chr11_-_64803152 | 4.38 |
ENST00000439069.5
ENST00000294066.7 ENST00000377350.7 |
MAP4K2
|
mitogen-activated protein kinase kinase kinase kinase 2 |
| chr21_-_17819386 | 4.34 |
ENST00000400559.7
ENST00000400558.7 |
C21orf91
|
chromosome 21 open reading frame 91 |
| chr4_+_48016764 | 4.32 |
ENST00000295461.10
|
NIPAL1
|
NIPA like domain containing 1 |
| chr11_+_128694052 | 4.30 |
ENST00000527786.7
ENST00000534087.3 |
FLI1
|
Fli-1 proto-oncogene, ETS transcription factor |
| chr6_-_90296824 | 4.30 |
ENST00000257749.9
|
BACH2
|
BTB domain and CNC homolog 2 |
| chr12_+_4909895 | 4.26 |
ENST00000638821.1
ENST00000382545.5 |
ENSG00000256654.4
KCNA1
|
novel transcript, sense overlapping KCNA1 potassium voltage-gated channel subfamily A member 1 |
| chr7_+_155458129 | 4.23 |
ENST00000297375.4
|
EN2
|
engrailed homeobox 2 |
| chr12_+_55019967 | 4.20 |
ENST00000242994.4
|
NEUROD4
|
neuronal differentiation 4 |
| chr1_-_40665654 | 4.19 |
ENST00000372684.8
|
RIMS3
|
regulating synaptic membrane exocytosis 3 |
| chr10_-_35642286 | 4.17 |
ENST00000374694.3
|
FZD8
|
frizzled class receptor 8 |
| chr19_+_35269065 | 4.16 |
ENST00000595068.5
ENST00000379134.7 ENST00000594064.5 ENST00000598058.1 |
USF2
|
upstream transcription factor 2, c-fos interacting |
| chr3_+_10992717 | 4.12 |
ENST00000642767.1
ENST00000425938.6 ENST00000642515.1 ENST00000643498.1 ENST00000646072.1 ENST00000646570.1 ENST00000287766.10 ENST00000645281.1 ENST00000642820.1 ENST00000645054.1 ENST00000642735.1 ENST00000646022.1 ENST00000645776.1 ENST00000645592.1 ENST00000646924.1 ENST00000645974.1 ENST00000644314.1 ENST00000642639.1 ENST00000646060.1 ENST00000642201.1 ENST00000646487.1 ENST00000647194.1 ENST00000646088.1 |
SLC6A1
|
solute carrier family 6 member 1 |
| chr11_-_119729158 | 4.10 |
ENST00000264025.8
|
NECTIN1
|
nectin cell adhesion molecule 1 |
| chr5_+_153490655 | 4.09 |
ENST00000518142.5
ENST00000285900.10 |
GRIA1
|
glutamate ionotropic receptor AMPA type subunit 1 |
| chr5_+_56815534 | 4.06 |
ENST00000399503.4
|
MAP3K1
|
mitogen-activated protein kinase kinase kinase 1 |
| chr1_-_72282457 | 4.04 |
ENST00000357731.10
|
NEGR1
|
neuronal growth regulator 1 |
| chr14_-_99272184 | 4.04 |
ENST00000357195.8
|
BCL11B
|
BAF chromatin remodeling complex subunit BCL11B |
| chr1_+_95117324 | 3.98 |
ENST00000370203.9
ENST00000456991.5 |
TLCD4
|
TLC domain containing 4 |
| chr11_-_62591554 | 3.98 |
ENST00000494385.1
ENST00000308436.11 |
TUT1
|
terminal uridylyl transferase 1, U6 snRNA-specific |
| chr18_-_55588184 | 3.96 |
ENST00000354452.8
ENST00000565908.6 ENST00000635822.2 |
TCF4
|
transcription factor 4 |
| chr5_-_94111627 | 3.96 |
ENST00000505869.5
ENST00000395965.8 ENST00000509163.5 |
FAM172A
|
family with sequence similarity 172 member A |
| chr4_-_89307732 | 3.95 |
ENST00000609438.2
|
GPRIN3
|
GPRIN family member 3 |
| chr5_+_80035341 | 3.94 |
ENST00000350881.6
|
THBS4
|
thrombospondin 4 |
| chr21_+_43865200 | 3.92 |
ENST00000291572.13
|
AGPAT3
|
1-acylglycerol-3-phosphate O-acyltransferase 3 |
| chr19_+_1285859 | 3.86 |
ENST00000215368.4
|
EFNA2
|
ephrin A2 |
| chr4_-_140427635 | 3.84 |
ENST00000325617.10
ENST00000414773.5 |
CLGN
|
calmegin |
| chr12_+_122835426 | 3.84 |
ENST00000253083.9
|
HIP1R
|
huntingtin interacting protein 1 related |
| chr9_+_112486819 | 3.82 |
ENST00000337530.11
|
KIAA1958
|
KIAA1958 |
| chr16_-_2214776 | 3.82 |
ENST00000333503.8
|
PGP
|
phosphoglycolate phosphatase |
| chr12_-_52680398 | 3.80 |
ENST00000252244.3
|
KRT1
|
keratin 1 |
| chr17_+_55264952 | 3.79 |
ENST00000226067.10
|
HLF
|
HLF transcription factor, PAR bZIP family member |
| chr13_+_23180960 | 3.78 |
ENST00000218867.4
|
SGCG
|
sarcoglycan gamma |
| chr4_+_88592426 | 3.75 |
ENST00000431413.5
ENST00000402738.6 ENST00000422770.5 ENST00000407637.5 |
HERC3
|
HECT and RLD domain containing E3 ubiquitin protein ligase 3 |
| chr1_+_155002630 | 3.75 |
ENST00000535420.5
ENST00000417934.6 ENST00000368426.3 |
ZBTB7B
|
zinc finger and BTB domain containing 7B |
| chr6_-_30075767 | 3.74 |
ENST00000244360.8
ENST00000376751.8 |
RNF39
|
ring finger protein 39 |
| chr9_-_89178810 | 3.70 |
ENST00000375835.9
|
SHC3
|
SHC adaptor protein 3 |
| chr3_-_115071333 | 3.69 |
ENST00000462705.5
|
ZBTB20
|
zinc finger and BTB domain containing 20 |
| chrX_-_154805386 | 3.69 |
ENST00000393531.5
ENST00000369534.8 ENST00000453245.5 ENST00000428488.1 ENST00000369531.1 |
MPP1
|
membrane palmitoylated protein 1 |
| chr19_+_49527988 | 3.68 |
ENST00000270645.8
|
RCN3
|
reticulocalbin 3 |
| chr14_-_99604167 | 3.63 |
ENST00000380243.9
|
CCDC85C
|
coiled-coil domain containing 85C |
| chr6_-_46325641 | 3.62 |
ENST00000330430.10
ENST00000405162.2 |
RCAN2
|
regulator of calcineurin 2 |
| chr16_+_68023276 | 3.56 |
ENST00000567100.5
ENST00000565263.6 ENST00000432752.5 ENST00000569289.5 ENST00000564781.1 |
DUS2
|
dihydrouridine synthase 2 |
| chr7_+_21428023 | 3.54 |
ENST00000432066.2
ENST00000222584.8 |
SP4
|
Sp4 transcription factor |
| chr2_-_216695540 | 3.52 |
ENST00000233813.5
|
IGFBP5
|
insulin like growth factor binding protein 5 |
| chr4_+_77157189 | 3.51 |
ENST00000316355.10
ENST00000502280.5 |
CCNG2
|
cyclin G2 |
| chr18_+_13218769 | 3.50 |
ENST00000677055.1
ENST00000399848.7 |
LDLRAD4
|
low density lipoprotein receptor class A domain containing 4 |
| chr15_+_64841873 | 3.49 |
ENST00000616065.4
ENST00000323544.5 |
PLEKHO2
|
pleckstrin homology domain containing O2 |
| chr15_+_79432330 | 3.49 |
ENST00000305428.8
|
MINAR1
|
membrane integral NOTCH2 associated receptor 1 |
| chr3_-_126357399 | 3.49 |
ENST00000296233.4
|
KLF15
|
Kruppel like factor 15 |
| chr11_+_65711991 | 3.48 |
ENST00000377046.7
ENST00000352980.8 |
KAT5
|
lysine acetyltransferase 5 |
| chr18_+_70288991 | 3.46 |
ENST00000397942.4
|
SOCS6
|
suppressor of cytokine signaling 6 |
| chr14_+_64704380 | 3.46 |
ENST00000247226.13
ENST00000394691.7 |
PLEKHG3
|
pleckstrin homology and RhoGEF domain containing G3 |
| chr2_-_43226594 | 3.44 |
ENST00000282388.4
|
ZFP36L2
|
ZFP36 ring finger protein like 2 |
| chrX_+_129982610 | 3.40 |
ENST00000218147.11
ENST00000540052.6 |
BCORL1
|
BCL6 corepressor like 1 |
| chr1_+_169368175 | 3.38 |
ENST00000367808.8
ENST00000426663.1 |
BLZF1
|
basic leucine zipper nuclear factor 1 |
| chr20_+_33490073 | 3.38 |
ENST00000342704.11
ENST00000375279.6 |
CBFA2T2
|
CBFA2/RUNX1 partner transcriptional co-repressor 2 |
| chr16_+_66844914 | 3.37 |
ENST00000394069.3
|
CA7
|
carbonic anhydrase 7 |
| chr1_-_31239880 | 3.37 |
ENST00000373736.7
|
NKAIN1
|
sodium/potassium transporting ATPase interacting 1 |
| chr7_+_139341311 | 3.32 |
ENST00000297534.7
ENST00000541515.3 |
FMC1
FMC1-LUC7L2
|
formation of mitochondrial complex V assembly factor 1 homolog FMC1-LUC7L2 readthrough |
| chr10_-_51699559 | 3.32 |
ENST00000331173.6
|
CSTF2T
|
cleavage stimulation factor subunit 2 tau variant |
| chr10_+_114043858 | 3.31 |
ENST00000369295.4
|
ADRB1
|
adrenoceptor beta 1 |
| chr1_+_212950572 | 3.29 |
ENST00000366968.8
ENST00000490792.1 ENST00000366964.7 |
VASH2
|
vasohibin 2 |
| chr12_+_78864768 | 3.23 |
ENST00000261205.9
ENST00000457153.6 |
SYT1
|
synaptotagmin 1 |
| chr22_+_41560973 | 3.23 |
ENST00000306149.12
|
CSDC2
|
cold shock domain containing C2 |
| chr2_+_86720282 | 3.22 |
ENST00000283632.5
|
RMND5A
|
required for meiotic nuclear division 5 homolog A |
| chr19_+_10420474 | 3.22 |
ENST00000380702.7
|
PDE4A
|
phosphodiesterase 4A |
| chrX_+_118974608 | 3.21 |
ENST00000304778.11
ENST00000371628.8 |
LONRF3
|
LON peptidase N-terminal domain and ring finger 3 |
| chr11_-_1572261 | 3.19 |
ENST00000397374.8
|
DUSP8
|
dual specificity phosphatase 8 |
| chr9_-_98708856 | 3.17 |
ENST00000259455.4
|
GABBR2
|
gamma-aminobutyric acid type B receptor subunit 2 |
| chr11_+_118436464 | 3.17 |
ENST00000389506.10
ENST00000534358.8 ENST00000531904.6 ENST00000649699.1 |
KMT2A
|
lysine methyltransferase 2A |
| chr15_-_79090760 | 3.15 |
ENST00000419573.7
ENST00000558480.7 |
RASGRF1
|
Ras protein specific guanine nucleotide releasing factor 1 |
| chr10_-_72088533 | 3.15 |
ENST00000373109.7
|
SPOCK2
|
SPARC (osteonectin), cwcv and kazal like domains proteoglycan 2 |
| chr1_-_46132616 | 3.14 |
ENST00000423209.5
ENST00000262741.10 |
PIK3R3
|
phosphoinositide-3-kinase regulatory subunit 3 |
| chr4_+_92303946 | 3.13 |
ENST00000282020.9
|
GRID2
|
glutamate ionotropic receptor delta type subunit 2 |
| chr2_+_176107272 | 3.12 |
ENST00000249504.7
|
HOXD11
|
homeobox D11 |
| chr19_+_589873 | 3.10 |
ENST00000251287.3
|
HCN2
|
hyperpolarization activated cyclic nucleotide gated potassium and sodium channel 2 |
| chr12_+_56007484 | 3.09 |
ENST00000262032.9
|
IKZF4
|
IKAROS family zinc finger 4 |
| chr12_+_2052977 | 3.08 |
ENST00000399634.6
ENST00000406454.8 ENST00000327702.12 ENST00000347598.9 ENST00000399603.6 ENST00000399641.6 ENST00000399655.6 ENST00000335762.10 ENST00000682835.1 |
CACNA1C
|
calcium voltage-gated channel subunit alpha1 C |
| chr16_+_11668414 | 3.08 |
ENST00000329565.6
|
SNN
|
stannin |
| chr12_+_69239560 | 3.07 |
ENST00000435070.7
|
CPSF6
|
cleavage and polyadenylation specific factor 6 |
| chr7_+_98106852 | 3.03 |
ENST00000297293.6
|
LMTK2
|
lemur tyrosine kinase 2 |
| chr12_-_53727428 | 3.02 |
ENST00000548263.5
ENST00000430117.6 ENST00000549173.5 ENST00000550804.6 ENST00000551900.5 ENST00000546619.5 ENST00000548177.5 ENST00000549349.5 |
CALCOCO1
|
calcium binding and coiled-coil domain 1 |
| chr12_+_53380639 | 3.00 |
ENST00000426431.2
|
SP1
|
Sp1 transcription factor |
| chr7_+_4682252 | 2.99 |
ENST00000328914.5
|
FOXK1
|
forkhead box K1 |
| chr11_+_24497155 | 2.97 |
ENST00000529015.5
ENST00000533227.5 |
LUZP2
|
leucine zipper protein 2 |
| chr14_+_73644875 | 2.97 |
ENST00000554113.5
ENST00000553645.7 ENST00000555631.6 ENST00000311089.7 ENST00000555919.7 ENST00000554339.5 ENST00000554871.5 |
DNAL1
|
dynein axonemal light chain 1 |
| chr1_+_213987929 | 2.97 |
ENST00000498508.6
ENST00000366958.9 |
PROX1
|
prospero homeobox 1 |
| chr3_+_37452121 | 2.95 |
ENST00000264741.10
|
ITGA9
|
integrin subunit alpha 9 |
| chr19_+_16324817 | 2.94 |
ENST00000248071.6
ENST00000592003.1 |
KLF2
|
Kruppel like factor 2 |
| chr17_+_50561010 | 2.89 |
ENST00000360761.8
ENST00000354983.8 ENST00000352832.9 |
CACNA1G
|
calcium voltage-gated channel subunit alpha1 G |
| chr7_-_72336995 | 2.88 |
ENST00000329008.9
|
CALN1
|
calneuron 1 |
| chr10_+_94402486 | 2.87 |
ENST00000225235.5
|
TBC1D12
|
TBC1 domain family member 12 |
| chr21_+_29298890 | 2.86 |
ENST00000286800.8
|
BACH1
|
BTB domain and CNC homolog 1 |
| chr1_+_222618075 | 2.86 |
ENST00000344922.10
|
MIA3
|
MIA SH3 domain ER export factor 3 |
| chr6_+_63635792 | 2.85 |
ENST00000262043.8
ENST00000506783.5 ENST00000481385.6 ENST00000515594.5 ENST00000494284.6 |
PHF3
|
PHD finger protein 3 |
| chr14_-_81220951 | 2.82 |
ENST00000553612.6
|
GTF2A1
|
general transcription factor IIA subunit 1 |
| chrX_+_154458274 | 2.82 |
ENST00000369682.4
|
PLXNA3
|
plexin A3 |
| chr15_-_45522747 | 2.81 |
ENST00000261867.5
|
SLC30A4
|
solute carrier family 30 member 4 |
| chrX_-_46759055 | 2.78 |
ENST00000328306.4
ENST00000616978.5 |
SLC9A7
|
solute carrier family 9 member A7 |
| chr12_-_49110840 | 2.77 |
ENST00000550137.5
ENST00000267102.13 ENST00000547382.5 |
LMBR1L
|
limb development membrane protein 1 like |
| chr11_-_132943671 | 2.77 |
ENST00000331898.11
|
OPCML
|
opioid binding protein/cell adhesion molecule like |
| chr11_-_107018462 | 2.77 |
ENST00000526355.7
|
GUCY1A2
|
guanylate cyclase 1 soluble subunit alpha 2 |
| chr1_+_220528112 | 2.76 |
ENST00000366917.6
ENST00000402574.5 ENST00000611084.4 ENST00000366918.8 |
MARK1
|
microtubule affinity regulating kinase 1 |
| chr17_-_64263221 | 2.75 |
ENST00000258991.7
ENST00000583738.1 ENST00000584379.6 |
TEX2
|
testis expressed 2 |
| chr1_+_15617415 | 2.74 |
ENST00000480945.6
|
DDI2
|
DNA damage inducible 1 homolog 2 |
| chr3_-_69052309 | 2.73 |
ENST00000398559.7
ENST00000646708.1 ENST00000646304.1 |
TMF1
|
TATA element modulatory factor 1 |
| chr14_-_24442765 | 2.72 |
ENST00000555365.5
ENST00000399395.8 ENST00000553930.5 |
SDR39U1
|
short chain dehydrogenase/reductase family 39U member 1 |
| chr5_+_7396099 | 2.71 |
ENST00000338316.9
|
ADCY2
|
adenylate cyclase 2 |
| chr2_+_156436423 | 2.70 |
ENST00000540309.5
|
GPD2
|
glycerol-3-phosphate dehydrogenase 2 |
| chr19_+_35030438 | 2.68 |
ENST00000415950.5
ENST00000262631.11 |
SCN1B
|
sodium voltage-gated channel beta subunit 1 |
| chr5_-_40798160 | 2.67 |
ENST00000296800.4
ENST00000397128.6 |
PRKAA1
|
protein kinase AMP-activated catalytic subunit alpha 1 |
| chr9_-_109167159 | 2.65 |
ENST00000561981.5
|
FRRS1L
|
ferric chelate reductase 1 like |
| chr17_-_7929793 | 2.65 |
ENST00000303790.3
|
KCNAB3
|
potassium voltage-gated channel subfamily A regulatory beta subunit 3 |
| chr11_-_790062 | 2.64 |
ENST00000330106.5
|
CEND1
|
cell cycle exit and neuronal differentiation 1 |
| chr2_+_165239388 | 2.61 |
ENST00000424833.5
ENST00000375437.7 ENST00000631182.3 |
SCN2A
|
sodium voltage-gated channel alpha subunit 2 |
| chr9_-_10612966 | 2.59 |
ENST00000381196.9
|
PTPRD
|
protein tyrosine phosphatase receptor type D |
| chr21_-_32727933 | 2.57 |
ENST00000357345.7
ENST00000429236.5 |
SYNJ1
|
synaptojanin 1 |
| chr5_+_31639104 | 2.53 |
ENST00000438447.2
|
PDZD2
|
PDZ domain containing 2 |
| chr8_-_143541425 | 2.53 |
ENST00000262577.6
|
ZC3H3
|
zinc finger CCCH-type containing 3 |
| chr11_-_45665578 | 2.53 |
ENST00000308064.7
|
CHST1
|
carbohydrate sulfotransferase 1 |
| chr11_+_17734732 | 2.51 |
ENST00000379472.4
ENST00000675775.1 ENST00000265969.8 ENST00000640318.2 ENST00000639325.2 |
KCNC1
|
potassium voltage-gated channel subfamily C member 1 |
| chr2_+_66435558 | 2.50 |
ENST00000488550.5
|
MEIS1
|
Meis homeobox 1 |
| chr5_-_176899332 | 2.50 |
ENST00000292432.10
|
HK3
|
hexokinase 3 |
| chr20_+_43457885 | 2.50 |
ENST00000668808.1
ENST00000670741.1 ENST00000662078.1 ENST00000244020.5 ENST00000657241.1 |
SRSF6
ENSG00000288000.1
|
serine and arginine rich splicing factor 6 novel protein |
Gene Ontology Analysis
Gene overrepresentation in biological process category:
| Log-likelihood per target | Total log-likelihood | Term | Description |
|---|---|---|---|
| 3.3 | 16.5 | GO:0002904 | positive regulation of B cell apoptotic process(GO:0002904) |
| 2.8 | 8.5 | GO:0046619 | optic placode formation involved in camera-type eye formation(GO:0046619) |
| 2.7 | 10.8 | GO:0071409 | cellular response to cycloheximide(GO:0071409) |
| 2.4 | 7.3 | GO:0010847 | regulation of chromatin assembly(GO:0010847) |
| 2.1 | 6.2 | GO:2000616 | negative regulation of histone H3-K9 acetylation(GO:2000616) |
| 1.9 | 7.7 | GO:0086097 | phospholipase C-activating angiotensin-activated signaling pathway(GO:0086097) |
| 1.8 | 5.5 | GO:1990654 | regulation of extrathymic T cell differentiation(GO:0033082) sebum secreting cell proliferation(GO:1990654) |
| 1.8 | 5.4 | GO:1901899 | positive regulation of relaxation of cardiac muscle(GO:1901899) |
| 1.8 | 5.4 | GO:1902948 | regulation of choline O-acetyltransferase activity(GO:1902769) positive regulation of choline O-acetyltransferase activity(GO:1902771) negative regulation of tau-protein kinase activity(GO:1902948) positive regulation of early endosome to recycling endosome transport(GO:1902955) negative regulation of aspartic-type endopeptidase activity involved in amyloid precursor protein catabolic process(GO:1902960) negative regulation of neurofibrillary tangle assembly(GO:1902997) negative regulation of aspartic-type peptidase activity(GO:1905246) |
| 1.7 | 5.1 | GO:0070662 | erythropoietin-mediated signaling pathway(GO:0038162) mast cell proliferation(GO:0070662) |
| 1.6 | 4.9 | GO:0035574 | histone H4-K20 demethylation(GO:0035574) |
| 1.6 | 17.5 | GO:1904262 | negative regulation of TORC1 signaling(GO:1904262) |
| 1.6 | 4.8 | GO:1902309 | negative regulation of peptidyl-serine dephosphorylation(GO:1902309) |
| 1.5 | 9.0 | GO:0035881 | amacrine cell differentiation(GO:0035881) |
| 1.5 | 4.5 | GO:0098928 | presynaptic signal transduction(GO:0098928) presynapse to nucleus signaling pathway(GO:0099526) |
| 1.5 | 4.4 | GO:1905053 | regulation of base-excision repair(GO:1905051) positive regulation of base-excision repair(GO:1905053) |
| 1.4 | 5.7 | GO:0033693 | neurofilament bundle assembly(GO:0033693) |
| 1.4 | 5.7 | GO:0097676 | histone H3-K36 dimethylation(GO:0097676) |
| 1.4 | 4.1 | GO:0051939 | gamma-aminobutyric acid import(GO:0051939) |
| 1.3 | 5.4 | GO:2000639 | regulation of SREBP signaling pathway(GO:2000638) negative regulation of SREBP signaling pathway(GO:2000639) |
| 1.3 | 4.0 | GO:0097535 | lymphoid lineage cell migration(GO:0097534) lymphoid lineage cell migration into thymus(GO:0097535) |
| 1.3 | 3.9 | GO:0071603 | endothelial cell-cell adhesion(GO:0071603) |
| 1.2 | 3.7 | GO:0043376 | regulation of CD8-positive, alpha-beta T cell differentiation(GO:0043376) |
| 1.2 | 5.0 | GO:2000297 | negative regulation of synapse maturation(GO:2000297) |
| 1.2 | 3.7 | GO:0061386 | closure of optic fissure(GO:0061386) |
| 1.2 | 3.5 | GO:1904204 | regulation of skeletal muscle hypertrophy(GO:1904204) |
| 1.1 | 3.3 | GO:0002025 | vasodilation by norepinephrine-epinephrine involved in regulation of systemic arterial blood pressure(GO:0002025) positive regulation of the force of heart contraction by chemical signal(GO:0003099) |
| 1.1 | 4.4 | GO:0006669 | sphinganine-1-phosphate biosynthetic process(GO:0006669) |
| 1.1 | 3.2 | GO:0098746 | fast, calcium ion-dependent exocytosis of neurotransmitter(GO:0098746) |
| 1.1 | 3.2 | GO:1901674 | histone H3-K27 acetylation(GO:0043974) regulation of histone H3-K27 acetylation(GO:1901674) positive regulation of response to drug(GO:2001025) |
| 1.0 | 4.2 | GO:0019086 | regulation of transcription from RNA polymerase II promoter by glucose(GO:0000430) positive regulation of transcription from RNA polymerase II promoter by glucose(GO:0000432) late viral transcription(GO:0019086) |
| 1.0 | 3.0 | GO:0036166 | phenotypic switching(GO:0036166) regulation of phenotypic switching(GO:1900239) |
| 1.0 | 5.8 | GO:0090116 | C-5 methylation of cytosine(GO:0090116) |
| 1.0 | 3.8 | GO:0006114 | glycerol biosynthetic process(GO:0006114) |
| 0.9 | 2.7 | GO:0090155 | negative regulation of sphingolipid biosynthetic process(GO:0090155) negative regulation of ceramide biosynthetic process(GO:1900060) |
| 0.9 | 5.3 | GO:0030644 | cellular chloride ion homeostasis(GO:0030644) |
| 0.9 | 6.1 | GO:1902174 | positive regulation of keratinocyte apoptotic process(GO:1902174) |
| 0.9 | 6.9 | GO:1900113 | negative regulation of histone H3-K9 trimethylation(GO:1900113) |
| 0.8 | 2.5 | GO:0010793 | regulation of mRNA export from nucleus(GO:0010793) |
| 0.8 | 1.7 | GO:1902263 | apoptotic process involved in embryonic digit morphogenesis(GO:1902263) |
| 0.8 | 4.8 | GO:0097338 | response to clozapine(GO:0097338) |
| 0.8 | 7.0 | GO:1903748 | negative regulation of establishment of protein localization to mitochondrion(GO:1903748) |
| 0.8 | 2.3 | GO:0070634 | transepithelial ammonium transport(GO:0070634) |
| 0.8 | 2.3 | GO:1904017 | cellular response to Thyroglobulin triiodothyronine(GO:1904017) |
| 0.8 | 2.3 | GO:0061026 | cardiac muscle tissue regeneration(GO:0061026) |
| 0.8 | 6.8 | GO:1903818 | positive regulation of voltage-gated potassium channel activity(GO:1903818) |
| 0.7 | 5.2 | GO:0042539 | hypotonic salinity response(GO:0042539) cellular hypotonic salinity response(GO:0071477) |
| 0.7 | 5.2 | GO:0010641 | positive regulation of platelet-derived growth factor receptor signaling pathway(GO:0010641) |
| 0.7 | 2.1 | GO:0071288 | cellular response to mercury ion(GO:0071288) |
| 0.7 | 6.2 | GO:0042904 | 9-cis-retinoic acid biosynthetic process(GO:0042904) 9-cis-retinoic acid metabolic process(GO:0042905) |
| 0.7 | 2.1 | GO:1901097 | negative regulation of autophagosome maturation(GO:1901097) |
| 0.7 | 2.7 | GO:2000843 | testosterone secretion(GO:0035936) regulation of testosterone secretion(GO:2000843) positive regulation of testosterone secretion(GO:2000845) |
| 0.7 | 4.1 | GO:1900454 | positive regulation of long term synaptic depression(GO:1900454) |
| 0.7 | 3.4 | GO:0032849 | positive regulation of cellular pH reduction(GO:0032849) |
| 0.7 | 2.0 | GO:1900365 | positive regulation of mRNA polyadenylation(GO:1900365) |
| 0.7 | 6.0 | GO:0031584 | activation of phospholipase D activity(GO:0031584) |
| 0.7 | 7.3 | GO:0098789 | pre-mRNA cleavage required for polyadenylation(GO:0098789) |
| 0.7 | 6.6 | GO:1990504 | dense core granule exocytosis(GO:1990504) |
| 0.6 | 4.5 | GO:0010890 | positive regulation of sequestering of triglyceride(GO:0010890) |
| 0.6 | 2.6 | GO:1904980 | positive regulation of endosome organization(GO:1904980) |
| 0.6 | 3.6 | GO:0002943 | tRNA dihydrouridine synthesis(GO:0002943) |
| 0.6 | 9.3 | GO:0043117 | positive regulation of vascular permeability(GO:0043117) |
| 0.6 | 3.9 | GO:0007185 | transmembrane receptor protein tyrosine phosphatase signaling pathway(GO:0007185) |
| 0.5 | 2.7 | GO:0006127 | glycerophosphate shuttle(GO:0006127) |
| 0.5 | 1.6 | GO:1990009 | response to high light intensity(GO:0009644) cellular response to light intensity(GO:0071484) cellular response to high light intensity(GO:0071486) retinal rod cell apoptotic process(GO:0097473) retinal cell apoptotic process(GO:1990009) |
| 0.5 | 2.6 | GO:0021699 | cerebellum maturation(GO:0021590) cerebellar cortex maturation(GO:0021699) |
| 0.5 | 3.1 | GO:0071321 | cellular response to cGMP(GO:0071321) |
| 0.5 | 7.8 | GO:0090266 | regulation of mitotic cell cycle spindle assembly checkpoint(GO:0090266) regulation of mitotic spindle checkpoint(GO:1903504) |
| 0.5 | 1.9 | GO:1905069 | hyaluranon cable assembly(GO:0036118) nephrogenic mesenchyme morphogenesis(GO:0072134) regulation of hyaluranon cable assembly(GO:1900104) positive regulation of hyaluranon cable assembly(GO:1900106) allantois development(GO:1905069) |
| 0.5 | 4.3 | GO:0015693 | magnesium ion transport(GO:0015693) |
| 0.5 | 0.9 | GO:0090427 | activation of meiosis(GO:0090427) |
| 0.5 | 5.2 | GO:0048671 | negative regulation of collateral sprouting(GO:0048671) |
| 0.5 | 1.9 | GO:0072137 | condensed mesenchymal cell proliferation(GO:0072137) |
| 0.5 | 0.9 | GO:0090258 | negative regulation of mitochondrial fission(GO:0090258) |
| 0.5 | 1.4 | GO:0001831 | trophectodermal cellular morphogenesis(GO:0001831) |
| 0.5 | 1.9 | GO:0048865 | stem cell fate commitment(GO:0048865) |
| 0.5 | 4.1 | GO:0070166 | enamel mineralization(GO:0070166) |
| 0.5 | 4.1 | GO:0099566 | regulation of postsynaptic cytosolic calcium ion concentration(GO:0099566) |
| 0.4 | 2.2 | GO:0016240 | autophagosome docking(GO:0016240) |
| 0.4 | 2.7 | GO:0021966 | corticospinal neuron axon guidance(GO:0021966) |
| 0.4 | 7.1 | GO:0086045 | membrane depolarization during AV node cell action potential(GO:0086045) |
| 0.4 | 3.5 | GO:1904628 | response to phorbol 13-acetate 12-myristate(GO:1904627) cellular response to phorbol 13-acetate 12-myristate(GO:1904628) |
| 0.4 | 2.2 | GO:0021764 | amygdala development(GO:0021764) |
| 0.4 | 6.1 | GO:0035878 | nail development(GO:0035878) |
| 0.4 | 1.3 | GO:0014022 | neural plate elongation(GO:0014022) convergent extension involved in neural plate elongation(GO:0022007) |
| 0.4 | 2.4 | GO:0008291 | acetylcholine metabolic process(GO:0008291) acetate ester metabolic process(GO:1900619) |
| 0.4 | 1.5 | GO:0099558 | maintenance of synapse structure(GO:0099558) |
| 0.4 | 4.0 | GO:0007196 | adenylate cyclase-inhibiting G-protein coupled glutamate receptor signaling pathway(GO:0007196) |
| 0.4 | 6.8 | GO:0002726 | positive regulation of T cell cytokine production(GO:0002726) |
| 0.4 | 2.8 | GO:0021859 | pyramidal neuron differentiation(GO:0021859) pyramidal neuron development(GO:0021860) |
| 0.4 | 2.8 | GO:0061088 | regulation of sequestering of zinc ion(GO:0061088) |
| 0.3 | 2.1 | GO:0032483 | regulation of Rab protein signal transduction(GO:0032483) |
| 0.3 | 0.3 | GO:0007352 | zygotic specification of dorsal/ventral axis(GO:0007352) |
| 0.3 | 1.0 | GO:0043321 | regulation of natural killer cell degranulation(GO:0043321) positive regulation of natural killer cell degranulation(GO:0043323) |
| 0.3 | 2.3 | GO:0060012 | synaptic transmission, glycinergic(GO:0060012) |
| 0.3 | 4.6 | GO:1990440 | positive regulation of transcription from RNA polymerase II promoter in response to endoplasmic reticulum stress(GO:1990440) |
| 0.3 | 1.9 | GO:0051573 | negative regulation of histone H3-K9 methylation(GO:0051573) |
| 0.3 | 1.3 | GO:0060013 | righting reflex(GO:0060013) |
| 0.3 | 1.5 | GO:0051970 | negative regulation of transmission of nerve impulse(GO:0051970) |
| 0.3 | 12.3 | GO:1901985 | positive regulation of protein acetylation(GO:1901985) |
| 0.3 | 1.2 | GO:0035261 | external genitalia morphogenesis(GO:0035261) |
| 0.3 | 5.6 | GO:0097091 | synaptic vesicle clustering(GO:0097091) |
| 0.3 | 0.9 | GO:1902732 | growth involved in heart morphogenesis(GO:0003241) cardiac muscle tissue growth involved in heart morphogenesis(GO:0003245) regulation of chromatin silencing at telomere(GO:0031938) positive regulation of chondrocyte proliferation(GO:1902732) |
| 0.3 | 0.9 | GO:0035948 | positive regulation of gluconeogenesis by positive regulation of transcription from RNA polymerase II promoter(GO:0035948) regulation of cellular ketone metabolic process by positive regulation of transcription from RNA polymerase II promoter(GO:0072366) |
| 0.3 | 6.2 | GO:0035855 | megakaryocyte development(GO:0035855) |
| 0.3 | 3.9 | GO:0016024 | CDP-diacylglycerol biosynthetic process(GO:0016024) |
| 0.3 | 2.2 | GO:0032713 | negative regulation of interleukin-4 production(GO:0032713) |
| 0.3 | 2.8 | GO:0098719 | sodium ion import across plasma membrane(GO:0098719) sodium ion import into cell(GO:1990118) |
| 0.3 | 3.3 | GO:0061469 | regulation of type B pancreatic cell proliferation(GO:0061469) |
| 0.3 | 2.8 | GO:0090335 | regulation of brown fat cell differentiation(GO:0090335) |
| 0.3 | 4.2 | GO:1990403 | embryonic brain development(GO:1990403) |
| 0.3 | 6.5 | GO:0050873 | brown fat cell differentiation(GO:0050873) |
| 0.3 | 1.5 | GO:0006540 | glutamate decarboxylation to succinate(GO:0006540) |
| 0.3 | 6.4 | GO:0036152 | phosphatidylethanolamine acyl-chain remodeling(GO:0036152) |
| 0.3 | 3.8 | GO:0001867 | complement activation, lectin pathway(GO:0001867) |
| 0.3 | 6.6 | GO:0010763 | positive regulation of fibroblast migration(GO:0010763) |
| 0.2 | 1.2 | GO:0007197 | adenylate cyclase-inhibiting G-protein coupled acetylcholine receptor signaling pathway(GO:0007197) |
| 0.2 | 2.4 | GO:0006390 | transcription from mitochondrial promoter(GO:0006390) |
| 0.2 | 2.6 | GO:0060501 | positive regulation of epithelial cell proliferation involved in lung morphogenesis(GO:0060501) |
| 0.2 | 1.6 | GO:0007549 | dosage compensation(GO:0007549) dosage compensation by inactivation of X chromosome(GO:0009048) |
| 0.2 | 2.1 | GO:0018344 | protein geranylgeranylation(GO:0018344) |
| 0.2 | 1.4 | GO:0035063 | nuclear speck organization(GO:0035063) |
| 0.2 | 11.9 | GO:0006198 | cAMP catabolic process(GO:0006198) |
| 0.2 | 9.0 | GO:0000083 | regulation of transcription involved in G1/S transition of mitotic cell cycle(GO:0000083) |
| 0.2 | 1.3 | GO:0060017 | parathyroid gland development(GO:0060017) |
| 0.2 | 1.3 | GO:0033152 | immunoglobulin V(D)J recombination(GO:0033152) |
| 0.2 | 2.3 | GO:0014051 | gamma-aminobutyric acid secretion(GO:0014051) |
| 0.2 | 3.0 | GO:0036158 | outer dynein arm assembly(GO:0036158) |
| 0.2 | 2.3 | GO:0008627 | intrinsic apoptotic signaling pathway in response to osmotic stress(GO:0008627) |
| 0.2 | 2.7 | GO:1904321 | response to forskolin(GO:1904321) cellular response to forskolin(GO:1904322) |
| 0.2 | 1.7 | GO:0042426 | choline catabolic process(GO:0042426) |
| 0.2 | 2.4 | GO:0070102 | interleukin-6-mediated signaling pathway(GO:0070102) |
| 0.2 | 0.8 | GO:0019082 | viral protein processing(GO:0019082) regulation of nerve growth factor production(GO:0032903) negative regulation of nerve growth factor production(GO:0032904) dibasic protein processing(GO:0090472) |
| 0.2 | 3.0 | GO:0010991 | negative regulation of SMAD protein complex assembly(GO:0010991) |
| 0.2 | 1.2 | GO:0071286 | cellular response to magnesium ion(GO:0071286) |
| 0.2 | 3.3 | GO:0060716 | labyrinthine layer blood vessel development(GO:0060716) |
| 0.2 | 2.5 | GO:0035563 | positive regulation of chromatin binding(GO:0035563) |
| 0.2 | 1.9 | GO:0021633 | optic nerve structural organization(GO:0021633) |
| 0.2 | 1.7 | GO:0043517 | positive regulation of DNA damage response, signal transduction by p53 class mediator(GO:0043517) |
| 0.2 | 2.1 | GO:0097107 | postsynaptic density organization(GO:0097106) postsynaptic density assembly(GO:0097107) gephyrin clustering involved in postsynaptic density assembly(GO:0097116) neuroligin clustering involved in postsynaptic membrane assembly(GO:0097118) |
| 0.2 | 0.9 | GO:2000344 | positive regulation of acrosome reaction(GO:2000344) |
| 0.2 | 3.2 | GO:0019800 | peptide cross-linking via chondroitin 4-sulfate glycosaminoglycan(GO:0019800) |
| 0.2 | 2.0 | GO:0001842 | neural fold formation(GO:0001842) |
| 0.2 | 2.9 | GO:0090110 | cargo loading into COPII-coated vesicle(GO:0090110) |
| 0.2 | 2.3 | GO:0021702 | cerebellar Purkinje cell layer formation(GO:0021694) cerebellar Purkinje cell differentiation(GO:0021702) |
| 0.2 | 1.4 | GO:0050882 | voluntary musculoskeletal movement(GO:0050882) |
| 0.2 | 0.5 | GO:0008065 | establishment of blood-nerve barrier(GO:0008065) |
| 0.2 | 1.5 | GO:0019375 | galactosylceramide biosynthetic process(GO:0006682) galactolipid biosynthetic process(GO:0019375) |
| 0.2 | 1.8 | GO:0043152 | induction of bacterial agglutination(GO:0043152) |
| 0.2 | 1.1 | GO:0098700 | neurotransmitter loading into synaptic vesicle(GO:0098700) |
| 0.2 | 2.4 | GO:0050942 | positive regulation of pigment cell differentiation(GO:0050942) |
| 0.2 | 1.3 | GO:0045054 | constitutive secretory pathway(GO:0045054) |
| 0.2 | 0.9 | GO:0021527 | spinal cord association neuron differentiation(GO:0021527) |
| 0.2 | 4.5 | GO:0007616 | long-term memory(GO:0007616) |
| 0.2 | 0.8 | GO:0010513 | positive regulation of phosphatidylinositol biosynthetic process(GO:0010513) |
| 0.2 | 2.2 | GO:0045955 | negative regulation of calcium ion-dependent exocytosis(GO:0045955) |
| 0.2 | 1.2 | GO:0000160 | phosphorelay signal transduction system(GO:0000160) |
| 0.2 | 7.1 | GO:0019228 | neuronal action potential(GO:0019228) |
| 0.1 | 3.9 | GO:0000185 | activation of MAPKKK activity(GO:0000185) |
| 0.1 | 6.3 | GO:0015804 | neutral amino acid transport(GO:0015804) |
| 0.1 | 1.3 | GO:0060372 | regulation of atrial cardiac muscle cell membrane repolarization(GO:0060372) |
| 0.1 | 2.8 | GO:0030828 | positive regulation of cGMP biosynthetic process(GO:0030828) |
| 0.1 | 0.7 | GO:0032971 | regulation of muscle filament sliding(GO:0032971) |
| 0.1 | 2.5 | GO:0060766 | negative regulation of androgen receptor signaling pathway(GO:0060766) |
| 0.1 | 1.1 | GO:0014877 | response to muscle inactivity involved in regulation of muscle adaptation(GO:0014877) response to denervation involved in regulation of muscle adaptation(GO:0014894) |
| 0.1 | 6.9 | GO:0030513 | positive regulation of BMP signaling pathway(GO:0030513) |
| 0.1 | 2.0 | GO:0045974 | miRNA mediated inhibition of translation(GO:0035278) negative regulation of translation, ncRNA-mediated(GO:0040033) regulation of translation, ncRNA-mediated(GO:0045974) |
| 0.1 | 11.2 | GO:0042771 | intrinsic apoptotic signaling pathway in response to DNA damage by p53 class mediator(GO:0042771) |
| 0.1 | 1.5 | GO:2000288 | positive regulation of myoblast proliferation(GO:2000288) |
| 0.1 | 1.9 | GO:0002089 | lens morphogenesis in camera-type eye(GO:0002089) |
| 0.1 | 5.7 | GO:0072332 | intrinsic apoptotic signaling pathway by p53 class mediator(GO:0072332) |
| 0.1 | 0.3 | GO:1902722 | positive regulation of prolactin secretion(GO:1902722) |
| 0.1 | 2.5 | GO:0006012 | galactose metabolic process(GO:0006012) |
| 0.1 | 0.4 | GO:1904772 | hepatocyte homeostasis(GO:0036333) response to tetrachloromethane(GO:1904772) |
| 0.1 | 3.8 | GO:0071218 | cellular response to misfolded protein(GO:0071218) |
| 0.1 | 3.4 | GO:0045746 | negative regulation of Notch signaling pathway(GO:0045746) |
| 0.1 | 3.5 | GO:0014898 | muscle hypertrophy in response to stress(GO:0003299) cardiac muscle adaptation(GO:0014887) cardiac muscle hypertrophy in response to stress(GO:0014898) |
| 0.1 | 3.9 | GO:2000300 | regulation of synaptic vesicle exocytosis(GO:2000300) |
| 0.1 | 1.0 | GO:0021520 | spinal cord motor neuron cell fate specification(GO:0021520) |
| 0.1 | 0.7 | GO:0044351 | macropinocytosis(GO:0044351) |
| 0.1 | 1.1 | GO:2000311 | regulation of alpha-amino-3-hydroxy-5-methyl-4-isoxazole propionate selective glutamate receptor activity(GO:2000311) |
| 0.1 | 0.7 | GO:1903237 | negative regulation of leukocyte tethering or rolling(GO:1903237) |
| 0.1 | 0.9 | GO:0061734 | parkin-mediated mitophagy in response to mitochondrial depolarization(GO:0061734) |
| 0.1 | 0.6 | GO:0007621 | negative regulation of female receptivity(GO:0007621) |
| 0.1 | 2.5 | GO:0006853 | carnitine shuttle(GO:0006853) |
| 0.1 | 6.0 | GO:0032784 | regulation of DNA-templated transcription, elongation(GO:0032784) |
| 0.1 | 2.1 | GO:0034656 | nucleobase-containing small molecule catabolic process(GO:0034656) |
| 0.1 | 2.3 | GO:0007289 | spermatid nucleus differentiation(GO:0007289) |
| 0.1 | 5.9 | GO:0033173 | calcineurin-NFAT signaling cascade(GO:0033173) |
| 0.1 | 2.2 | GO:1903846 | positive regulation of transforming growth factor beta receptor signaling pathway(GO:0030511) positive regulation of cellular response to transforming growth factor beta stimulus(GO:1903846) |
| 0.1 | 0.6 | GO:0071880 | adenylate cyclase-activating adrenergic receptor signaling pathway(GO:0071880) |
| 0.1 | 1.5 | GO:0001767 | establishment of lymphocyte polarity(GO:0001767) |
| 0.1 | 1.4 | GO:0035372 | protein localization to microtubule(GO:0035372) |
| 0.1 | 3.8 | GO:0007339 | binding of sperm to zona pellucida(GO:0007339) |
| 0.1 | 2.7 | GO:0034204 | lipid translocation(GO:0034204) phospholipid translocation(GO:0045332) |
| 0.1 | 1.1 | GO:0048251 | elastic fiber assembly(GO:0048251) |
| 0.1 | 0.8 | GO:0061158 | 3'-UTR-mediated mRNA destabilization(GO:0061158) |
| 0.1 | 0.6 | GO:0045741 | positive regulation of epidermal growth factor-activated receptor activity(GO:0045741) |
| 0.1 | 1.4 | GO:0007258 | JUN phosphorylation(GO:0007258) |
| 0.1 | 1.9 | GO:0010569 | regulation of double-strand break repair via homologous recombination(GO:0010569) |
| 0.1 | 3.4 | GO:0043001 | Golgi to plasma membrane protein transport(GO:0043001) |
| 0.1 | 6.6 | GO:0006501 | C-terminal protein lipidation(GO:0006501) |
| 0.1 | 3.7 | GO:0035249 | synaptic transmission, glutamatergic(GO:0035249) |
| 0.1 | 3.7 | GO:0046710 | GDP metabolic process(GO:0046710) |
| 0.1 | 2.2 | GO:0021772 | olfactory bulb development(GO:0021772) |
| 0.1 | 4.1 | GO:0000186 | activation of MAPKK activity(GO:0000186) |
| 0.1 | 3.2 | GO:0007194 | negative regulation of adenylate cyclase activity(GO:0007194) |
| 0.1 | 0.4 | GO:0045837 | negative regulation of membrane potential(GO:0045837) |
| 0.1 | 3.0 | GO:0032456 | endocytic recycling(GO:0032456) |
| 0.1 | 2.6 | GO:1900449 | regulation of glutamate receptor signaling pathway(GO:1900449) |
| 0.1 | 1.5 | GO:0032228 | regulation of synaptic transmission, GABAergic(GO:0032228) |
| 0.1 | 1.5 | GO:0030220 | platelet formation(GO:0030220) |
| 0.1 | 4.2 | GO:0033077 | T cell differentiation in thymus(GO:0033077) thymocyte aggregation(GO:0071594) |
| 0.1 | 1.7 | GO:0007095 | mitotic G2 DNA damage checkpoint(GO:0007095) |
| 0.1 | 2.2 | GO:0006359 | regulation of transcription from RNA polymerase III promoter(GO:0006359) |
| 0.1 | 2.4 | GO:0086010 | membrane depolarization during action potential(GO:0086010) |
| 0.1 | 3.1 | GO:0043551 | regulation of phosphatidylinositol 3-kinase activity(GO:0043551) |
| 0.1 | 1.4 | GO:0006488 | dolichol-linked oligosaccharide biosynthetic process(GO:0006488) |
| 0.1 | 0.6 | GO:0060174 | limb bud formation(GO:0060174) |
| 0.1 | 0.9 | GO:0019317 | fucose catabolic process(GO:0019317) L-fucose metabolic process(GO:0042354) L-fucose catabolic process(GO:0042355) |
| 0.1 | 3.6 | GO:0046426 | negative regulation of JAK-STAT cascade(GO:0046426) negative regulation of STAT cascade(GO:1904893) |
| 0.1 | 0.1 | GO:1904339 | negative regulation of NFAT protein import into nucleus(GO:0051534) negative regulation of dopaminergic neuron differentiation(GO:1904339) |
| 0.1 | 1.9 | GO:0007205 | protein kinase C-activating G-protein coupled receptor signaling pathway(GO:0007205) |
| 0.1 | 0.3 | GO:1902361 | mitochondrial pyruvate transport(GO:0006850) mitochondrial pyruvate transmembrane transport(GO:1902361) |
| 0.1 | 2.5 | GO:0051156 | glucose 6-phosphate metabolic process(GO:0051156) |
| 0.1 | 1.6 | GO:0051290 | protein heterotetramerization(GO:0051290) |
| 0.1 | 0.2 | GO:0071233 | cellular response to leucine(GO:0071233) |
| 0.1 | 0.1 | GO:0021546 | rhombomere development(GO:0021546) rhombomere 3 development(GO:0021569) rhombomere 5 development(GO:0021571) rhombomere morphogenesis(GO:0021593) rhombomere 3 morphogenesis(GO:0021658) central nervous system segmentation(GO:0035283) brain segmentation(GO:0035284) |
| 0.1 | 3.1 | GO:0001658 | branching involved in ureteric bud morphogenesis(GO:0001658) |
| 0.1 | 0.1 | GO:0051343 | positive regulation of cyclic-nucleotide phosphodiesterase activity(GO:0051343) |
| 0.1 | 1.0 | GO:0090129 | regulation of synapse maturation(GO:0090128) positive regulation of synapse maturation(GO:0090129) |
| 0.1 | 1.4 | GO:2000785 | regulation of autophagosome assembly(GO:2000785) |
| 0.1 | 2.2 | GO:1901385 | regulation of voltage-gated calcium channel activity(GO:1901385) |
| 0.1 | 1.8 | GO:0035690 | cellular response to drug(GO:0035690) |
| 0.1 | 0.4 | GO:0000183 | chromatin silencing at rDNA(GO:0000183) |
| 0.0 | 2.9 | GO:0051865 | protein autoubiquitination(GO:0051865) |
| 0.0 | 2.4 | GO:0051123 | RNA polymerase II transcriptional preinitiation complex assembly(GO:0051123) |
| 0.0 | 0.1 | GO:0033686 | positive regulation of luteinizing hormone secretion(GO:0033686) |
| 0.0 | 3.4 | GO:0098727 | maintenance of cell number(GO:0098727) |
| 0.0 | 2.4 | GO:0030218 | erythrocyte differentiation(GO:0030218) |
| 0.0 | 0.4 | GO:0070544 | histone H3-K36 demethylation(GO:0070544) |
| 0.0 | 5.6 | GO:0009952 | anterior/posterior pattern specification(GO:0009952) |
| 0.0 | 1.9 | GO:1903146 | regulation of mitophagy(GO:1903146) |
| 0.0 | 1.3 | GO:0042733 | embryonic digit morphogenesis(GO:0042733) |
| 0.0 | 0.7 | GO:0018345 | protein palmitoylation(GO:0018345) |
| 0.0 | 1.6 | GO:0032330 | regulation of chondrocyte differentiation(GO:0032330) |
| 0.0 | 1.1 | GO:0050982 | detection of mechanical stimulus(GO:0050982) |
| 0.0 | 1.6 | GO:0048384 | retinoic acid receptor signaling pathway(GO:0048384) |
| 0.0 | 2.3 | GO:0009301 | snRNA transcription(GO:0009301) snRNA transcription from RNA polymerase II promoter(GO:0042795) |
| 0.0 | 0.7 | GO:0016048 | detection of temperature stimulus(GO:0016048) |
| 0.0 | 0.1 | GO:0003221 | right ventricular cardiac muscle tissue morphogenesis(GO:0003221) |
| 0.0 | 2.1 | GO:0032760 | positive regulation of tumor necrosis factor production(GO:0032760) |
| 0.0 | 1.2 | GO:0046889 | positive regulation of lipid biosynthetic process(GO:0046889) |
| 0.0 | 2.0 | GO:0050729 | positive regulation of inflammatory response(GO:0050729) |
| 0.0 | 2.1 | GO:0032526 | response to retinoic acid(GO:0032526) |
| 0.0 | 5.0 | GO:0006813 | potassium ion transport(GO:0006813) |
| 0.0 | 4.6 | GO:0045637 | regulation of myeloid cell differentiation(GO:0045637) |
| 0.0 | 2.9 | GO:0051262 | protein tetramerization(GO:0051262) |
| 0.0 | 0.2 | GO:0031274 | positive regulation of pseudopodium assembly(GO:0031274) |
| 0.0 | 0.1 | GO:0070562 | regulation of vitamin D receptor signaling pathway(GO:0070562) |
| 0.0 | 0.5 | GO:0035307 | positive regulation of dephosphorylation(GO:0035306) positive regulation of protein dephosphorylation(GO:0035307) |
| 0.0 | 0.1 | GO:0010265 | SCF complex assembly(GO:0010265) |
| 0.0 | 1.0 | GO:0001895 | retina homeostasis(GO:0001895) |
| 0.0 | 0.4 | GO:0019731 | antibacterial humoral response(GO:0019731) |
| 0.0 | 0.8 | GO:0045576 | mast cell activation(GO:0045576) |
| 0.0 | 2.3 | GO:0065004 | protein-DNA complex assembly(GO:0065004) |
Gene overrepresentation in cellular component category:
| Log-likelihood per target | Total log-likelihood | Term | Description |
|---|---|---|---|
| 1.8 | 8.9 | GO:0036398 | TCR signalosome(GO:0036398) |
| 1.5 | 4.5 | GO:0099569 | cytoskeleton of presynaptic active zone(GO:0048788) presynaptic active zone cytoplasmic component(GO:0098831) presynaptic cytoskeleton(GO:0099569) |
| 1.5 | 4.5 | GO:0044609 | DBIRD complex(GO:0044609) |
| 1.2 | 4.6 | GO:1990851 | Wnt-Frizzled-LRP5/6 complex(GO:1990851) |
| 1.1 | 5.6 | GO:0070847 | core mediator complex(GO:0070847) |
| 1.1 | 3.2 | GO:0034657 | GID complex(GO:0034657) |
| 0.9 | 0.9 | GO:0031933 | telomeric heterochromatin(GO:0031933) |
| 0.9 | 3.5 | GO:0032777 | Piccolo NuA4 histone acetyltransferase complex(GO:0032777) |
| 0.8 | 4.1 | GO:0044308 | axonal spine(GO:0044308) |
| 0.8 | 3.2 | GO:0038039 | G-protein coupled receptor heterodimeric complex(GO:0038039) |
| 0.8 | 5.4 | GO:1990452 | Parkin-FBXW7-Cul1 ubiquitin ligase complex(GO:1990452) |
| 0.7 | 4.1 | GO:0032584 | growth cone membrane(GO:0032584) |
| 0.6 | 3.2 | GO:0060200 | clathrin-sculpted acetylcholine transport vesicle(GO:0060200) clathrin-sculpted acetylcholine transport vesicle membrane(GO:0060201) |
| 0.6 | 1.9 | GO:0030289 | protein phosphatase 4 complex(GO:0030289) |
| 0.6 | 10.2 | GO:0030914 | STAGA complex(GO:0030914) |
| 0.6 | 11.2 | GO:0031588 | nucleotide-activated protein kinase complex(GO:0031588) |
| 0.5 | 2.2 | GO:0034678 | integrin alpha8-beta1 complex(GO:0034678) |
| 0.5 | 2.1 | GO:0005968 | Rab-protein geranylgeranyltransferase complex(GO:0005968) |
| 0.5 | 3.8 | GO:0016012 | sarcoglycan complex(GO:0016012) |
| 0.4 | 2.7 | GO:0009331 | glycerol-3-phosphate dehydrogenase complex(GO:0009331) |
| 0.4 | 3.0 | GO:0036157 | outer dynein arm(GO:0036157) |
| 0.4 | 6.1 | GO:0008074 | guanylate cyclase complex, soluble(GO:0008074) |
| 0.4 | 1.6 | GO:0070876 | SOSS complex(GO:0070876) |
| 0.4 | 8.8 | GO:0005721 | pericentric heterochromatin(GO:0005721) |
| 0.4 | 5.8 | GO:0001741 | XY body(GO:0001741) |
| 0.4 | 5.7 | GO:0097418 | neurofibrillary tangle(GO:0097418) |
| 0.4 | 3.5 | GO:0042567 | insulin-like growth factor ternary complex(GO:0042567) |
| 0.3 | 6.9 | GO:0033270 | paranode region of axon(GO:0033270) |
| 0.3 | 2.0 | GO:0032279 | asymmetric synapse(GO:0032279) |
| 0.3 | 5.8 | GO:0005662 | DNA replication factor A complex(GO:0005662) |
| 0.3 | 7.6 | GO:0005849 | mRNA cleavage factor complex(GO:0005849) |
| 0.3 | 4.8 | GO:0005952 | cAMP-dependent protein kinase complex(GO:0005952) |
| 0.3 | 2.8 | GO:0005672 | transcription factor TFIIA complex(GO:0005672) |
| 0.3 | 2.5 | GO:0097425 | smooth endoplasmic reticulum membrane(GO:0030868) smooth endoplasmic reticulum part(GO:0097425) |
| 0.3 | 2.1 | GO:0036020 | endolysosome membrane(GO:0036020) |
| 0.3 | 0.9 | GO:0000125 | PCAF complex(GO:0000125) |
| 0.3 | 5.4 | GO:0005641 | nuclear envelope lumen(GO:0005641) |
| 0.3 | 2.2 | GO:0042583 | chromaffin granule(GO:0042583) |
| 0.3 | 5.6 | GO:1990454 | L-type voltage-gated calcium channel complex(GO:1990454) |
| 0.3 | 6.5 | GO:0005868 | cytoplasmic dynein complex(GO:0005868) |
| 0.2 | 0.7 | GO:0032116 | SMC loading complex(GO:0032116) |
| 0.2 | 14.3 | GO:0031463 | Cul3-RING ubiquitin ligase complex(GO:0031463) |
| 0.2 | 5.4 | GO:0048786 | presynaptic active zone(GO:0048786) |
| 0.2 | 7.3 | GO:0032809 | neuronal cell body membrane(GO:0032809) cell body membrane(GO:0044298) |
| 0.2 | 4.7 | GO:0001518 | voltage-gated sodium channel complex(GO:0001518) |
| 0.2 | 6.6 | GO:0005719 | nuclear euchromatin(GO:0005719) |
| 0.2 | 11.7 | GO:0043198 | dendritic shaft(GO:0043198) |
| 0.2 | 1.5 | GO:0061689 | tricellular tight junction(GO:0061689) |
| 0.2 | 1.7 | GO:0033391 | chromatoid body(GO:0033391) |
| 0.2 | 0.7 | GO:0005863 | striated muscle myosin thick filament(GO:0005863) |
| 0.2 | 2.4 | GO:0031083 | BLOC-1 complex(GO:0031083) |
| 0.2 | 1.8 | GO:0005577 | fibrinogen complex(GO:0005577) |
| 0.1 | 0.6 | GO:0005879 | axonemal microtubule(GO:0005879) |
| 0.1 | 5.1 | GO:0042629 | mast cell granule(GO:0042629) |
| 0.1 | 1.5 | GO:0043083 | synaptic cleft(GO:0043083) |
| 0.1 | 1.5 | GO:0071203 | WASH complex(GO:0071203) |
| 0.1 | 1.1 | GO:0032591 | dendritic spine membrane(GO:0032591) |
| 0.1 | 13.9 | GO:0042734 | presynaptic membrane(GO:0042734) |
| 0.1 | 0.8 | GO:0035068 | micro-ribonucleoprotein complex(GO:0035068) |
| 0.1 | 2.7 | GO:0005942 | phosphatidylinositol 3-kinase complex(GO:0005942) |
| 0.1 | 15.7 | GO:0016605 | PML body(GO:0016605) |
| 0.1 | 3.2 | GO:0044665 | MLL1/2 complex(GO:0044665) MLL1 complex(GO:0071339) |
| 0.1 | 1.6 | GO:0097440 | apical dendrite(GO:0097440) |
| 0.1 | 3.9 | GO:0016592 | mediator complex(GO:0016592) |
| 0.1 | 9.2 | GO:0031594 | neuromuscular junction(GO:0031594) |
| 0.1 | 2.3 | GO:0034045 | pre-autophagosomal structure membrane(GO:0034045) |
| 0.1 | 2.8 | GO:0030132 | clathrin coat of coated pit(GO:0030132) |
| 0.1 | 3.8 | GO:0045095 | keratin filament(GO:0045095) |
| 0.1 | 6.0 | GO:0005834 | heterotrimeric G-protein complex(GO:0005834) |
| 0.1 | 1.1 | GO:0034704 | calcium channel complex(GO:0034704) |
| 0.1 | 7.7 | GO:0031093 | platelet alpha granule lumen(GO:0031093) |
| 0.1 | 0.4 | GO:0033553 | rDNA heterochromatin(GO:0033553) |
| 0.1 | 4.8 | GO:0030672 | synaptic vesicle membrane(GO:0030672) exocytic vesicle membrane(GO:0099501) |
| 0.1 | 2.1 | GO:0016235 | aggresome(GO:0016235) |
| 0.1 | 2.9 | GO:0001917 | photoreceptor inner segment(GO:0001917) |
| 0.1 | 1.3 | GO:0045334 | clathrin-coated endocytic vesicle(GO:0045334) |
| 0.1 | 0.4 | GO:0008282 | ATP-sensitive potassium channel complex(GO:0008282) |
| 0.1 | 3.5 | GO:0005844 | polysome(GO:0005844) |
| 0.1 | 1.2 | GO:0032281 | AMPA glutamate receptor complex(GO:0032281) |
| 0.1 | 2.6 | GO:0008305 | integrin complex(GO:0008305) |
| 0.1 | 6.0 | GO:0030665 | clathrin-coated vesicle membrane(GO:0030665) |
| 0.1 | 0.8 | GO:0030140 | trans-Golgi network transport vesicle(GO:0030140) |
| 0.1 | 2.5 | GO:0005891 | voltage-gated calcium channel complex(GO:0005891) |
| 0.0 | 3.4 | GO:0005796 | Golgi lumen(GO:0005796) |
| 0.0 | 5.5 | GO:0008076 | voltage-gated potassium channel complex(GO:0008076) potassium channel complex(GO:0034705) |
| 0.0 | 0.8 | GO:0031235 | intrinsic component of the cytoplasmic side of the plasma membrane(GO:0031235) |
| 0.0 | 0.2 | GO:0034448 | EGO complex(GO:0034448) Gtr1-Gtr2 GTPase complex(GO:1990131) |
| 0.0 | 5.0 | GO:0043202 | lysosomal lumen(GO:0043202) |
| 0.0 | 6.4 | GO:0098793 | presynapse(GO:0098793) |
| 0.0 | 5.8 | GO:0031225 | anchored component of membrane(GO:0031225) |
| 0.0 | 0.4 | GO:0045120 | pronucleus(GO:0045120) |
| 0.0 | 2.3 | GO:0016529 | sarcoplasmic reticulum(GO:0016529) |
| 0.0 | 1.1 | GO:0000159 | protein phosphatase type 2A complex(GO:0000159) |
| 0.0 | 4.9 | GO:0032993 | protein-DNA complex(GO:0032993) |
| 0.0 | 1.0 | GO:0005669 | transcription factor TFIID complex(GO:0005669) |
| 0.0 | 1.8 | GO:0005776 | autophagosome(GO:0005776) |
| 0.0 | 1.4 | GO:0002102 | podosome(GO:0002102) |
| 0.0 | 0.8 | GO:0034451 | centriolar satellite(GO:0034451) |
| 0.0 | 2.5 | GO:0035579 | specific granule membrane(GO:0035579) |
| 0.0 | 0.3 | GO:0002116 | semaphorin receptor complex(GO:0002116) |
| 0.0 | 2.9 | GO:0031901 | early endosome membrane(GO:0031901) |
| 0.0 | 3.0 | GO:0000932 | cytoplasmic mRNA processing body(GO:0000932) |
| 0.0 | 1.7 | GO:0034707 | chloride channel complex(GO:0034707) |
| 0.0 | 5.3 | GO:0016323 | basolateral plasma membrane(GO:0016323) |
| 0.0 | 4.6 | GO:0005769 | early endosome(GO:0005769) |
| 0.0 | 0.7 | GO:0000792 | heterochromatin(GO:0000792) |
| 0.0 | 1.0 | GO:0031519 | PcG protein complex(GO:0031519) |
| 0.0 | 0.2 | GO:0005579 | membrane attack complex(GO:0005579) |
| 0.0 | 4.0 | GO:0005741 | mitochondrial outer membrane(GO:0005741) |
| 0.0 | 0.1 | GO:1990909 | Wnt signalosome(GO:1990909) |
| 0.0 | 1.6 | GO:0000794 | condensed nuclear chromosome(GO:0000794) |
| 0.0 | 4.3 | GO:0005765 | lysosomal membrane(GO:0005765) lytic vacuole membrane(GO:0098852) |
| 0.0 | 0.1 | GO:0000322 | storage vacuole(GO:0000322) |
| 0.0 | 2.5 | GO:0045211 | postsynaptic membrane(GO:0045211) |
| 0.0 | 1.6 | GO:0005913 | cell-cell adherens junction(GO:0005913) |
| 0.0 | 0.1 | GO:0031312 | extrinsic component of organelle membrane(GO:0031312) |
| 0.0 | 0.3 | GO:0031305 | intrinsic component of mitochondrial inner membrane(GO:0031304) integral component of mitochondrial inner membrane(GO:0031305) |
| 0.0 | 3.5 | GO:0005578 | proteinaceous extracellular matrix(GO:0005578) |
Gene overrepresentation in molecular function category:
| Log-likelihood per target | Total log-likelihood | Term | Description |
|---|---|---|---|
| 4.1 | 16.5 | GO:0042030 | ATPase inhibitor activity(GO:0042030) |
| 2.5 | 14.7 | GO:0061665 | SUMO ligase activity(GO:0061665) |
| 1.6 | 4.9 | GO:0035575 | histone demethylase activity (H4-K20 specific)(GO:0035575) |
| 1.6 | 8.2 | GO:0030375 | thyroid hormone receptor activator activity(GO:0010861) thyroid hormone receptor coactivator activity(GO:0030375) |
| 1.4 | 4.2 | GO:0086059 | voltage-gated calcium channel activity involved SA node cell action potential(GO:0086059) |
| 1.3 | 3.8 | GO:0098519 | nucleotide phosphatase activity, acting on free nucleotides(GO:0098519) |
| 1.2 | 5.8 | GO:0001010 | transcription factor activity, sequence-specific DNA binding transcription factor recruiting(GO:0001010) |
| 1.2 | 7.0 | GO:0035252 | UDP-xylosyltransferase activity(GO:0035252) xylosyltransferase activity(GO:0042285) |
| 1.1 | 3.3 | GO:0004939 | beta-adrenergic receptor activity(GO:0004939) |
| 1.1 | 3.2 | GO:0045322 | unmethylated CpG binding(GO:0045322) |
| 1.0 | 4.0 | GO:0015220 | choline transmembrane transporter activity(GO:0015220) |
| 1.0 | 2.9 | GO:0008330 | protein tyrosine/threonine phosphatase activity(GO:0008330) |
| 1.0 | 5.8 | GO:0003886 | DNA (cytosine-5-)-methyltransferase activity(GO:0003886) |
| 0.9 | 8.1 | GO:0004727 | prenylated protein tyrosine phosphatase activity(GO:0004727) |
| 0.9 | 2.7 | GO:0047322 | [hydroxymethylglutaryl-CoA reductase (NADPH)] kinase activity(GO:0047322) [acetyl-CoA carboxylase] kinase activity(GO:0050405) |
| 0.8 | 3.2 | GO:0004965 | G-protein coupled GABA receptor activity(GO:0004965) |
| 0.8 | 8.5 | GO:0004679 | AMP-activated protein kinase activity(GO:0004679) |
| 0.8 | 2.3 | GO:0008511 | sodium:potassium:chloride symporter activity(GO:0008511) |
| 0.8 | 10.5 | GO:0022820 | potassium:chloride symporter activity(GO:0015379) potassium ion symporter activity(GO:0022820) |
| 0.7 | 7.3 | GO:0001042 | RNA polymerase I core binding(GO:0001042) |
| 0.7 | 2.9 | GO:0042954 | lipoprotein transporter activity(GO:0042954) |
| 0.7 | 6.4 | GO:0047144 | 2-acylglycerol-3-phosphate O-acyltransferase activity(GO:0047144) |
| 0.7 | 5.4 | GO:0050816 | phosphothreonine binding(GO:0050816) |
| 0.7 | 2.7 | GO:0052590 | sn-glycerol-3-phosphate:ubiquinone oxidoreductase activity(GO:0052590) sn-glycerol-3-phosphate:ubiquinone-8 oxidoreductase activity(GO:0052591) |
| 0.7 | 2.0 | GO:0004534 | 5'-3' exoribonuclease activity(GO:0004534) |
| 0.7 | 7.3 | GO:0051864 | histone demethylase activity (H3-K36 specific)(GO:0051864) |
| 0.7 | 2.0 | GO:0001641 | group II metabotropic glutamate receptor activity(GO:0001641) |
| 0.6 | 3.2 | GO:0030348 | syntaxin-3 binding(GO:0030348) |
| 0.6 | 5.7 | GO:0046975 | histone methyltransferase activity (H3-K36 specific)(GO:0046975) |
| 0.6 | 4.4 | GO:0008481 | sphinganine kinase activity(GO:0008481) D-erythro-sphingosine kinase activity(GO:0017050) |
| 0.6 | 3.1 | GO:0005222 | intracellular cAMP activated cation channel activity(GO:0005222) |
| 0.6 | 1.2 | GO:1990763 | arrestin family protein binding(GO:1990763) |
| 0.6 | 1.8 | GO:0008332 | low voltage-gated calcium channel activity(GO:0008332) |
| 0.6 | 7.2 | GO:0001206 | transcriptional repressor activity, RNA polymerase II distal enhancer sequence-specific binding(GO:0001206) |
| 0.6 | 3.6 | GO:0017150 | tRNA dihydrouridine synthase activity(GO:0017150) |
| 0.6 | 7.6 | GO:0004716 | receptor signaling protein tyrosine kinase activity(GO:0004716) |
| 0.6 | 4.0 | GO:0004652 | polynucleotide adenylyltransferase activity(GO:0004652) |
| 0.5 | 7.0 | GO:0000774 | adenyl-nucleotide exchange factor activity(GO:0000774) |
| 0.5 | 2.7 | GO:0086062 | voltage-gated sodium channel activity involved in Purkinje myocyte action potential(GO:0086062) |
| 0.5 | 7.8 | GO:0019211 | phosphatase activator activity(GO:0019211) |
| 0.5 | 6.2 | GO:0001758 | retinal dehydrogenase activity(GO:0001758) |
| 0.5 | 4.1 | GO:0015185 | gamma-aminobutyric acid:sodium symporter activity(GO:0005332) gamma-aminobutyric acid transmembrane transporter activity(GO:0015185) |
| 0.5 | 2.1 | GO:0001640 | adenylate cyclase inhibiting G-protein coupled glutamate receptor activity(GO:0001640) G-protein coupled glutamate receptor activity(GO:0098988) |
| 0.5 | 4.1 | GO:0004971 | AMPA glutamate receptor activity(GO:0004971) |
| 0.5 | 3.0 | GO:0008273 | calcium, potassium:sodium antiporter activity(GO:0008273) |
| 0.5 | 1.4 | GO:0004577 | N-acetylglucosaminyldiphosphodolichol N-acetylglucosaminyltransferase activity(GO:0004577) |
| 0.5 | 1.4 | GO:0031208 | POZ domain binding(GO:0031208) |
| 0.5 | 4.1 | GO:0050682 | AF-2 domain binding(GO:0050682) |
| 0.4 | 1.3 | GO:0070644 | vitamin D response element binding(GO:0070644) |
| 0.4 | 2.1 | GO:0004663 | Rab geranylgeranyltransferase activity(GO:0004663) |
| 0.4 | 4.5 | GO:0046625 | sphingolipid binding(GO:0046625) |
| 0.4 | 1.2 | GO:0033142 | progesterone receptor binding(GO:0033142) |
| 0.4 | 6.1 | GO:0004383 | guanylate cyclase activity(GO:0004383) |
| 0.4 | 3.6 | GO:0008597 | calcium-dependent protein serine/threonine phosphatase regulator activity(GO:0008597) |
| 0.4 | 4.8 | GO:0008603 | cAMP-dependent protein kinase regulator activity(GO:0008603) |
| 0.4 | 5.5 | GO:0046790 | virion binding(GO:0046790) |
| 0.4 | 1.2 | GO:0004119 | cGMP-inhibited cyclic-nucleotide phosphodiesterase activity(GO:0004119) |
| 0.4 | 10.8 | GO:0005251 | delayed rectifier potassium channel activity(GO:0005251) |
| 0.4 | 4.3 | GO:0086056 | voltage-gated calcium channel activity involved in AV node cell action potential(GO:0086056) |
| 0.4 | 2.3 | GO:0008142 | oxysterol binding(GO:0008142) |
| 0.4 | 5.6 | GO:0042809 | vitamin D receptor binding(GO:0042809) |
| 0.4 | 2.6 | GO:0043812 | phosphatidylinositol-4-phosphate phosphatase activity(GO:0043812) |
| 0.4 | 2.5 | GO:0001517 | N-acetylglucosamine 6-O-sulfotransferase activity(GO:0001517) |
| 0.4 | 3.5 | GO:0031995 | insulin-like growth factor II binding(GO:0031995) |
| 0.4 | 2.1 | GO:0015168 | glycerol transmembrane transporter activity(GO:0015168) |
| 0.3 | 2.4 | GO:0071535 | RING-like zinc finger domain binding(GO:0071535) |
| 0.3 | 3.1 | GO:0046935 | 1-phosphatidylinositol-3-kinase regulator activity(GO:0046935) |
| 0.3 | 3.8 | GO:0032051 | clathrin light chain binding(GO:0032051) |
| 0.3 | 1.7 | GO:0016934 | extracellular-glycine-gated ion channel activity(GO:0016933) extracellular-glycine-gated chloride channel activity(GO:0016934) |
| 0.3 | 3.1 | GO:0043425 | bHLH transcription factor binding(GO:0043425) |
| 0.3 | 8.1 | GO:0030275 | LRR domain binding(GO:0030275) |
| 0.3 | 5.4 | GO:0030306 | ADP-ribosylation factor binding(GO:0030306) |
| 0.3 | 3.0 | GO:0050692 | DBD domain binding(GO:0050692) |
| 0.3 | 2.2 | GO:0001225 | RNA polymerase II transcription coactivator binding(GO:0001225) |
| 0.3 | 3.8 | GO:0030280 | structural constituent of epidermis(GO:0030280) |
| 0.3 | 1.3 | GO:0035373 | chondroitin sulfate proteoglycan binding(GO:0035373) |
| 0.3 | 6.0 | GO:0031702 | type 1 angiotensin receptor binding(GO:0031702) |
| 0.3 | 3.7 | GO:0017017 | MAP kinase tyrosine/serine/threonine phosphatase activity(GO:0017017) |
| 0.3 | 12.2 | GO:0017091 | AU-rich element binding(GO:0017091) |
| 0.3 | 1.7 | GO:0008046 | axon guidance receptor activity(GO:0008046) |
| 0.3 | 1.1 | GO:0048403 | brain-derived neurotrophic factor binding(GO:0048403) |
| 0.3 | 2.8 | GO:0015386 | sodium:proton antiporter activity(GO:0015385) potassium:proton antiporter activity(GO:0015386) |
| 0.3 | 2.5 | GO:0008865 | glucokinase activity(GO:0004340) hexokinase activity(GO:0004396) fructokinase activity(GO:0008865) mannokinase activity(GO:0019158) |
| 0.3 | 11.9 | GO:0004115 | 3',5'-cyclic-AMP phosphodiesterase activity(GO:0004115) |
| 0.3 | 4.3 | GO:0015095 | magnesium ion transmembrane transporter activity(GO:0015095) |
| 0.2 | 1.9 | GO:0005250 | A-type (transient outward) potassium channel activity(GO:0005250) |
| 0.2 | 3.9 | GO:0003841 | 1-acylglycerol-3-phosphate O-acyltransferase activity(GO:0003841) |
| 0.2 | 24.7 | GO:0036459 | thiol-dependent ubiquitinyl hydrolase activity(GO:0036459) ubiquitinyl hydrolase activity(GO:0101005) |
| 0.2 | 0.9 | GO:0004468 | lysine N-acetyltransferase activity, acting on acetyl phosphate as donor(GO:0004468) |
| 0.2 | 3.0 | GO:0045504 | dynein heavy chain binding(GO:0045504) |
| 0.2 | 4.6 | GO:0005248 | voltage-gated sodium channel activity(GO:0005248) voltage-gated ion channel activity involved in regulation of postsynaptic membrane potential(GO:1905030) |
| 0.2 | 4.9 | GO:0070016 | armadillo repeat domain binding(GO:0070016) |
| 0.2 | 0.6 | GO:0031862 | prostanoid receptor binding(GO:0031862) |
| 0.2 | 3.9 | GO:0008349 | MAP kinase kinase kinase kinase activity(GO:0008349) |
| 0.2 | 1.6 | GO:0005087 | Ran guanyl-nucleotide exchange factor activity(GO:0005087) |
| 0.2 | 1.5 | GO:0004351 | glutamate decarboxylase activity(GO:0004351) |
| 0.2 | 4.6 | GO:0042813 | Wnt-activated receptor activity(GO:0042813) |
| 0.2 | 2.1 | GO:0009931 | calcium-dependent protein serine/threonine kinase activity(GO:0009931) |
| 0.2 | 4.0 | GO:0001087 | transcription factor activity, sequence-specific DNA binding, RNA polymerase recruiting(GO:0001011) transcription factor activity, TFIIB-class binding(GO:0001087) |
| 0.2 | 3.4 | GO:0004089 | carbonate dehydratase activity(GO:0004089) |
| 0.2 | 0.7 | GO:0036033 | mediator complex binding(GO:0036033) |
| 0.2 | 0.7 | GO:0099580 | ion antiporter activity involved in regulation of postsynaptic membrane potential(GO:0099580) |
| 0.2 | 0.9 | GO:0003956 | NAD(P)+-protein-arginine ADP-ribosyltransferase activity(GO:0003956) |
| 0.2 | 1.4 | GO:0071253 | connexin binding(GO:0071253) |
| 0.2 | 7.4 | GO:0070840 | dynein complex binding(GO:0070840) |
| 0.2 | 1.8 | GO:0003964 | telomerase activity(GO:0003720) RNA-directed DNA polymerase activity(GO:0003964) |
| 0.2 | 3.1 | GO:0005234 | ionotropic glutamate receptor activity(GO:0004970) extracellular-glutamate-gated ion channel activity(GO:0005234) |
| 0.2 | 1.9 | GO:0070700 | BMP receptor binding(GO:0070700) |
| 0.2 | 6.9 | GO:0015175 | neutral amino acid transmembrane transporter activity(GO:0015175) |
| 0.2 | 0.8 | GO:0047179 | platelet-activating factor acetyltransferase activity(GO:0047179) |
| 0.2 | 1.8 | GO:0097157 | pre-mRNA intronic binding(GO:0097157) |
| 0.2 | 1.7 | GO:0017147 | Wnt-protein binding(GO:0017147) |
| 0.1 | 3.2 | GO:0008191 | metalloendopeptidase inhibitor activity(GO:0008191) |
| 0.1 | 5.8 | GO:0001103 | RNA polymerase II repressing transcription factor binding(GO:0001103) |
| 0.1 | 2.8 | GO:0005385 | zinc ion transmembrane transporter activity(GO:0005385) |
| 0.1 | 0.3 | GO:0097677 | STAT family protein binding(GO:0097677) |
| 0.1 | 1.1 | GO:0015279 | store-operated calcium channel activity(GO:0015279) |
| 0.1 | 8.4 | GO:0070412 | R-SMAD binding(GO:0070412) |
| 0.1 | 4.1 | GO:0004709 | MAP kinase kinase kinase activity(GO:0004709) |
| 0.1 | 1.9 | GO:0004143 | diacylglycerol kinase activity(GO:0004143) |
| 0.1 | 2.5 | GO:0004708 | MAP kinase kinase activity(GO:0004708) |
| 0.1 | 2.9 | GO:0050321 | tau-protein kinase activity(GO:0050321) |
| 0.1 | 1.4 | GO:0004705 | JUN kinase activity(GO:0004705) SAP kinase activity(GO:0016909) |
| 0.1 | 3.0 | GO:0097109 | neuroligin family protein binding(GO:0097109) |
| 0.1 | 2.6 | GO:0019198 | transmembrane receptor protein tyrosine phosphatase activity(GO:0005001) transmembrane receptor protein phosphatase activity(GO:0019198) |
| 0.1 | 3.5 | GO:0000993 | RNA polymerase II core binding(GO:0000993) |
| 0.1 | 0.8 | GO:0035198 | miRNA binding(GO:0035198) |
| 0.1 | 2.7 | GO:0015278 | calcium-release channel activity(GO:0015278) ligand-gated calcium channel activity(GO:0099604) |
| 0.1 | 3.6 | GO:0035035 | histone acetyltransferase binding(GO:0035035) |
| 0.1 | 0.9 | GO:0046920 | alpha-(1->3)-fucosyltransferase activity(GO:0046920) |
| 0.1 | 5.0 | GO:0001784 | phosphotyrosine binding(GO:0001784) |
| 0.1 | 2.7 | GO:0004012 | phospholipid-translocating ATPase activity(GO:0004012) |
| 0.1 | 3.2 | GO:1990841 | promoter-specific chromatin binding(GO:1990841) |
| 0.1 | 0.4 | GO:0008281 | sulfonylurea receptor activity(GO:0008281) |
| 0.1 | 1.5 | GO:0008499 | UDP-galactose:beta-N-acetylglucosamine beta-1,3-galactosyltransferase activity(GO:0008499) |
| 0.1 | 8.2 | GO:0033613 | activating transcription factor binding(GO:0033613) |
| 0.1 | 1.4 | GO:0000979 | RNA polymerase II core promoter sequence-specific DNA binding(GO:0000979) |
| 0.1 | 3.7 | GO:0004385 | guanylate kinase activity(GO:0004385) |
| 0.1 | 5.9 | GO:0035254 | glutamate receptor binding(GO:0035254) |
| 0.1 | 0.7 | GO:0003696 | satellite DNA binding(GO:0003696) |
| 0.1 | 0.3 | GO:0008449 | N-acetylglucosamine-6-sulfatase activity(GO:0008449) |
| 0.1 | 3.2 | GO:0005227 | calcium activated cation channel activity(GO:0005227) |
| 0.1 | 2.9 | GO:0043236 | laminin binding(GO:0043236) |
| 0.1 | 2.5 | GO:0036002 | pre-mRNA binding(GO:0036002) |
| 0.1 | 1.1 | GO:0052629 | phosphatidylinositol-3-phosphatase activity(GO:0004438) phosphatidylinositol-3,5-bisphosphate 3-phosphatase activity(GO:0052629) phosphatidylinositol monophosphate phosphatase activity(GO:0052744) |
| 0.1 | 0.8 | GO:0043176 | amine binding(GO:0043176) serotonin binding(GO:0051378) |
| 0.1 | 3.5 | GO:0004402 | histone acetyltransferase activity(GO:0004402) peptide-lysine-N-acetyltransferase activity(GO:0061733) |
| 0.1 | 1.6 | GO:0008187 | poly-pyrimidine tract binding(GO:0008187) poly(U) RNA binding(GO:0008266) |
| 0.1 | 3.2 | GO:0017112 | Rab guanyl-nucleotide exchange factor activity(GO:0017112) |
| 0.1 | 4.9 | GO:0001158 | enhancer sequence-specific DNA binding(GO:0001158) |
| 0.1 | 4.4 | GO:0002039 | p53 binding(GO:0002039) |
| 0.1 | 0.8 | GO:0008429 | phosphatidylethanolamine binding(GO:0008429) |
| 0.1 | 6.8 | GO:0004222 | metalloendopeptidase activity(GO:0004222) |
| 0.1 | 0.8 | GO:0048406 | nerve growth factor binding(GO:0048406) |
| 0.1 | 1.4 | GO:0005521 | lamin binding(GO:0005521) |
| 0.1 | 1.6 | GO:0071855 | neuropeptide receptor binding(GO:0071855) |
| 0.1 | 1.1 | GO:0005313 | L-glutamate transmembrane transporter activity(GO:0005313) acidic amino acid transmembrane transporter activity(GO:0015172) |
| 0.1 | 0.7 | GO:0045236 | CXCR chemokine receptor binding(GO:0045236) |
| 0.0 | 0.7 | GO:0019706 | protein-cysteine S-palmitoyltransferase activity(GO:0019706) protein-cysteine S-acyltransferase activity(GO:0019707) |
| 0.0 | 0.7 | GO:0031432 | titin binding(GO:0031432) |
| 0.0 | 0.6 | GO:0004887 | thyroid hormone receptor activity(GO:0004887) |
| 0.0 | 2.2 | GO:0005484 | SNAP receptor activity(GO:0005484) |
| 0.0 | 0.7 | GO:0008195 | phosphatidate phosphatase activity(GO:0008195) lipid phosphatase activity(GO:0042577) |
| 0.0 | 3.7 | GO:0019888 | protein phosphatase regulator activity(GO:0019888) |
| 0.0 | 0.3 | GO:0050833 | pyruvate transmembrane transporter activity(GO:0050833) |
| 0.0 | 2.6 | GO:0015459 | potassium channel regulator activity(GO:0015459) |
| 0.0 | 0.4 | GO:0016922 | ligand-dependent nuclear receptor binding(GO:0016922) |
| 0.0 | 2.1 | GO:0004693 | cyclin-dependent protein serine/threonine kinase activity(GO:0004693) |
| 0.0 | 0.1 | GO:0032427 | GBD domain binding(GO:0032427) |
| 0.0 | 27.7 | GO:0000981 | RNA polymerase II transcription factor activity, sequence-specific DNA binding(GO:0000981) |
| 0.0 | 0.2 | GO:0001515 | opioid peptide activity(GO:0001515) |
| 0.0 | 2.7 | GO:0043130 | ubiquitin binding(GO:0043130) |
| 0.0 | 0.2 | GO:0004726 | non-membrane spanning protein tyrosine phosphatase activity(GO:0004726) |
| 0.0 | 3.1 | GO:0044325 | ion channel binding(GO:0044325) |
| 0.0 | 11.8 | GO:0001071 | nucleic acid binding transcription factor activity(GO:0001071) transcription factor activity, sequence-specific DNA binding(GO:0003700) |
| 0.0 | 1.0 | GO:0019894 | kinesin binding(GO:0019894) |
| 0.0 | 1.3 | GO:0043621 | protein self-association(GO:0043621) |
| 0.0 | 0.3 | GO:0015280 | ligand-gated sodium channel activity(GO:0015280) |
| 0.0 | 0.5 | GO:0050681 | androgen receptor binding(GO:0050681) |
| 0.0 | 0.1 | GO:0000035 | acyl binding(GO:0000035) |
| 0.0 | 0.2 | GO:0004128 | cytochrome-b5 reductase activity, acting on NAD(P)H(GO:0004128) |
| 0.0 | 2.3 | GO:0019902 | phosphatase binding(GO:0019902) |
| 0.0 | 0.4 | GO:0030374 | ligand-dependent nuclear receptor transcription coactivator activity(GO:0030374) |
| 0.0 | 0.5 | GO:0001012 | RNA polymerase II regulatory region DNA binding(GO:0001012) |
| 0.0 | 0.5 | GO:0016278 | lysine N-methyltransferase activity(GO:0016278) protein-lysine N-methyltransferase activity(GO:0016279) |
| 0.0 | 0.5 | GO:0005540 | hyaluronic acid binding(GO:0005540) |
Gene overrepresentation in curated gene sets: canonical pathways category:
| Log-likelihood per target | Total log-likelihood | Term | Description |
|---|---|---|---|
| 0.4 | 6.0 | PID THROMBIN PAR4 PATHWAY | PAR4-mediated thrombin signaling events |
| 0.3 | 6.2 | PID TCR JNK PATHWAY | JNK signaling in the CD4+ TCR pathway |
| 0.2 | 8.1 | PID PRL SIGNALING EVENTS PATHWAY | Signaling events mediated by PRL |
| 0.2 | 10.4 | PID MYC PATHWAY | C-MYC pathway |
| 0.2 | 10.9 | PID P38 ALPHA BETA PATHWAY | Regulation of p38-alpha and p38-beta |
| 0.2 | 3.3 | PID LPA4 PATHWAY | LPA4-mediated signaling events |
| 0.2 | 15.1 | PID LKB1 PATHWAY | LKB1 signaling events |
| 0.2 | 5.6 | PID WNT SIGNALING PATHWAY | Wnt signaling network |
| 0.2 | 10.9 | PID TNF PATHWAY | TNF receptor signaling pathway |
| 0.2 | 9.4 | PID FRA PATHWAY | Validated transcriptional targets of AP1 family members Fra1 and Fra2 |
| 0.2 | 3.8 | PID EPHA FWDPATHWAY | EPHA forward signaling |
| 0.1 | 1.6 | SA TRKA RECEPTOR | The TrkA receptor binds nerve growth factor to activate MAP kinase pathways and promote cell growth. |
| 0.1 | 1.7 | SA PROGRAMMED CELL DEATH | Programmed cell death, or apoptosis, eliminates damaged or unneeded cells. |
| 0.1 | 4.7 | PID INTEGRIN CS PATHWAY | Integrin family cell surface interactions |
| 0.1 | 3.1 | PID TRAIL PATHWAY | TRAIL signaling pathway |
| 0.1 | 2.8 | PID ER NONGENOMIC PATHWAY | Plasma membrane estrogen receptor signaling |
| 0.1 | 2.2 | PID LYSOPHOSPHOLIPID PATHWAY | LPA receptor mediated events |
| 0.1 | 4.5 | SIG CD40PATHWAYMAP | Genes related to CD40 signaling |
| 0.1 | 12.1 | PID TRKR PATHWAY | Neurotrophic factor-mediated Trk receptor signaling |
| 0.1 | 2.7 | PID WNT CANONICAL PATHWAY | Canonical Wnt signaling pathway |
| 0.1 | 5.1 | PID KIT PATHWAY | Signaling events mediated by Stem cell factor receptor (c-Kit) |
| 0.1 | 4.4 | PID CERAMIDE PATHWAY | Ceramide signaling pathway |
| 0.1 | 2.0 | PID P38 MK2 PATHWAY | p38 signaling mediated by MAPKAP kinases |
| 0.1 | 3.1 | PID ERBB NETWORK PATHWAY | ErbB receptor signaling network |
| 0.1 | 3.1 | PID RETINOIC ACID PATHWAY | Retinoic acid receptors-mediated signaling |
| 0.1 | 3.3 | ST MYOCYTE AD PATHWAY | Myocyte Adrenergic Pathway is a specific case of the generalized Adrenergic Pathway. |
| 0.1 | 3.7 | NABA PROTEOGLYCANS | Genes encoding proteoglycans |
| 0.1 | 1.8 | PID EPHRINB REV PATHWAY | Ephrin B reverse signaling |
| 0.1 | 6.9 | PID MYC REPRESS PATHWAY | Validated targets of C-MYC transcriptional repression |
| 0.1 | 8.7 | PID BETA CATENIN NUC PATHWAY | Regulation of nuclear beta catenin signaling and target gene transcription |
| 0.1 | 1.8 | PID CONE PATHWAY | Visual signal transduction: Cones |
| 0.1 | 5.6 | PID TELOMERASE PATHWAY | Regulation of Telomerase |
| 0.1 | 9.1 | PID P53 DOWNSTREAM PATHWAY | Direct p53 effectors |
| 0.1 | 1.7 | PID ATF2 PATHWAY | ATF-2 transcription factor network |
| 0.1 | 3.9 | PID NFAT TFPATHWAY | Calcineurin-regulated NFAT-dependent transcription in lymphocytes |
| 0.1 | 4.6 | PID SMAD2 3NUCLEAR PATHWAY | Regulation of nuclear SMAD2/3 signaling |
| 0.1 | 1.3 | PID SYNDECAN 3 PATHWAY | Syndecan-3-mediated signaling events |
| 0.1 | 1.7 | PID AURORA A PATHWAY | Aurora A signaling |
| 0.1 | 2.6 | PID ERBB1 INTERNALIZATION PATHWAY | Internalization of ErbB1 |
| 0.0 | 1.9 | PID IL12 STAT4 PATHWAY | IL12 signaling mediated by STAT4 |
| 0.0 | 3.8 | PID HIF1 TFPATHWAY | HIF-1-alpha transcription factor network |
| 0.0 | 0.6 | PID INTEGRIN5 PATHWAY | Beta5 beta6 beta7 and beta8 integrin cell surface interactions |
| 0.0 | 3.4 | PID CMYB PATHWAY | C-MYB transcription factor network |
| 0.0 | 7.6 | NABA ECM GLYCOPROTEINS | Genes encoding structural ECM glycoproteins |
| 0.0 | 7.7 | NABA ECM REGULATORS | Genes encoding enzymes and their regulators involved in the remodeling of the extracellular matrix |
| 0.0 | 0.3 | PID TCR CALCIUM PATHWAY | Calcium signaling in the CD4+ TCR pathway |
| 0.0 | 0.8 | PID LIS1 PATHWAY | Lissencephaly gene (LIS1) in neuronal migration and development |
| 0.0 | 0.3 | PID RXR VDR PATHWAY | RXR and RAR heterodimerization with other nuclear receptor |
| 0.0 | 0.9 | PID ERA GENOMIC PATHWAY | Validated nuclear estrogen receptor alpha network |
| 0.0 | 4.3 | NABA SECRETED FACTORS | Genes encoding secreted soluble factors |
Gene overrepresentation in curated gene sets: REACTOME pathways category:
| Log-likelihood per target | Total log-likelihood | Term | Description |
|---|---|---|---|
| 0.8 | 19.3 | REACTOME REGULATION OF AMPK ACTIVITY VIA LKB1 | Genes involved in Regulation of AMPK activity via LKB1 |
| 0.4 | 5.5 | REACTOME PROLONGED ERK ACTIVATION EVENTS | Genes involved in Prolonged ERK activation events |
| 0.4 | 9.9 | REACTOME REGULATION OF KIT SIGNALING | Genes involved in Regulation of KIT signaling |
| 0.3 | 5.6 | REACTOME ACTIVATION OF CHAPERONES BY ATF6 ALPHA | Genes involved in Activation of Chaperones by ATF6-alpha |
| 0.3 | 10.5 | REACTOME UNBLOCKING OF NMDA RECEPTOR GLUTAMATE BINDING AND ACTIVATION | Genes involved in Unblocking of NMDA receptor, glutamate binding and activation |
| 0.3 | 5.8 | REACTOME SYNTHESIS SECRETION AND DEACYLATION OF GHRELIN | Genes involved in Synthesis, Secretion, and Deacylation of Ghrelin |
| 0.3 | 1.5 | REACTOME DOPAMINE NEUROTRANSMITTER RELEASE CYCLE | Genes involved in Dopamine Neurotransmitter Release Cycle |
| 0.3 | 5.9 | REACTOME CLASS C 3 METABOTROPIC GLUTAMATE PHEROMONE RECEPTORS | Genes involved in Class C/3 (Metabotropic glutamate/pheromone receptors) |
| 0.3 | 6.4 | REACTOME ACYL CHAIN REMODELLING OF PE | Genes involved in Acyl chain remodelling of PE |
| 0.3 | 15.4 | REACTOME VOLTAGE GATED POTASSIUM CHANNELS | Genes involved in Voltage gated Potassium channels |
| 0.3 | 5.7 | REACTOME GABA SYNTHESIS RELEASE REUPTAKE AND DEGRADATION | Genes involved in GABA synthesis, release, reuptake and degradation |
| 0.3 | 3.3 | REACTOME ADENYLATE CYCLASE ACTIVATING PATHWAY | Genes involved in Adenylate cyclase activating pathway |
| 0.2 | 5.6 | REACTOME ACETYLCHOLINE NEUROTRANSMITTER RELEASE CYCLE | Genes involved in Acetylcholine Neurotransmitter Release Cycle |
| 0.2 | 4.2 | REACTOME REGULATION OF SIGNALING BY CBL | Genes involved in Regulation of signaling by CBL |
| 0.2 | 6.0 | REACTOME THROMBOXANE SIGNALLING THROUGH TP RECEPTOR | Genes involved in Thromboxane signalling through TP receptor |
| 0.2 | 3.9 | REACTOME SYNTHESIS OF PA | Genes involved in Synthesis of PA |
| 0.2 | 3.4 | REACTOME REVERSIBLE HYDRATION OF CARBON DIOXIDE | Genes involved in Reversible Hydration of Carbon Dioxide |
| 0.2 | 3.7 | REACTOME SHC MEDIATED SIGNALLING | Genes involved in SHC-mediated signalling |
| 0.2 | 4.8 | REACTOME PKA MEDIATED PHOSPHORYLATION OF CREB | Genes involved in PKA-mediated phosphorylation of CREB |
| 0.2 | 0.9 | REACTOME G BETA GAMMA SIGNALLING THROUGH PLC BETA | Genes involved in G beta:gamma signalling through PLC beta |
| 0.2 | 7.3 | REACTOME INTERACTION BETWEEN L1 AND ANKYRINS | Genes involved in Interaction between L1 and Ankyrins |
| 0.2 | 2.1 | REACTOME REGULATORY RNA PATHWAYS | Genes involved in Regulatory RNA pathways |
| 0.2 | 25.7 | REACTOME TRANSPORT OF INORGANIC CATIONS ANIONS AND AMINO ACIDS OLIGOPEPTIDES | Genes involved in Transport of inorganic cations/anions and amino acids/oligopeptides |
| 0.2 | 7.0 | REACTOME A TETRASACCHARIDE LINKER SEQUENCE IS REQUIRED FOR GAG SYNTHESIS | Genes involved in A tetrasaccharide linker sequence is required for GAG synthesis |
| 0.2 | 2.1 | REACTOME PASSIVE TRANSPORT BY AQUAPORINS | Genes involved in Passive Transport by Aquaporins |
| 0.1 | 2.7 | REACTOME DESTABILIZATION OF MRNA BY BRF1 | Genes involved in Destabilization of mRNA by Butyrate Response Factor 1 (BRF1) |
| 0.1 | 1.6 | REACTOME NEGATIVE REGULATION OF THE PI3K AKT NETWORK | Genes involved in Negative regulation of the PI3K/AKT network |
| 0.1 | 3.5 | REACTOME REGULATION OF INSULIN LIKE GROWTH FACTOR IGF ACTIVITY BY INSULIN LIKE GROWTH FACTOR BINDING PROTEINS IGFBPS | Genes involved in Regulation of Insulin-like Growth Factor (IGF) Activity by Insulin-like Growth Factor Binding Proteins (IGFBPs) |
| 0.1 | 5.3 | REACTOME AMINE LIGAND BINDING RECEPTORS | Genes involved in Amine ligand-binding receptors |
| 0.1 | 6.7 | REACTOME NITRIC OXIDE STIMULATES GUANYLATE CYCLASE | Genes involved in Nitric oxide stimulates guanylate cyclase |
| 0.1 | 3.2 | REACTOME SIGNALING BY FGFR1 FUSION MUTANTS | Genes involved in Signaling by FGFR1 fusion mutants |
| 0.1 | 4.5 | REACTOME REGULATION OF GENE EXPRESSION IN BETA CELLS | Genes involved in Regulation of gene expression in beta cells |
| 0.1 | 4.1 | REACTOME TRAF6 MEDIATED NFKB ACTIVATION | Genes involved in TRAF6 mediated NF-kB activation |
| 0.1 | 2.1 | REACTOME ALPHA LINOLENIC ACID ALA METABOLISM | Genes involved in alpha-linolenic acid (ALA) metabolism |
| 0.1 | 2.3 | REACTOME SHC1 EVENTS IN ERBB4 SIGNALING | Genes involved in SHC1 events in ERBB4 signaling |
| 0.1 | 0.7 | REACTOME RNA POL I PROMOTER OPENING | Genes involved in RNA Polymerase I Promoter Opening |
| 0.1 | 0.9 | REACTOME YAP1 AND WWTR1 TAZ STIMULATED GENE EXPRESSION | Genes involved in YAP1- and WWTR1 (TAZ)-stimulated gene expression |
| 0.1 | 2.2 | REACTOME AMINE COMPOUND SLC TRANSPORTERS | Genes involved in Amine compound SLC transporters |
| 0.1 | 1.8 | REACTOME COMMON PATHWAY | Genes involved in Common Pathway |
| 0.1 | 3.5 | REACTOME CLASS B 2 SECRETIN FAMILY RECEPTORS | Genes involved in Class B/2 (Secretin family receptors) |
| 0.1 | 0.3 | REACTOME SHC1 EVENTS IN EGFR SIGNALING | Genes involved in SHC1 events in EGFR signaling |
| 0.1 | 1.1 | REACTOME SYNTHESIS OF PIPS AT THE EARLY ENDOSOME MEMBRANE | Genes involved in Synthesis of PIPs at the early endosome membrane |
| 0.1 | 1.2 | REACTOME INHIBITION OF INSULIN SECRETION BY ADRENALINE NORADRENALINE | Genes involved in Inhibition of Insulin Secretion by Adrenaline/Noradrenaline |
| 0.1 | 1.7 | REACTOME ACTIVATION OF BH3 ONLY PROTEINS | Genes involved in Activation of BH3-only proteins |
| 0.1 | 1.0 | REACTOME NEF MEDIATED DOWNREGULATION OF MHC CLASS I COMPLEX CELL SURFACE EXPRESSION | Genes involved in Nef mediated downregulation of MHC class I complex cell surface expression |
| 0.1 | 2.6 | REACTOME SYNTHESIS OF PIPS AT THE PLASMA MEMBRANE | Genes involved in Synthesis of PIPs at the plasma membrane |
| 0.1 | 3.5 | REACTOME POTASSIUM CHANNELS | Genes involved in Potassium Channels |
| 0.1 | 1.4 | REACTOME ACTIVATION OF THE AP1 FAMILY OF TRANSCRIPTION FACTORS | Genes involved in Activation of the AP-1 family of transcription factors |
| 0.1 | 8.3 | REACTOME G ALPHA S SIGNALLING EVENTS | Genes involved in G alpha (s) signalling events |
| 0.1 | 9.5 | REACTOME PPARA ACTIVATES GENE EXPRESSION | Genes involved in PPARA Activates Gene Expression |
| 0.1 | 3.0 | REACTOME SMAD2 SMAD3 SMAD4 HETEROTRIMER REGULATES TRANSCRIPTION | Genes involved in SMAD2/SMAD3:SMAD4 heterotrimer regulates transcription |
| 0.1 | 2.5 | REACTOME MRNA 3 END PROCESSING | Genes involved in mRNA 3'-end processing |
| 0.0 | 2.7 | REACTOME ION TRANSPORT BY P TYPE ATPASES | Genes involved in Ion transport by P-type ATPases |
| 0.0 | 1.4 | REACTOME BIOSYNTHESIS OF THE N GLYCAN PRECURSOR DOLICHOL LIPID LINKED OLIGOSACCHARIDE LLO AND TRANSFER TO A NASCENT PROTEIN | Genes involved in Biosynthesis of the N-glycan precursor (dolichol lipid-linked oligosaccharide, LLO) and transfer to a nascent protein |
| 0.0 | 1.6 | REACTOME LATE PHASE OF HIV LIFE CYCLE | Genes involved in Late Phase of HIV Life Cycle |
| 0.0 | 0.8 | REACTOME PRE NOTCH PROCESSING IN GOLGI | Genes involved in Pre-NOTCH Processing in Golgi |
| 0.0 | 4.7 | REACTOME INTEGRIN CELL SURFACE INTERACTIONS | Genes involved in Integrin cell surface interactions |
| 0.0 | 1.7 | REACTOME ION CHANNEL TRANSPORT | Genes involved in Ion channel transport |
| 0.0 | 2.1 | REACTOME RNA POL II TRANSCRIPTION PRE INITIATION AND PROMOTER OPENING | Genes involved in RNA Polymerase II Transcription Pre-Initiation And Promoter Opening |
| 0.0 | 2.1 | REACTOME NOTCH1 INTRACELLULAR DOMAIN REGULATES TRANSCRIPTION | Genes involved in NOTCH1 Intracellular Domain Regulates Transcription |
| 0.0 | 0.4 | REACTOME DOWNREGULATION OF TGF BETA RECEPTOR SIGNALING | Genes involved in Downregulation of TGF-beta receptor signaling |
| 0.0 | 0.6 | REACTOME OTHER SEMAPHORIN INTERACTIONS | Genes involved in Other semaphorin interactions |
| 0.0 | 0.8 | REACTOME ADHERENS JUNCTIONS INTERACTIONS | Genes involved in Adherens junctions interactions |
| 0.0 | 0.1 | REACTOME G PROTEIN ACTIVATION | Genes involved in G-protein activation |
| 0.0 | 0.3 | REACTOME REGULATION OF IFNG SIGNALING | Genes involved in Regulation of IFNG signaling |
| 0.0 | 0.7 | REACTOME NUCLEAR SIGNALING BY ERBB4 | Genes involved in Nuclear signaling by ERBB4 |
| 0.0 | 1.6 | REACTOME NEUROTRANSMITTER RECEPTOR BINDING AND DOWNSTREAM TRANSMISSION IN THE POSTSYNAPTIC CELL | Genes involved in Neurotransmitter Receptor Binding And Downstream Transmission In The Postsynaptic Cell |
| 0.0 | 1.1 | REACTOME NUCLEAR RECEPTOR TRANSCRIPTION PATHWAY | Genes involved in Nuclear Receptor transcription pathway |