Project
GNF SymAtlas + NCI-60 cancer cell lines, human (Su, 2004; Ross, 2000)
Navigation
Downloads
Results for UCAAGUA
Z-value: 1.08
Motif logo

miRNA associated with seed UCAAGUA
| Name | miRBASE accession |
|---|---|
|
hsa-miR-1297
|
MIMAT0005886 |
|
hsa-miR-26a-5p
|
MIMAT0000082 |
|
hsa-miR-26b-5p
|
MIMAT0000083 |
|
hsa-miR-4465
|
MIMAT0018992 |
Activity profile of UCAAGUA motif
Sorted Z-values of UCAAGUA motif
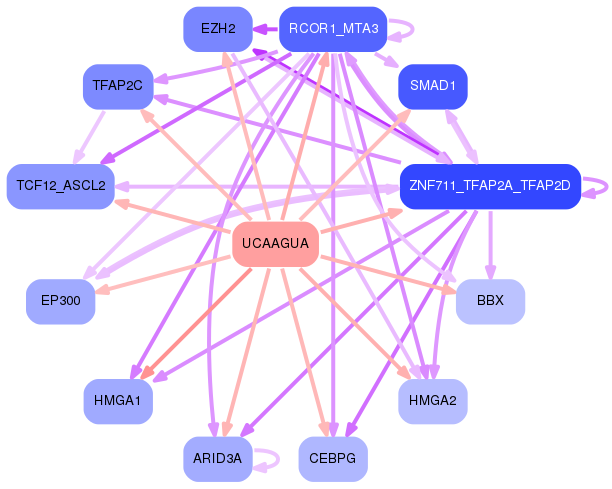
Network of associatons between targets according to the STRING database.

First level regulatory network of UCAAGUA
Gene Ontology Analysis
Gene overrepresentation in biological process category:
| Log-likelihood per target | Total log-likelihood | Term | Description |
|---|---|---|---|
| 9.2 | 27.6 | GO:0090402 | oncogene-induced cell senescence(GO:0090402) |
| 6.6 | 19.7 | GO:1902594 | viral penetration into host nucleus(GO:0075732) multi-organism nuclear import(GO:1902594) |
| 4.2 | 12.7 | GO:0016344 | meiotic chromosome movement towards spindle pole(GO:0016344) |
| 4.0 | 16.2 | GO:1903984 | rhythmic synaptic transmission(GO:0060024) positive regulation of TRAIL-activated apoptotic signaling pathway(GO:1903984) |
| 3.4 | 10.2 | GO:0071921 | establishment of sister chromatid cohesion(GO:0034085) cohesin loading(GO:0071921) regulation of cohesin loading(GO:0071922) |
| 2.8 | 8.3 | GO:0001732 | formation of cytoplasmic translation initiation complex(GO:0001732) |
| 2.8 | 8.3 | GO:1901355 | response to rapamycin(GO:1901355) |
| 2.5 | 7.4 | GO:2000298 | regulation of Rho-dependent protein serine/threonine kinase activity(GO:2000298) |
| 2.3 | 9.2 | GO:1990737 | response to manganese-induced endoplasmic reticulum stress(GO:1990737) |
| 2.3 | 9.1 | GO:0051088 | PMA-inducible membrane protein ectodomain proteolysis(GO:0051088) |
| 2.2 | 8.9 | GO:0003409 | optic cup structural organization(GO:0003409) |
| 2.2 | 6.5 | GO:0034402 | recruitment of 3'-end processing factors to RNA polymerase II holoenzyme complex(GO:0034402) |
| 2.2 | 10.8 | GO:1903588 | negative regulation of blood vessel endothelial cell proliferation involved in sprouting angiogenesis(GO:1903588) |
| 2.0 | 27.9 | GO:0018206 | peptidyl-methionine modification(GO:0018206) |
| 2.0 | 7.8 | GO:1903347 | negative regulation of bicellular tight junction assembly(GO:1903347) |
| 1.9 | 5.6 | GO:0036333 | hepatocyte homeostasis(GO:0036333) response to tetrachloromethane(GO:1904772) |
| 1.9 | 9.4 | GO:2001271 | negative regulation of cysteine-type endopeptidase activity involved in execution phase of apoptosis(GO:2001271) |
| 1.7 | 8.6 | GO:0042796 | snRNA transcription from RNA polymerase III promoter(GO:0042796) |
| 1.7 | 5.2 | GO:2000752 | regulation of phospholipid scramblase activity(GO:1900161) positive regulation of phospholipid scramblase activity(GO:1900163) regulation of glucosylceramide catabolic process(GO:2000752) positive regulation of glucosylceramide catabolic process(GO:2000753) regulation of sphingomyelin catabolic process(GO:2000754) positive regulation of sphingomyelin catabolic process(GO:2000755) |
| 1.7 | 8.5 | GO:0042986 | positive regulation of amyloid precursor protein biosynthetic process(GO:0042986) |
| 1.7 | 11.8 | GO:0032328 | alanine transport(GO:0032328) |
| 1.6 | 4.9 | GO:0060279 | regulation of ovulation(GO:0060278) positive regulation of ovulation(GO:0060279) |
| 1.6 | 6.5 | GO:0097327 | response to antineoplastic agent(GO:0097327) |
| 1.5 | 4.4 | GO:0048319 | axial mesoderm morphogenesis(GO:0048319) negative regulation of lymphangiogenesis(GO:1901491) |
| 1.5 | 8.7 | GO:0035616 | histone H2B conserved C-terminal lysine deubiquitination(GO:0035616) |
| 1.4 | 4.1 | GO:2000740 | amniotic stem cell differentiation(GO:0097086) negative regulation of dense core granule biogenesis(GO:2000706) negative regulation of mesenchymal stem cell differentiation(GO:2000740) regulation of amniotic stem cell differentiation(GO:2000797) negative regulation of amniotic stem cell differentiation(GO:2000798) |
| 1.4 | 19.0 | GO:2000643 | positive regulation of early endosome to late endosome transport(GO:2000643) |
| 1.3 | 3.9 | GO:0070213 | protein auto-ADP-ribosylation(GO:0070213) |
| 1.3 | 10.3 | GO:0071651 | positive regulation of chemokine (C-C motif) ligand 5 production(GO:0071651) |
| 1.3 | 5.0 | GO:0010796 | regulation of multivesicular body size(GO:0010796) |
| 1.2 | 16.0 | GO:2000271 | positive regulation of fibroblast apoptotic process(GO:2000271) |
| 1.2 | 4.7 | GO:2001247 | positive regulation of phosphatidylcholine biosynthetic process(GO:2001247) |
| 1.1 | 3.3 | GO:0003420 | regulation of growth plate cartilage chondrocyte proliferation(GO:0003420) |
| 1.1 | 20.3 | GO:0032486 | Rap protein signal transduction(GO:0032486) |
| 1.1 | 3.2 | GO:0048250 | mitochondrial iron ion transport(GO:0048250) |
| 1.0 | 9.2 | GO:0043353 | enucleate erythrocyte differentiation(GO:0043353) |
| 1.0 | 3.0 | GO:2000616 | negative regulation of histone H3-K9 acetylation(GO:2000616) |
| 1.0 | 4.0 | GO:0045074 | interleukin-10 biosynthetic process(GO:0042091) regulation of interleukin-10 biosynthetic process(GO:0045074) |
| 1.0 | 3.9 | GO:1903371 | regulation of endoplasmic reticulum tubular network organization(GO:1903371) |
| 1.0 | 9.8 | GO:0070933 | histone H4 deacetylation(GO:0070933) |
| 1.0 | 32.3 | GO:0006607 | NLS-bearing protein import into nucleus(GO:0006607) |
| 0.9 | 14.1 | GO:0000338 | protein deneddylation(GO:0000338) |
| 0.9 | 2.7 | GO:0021538 | epithalamus development(GO:0021538) habenula development(GO:0021986) |
| 0.9 | 6.3 | GO:1903895 | negative regulation of IRE1-mediated unfolded protein response(GO:1903895) |
| 0.9 | 14.3 | GO:0036010 | protein localization to endosome(GO:0036010) |
| 0.9 | 11.5 | GO:0044387 | negative regulation of protein kinase activity by regulation of protein phosphorylation(GO:0044387) |
| 0.9 | 17.4 | GO:0018345 | protein palmitoylation(GO:0018345) |
| 0.9 | 13.7 | GO:0045116 | protein neddylation(GO:0045116) |
| 0.8 | 7.5 | GO:0010994 | regulation of ubiquitin homeostasis(GO:0010993) free ubiquitin chain polymerization(GO:0010994) |
| 0.7 | 2.2 | GO:0010046 | B cell selection(GO:0002339) response to mycotoxin(GO:0010046) |
| 0.7 | 2.9 | GO:0023016 | signal transduction by trans-phosphorylation(GO:0023016) |
| 0.7 | 5.9 | GO:0034316 | negative regulation of Arp2/3 complex-mediated actin nucleation(GO:0034316) |
| 0.7 | 2.2 | GO:2001023 | regulation of response to drug(GO:2001023) |
| 0.7 | 5.1 | GO:0002051 | osteoblast fate commitment(GO:0002051) |
| 0.7 | 22.5 | GO:0051016 | barbed-end actin filament capping(GO:0051016) |
| 0.7 | 4.3 | GO:0098795 | mRNA cleavage involved in gene silencing by miRNA(GO:0035279) mRNA cleavage involved in gene silencing by siRNA(GO:0090625) mRNA cleavage involved in gene silencing(GO:0098795) |
| 0.7 | 9.2 | GO:1904293 | negative regulation of ERAD pathway(GO:1904293) |
| 0.7 | 7.0 | GO:0010898 | positive regulation of triglyceride catabolic process(GO:0010898) |
| 0.7 | 4.9 | GO:0016584 | nucleosome positioning(GO:0016584) |
| 0.7 | 3.4 | GO:0018076 | N-terminal peptidyl-lysine acetylation(GO:0018076) |
| 0.7 | 3.4 | GO:0019348 | dolichol metabolic process(GO:0019348) |
| 0.6 | 3.9 | GO:0071460 | cellular response to cell-matrix adhesion(GO:0071460) |
| 0.6 | 8.9 | GO:0051574 | positive regulation of histone H3-K9 methylation(GO:0051574) |
| 0.6 | 3.1 | GO:1900127 | renal water absorption(GO:0070295) positive regulation of hyaluronan biosynthetic process(GO:1900127) |
| 0.6 | 1.9 | GO:0070837 | dehydroascorbic acid transport(GO:0070837) |
| 0.6 | 2.4 | GO:0034670 | chemotaxis to arachidonic acid(GO:0034670) response to arachidonic acid(GO:1904550) |
| 0.6 | 2.4 | GO:0007206 | phospholipase C-activating G-protein coupled glutamate receptor signaling pathway(GO:0007206) |
| 0.6 | 14.0 | GO:0051923 | sulfation(GO:0051923) |
| 0.6 | 2.9 | GO:0071895 | odontoblast differentiation(GO:0071895) |
| 0.6 | 3.9 | GO:0010890 | positive regulation of sequestering of triglyceride(GO:0010890) |
| 0.6 | 2.8 | GO:0072385 | minus-end-directed organelle transport along microtubule(GO:0072385) |
| 0.5 | 9.3 | GO:0007253 | cytoplasmic sequestering of NF-kappaB(GO:0007253) |
| 0.5 | 3.7 | GO:0090481 | pyrimidine nucleotide-sugar transmembrane transport(GO:0090481) |
| 0.5 | 2.6 | GO:2001137 | positive regulation of endocytic recycling(GO:2001137) |
| 0.5 | 1.5 | GO:0042727 | flavin-containing compound biosynthetic process(GO:0042727) |
| 0.5 | 19.5 | GO:0045737 | positive regulation of cyclin-dependent protein serine/threonine kinase activity(GO:0045737) |
| 0.5 | 3.8 | GO:0070164 | negative regulation of adiponectin secretion(GO:0070164) |
| 0.5 | 4.7 | GO:0031936 | negative regulation of chromatin silencing(GO:0031936) |
| 0.5 | 4.7 | GO:0061732 | mitochondrial acetyl-CoA biosynthetic process from pyruvate(GO:0061732) |
| 0.5 | 2.3 | GO:1904016 | response to Thyroglobulin triiodothyronine(GO:1904016) |
| 0.5 | 3.7 | GO:0035989 | tendon development(GO:0035989) |
| 0.4 | 2.6 | GO:0019065 | receptor-mediated endocytosis of virus by host cell(GO:0019065) endocytosis involved in viral entry into host cell(GO:0075509) |
| 0.4 | 1.8 | GO:0006556 | S-adenosylmethionine biosynthetic process(GO:0006556) |
| 0.4 | 1.3 | GO:1903774 | positive regulation of viral budding via host ESCRT complex(GO:1903774) |
| 0.4 | 1.7 | GO:0016080 | positive regulation of circadian sleep/wake cycle, wakefulness(GO:0010841) synaptic vesicle targeting(GO:0016080) retrograde trans-synaptic signaling by soluble gas(GO:0098923) trans-synaptic signaling by soluble gas(GO:0099543) positive regulation of synaptic vesicle endocytosis(GO:1900244) positive regulation of synaptic vesicle recycling(GO:1903423) |
| 0.4 | 12.0 | GO:0016578 | histone deubiquitination(GO:0016578) |
| 0.4 | 1.3 | GO:0060151 | peroxisome localization(GO:0060151) microtubule-based peroxisome localization(GO:0060152) |
| 0.4 | 6.8 | GO:0034356 | NAD biosynthesis via nicotinamide riboside salvage pathway(GO:0034356) |
| 0.4 | 1.7 | GO:0090283 | regulation of protein glycosylation in Golgi(GO:0090283) |
| 0.4 | 0.8 | GO:0060298 | positive regulation of sarcomere organization(GO:0060298) |
| 0.4 | 5.2 | GO:0006449 | regulation of translational termination(GO:0006449) |
| 0.4 | 3.4 | GO:0060613 | fat pad development(GO:0060613) |
| 0.4 | 7.9 | GO:0060211 | regulation of nuclear-transcribed mRNA poly(A) tail shortening(GO:0060211) positive regulation of nuclear-transcribed mRNA poly(A) tail shortening(GO:0060213) |
| 0.4 | 0.7 | GO:0043974 | histone H3-K27 acetylation(GO:0043974) regulation of histone H3-K27 acetylation(GO:1901674) |
| 0.4 | 1.1 | GO:0060268 | negative regulation of respiratory burst(GO:0060268) |
| 0.4 | 3.2 | GO:0030263 | apoptotic chromosome condensation(GO:0030263) |
| 0.4 | 2.1 | GO:0045541 | negative regulation of cholesterol biosynthetic process(GO:0045541) negative regulation of cholesterol metabolic process(GO:0090206) |
| 0.4 | 2.1 | GO:0045629 | negative regulation of T-helper 2 cell differentiation(GO:0045629) |
| 0.3 | 5.1 | GO:0032968 | positive regulation of transcription elongation from RNA polymerase II promoter(GO:0032968) |
| 0.3 | 3.4 | GO:1905098 | negative regulation of guanyl-nucleotide exchange factor activity(GO:1905098) |
| 0.3 | 1.2 | GO:0061073 | ciliary body morphogenesis(GO:0061073) endocardial cushion cell differentiation(GO:0061443) |
| 0.3 | 0.9 | GO:0071934 | thiamine transport(GO:0015888) thiamine transmembrane transport(GO:0071934) |
| 0.3 | 2.4 | GO:0038028 | insulin receptor signaling pathway via phosphatidylinositol 3-kinase(GO:0038028) |
| 0.3 | 1.5 | GO:0008063 | Toll signaling pathway(GO:0008063) |
| 0.3 | 4.2 | GO:0070934 | CRD-mediated mRNA stabilization(GO:0070934) |
| 0.3 | 1.5 | GO:0009450 | gamma-aminobutyric acid catabolic process(GO:0009450) |
| 0.3 | 4.4 | GO:0048172 | regulation of short-term neuronal synaptic plasticity(GO:0048172) |
| 0.3 | 7.5 | GO:0006851 | mitochondrial calcium ion transport(GO:0006851) |
| 0.3 | 2.8 | GO:2000138 | positive regulation of cell proliferation involved in heart morphogenesis(GO:2000138) |
| 0.3 | 0.8 | GO:0007500 | mesodermal cell fate determination(GO:0007500) negative regulation of muscle hyperplasia(GO:0014740) |
| 0.3 | 12.7 | GO:0070534 | protein K63-linked ubiquitination(GO:0070534) |
| 0.3 | 8.2 | GO:0072600 | establishment of protein localization to Golgi(GO:0072600) |
| 0.3 | 3.9 | GO:0090084 | negative regulation of inclusion body assembly(GO:0090084) |
| 0.3 | 9.5 | GO:0042026 | protein refolding(GO:0042026) |
| 0.3 | 8.7 | GO:0051894 | positive regulation of focal adhesion assembly(GO:0051894) positive regulation of adherens junction organization(GO:1903393) |
| 0.3 | 1.3 | GO:2000672 | negative regulation of motor neuron apoptotic process(GO:2000672) |
| 0.3 | 16.8 | GO:0031663 | lipopolysaccharide-mediated signaling pathway(GO:0031663) |
| 0.3 | 1.8 | GO:0035583 | sequestering of TGFbeta in extracellular matrix(GO:0035583) |
| 0.2 | 1.2 | GO:0043697 | dedifferentiation(GO:0043696) cell dedifferentiation(GO:0043697) |
| 0.2 | 2.7 | GO:0035313 | wound healing, spreading of epidermal cells(GO:0035313) |
| 0.2 | 4.5 | GO:0034453 | microtubule anchoring(GO:0034453) |
| 0.2 | 3.9 | GO:0032793 | positive regulation of CREB transcription factor activity(GO:0032793) |
| 0.2 | 2.5 | GO:0045722 | positive regulation of gluconeogenesis(GO:0045722) |
| 0.2 | 8.6 | GO:0015804 | neutral amino acid transport(GO:0015804) |
| 0.2 | 2.7 | GO:0010917 | negative regulation of mitochondrial membrane potential(GO:0010917) positive regulation of endoplasmic reticulum stress-induced intrinsic apoptotic signaling pathway(GO:1902237) |
| 0.2 | 6.7 | GO:0090140 | regulation of mitochondrial fission(GO:0090140) |
| 0.2 | 4.8 | GO:0007020 | microtubule nucleation(GO:0007020) |
| 0.2 | 1.4 | GO:0038026 | reelin-mediated signaling pathway(GO:0038026) |
| 0.2 | 1.0 | GO:1902474 | positive regulation of protein localization to synapse(GO:1902474) |
| 0.2 | 1.2 | GO:0060665 | regulation of branching involved in salivary gland morphogenesis by mesenchymal-epithelial signaling(GO:0060665) |
| 0.2 | 1.4 | GO:0060235 | lens induction in camera-type eye(GO:0060235) |
| 0.2 | 1.4 | GO:1902914 | regulation of protein polyubiquitination(GO:1902914) positive regulation of protein polyubiquitination(GO:1902916) |
| 0.2 | 2.9 | GO:0021694 | cerebellar Purkinje cell layer formation(GO:0021694) cerebellar Purkinje cell differentiation(GO:0021702) |
| 0.2 | 0.6 | GO:1904339 | negative regulation of dopaminergic neuron differentiation(GO:1904339) |
| 0.2 | 2.3 | GO:0033235 | positive regulation of protein sumoylation(GO:0033235) |
| 0.2 | 2.6 | GO:0015074 | DNA integration(GO:0015074) |
| 0.2 | 0.5 | GO:0015917 | aminophospholipid transport(GO:0015917) |
| 0.2 | 0.7 | GO:0035261 | external genitalia morphogenesis(GO:0035261) |
| 0.2 | 0.5 | GO:0061573 | cytoplasmic actin-based contraction involved in cell motility(GO:0060327) endoplasmic reticulum polarization(GO:0061163) actin filament bundle retrograde transport(GO:0061573) actin filament bundle distribution(GO:0070650) |
| 0.2 | 0.9 | GO:0071896 | protein localization to adherens junction(GO:0071896) |
| 0.2 | 0.7 | GO:1900153 | regulation of nuclear-transcribed mRNA catabolic process, deadenylation-dependent decay(GO:1900151) positive regulation of nuclear-transcribed mRNA catabolic process, deadenylation-dependent decay(GO:1900153) |
| 0.2 | 5.0 | GO:0032402 | melanosome transport(GO:0032402) |
| 0.2 | 3.8 | GO:1902166 | negative regulation of intrinsic apoptotic signaling pathway in response to DNA damage by p53 class mediator(GO:1902166) |
| 0.2 | 14.8 | GO:0048208 | vesicle targeting, rough ER to cis-Golgi(GO:0048207) COPII vesicle coating(GO:0048208) |
| 0.2 | 2.0 | GO:0035970 | peptidyl-threonine dephosphorylation(GO:0035970) |
| 0.2 | 4.3 | GO:1904886 | beta-catenin destruction complex disassembly(GO:1904886) |
| 0.2 | 1.2 | GO:0006013 | mannose metabolic process(GO:0006013) |
| 0.1 | 8.5 | GO:0016266 | O-glycan processing(GO:0016266) |
| 0.1 | 2.8 | GO:0007084 | mitotic nuclear envelope reassembly(GO:0007084) |
| 0.1 | 7.0 | GO:1902036 | regulation of hematopoietic stem cell differentiation(GO:1902036) |
| 0.1 | 3.2 | GO:0043153 | entrainment of circadian clock by photoperiod(GO:0043153) |
| 0.1 | 0.6 | GO:0035977 | protein deglycosylation involved in glycoprotein catabolic process(GO:0035977) glycoprotein ERAD pathway(GO:0097466) mannose trimming involved in glycoprotein ERAD pathway(GO:1904382) |
| 0.1 | 10.4 | GO:0060999 | positive regulation of dendritic spine development(GO:0060999) |
| 0.1 | 1.8 | GO:0060124 | positive regulation of growth hormone secretion(GO:0060124) |
| 0.1 | 0.8 | GO:0009649 | entrainment of circadian clock(GO:0009649) |
| 0.1 | 1.3 | GO:0070816 | phosphorylation of RNA polymerase II C-terminal domain(GO:0070816) |
| 0.1 | 1.1 | GO:0042118 | endothelial cell activation(GO:0042118) |
| 0.1 | 1.2 | GO:0007023 | post-chaperonin tubulin folding pathway(GO:0007023) |
| 0.1 | 0.5 | GO:0048861 | leukemia inhibitory factor signaling pathway(GO:0048861) |
| 0.1 | 2.4 | GO:0006646 | phosphatidylethanolamine biosynthetic process(GO:0006646) |
| 0.1 | 2.1 | GO:0050774 | negative regulation of dendrite morphogenesis(GO:0050774) |
| 0.1 | 1.0 | GO:0017183 | peptidyl-diphthamide metabolic process(GO:0017182) peptidyl-diphthamide biosynthetic process from peptidyl-histidine(GO:0017183) |
| 0.1 | 0.1 | GO:1904431 | positive regulation of t-circle formation(GO:1904431) |
| 0.1 | 2.8 | GO:0050849 | negative regulation of calcium-mediated signaling(GO:0050849) |
| 0.1 | 0.4 | GO:1990834 | response to odorant(GO:1990834) |
| 0.1 | 0.8 | GO:0031339 | negative regulation of vesicle fusion(GO:0031339) |
| 0.1 | 4.2 | GO:0045672 | positive regulation of osteoclast differentiation(GO:0045672) |
| 0.1 | 3.7 | GO:0046688 | response to copper ion(GO:0046688) |
| 0.1 | 7.5 | GO:0006977 | DNA damage response, signal transduction by p53 class mediator resulting in cell cycle arrest(GO:0006977) |
| 0.1 | 4.3 | GO:0006509 | membrane protein ectodomain proteolysis(GO:0006509) |
| 0.1 | 2.6 | GO:0089711 | L-glutamate transmembrane transport(GO:0089711) |
| 0.1 | 1.0 | GO:0001561 | fatty acid alpha-oxidation(GO:0001561) |
| 0.1 | 2.4 | GO:0000289 | nuclear-transcribed mRNA poly(A) tail shortening(GO:0000289) |
| 0.1 | 15.9 | GO:0043488 | regulation of mRNA stability(GO:0043488) |
| 0.1 | 3.1 | GO:0070979 | protein K11-linked ubiquitination(GO:0070979) |
| 0.1 | 2.7 | GO:0034314 | Arp2/3 complex-mediated actin nucleation(GO:0034314) |
| 0.1 | 0.5 | GO:0006701 | progesterone biosynthetic process(GO:0006701) |
| 0.1 | 9.1 | GO:0098869 | cellular oxidant detoxification(GO:0098869) |
| 0.1 | 2.8 | GO:0032922 | circadian regulation of gene expression(GO:0032922) |
| 0.1 | 2.0 | GO:0090162 | establishment of epithelial cell polarity(GO:0090162) |
| 0.1 | 0.9 | GO:0098789 | pre-mRNA cleavage required for polyadenylation(GO:0098789) |
| 0.1 | 1.4 | GO:0003334 | keratinocyte development(GO:0003334) |
| 0.1 | 2.3 | GO:0001958 | endochondral ossification(GO:0001958) replacement ossification(GO:0036075) |
| 0.1 | 0.3 | GO:0086048 | membrane depolarization during bundle of His cell action potential(GO:0086048) |
| 0.1 | 0.9 | GO:0016024 | CDP-diacylglycerol biosynthetic process(GO:0016024) |
| 0.1 | 2.4 | GO:0006409 | tRNA export from nucleus(GO:0006409) tRNA-containing ribonucleoprotein complex export from nucleus(GO:0071431) |
| 0.1 | 1.5 | GO:0006359 | regulation of transcription from RNA polymerase III promoter(GO:0006359) |
| 0.1 | 0.1 | GO:1902309 | negative regulation of peptidyl-serine dephosphorylation(GO:1902309) |
| 0.1 | 0.2 | GO:0001915 | negative regulation of T cell mediated cytotoxicity(GO:0001915) |
| 0.0 | 2.9 | GO:2000134 | negative regulation of G1/S transition of mitotic cell cycle(GO:2000134) |
| 0.0 | 0.6 | GO:0045779 | negative regulation of bone resorption(GO:0045779) |
| 0.0 | 5.1 | GO:0007292 | female gamete generation(GO:0007292) |
| 0.0 | 4.5 | GO:0008543 | fibroblast growth factor receptor signaling pathway(GO:0008543) |
| 0.0 | 3.4 | GO:0016575 | histone deacetylation(GO:0016575) |
| 0.0 | 2.3 | GO:0046847 | filopodium assembly(GO:0046847) |
| 0.0 | 0.2 | GO:1903378 | positive regulation of oxidative stress-induced neuron intrinsic apoptotic signaling pathway(GO:1903378) |
| 0.0 | 0.9 | GO:0030206 | chondroitin sulfate biosynthetic process(GO:0030206) |
| 0.0 | 0.0 | GO:2000015 | regulation of determination of dorsal identity(GO:2000015) |
| 0.0 | 0.4 | GO:0035584 | calcium-mediated signaling using intracellular calcium source(GO:0035584) |
| 0.0 | 5.3 | GO:0060348 | bone development(GO:0060348) |
| 0.0 | 0.4 | GO:0042407 | cristae formation(GO:0042407) |
| 0.0 | 0.3 | GO:0061052 | negative regulation of cell proliferation involved in contact inhibition(GO:0060244) negative regulation of cell growth involved in cardiac muscle cell development(GO:0061052) |
| 0.0 | 1.4 | GO:0050850 | positive regulation of calcium-mediated signaling(GO:0050850) |
| 0.0 | 1.5 | GO:0030316 | osteoclast differentiation(GO:0030316) |
| 0.0 | 0.3 | GO:0005981 | regulation of glycogen catabolic process(GO:0005981) |
| 0.0 | 11.0 | GO:0006260 | DNA replication(GO:0006260) |
| 0.0 | 1.1 | GO:0045652 | regulation of megakaryocyte differentiation(GO:0045652) |
| 0.0 | 3.1 | GO:0007093 | mitotic cell cycle checkpoint(GO:0007093) |
| 0.0 | 0.9 | GO:0010862 | positive regulation of pathway-restricted SMAD protein phosphorylation(GO:0010862) |
| 0.0 | 0.6 | GO:0048240 | sperm capacitation(GO:0048240) |
| 0.0 | 1.4 | GO:0021762 | substantia nigra development(GO:0021762) |
| 0.0 | 0.5 | GO:1904659 | hexose transmembrane transport(GO:0035428) glucose transmembrane transport(GO:1904659) |
| 0.0 | 1.7 | GO:0016925 | protein sumoylation(GO:0016925) |
| 0.0 | 13.4 | GO:0002283 | neutrophil activation involved in immune response(GO:0002283) neutrophil degranulation(GO:0043312) |
| 0.0 | 2.0 | GO:0001523 | retinoid metabolic process(GO:0001523) |
| 0.0 | 3.6 | GO:0044744 | protein import into nucleus(GO:0006606) protein targeting to nucleus(GO:0044744) |
| 0.0 | 0.6 | GO:0032456 | endocytic recycling(GO:0032456) |
| 0.0 | 0.7 | GO:0043252 | sodium-independent organic anion transport(GO:0043252) |
| 0.0 | 4.4 | GO:0007034 | vacuolar transport(GO:0007034) |
| 0.0 | 0.1 | GO:0060737 | antral ovarian follicle growth(GO:0001547) prostate epithelial cord elongation(GO:0060523) prostate gland morphogenetic growth(GO:0060737) epithelial cell proliferation involved in mammary gland duct elongation(GO:0060750) branch elongation involved in mammary gland duct branching(GO:0060751) |
| 0.0 | 6.5 | GO:0009615 | response to virus(GO:0009615) |
| 0.0 | 1.9 | GO:0038096 | immune response-regulating cell surface receptor signaling pathway involved in phagocytosis(GO:0002433) Fc-gamma receptor signaling pathway involved in phagocytosis(GO:0038096) |
| 0.0 | 2.1 | GO:0006626 | protein targeting to mitochondrion(GO:0006626) |
| 0.0 | 0.6 | GO:0006826 | iron ion transport(GO:0006826) |
| 0.0 | 0.1 | GO:0031086 | nuclear-transcribed mRNA catabolic process, deadenylation-independent decay(GO:0031086) deadenylation-independent decapping of nuclear-transcribed mRNA(GO:0031087) |
| 0.0 | 1.2 | GO:0008033 | tRNA processing(GO:0008033) |
Gene overrepresentation in cellular component category:
| Log-likelihood per target | Total log-likelihood | Term | Description |
|---|---|---|---|
| 3.9 | 27.6 | GO:0035985 | senescence-associated heterochromatin focus(GO:0035985) |
| 3.7 | 11.2 | GO:0030289 | protein phosphatase 4 complex(GO:0030289) |
| 2.3 | 9.2 | GO:0005850 | eukaryotic translation initiation factor 2 complex(GO:0005850) |
| 2.2 | 8.7 | GO:0031510 | SUMO activating enzyme complex(GO:0031510) |
| 2.2 | 8.6 | GO:0035363 | histone locus body(GO:0035363) |
| 2.0 | 16.2 | GO:0098559 | cytoplasmic side of early endosome membrane(GO:0098559) |
| 2.0 | 13.8 | GO:0031415 | NatA complex(GO:0031415) |
| 1.9 | 5.8 | GO:0043512 | inhibin complex(GO:0043511) inhibin A complex(GO:0043512) |
| 1.7 | 16.8 | GO:0046581 | intercellular canaliculus(GO:0046581) |
| 1.5 | 18.2 | GO:0008290 | F-actin capping protein complex(GO:0008290) WASH complex(GO:0071203) |
| 1.2 | 16.2 | GO:0035749 | myelin sheath adaxonal region(GO:0035749) |
| 1.1 | 14.8 | GO:0070938 | contractile ring(GO:0070938) |
| 1.0 | 11.5 | GO:0016593 | Cdc73/Paf1 complex(GO:0016593) |
| 1.0 | 3.1 | GO:0005592 | collagen type XI trimer(GO:0005592) |
| 1.0 | 8.3 | GO:0031931 | TORC1 complex(GO:0031931) |
| 1.0 | 7.2 | GO:0016272 | prefoldin complex(GO:0016272) |
| 1.0 | 10.2 | GO:0008278 | cohesin complex(GO:0008278) |
| 1.0 | 5.0 | GO:0098837 | postsynaptic recycling endosome(GO:0098837) |
| 0.9 | 2.7 | GO:0071062 | alphav-beta3 integrin-vitronectin complex(GO:0071062) |
| 0.9 | 4.4 | GO:0044354 | pinosome(GO:0044352) macropinosome(GO:0044354) |
| 0.9 | 0.9 | GO:0071920 | cleavage body(GO:0071920) |
| 0.8 | 5.9 | GO:0090543 | Flemming body(GO:0090543) |
| 0.8 | 8.3 | GO:0071541 | eukaryotic translation initiation factor 3 complex, eIF3m(GO:0071541) |
| 0.8 | 13.3 | GO:0044613 | nuclear pore central transport channel(GO:0044613) nuclear pore nuclear basket(GO:0044615) |
| 0.8 | 15.4 | GO:0005885 | Arp2/3 protein complex(GO:0005885) |
| 0.8 | 3.1 | GO:0070876 | SOSS complex(GO:0070876) |
| 0.7 | 11.5 | GO:0016600 | flotillin complex(GO:0016600) |
| 0.7 | 4.2 | GO:0072669 | tRNA-splicing ligase complex(GO:0072669) |
| 0.7 | 4.9 | GO:0016589 | NURF complex(GO:0016589) |
| 0.7 | 14.5 | GO:0035098 | ESC/E(Z) complex(GO:0035098) |
| 0.6 | 1.8 | GO:0048269 | methionine adenosyltransferase complex(GO:0048269) |
| 0.6 | 10.3 | GO:0005852 | eukaryotic translation initiation factor 3 complex(GO:0005852) |
| 0.5 | 7.8 | GO:0032059 | bleb(GO:0032059) |
| 0.5 | 2.4 | GO:1990589 | ATF4-CREB1 transcription factor complex(GO:1990589) |
| 0.5 | 4.2 | GO:0097452 | GAIT complex(GO:0097452) |
| 0.5 | 2.8 | GO:0070022 | transforming growth factor beta receptor homodimeric complex(GO:0070022) |
| 0.4 | 4.4 | GO:0034098 | VCP-NPL4-UFD1 AAA ATPase complex(GO:0034098) |
| 0.4 | 9.2 | GO:0032433 | filopodium tip(GO:0032433) |
| 0.4 | 2.6 | GO:0020018 | ciliary pocket(GO:0020016) ciliary pocket membrane(GO:0020018) |
| 0.4 | 4.3 | GO:0035068 | micro-ribonucleoprotein complex(GO:0035068) |
| 0.4 | 40.1 | GO:0005643 | nuclear pore(GO:0005643) |
| 0.4 | 4.7 | GO:0045254 | pyruvate dehydrogenase complex(GO:0045254) |
| 0.4 | 3.9 | GO:0070852 | cell body fiber(GO:0070852) |
| 0.4 | 8.3 | GO:0046930 | pore complex(GO:0046930) |
| 0.3 | 3.5 | GO:0097197 | tetraspanin-enriched microdomain(GO:0097197) |
| 0.3 | 5.0 | GO:0005675 | holo TFIIH complex(GO:0005675) |
| 0.3 | 1.3 | GO:0002945 | cyclin K-CDK13 complex(GO:0002945) |
| 0.3 | 16.7 | GO:0019005 | SCF ubiquitin ligase complex(GO:0019005) |
| 0.3 | 1.2 | GO:1990075 | periciliary membrane compartment(GO:1990075) |
| 0.3 | 28.6 | GO:0005811 | lipid particle(GO:0005811) |
| 0.3 | 3.8 | GO:0000124 | SAGA complex(GO:0000124) |
| 0.3 | 2.4 | GO:0031332 | RISC complex(GO:0016442) RNAi effector complex(GO:0031332) chromatoid body(GO:0033391) |
| 0.3 | 12.6 | GO:0008180 | COP9 signalosome(GO:0008180) |
| 0.3 | 5.1 | GO:0071141 | SMAD protein complex(GO:0071141) |
| 0.2 | 1.2 | GO:0005797 | Golgi medial cisterna(GO:0005797) |
| 0.2 | 0.7 | GO:0032116 | SMC loading complex(GO:0032116) |
| 0.2 | 4.6 | GO:0030014 | CCR4-NOT complex(GO:0030014) |
| 0.2 | 2.9 | GO:1990907 | beta-catenin-TCF complex(GO:1990907) |
| 0.2 | 24.6 | GO:0070821 | tertiary granule membrane(GO:0070821) |
| 0.2 | 4.4 | GO:0032591 | dendritic spine membrane(GO:0032591) |
| 0.2 | 5.7 | GO:0031233 | intrinsic component of external side of plasma membrane(GO:0031233) |
| 0.2 | 3.9 | GO:0000242 | pericentriolar material(GO:0000242) |
| 0.2 | 0.6 | GO:0005588 | collagen type V trimer(GO:0005588) |
| 0.2 | 14.7 | GO:0032580 | Golgi cisterna membrane(GO:0032580) |
| 0.2 | 2.1 | GO:0036057 | filtration diaphragm(GO:0036056) slit diaphragm(GO:0036057) |
| 0.2 | 9.8 | GO:1990391 | DNA repair complex(GO:1990391) |
| 0.2 | 1.3 | GO:0097504 | Gemini of coiled bodies(GO:0097504) |
| 0.2 | 10.4 | GO:0032592 | integral component of mitochondrial membrane(GO:0032592) |
| 0.1 | 1.8 | GO:0032045 | guanyl-nucleotide exchange factor complex(GO:0032045) |
| 0.1 | 8.0 | GO:0005637 | nuclear inner membrane(GO:0005637) |
| 0.1 | 2.6 | GO:0030122 | AP-2 adaptor complex(GO:0030122) |
| 0.1 | 4.4 | GO:0031258 | lamellipodium membrane(GO:0031258) |
| 0.1 | 12.4 | GO:0031902 | late endosome membrane(GO:0031902) |
| 0.1 | 9.8 | GO:0000118 | histone deacetylase complex(GO:0000118) |
| 0.1 | 0.7 | GO:0044326 | dendritic spine neck(GO:0044326) |
| 0.1 | 4.2 | GO:0009295 | nucleoid(GO:0009295) mitochondrial nucleoid(GO:0042645) |
| 0.1 | 1.8 | GO:0001527 | microfibril(GO:0001527) fibril(GO:0043205) |
| 0.1 | 7.7 | GO:0000502 | proteasome complex(GO:0000502) |
| 0.1 | 0.6 | GO:0097524 | sperm plasma membrane(GO:0097524) |
| 0.1 | 12.6 | GO:0101002 | ficolin-1-rich granule(GO:0101002) ficolin-1-rich granule lumen(GO:1904813) |
| 0.1 | 1.5 | GO:0005666 | DNA-directed RNA polymerase III complex(GO:0005666) |
| 0.1 | 2.9 | GO:0000307 | cyclin-dependent protein kinase holoenzyme complex(GO:0000307) |
| 0.1 | 8.2 | GO:0005884 | actin filament(GO:0005884) |
| 0.1 | 1.3 | GO:0031231 | integral component of peroxisomal membrane(GO:0005779) intrinsic component of peroxisomal membrane(GO:0031231) |
| 0.1 | 5.7 | GO:0035578 | azurophil granule lumen(GO:0035578) |
| 0.1 | 2.2 | GO:1902711 | GABA-A receptor complex(GO:1902711) |
| 0.1 | 3.4 | GO:0030670 | phagocytic vesicle membrane(GO:0030670) |
| 0.0 | 0.3 | GO:0005955 | calcineurin complex(GO:0005955) |
| 0.0 | 0.6 | GO:1990909 | Wnt signalosome(GO:1990909) |
| 0.0 | 0.2 | GO:0097136 | Bcl-2 family protein complex(GO:0097136) |
| 0.0 | 1.4 | GO:0034361 | very-low-density lipoprotein particle(GO:0034361) triglyceride-rich lipoprotein particle(GO:0034385) |
| 0.0 | 11.9 | GO:0031965 | nuclear membrane(GO:0031965) |
| 0.0 | 0.8 | GO:0005719 | nuclear euchromatin(GO:0005719) |
| 0.0 | 3.3 | GO:0000932 | cytoplasmic mRNA processing body(GO:0000932) |
| 0.0 | 1.7 | GO:0010494 | cytoplasmic stress granule(GO:0010494) |
| 0.0 | 0.1 | GO:0005785 | signal recognition particle receptor complex(GO:0005785) |
| 0.0 | 4.1 | GO:0072562 | blood microparticle(GO:0072562) |
| 0.0 | 0.3 | GO:0042587 | glycogen granule(GO:0042587) |
| 0.0 | 1.7 | GO:0005881 | cytoplasmic microtubule(GO:0005881) |
| 0.0 | 0.4 | GO:0005662 | DNA replication factor A complex(GO:0005662) |
| 0.0 | 7.5 | GO:0009897 | external side of plasma membrane(GO:0009897) |
| 0.0 | 0.5 | GO:0044295 | axonal growth cone(GO:0044295) |
| 0.0 | 6.2 | GO:0098852 | lysosomal membrane(GO:0005765) lytic vacuole membrane(GO:0098852) |
| 0.0 | 1.0 | GO:0031907 | peroxisomal matrix(GO:0005782) microbody lumen(GO:0031907) |
| 0.0 | 0.7 | GO:0035579 | specific granule membrane(GO:0035579) |
| 0.0 | 3.4 | GO:0005819 | spindle(GO:0005819) |
| 0.0 | 0.1 | GO:0097550 | transcriptional preinitiation complex(GO:0097550) |
Gene overrepresentation in molecular function category:
| Log-likelihood per target | Total log-likelihood | Term | Description |
|---|---|---|---|
| 7.1 | 21.4 | GO:0051717 | inositol-1,3,4,5-tetrakisphosphate 3-phosphatase activity(GO:0051717) |
| 4.7 | 14.0 | GO:0050510 | N-acetylgalactosaminyl-proteoglycan 3-beta-glucuronosyltransferase activity(GO:0050510) |
| 3.0 | 17.9 | GO:0061575 | cyclin-dependent protein serine/threonine kinase activator activity(GO:0061575) |
| 2.6 | 10.3 | GO:0043273 | CTPase activity(GO:0043273) |
| 1.8 | 9.0 | GO:0004677 | DNA-dependent protein kinase activity(GO:0004677) |
| 1.7 | 8.7 | GO:0061649 | ubiquitinated histone binding(GO:0061649) |
| 1.4 | 18.6 | GO:0042975 | peroxisome proliferator activated receptor binding(GO:0042975) |
| 1.3 | 4.0 | GO:1904455 | ubiquitin-specific protease activity involved in negative regulation of ERAD pathway(GO:1904455) |
| 1.3 | 7.7 | GO:0047134 | protein-disulfide reductase activity(GO:0047134) |
| 1.2 | 3.7 | GO:0004720 | protein-lysine 6-oxidase activity(GO:0004720) |
| 1.2 | 4.7 | GO:0004739 | pyruvate dehydrogenase (acetyl-transferring) activity(GO:0004739) |
| 1.2 | 5.8 | GO:0047280 | nicotinamide phosphoribosyltransferase activity(GO:0047280) |
| 1.1 | 50.7 | GO:0008139 | nuclear localization sequence binding(GO:0008139) |
| 1.0 | 3.1 | GO:0050501 | hyaluronan synthase activity(GO:0050501) |
| 1.0 | 13.8 | GO:0004596 | peptide alpha-N-acetyltransferase activity(GO:0004596) |
| 0.9 | 17.4 | GO:0019706 | protein-cysteine S-palmitoyltransferase activity(GO:0019706) protein-cysteine S-acyltransferase activity(GO:0019707) |
| 0.9 | 5.3 | GO:0061665 | SUMO ligase activity(GO:0061665) |
| 0.9 | 8.7 | GO:0044388 | small protein activating enzyme binding(GO:0044388) |
| 0.9 | 5.2 | GO:0004699 | calcium-independent protein kinase C activity(GO:0004699) |
| 0.8 | 6.1 | GO:0015288 | porin activity(GO:0015288) |
| 0.7 | 5.2 | GO:0008079 | translation release factor activity(GO:0003747) translation termination factor activity(GO:0008079) |
| 0.7 | 4.4 | GO:0004468 | lysine N-acetyltransferase activity, acting on acetyl phosphate as donor(GO:0004468) |
| 0.7 | 5.2 | GO:0050815 | phosphoserine binding(GO:0050815) |
| 0.7 | 5.9 | GO:0071933 | Arp2/3 complex binding(GO:0071933) |
| 0.7 | 5.8 | GO:0070699 | type II activin receptor binding(GO:0070699) |
| 0.7 | 13.7 | GO:0097602 | cullin family protein binding(GO:0097602) |
| 0.7 | 6.3 | GO:0089720 | caspase binding(GO:0089720) |
| 0.7 | 3.4 | GO:0005294 | neutral L-amino acid secondary active transmembrane transporter activity(GO:0005294) |
| 0.6 | 1.9 | GO:0033300 | dehydroascorbic acid transporter activity(GO:0033300) |
| 0.6 | 8.5 | GO:0004653 | polypeptide N-acetylgalactosaminyltransferase activity(GO:0004653) |
| 0.6 | 3.4 | GO:0008420 | CTD phosphatase activity(GO:0008420) |
| 0.6 | 8.3 | GO:0008190 | eukaryotic initiation factor 4E binding(GO:0008190) |
| 0.5 | 8.5 | GO:0043522 | leucine zipper domain binding(GO:0043522) |
| 0.5 | 9.4 | GO:0035497 | cAMP response element binding(GO:0035497) |
| 0.5 | 10.7 | GO:0070878 | primary miRNA binding(GO:0070878) |
| 0.5 | 19.8 | GO:0051059 | NF-kappaB binding(GO:0051059) |
| 0.5 | 2.9 | GO:0008142 | oxysterol binding(GO:0008142) |
| 0.5 | 1.4 | GO:0034189 | very-low-density lipoprotein particle binding(GO:0034189) |
| 0.5 | 2.8 | GO:0043024 | ribosomal small subunit binding(GO:0043024) |
| 0.5 | 6.5 | GO:0017034 | Rap guanyl-nucleotide exchange factor activity(GO:0017034) |
| 0.5 | 2.3 | GO:0016936 | galactoside binding(GO:0016936) |
| 0.5 | 3.7 | GO:0015165 | pyrimidine nucleotide-sugar transmembrane transporter activity(GO:0015165) |
| 0.4 | 36.1 | GO:0019003 | GDP binding(GO:0019003) |
| 0.4 | 19.1 | GO:0061650 | ubiquitin conjugating enzyme activity(GO:0061631) ubiquitin-like protein conjugating enzyme activity(GO:0061650) |
| 0.4 | 2.4 | GO:0004305 | ethanolamine kinase activity(GO:0004305) |
| 0.4 | 3.8 | GO:0001075 | transcription factor activity, RNA polymerase II core promoter sequence-specific binding involved in preinitiation complex assembly(GO:0001075) |
| 0.4 | 7.8 | GO:0017049 | GTP-Rho binding(GO:0017049) |
| 0.4 | 3.3 | GO:0035242 | protein-arginine omega-N asymmetric methyltransferase activity(GO:0035242) |
| 0.4 | 5.0 | GO:0034450 | ubiquitin-ubiquitin ligase activity(GO:0034450) |
| 0.4 | 1.8 | GO:0050436 | microfibril binding(GO:0050436) |
| 0.3 | 5.0 | GO:0031489 | myosin V binding(GO:0031489) |
| 0.3 | 10.5 | GO:0001671 | ATPase activator activity(GO:0001671) |
| 0.3 | 3.9 | GO:0005005 | transmembrane-ephrin receptor activity(GO:0005005) |
| 0.3 | 1.0 | GO:0052853 | (S)-2-hydroxy-acid oxidase activity(GO:0003973) very-long-chain-(S)-2-hydroxy-acid oxidase activity(GO:0052852) long-chain-(S)-2-hydroxy-long-chain-acid oxidase activity(GO:0052853) medium-chain-(S)-2-hydroxy-acid oxidase activity(GO:0052854) |
| 0.3 | 1.2 | GO:0098770 | FBXO family protein binding(GO:0098770) |
| 0.3 | 8.6 | GO:0005283 | sodium:amino acid symporter activity(GO:0005283) |
| 0.3 | 9.2 | GO:0008301 | DNA binding, bending(GO:0008301) |
| 0.3 | 8.9 | GO:0080025 | phosphatidylinositol-3,5-bisphosphate binding(GO:0080025) |
| 0.3 | 7.9 | GO:0003841 | 1-acylglycerol-3-phosphate O-acyltransferase activity(GO:0003841) |
| 0.3 | 0.9 | GO:0015234 | thiamine transmembrane transporter activity(GO:0015234) thiamine uptake transmembrane transporter activity(GO:0015403) |
| 0.3 | 19.7 | GO:0003743 | translation initiation factor activity(GO:0003743) |
| 0.3 | 5.2 | GO:0031996 | thioesterase binding(GO:0031996) |
| 0.3 | 10.0 | GO:0005123 | death receptor binding(GO:0005123) |
| 0.3 | 16.9 | GO:0004407 | histone deacetylase activity(GO:0004407) |
| 0.3 | 3.9 | GO:0005003 | ephrin receptor activity(GO:0005003) |
| 0.3 | 2.2 | GO:0043426 | MRF binding(GO:0043426) |
| 0.3 | 2.7 | GO:0043184 | vascular endothelial growth factor receptor 2 binding(GO:0043184) |
| 0.3 | 8.6 | GO:0000993 | RNA polymerase II core binding(GO:0000993) |
| 0.3 | 4.2 | GO:0008327 | methyl-CpG binding(GO:0008327) |
| 0.3 | 3.9 | GO:0017056 | structural constituent of nuclear pore(GO:0017056) |
| 0.3 | 9.4 | GO:0030296 | protein tyrosine kinase activator activity(GO:0030296) |
| 0.3 | 1.8 | GO:1904929 | coreceptor activity involved in Wnt signaling pathway, planar cell polarity pathway(GO:1904929) |
| 0.3 | 1.8 | GO:0001517 | N-acetylglucosamine 6-O-sulfotransferase activity(GO:0001517) |
| 0.2 | 3.2 | GO:0005381 | iron ion transmembrane transporter activity(GO:0005381) |
| 0.2 | 9.7 | GO:0008536 | Ran GTPase binding(GO:0008536) |
| 0.2 | 7.5 | GO:0004707 | MAP kinase activity(GO:0004707) |
| 0.2 | 0.9 | GO:0050473 | arachidonate 15-lipoxygenase activity(GO:0050473) |
| 0.2 | 2.1 | GO:0015279 | store-operated calcium channel activity(GO:0015279) |
| 0.2 | 2.6 | GO:0008525 | phosphatidylcholine transporter activity(GO:0008525) |
| 0.2 | 3.4 | GO:0055106 | ubiquitin-protein transferase regulator activity(GO:0055106) |
| 0.2 | 4.0 | GO:0070410 | co-SMAD binding(GO:0070410) |
| 0.2 | 0.8 | GO:0004687 | myosin light chain kinase activity(GO:0004687) |
| 0.2 | 4.7 | GO:0070577 | lysine-acetylated histone binding(GO:0070577) |
| 0.2 | 7.8 | GO:0030159 | receptor signaling complex scaffold activity(GO:0030159) |
| 0.2 | 4.7 | GO:0102391 | decanoate--CoA ligase activity(GO:0102391) |
| 0.2 | 12.8 | GO:0008235 | metalloexopeptidase activity(GO:0008235) |
| 0.2 | 0.5 | GO:0004923 | leukemia inhibitory factor receptor activity(GO:0004923) |
| 0.2 | 1.7 | GO:0015924 | mannosyl-oligosaccharide mannosidase activity(GO:0015924) |
| 0.2 | 7.4 | GO:0051879 | Hsp90 protein binding(GO:0051879) |
| 0.2 | 0.8 | GO:0001010 | transcription factor activity, sequence-specific DNA binding transcription factor recruiting(GO:0001010) |
| 0.2 | 2.8 | GO:0034452 | dynactin binding(GO:0034452) |
| 0.2 | 3.9 | GO:0070628 | proteasome binding(GO:0070628) |
| 0.2 | 29.1 | GO:0001046 | core promoter sequence-specific DNA binding(GO:0001046) |
| 0.2 | 5.4 | GO:0008143 | poly(A) binding(GO:0008143) |
| 0.2 | 1.4 | GO:0015038 | glutathione disulfide oxidoreductase activity(GO:0015038) |
| 0.1 | 0.7 | GO:0036033 | mediator complex binding(GO:0036033) |
| 0.1 | 11.0 | GO:0015171 | amino acid transmembrane transporter activity(GO:0015171) |
| 0.1 | 3.4 | GO:0004659 | prenyltransferase activity(GO:0004659) |
| 0.1 | 1.8 | GO:0004726 | non-membrane spanning protein tyrosine phosphatase activity(GO:0004726) |
| 0.1 | 2.0 | GO:0017017 | MAP kinase tyrosine/serine/threonine phosphatase activity(GO:0017017) |
| 0.1 | 2.8 | GO:0035615 | clathrin adaptor activity(GO:0035615) endocytic adaptor activity(GO:0098748) |
| 0.1 | 3.3 | GO:0019870 | potassium channel inhibitor activity(GO:0019870) |
| 0.1 | 2.2 | GO:0008503 | benzodiazepine receptor activity(GO:0008503) |
| 0.1 | 1.3 | GO:1990247 | N6-methyladenosine-containing RNA binding(GO:1990247) |
| 0.1 | 2.4 | GO:0035256 | G-protein coupled glutamate receptor binding(GO:0035256) |
| 0.1 | 2.4 | GO:0051400 | BH domain binding(GO:0051400) |
| 0.1 | 7.1 | GO:0005080 | protein kinase C binding(GO:0005080) |
| 0.1 | 3.9 | GO:0003950 | NAD+ ADP-ribosyltransferase activity(GO:0003950) |
| 0.1 | 29.0 | GO:0051015 | actin filament binding(GO:0051015) |
| 0.1 | 4.9 | GO:0031491 | nucleosome binding(GO:0031491) |
| 0.1 | 16.4 | GO:0047485 | protein N-terminus binding(GO:0047485) |
| 0.1 | 4.7 | GO:0008138 | protein tyrosine/serine/threonine phosphatase activity(GO:0008138) |
| 0.1 | 1.1 | GO:0016286 | small conductance calcium-activated potassium channel activity(GO:0016286) |
| 0.1 | 1.7 | GO:0042043 | neurexin family protein binding(GO:0042043) |
| 0.1 | 1.3 | GO:0031369 | translation initiation factor binding(GO:0031369) |
| 0.1 | 0.4 | GO:0008467 | [heparan sulfate]-glucosamine 3-sulfotransferase 1 activity(GO:0008467) |
| 0.1 | 2.1 | GO:0070182 | DNA polymerase binding(GO:0070182) |
| 0.1 | 14.8 | GO:0003697 | single-stranded DNA binding(GO:0003697) |
| 0.1 | 1.3 | GO:0008353 | RNA polymerase II carboxy-terminal domain kinase activity(GO:0008353) |
| 0.1 | 0.4 | GO:0016524 | latrotoxin receptor activity(GO:0016524) |
| 0.1 | 2.5 | GO:0051721 | protein phosphatase 2A binding(GO:0051721) |
| 0.1 | 3.2 | GO:0032452 | histone demethylase activity(GO:0032452) |
| 0.1 | 10.7 | GO:0001078 | transcriptional repressor activity, RNA polymerase II core promoter proximal region sequence-specific binding(GO:0001078) |
| 0.1 | 1.1 | GO:0005112 | Notch binding(GO:0005112) |
| 0.1 | 0.7 | GO:0001135 | transcription factor activity, RNA polymerase II transcription factor recruiting(GO:0001135) |
| 0.1 | 29.2 | GO:0045296 | cadherin binding(GO:0045296) |
| 0.1 | 7.8 | GO:0030165 | PDZ domain binding(GO:0030165) |
| 0.1 | 1.1 | GO:0042800 | histone methyltransferase activity (H3-K4 specific)(GO:0042800) |
| 0.1 | 13.0 | GO:0003714 | transcription corepressor activity(GO:0003714) |
| 0.1 | 3.3 | GO:0004536 | deoxyribonuclease activity(GO:0004536) |
| 0.1 | 7.8 | GO:0017124 | SH3 domain binding(GO:0017124) |
| 0.1 | 0.2 | GO:0052798 | beta-galactoside alpha-2,3-sialyltransferase activity(GO:0052798) |
| 0.0 | 2.4 | GO:0005544 | calcium-dependent phospholipid binding(GO:0005544) |
| 0.0 | 0.5 | GO:0055056 | D-glucose transmembrane transporter activity(GO:0055056) |
| 0.0 | 0.2 | GO:0016404 | 15-hydroxyprostaglandin dehydrogenase (NAD+) activity(GO:0016404) |
| 0.0 | 0.6 | GO:0047372 | acylglycerol lipase activity(GO:0047372) |
| 0.0 | 2.4 | GO:0008276 | protein methyltransferase activity(GO:0008276) |
| 0.0 | 1.5 | GO:0034062 | DNA-directed RNA polymerase activity(GO:0003899) RNA polymerase activity(GO:0034062) |
| 0.0 | 0.6 | GO:0016799 | hydrolase activity, hydrolyzing N-glycosyl compounds(GO:0016799) |
| 0.0 | 1.2 | GO:0042056 | chemoattractant activity(GO:0042056) |
| 0.0 | 5.4 | GO:0004721 | phosphoprotein phosphatase activity(GO:0004721) |
| 0.0 | 0.2 | GO:0052650 | NADP-retinol dehydrogenase activity(GO:0052650) |
| 0.0 | 0.6 | GO:0043014 | alpha-tubulin binding(GO:0043014) |
| 0.0 | 1.5 | GO:0016620 | oxidoreductase activity, acting on the aldehyde or oxo group of donors, NAD or NADP as acceptor(GO:0016620) |
| 0.0 | 1.3 | GO:0017112 | Rab guanyl-nucleotide exchange factor activity(GO:0017112) |
| 0.0 | 0.1 | GO:0061676 | importin-alpha family protein binding(GO:0061676) |
| 0.0 | 6.6 | GO:0031625 | ubiquitin protein ligase binding(GO:0031625) |
| 0.0 | 0.9 | GO:0005540 | hyaluronic acid binding(GO:0005540) |
| 0.0 | 1.0 | GO:0005484 | SNAP receptor activity(GO:0005484) |
| 0.0 | 2.5 | GO:0005089 | Rho guanyl-nucleotide exchange factor activity(GO:0005089) |
| 0.0 | 0.7 | GO:0015347 | sodium-independent organic anion transmembrane transporter activity(GO:0015347) |
| 0.0 | 0.8 | GO:0017022 | myosin binding(GO:0017022) |
| 0.0 | 5.5 | GO:0005525 | GTP binding(GO:0005525) |
| 0.0 | 0.7 | GO:0098811 | transcriptional activator activity, RNA polymerase II transcription factor binding(GO:0001190) transcriptional repressor activity, RNA polymerase II activating transcription factor binding(GO:0098811) |
| 0.0 | 0.8 | GO:0048306 | calcium-dependent protein binding(GO:0048306) |
| 0.0 | 0.7 | GO:0004198 | calcium-dependent cysteine-type endopeptidase activity(GO:0004198) |
| 0.0 | 0.5 | GO:0005154 | epidermal growth factor receptor binding(GO:0005154) |
Gene overrepresentation in curated gene sets: canonical pathways category:
| Log-likelihood per target | Total log-likelihood | Term | Description |
|---|---|---|---|
| 0.9 | 37.7 | PID SMAD2 3PATHWAY | Regulation of cytoplasmic and nuclear SMAD2/3 signaling |
| 0.6 | 46.4 | SIG CHEMOTAXIS | Genes related to chemotaxis |
| 0.6 | 12.2 | SA PROGRAMMED CELL DEATH | Programmed cell death, or apoptosis, eliminates damaged or unneeded cells. |
| 0.5 | 65.5 | PID MYC ACTIV PATHWAY | Validated targets of C-MYC transcriptional activation |
| 0.5 | 8.2 | PID TCR RAS PATHWAY | Ras signaling in the CD4+ TCR pathway |
| 0.4 | 16.7 | PID NECTIN PATHWAY | Nectin adhesion pathway |
| 0.4 | 8.7 | ST G ALPHA S PATHWAY | G alpha s Pathway |
| 0.4 | 10.4 | PID ARF6 DOWNSTREAM PATHWAY | Arf6 downstream pathway |
| 0.3 | 4.4 | PID EPHA2 FWD PATHWAY | EPHA2 forward signaling |
| 0.3 | 5.1 | PID ALK2 PATHWAY | ALK2 signaling events |
| 0.2 | 2.3 | ST JAK STAT PATHWAY | Jak-STAT Pathway |
| 0.2 | 8.3 | PID IL2 PI3K PATHWAY | IL2 signaling events mediated by PI3K |
| 0.2 | 12.7 | PID CERAMIDE PATHWAY | Ceramide signaling pathway |
| 0.2 | 15.1 | PID NOTCH PATHWAY | Notch signaling pathway |
| 0.2 | 7.5 | PID RETINOIC ACID PATHWAY | Retinoic acid receptors-mediated signaling |
| 0.2 | 3.4 | PID P38 GAMMA DELTA PATHWAY | Signaling mediated by p38-gamma and p38-delta |
| 0.2 | 10.1 | PID ARF6 PATHWAY | Arf6 signaling events |
| 0.2 | 3.2 | PID CIRCADIAN PATHWAY | Circadian rhythm pathway |
| 0.2 | 10.8 | PID CASPASE PATHWAY | Caspase cascade in apoptosis |
| 0.2 | 4.7 | PID PRL SIGNALING EVENTS PATHWAY | Signaling events mediated by PRL |
| 0.1 | 4.0 | PID ALK1 PATHWAY | ALK1 signaling events |
| 0.1 | 9.3 | PID ILK PATHWAY | Integrin-linked kinase signaling |
| 0.1 | 3.5 | PID EPHA FWDPATHWAY | EPHA forward signaling |
| 0.1 | 4.2 | PID UPA UPAR PATHWAY | Urokinase-type plasminogen activator (uPA) and uPAR-mediated signaling |
| 0.1 | 2.1 | PID EPO PATHWAY | EPO signaling pathway |
| 0.1 | 4.1 | PID MET PATHWAY | Signaling events mediated by Hepatocyte Growth Factor Receptor (c-Met) |
| 0.1 | 5.1 | PID TAP63 PATHWAY | Validated transcriptional targets of TAp63 isoforms |
| 0.1 | 16.4 | PID P53 DOWNSTREAM PATHWAY | Direct p53 effectors |
| 0.1 | 1.2 | PID IL2 STAT5 PATHWAY | IL2 signaling events mediated by STAT5 |
| 0.1 | 2.1 | PID IL4 2PATHWAY | IL4-mediated signaling events |
| 0.1 | 1.1 | SA B CELL RECEPTOR COMPLEXES | Antigen binding to B cell receptors activates protein tyrosine kinases, such as the Src family, which ultimate activate MAP kinases. |
| 0.1 | 2.7 | PID RAC1 PATHWAY | RAC1 signaling pathway |
| 0.1 | 2.8 | PID CDC42 REG PATHWAY | Regulation of CDC42 activity |
| 0.1 | 3.8 | ST FAS SIGNALING PATHWAY | Fas Signaling Pathway |
| 0.1 | 3.6 | PID TELOMERASE PATHWAY | Regulation of Telomerase |
| 0.0 | 3.4 | PID HIF1 TFPATHWAY | HIF-1-alpha transcription factor network |
| 0.0 | 0.5 | PID CXCR4 PATHWAY | CXCR4-mediated signaling events |
| 0.0 | 0.9 | PID S1P S1P1 PATHWAY | S1P1 pathway |
| 0.0 | 0.8 | PID PI3KCI AKT PATHWAY | Class I PI3K signaling events mediated by Akt |
| 0.0 | 9.5 | NABA ECM REGULATORS | Genes encoding enzymes and their regulators involved in the remodeling of the extracellular matrix |
| 0.0 | 1.9 | PID TGFBR PATHWAY | TGF-beta receptor signaling |
| 0.0 | 1.3 | PID E2F PATHWAY | E2F transcription factor network |
| 0.0 | 0.5 | PID RXR VDR PATHWAY | RXR and RAR heterodimerization with other nuclear receptor |
Gene overrepresentation in curated gene sets: REACTOME pathways category:
| Log-likelihood per target | Total log-likelihood | Term | Description |
|---|---|---|---|
| 1.7 | 18.6 | REACTOME APOBEC3G MEDIATED RESISTANCE TO HIV1 INFECTION | Genes involved in APOBEC3G mediated resistance to HIV-1 infection |
| 1.3 | 16.2 | REACTOME NEGATIVE REGULATION OF THE PI3K AKT NETWORK | Genes involved in Negative regulation of the PI3K/AKT network |
| 0.7 | 16.7 | REACTOME P130CAS LINKAGE TO MAPK SIGNALING FOR INTEGRINS | Genes involved in p130Cas linkage to MAPK signaling for integrins |
| 0.7 | 4.6 | REACTOME RECEPTOR LIGAND BINDING INITIATES THE SECOND PROTEOLYTIC CLEAVAGE OF NOTCH RECEPTOR | Genes involved in Receptor-ligand binding initiates the second proteolytic cleavage of Notch receptor |
| 0.6 | 14.0 | REACTOME ADVANCED GLYCOSYLATION ENDPRODUCT RECEPTOR SIGNALING | Genes involved in Advanced glycosylation endproduct receptor signaling |
| 0.6 | 31.4 | REACTOME AMINO ACID TRANSPORT ACROSS THE PLASMA MEMBRANE | Genes involved in Amino acid transport across the plasma membrane |
| 0.6 | 12.8 | REACTOME ACTIVATION OF BH3 ONLY PROTEINS | Genes involved in Activation of BH3-only proteins |
| 0.6 | 11.4 | REACTOME DESTABILIZATION OF MRNA BY TRISTETRAPROLIN TTP | Genes involved in Destabilization of mRNA by Tristetraprolin (TTP) |
| 0.6 | 8.2 | REACTOME RAF MAP KINASE CASCADE | Genes involved in RAF/MAP kinase cascade |
| 0.5 | 14.9 | REACTOME CHONDROITIN SULFATE BIOSYNTHESIS | Genes involved in Chondroitin sulfate biosynthesis |
| 0.5 | 3.2 | REACTOME APOPTOSIS INDUCED DNA FRAGMENTATION | Genes involved in Apoptosis induced DNA fragmentation |
| 0.4 | 46.9 | REACTOME ANTIVIRAL MECHANISM BY IFN STIMULATED GENES | Genes involved in Antiviral mechanism by IFN-stimulated genes |
| 0.4 | 4.9 | REACTOME GLYCOPROTEIN HORMONES | Genes involved in Glycoprotein hormones |
| 0.4 | 9.7 | REACTOME ACTIVATION OF RAC | Genes involved in Activation of Rac |
| 0.4 | 8.4 | REACTOME CHYLOMICRON MEDIATED LIPID TRANSPORT | Genes involved in Chylomicron-mediated lipid transport |
| 0.3 | 9.2 | REACTOME PERK REGULATED GENE EXPRESSION | Genes involved in PERK regulated gene expression |
| 0.3 | 9.8 | REACTOME CIRCADIAN REPRESSION OF EXPRESSION BY REV ERBA | Genes involved in Circadian Repression of Expression by REV-ERBA |
| 0.3 | 4.7 | REACTOME REGULATION OF PYRUVATE DEHYDROGENASE PDH COMPLEX | Genes involved in Regulation of pyruvate dehydrogenase (PDH) complex |
| 0.3 | 8.7 | REACTOME CELL EXTRACELLULAR MATRIX INTERACTIONS | Genes involved in Cell-extracellular matrix interactions |
| 0.2 | 2.1 | REACTOME ELEVATION OF CYTOSOLIC CA2 LEVELS | Genes involved in Elevation of cytosolic Ca2+ levels |
| 0.2 | 4.0 | REACTOME BMAL1 CLOCK NPAS2 ACTIVATES CIRCADIAN EXPRESSION | Genes involved in BMAL1:CLOCK/NPAS2 Activates Circadian Expression |
| 0.2 | 7.3 | REACTOME NEGATIVE REGULATORS OF RIG I MDA5 SIGNALING | Genes involved in Negative regulators of RIG-I/MDA5 signaling |
| 0.2 | 1.7 | REACTOME IRAK1 RECRUITS IKK COMPLEX | Genes involved in IRAK1 recruits IKK complex |
| 0.2 | 10.0 | REACTOME DOWNREGULATION OF SMAD2 3 SMAD4 TRANSCRIPTIONAL ACTIVITY | Genes involved in Downregulation of SMAD2/3:SMAD4 transcriptional activity |
| 0.2 | 4.9 | REACTOME DEPOSITION OF NEW CENPA CONTAINING NUCLEOSOMES AT THE CENTROMERE | Genes involved in Deposition of New CENPA-containing Nucleosomes at the Centromere |
| 0.2 | 7.0 | REACTOME HORMONE SENSITIVE LIPASE HSL MEDIATED TRIACYLGLYCEROL HYDROLYSIS | Genes involved in Hormone-sensitive lipase (HSL)-mediated triacylglycerol hydrolysis |
| 0.2 | 4.1 | REACTOME HS GAG DEGRADATION | Genes involved in HS-GAG degradation |
| 0.2 | 5.0 | REACTOME CYCLIN A B1 ASSOCIATED EVENTS DURING G2 M TRANSITION | Genes involved in Cyclin A/B1 associated events during G2/M transition |
| 0.2 | 8.5 | REACTOME O LINKED GLYCOSYLATION OF MUCINS | Genes involved in O-linked glycosylation of mucins |
| 0.2 | 7.2 | REACTOME PREFOLDIN MEDIATED TRANSFER OF SUBSTRATE TO CCT TRIC | Genes involved in Prefoldin mediated transfer of substrate to CCT/TriC |
| 0.2 | 7.6 | REACTOME CA DEPENDENT EVENTS | Genes involved in Ca-dependent events |
| 0.2 | 3.3 | REACTOME PRE NOTCH TRANSCRIPTION AND TRANSLATION | Genes involved in Pre-NOTCH Transcription and Translation |
| 0.2 | 6.4 | REACTOME SEMA4D INDUCED CELL MIGRATION AND GROWTH CONE COLLAPSE | Genes involved in Sema4D induced cell migration and growth-cone collapse |
| 0.2 | 4.7 | REACTOME SYNTHESIS OF VERY LONG CHAIN FATTY ACYL COAS | Genes involved in Synthesis of very long-chain fatty acyl-CoAs |
| 0.1 | 2.4 | REACTOME SYNTHESIS OF PE | Genes involved in Synthesis of PE |
| 0.1 | 4.2 | REACTOME INFLUENZA VIRAL RNA TRANSCRIPTION AND REPLICATION | Genes involved in Influenza Viral RNA Transcription and Replication |
| 0.1 | 2.3 | REACTOME REGULATION OF IFNG SIGNALING | Genes involved in Regulation of IFNG signaling |
| 0.1 | 2.8 | REACTOME GAP JUNCTION DEGRADATION | Genes involved in Gap junction degradation |
| 0.1 | 1.3 | REACTOME CDC6 ASSOCIATION WITH THE ORC ORIGIN COMPLEX | Genes involved in CDC6 association with the ORC:origin complex |
| 0.1 | 3.3 | REACTOME SIGNALING BY BMP | Genes involved in Signaling by BMP |
| 0.1 | 7.1 | REACTOME MITOCHONDRIAL PROTEIN IMPORT | Genes involved in Mitochondrial Protein Import |
| 0.1 | 3.1 | REACTOME HYALURONAN METABOLISM | Genes involved in Hyaluronan metabolism |
| 0.1 | 8.3 | REACTOME FORMATION OF THE TERNARY COMPLEX AND SUBSEQUENTLY THE 43S COMPLEX | Genes involved in Formation of the ternary complex, and subsequently, the 43S complex |
| 0.1 | 1.9 | REACTOME GLUCOSE TRANSPORT | Genes involved in Glucose transport |
| 0.1 | 0.8 | REACTOME MEMBRANE BINDING AND TARGETTING OF GAG PROTEINS | Genes involved in Membrane binding and targetting of GAG proteins |
| 0.1 | 5.0 | REACTOME REGULATION OF WATER BALANCE BY RENAL AQUAPORINS | Genes involved in Regulation of Water Balance by Renal Aquaporins |
| 0.1 | 2.6 | REACTOME EGFR DOWNREGULATION | Genes involved in EGFR downregulation |
| 0.1 | 3.9 | REACTOME G1 PHASE | Genes involved in G1 Phase |
| 0.1 | 3.7 | REACTOME TRANSPORT OF VITAMINS NUCLEOSIDES AND RELATED MOLECULES | Genes involved in Transport of vitamins, nucleosides, and related molecules |
| 0.1 | 2.2 | REACTOME INTRINSIC PATHWAY FOR APOPTOSIS | Genes involved in Intrinsic Pathway for Apoptosis |
| 0.1 | 2.3 | REACTOME CTNNB1 PHOSPHORYLATION CASCADE | Genes involved in Beta-catenin phosphorylation cascade |
| 0.1 | 5.2 | REACTOME ACTIVATION OF CHAPERONE GENES BY XBP1S | Genes involved in Activation of Chaperone Genes by XBP1(S) |
| 0.1 | 1.5 | REACTOME ASSOCIATION OF TRIC CCT WITH TARGET PROTEINS DURING BIOSYNTHESIS | Genes involved in Association of TriC/CCT with target proteins during biosynthesis |
| 0.1 | 2.2 | REACTOME GABA A RECEPTOR ACTIVATION | Genes involved in GABA A receptor activation |
| 0.1 | 12.3 | REACTOME ANTIGEN PROCESSING UBIQUITINATION PROTEASOME DEGRADATION | Genes involved in Antigen processing: Ubiquitination & Proteasome degradation |
| 0.1 | 2.8 | REACTOME NRAGE SIGNALS DEATH THROUGH JNK | Genes involved in NRAGE signals death through JNK |
| 0.0 | 0.8 | REACTOME SYNTHESIS SECRETION AND DEACYLATION OF GHRELIN | Genes involved in Synthesis, Secretion, and Deacylation of Ghrelin |
| 0.0 | 1.4 | REACTOME SYNTHESIS AND INTERCONVERSION OF NUCLEOTIDE DI AND TRIPHOSPHATES | Genes involved in Synthesis and interconversion of nucleotide di- and triphosphates |
| 0.0 | 5.2 | REACTOME NONSENSE MEDIATED DECAY ENHANCED BY THE EXON JUNCTION COMPLEX | Genes involved in Nonsense Mediated Decay Enhanced by the Exon Junction Complex |
| 0.0 | 0.5 | REACTOME ENDOSOMAL SORTING COMPLEX REQUIRED FOR TRANSPORT ESCRT | Genes involved in Endosomal Sorting Complex Required For Transport (ESCRT) |
| 0.0 | 1.0 | REACTOME PROTEOLYTIC CLEAVAGE OF SNARE COMPLEX PROTEINS | Genes involved in Proteolytic cleavage of SNARE complex proteins |
| 0.0 | 1.1 | REACTOME SIGNALING BY FGFR1 FUSION MUTANTS | Genes involved in Signaling by FGFR1 fusion mutants |
| 0.0 | 4.8 | REACTOME MRNA SPLICING | Genes involved in mRNA Splicing |
| 0.0 | 2.6 | REACTOME GOLGI ASSOCIATED VESICLE BIOGENESIS | Genes involved in Golgi Associated Vesicle Biogenesis |
| 0.0 | 0.9 | REACTOME SIGNALING BY HIPPO | Genes involved in Signaling by Hippo |
| 0.0 | 0.5 | REACTOME HDL MEDIATED LIPID TRANSPORT | Genes involved in HDL-mediated lipid transport |
| 0.0 | 0.9 | REACTOME TRIGLYCERIDE BIOSYNTHESIS | Genes involved in Triglyceride Biosynthesis |
| 0.0 | 1.8 | REACTOME PHASE II CONJUGATION | Genes involved in Phase II conjugation |
| 0.0 | 0.7 | REACTOME CHOLESTEROL BIOSYNTHESIS | Genes involved in Cholesterol biosynthesis |
| 0.0 | 2.0 | REACTOME FACTORS INVOLVED IN MEGAKARYOCYTE DEVELOPMENT AND PLATELET PRODUCTION | Genes involved in Factors involved in megakaryocyte development and platelet production |
| 0.0 | 0.2 | REACTOME PRE NOTCH PROCESSING IN GOLGI | Genes involved in Pre-NOTCH Processing in Golgi |
| 0.0 | 1.0 | REACTOME TRANSCRIPTIONAL REGULATION OF WHITE ADIPOCYTE DIFFERENTIATION | Genes involved in Transcriptional Regulation of White Adipocyte Differentiation |
| 0.0 | 1.2 | REACTOME RESPONSE TO ELEVATED PLATELET CYTOSOLIC CA2 | Genes involved in Response to elevated platelet cytosolic Ca2+ |
| 0.0 | 0.9 | REACTOME PHASE1 FUNCTIONALIZATION OF COMPOUNDS | Genes involved in Phase 1 - Functionalization of compounds |
| 0.0 | 0.2 | REACTOME N GLYCAN TRIMMING IN THE ER AND CALNEXIN CALRETICULIN CYCLE | Genes involved in N-glycan trimming in the ER and Calnexin/Calreticulin cycle |