Project
GNF SymAtlas + NCI-60 cancer cell lines, human (Su, 2004; Ross, 2000)
Navigation
Downloads
Results for UGAAAUG
Z-value: 0.68
Motif logo

miRNA associated with seed UGAAAUG
| Name | miRBASE accession |
|---|---|
|
hsa-miR-203a-3p.2
|
Activity profile of UGAAAUG motif
Sorted Z-values of UGAAAUG motif
Network of associatons between targets according to the STRING database.

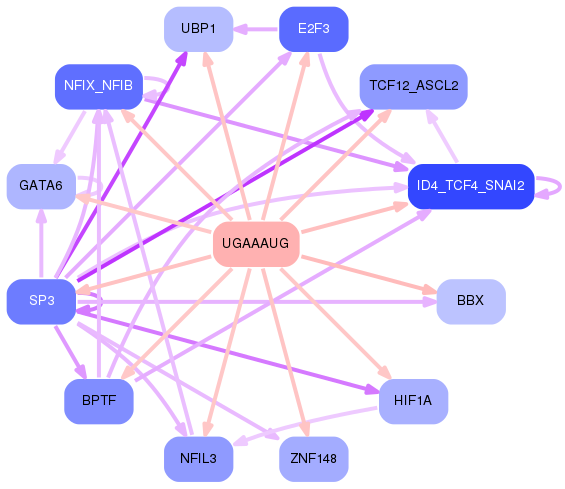
First level regulatory network of UGAAAUG
Gene Ontology Analysis
Gene overrepresentation in biological process category:
| Log-likelihood per target | Total log-likelihood | Term | Description |
|---|---|---|---|
| 2.1 | 6.4 | GO:0006679 | glucosylceramide biosynthetic process(GO:0006679) |
| 1.5 | 6.1 | GO:1901165 | positive regulation of trophoblast cell migration(GO:1901165) |
| 1.5 | 6.0 | GO:0019860 | uracil metabolic process(GO:0019860) |
| 1.4 | 4.3 | GO:0018317 | protein C-linked glycosylation(GO:0018103) peptidyl-tryptophan modification(GO:0018211) protein C-linked glycosylation via tryptophan(GO:0018317) protein C-linked glycosylation via 2'-alpha-mannosyl-L-tryptophan(GO:0018406) |
| 1.4 | 4.2 | GO:1901420 | negative regulation of response to alcohol(GO:1901420) |
| 1.2 | 7.3 | GO:0006543 | glutamine catabolic process(GO:0006543) |
| 1.1 | 5.5 | GO:0019348 | dolichol metabolic process(GO:0019348) |
| 1.1 | 4.3 | GO:0021823 | cerebral cortex tangential migration using cell-cell interactions(GO:0021823) postnatal olfactory bulb interneuron migration(GO:0021827) chemorepulsion involved in postnatal olfactory bulb interneuron migration(GO:0021836) regulation of negative chemotaxis(GO:0050923) |
| 1.1 | 3.2 | GO:0090149 | synaptic vesicle recycling via endosome(GO:0036466) mitochondrial membrane fission(GO:0090149) |
| 1.1 | 3.2 | GO:0060278 | regulation of ovulation(GO:0060278) positive regulation of ovulation(GO:0060279) |
| 1.0 | 2.9 | GO:0060435 | male genitalia morphogenesis(GO:0048808) bronchiole development(GO:0060435) submandibular salivary gland formation(GO:0060661) white fat cell proliferation(GO:0070343) regulation of white fat cell proliferation(GO:0070350) hair follicle cell proliferation(GO:0071335) regulation of hair follicle cell proliferation(GO:0071336) positive regulation of hair follicle cell proliferation(GO:0071338) male anatomical structure morphogenesis(GO:0090598) |
| 0.9 | 2.7 | GO:0008611 | ether lipid biosynthetic process(GO:0008611) glycerol ether biosynthetic process(GO:0046504) ether biosynthetic process(GO:1901503) |
| 0.9 | 3.4 | GO:0006169 | adenosine salvage(GO:0006169) dATP biosynthetic process(GO:0006175) purine deoxyribonucleoside triphosphate biosynthetic process(GO:0009216) |
| 0.8 | 3.1 | GO:0030047 | actin modification(GO:0030047) |
| 0.7 | 9.7 | GO:0044387 | negative regulation of protein kinase activity by regulation of protein phosphorylation(GO:0044387) |
| 0.7 | 2.8 | GO:1903371 | regulation of endoplasmic reticulum tubular network organization(GO:1903371) |
| 0.7 | 5.0 | GO:0060701 | negative regulation of ribonuclease activity(GO:0060701) negative regulation of endoribonuclease activity(GO:0060702) |
| 0.7 | 2.1 | GO:2000616 | negative regulation of histone H3-K9 acetylation(GO:2000616) |
| 0.7 | 2.0 | GO:2000298 | regulation of Rho-dependent protein serine/threonine kinase activity(GO:2000298) |
| 0.6 | 2.5 | GO:0048205 | COPI-coated vesicle budding(GO:0035964) Golgi transport vesicle coating(GO:0048200) COPI coating of Golgi vesicle(GO:0048205) |
| 0.6 | 1.9 | GO:0061445 | endocardial cell fate commitment(GO:0060957) endocardial cushion cell fate commitment(GO:0061445) |
| 0.6 | 7.4 | GO:0090435 | protein localization to nuclear envelope(GO:0090435) |
| 0.6 | 3.0 | GO:0070966 | nuclear-transcribed mRNA catabolic process, no-go decay(GO:0070966) |
| 0.6 | 2.2 | GO:1900126 | negative regulation of hyaluronan biosynthetic process(GO:1900126) |
| 0.6 | 2.8 | GO:1903385 | regulation of homophilic cell adhesion(GO:1903385) |
| 0.5 | 4.4 | GO:2000210 | positive regulation of anoikis(GO:2000210) |
| 0.5 | 3.3 | GO:0033133 | positive regulation of glucokinase activity(GO:0033133) |
| 0.5 | 2.1 | GO:0046833 | positive regulation of RNA export from nucleus(GO:0046833) |
| 0.5 | 4.2 | GO:2000483 | negative regulation of interleukin-8 secretion(GO:2000483) |
| 0.5 | 3.7 | GO:0048194 | Golgi vesicle budding(GO:0048194) |
| 0.5 | 2.6 | GO:0006167 | 5-phosphoribose 1-diphosphate biosynthetic process(GO:0006015) AMP biosynthetic process(GO:0006167) 5-phosphoribose 1-diphosphate metabolic process(GO:0046391) |
| 0.5 | 1.6 | GO:1904529 | actin filament branching(GO:0090135) negative regulation of phospholipase C activity(GO:1900275) regulation of actin filament binding(GO:1904529) regulation of actin binding(GO:1904616) |
| 0.5 | 2.0 | GO:0097327 | response to antineoplastic agent(GO:0097327) |
| 0.5 | 2.0 | GO:0051944 | peptidyl-cysteine methylation(GO:0018125) positive regulation of dopamine uptake involved in synaptic transmission(GO:0051586) positive regulation of catecholamine uptake involved in synaptic transmission(GO:0051944) |
| 0.5 | 7.4 | GO:0006610 | ribosomal protein import into nucleus(GO:0006610) |
| 0.5 | 1.5 | GO:0035026 | leading edge cell differentiation(GO:0035026) |
| 0.5 | 1.5 | GO:0032912 | negative regulation of transforming growth factor beta2 production(GO:0032912) |
| 0.5 | 1.9 | GO:0007206 | phospholipase C-activating G-protein coupled glutamate receptor signaling pathway(GO:0007206) |
| 0.5 | 4.3 | GO:0010994 | regulation of ubiquitin homeostasis(GO:0010993) free ubiquitin chain polymerization(GO:0010994) |
| 0.5 | 4.3 | GO:0010265 | SCF complex assembly(GO:0010265) |
| 0.5 | 3.2 | GO:0070127 | tRNA aminoacylation for mitochondrial protein translation(GO:0070127) |
| 0.4 | 1.3 | GO:1902269 | positive regulation of polyamine transmembrane transport(GO:1902269) |
| 0.4 | 1.6 | GO:1903891 | regulation of ATF6-mediated unfolded protein response(GO:1903891) |
| 0.4 | 2.4 | GO:0071896 | protein localization to adherens junction(GO:0071896) |
| 0.4 | 3.2 | GO:2000825 | positive regulation of androgen receptor activity(GO:2000825) |
| 0.4 | 2.4 | GO:0048254 | snoRNA localization(GO:0048254) |
| 0.4 | 2.4 | GO:0032468 | Golgi calcium ion homeostasis(GO:0032468) |
| 0.4 | 2.7 | GO:0070345 | negative regulation of fat cell proliferation(GO:0070345) |
| 0.4 | 4.3 | GO:0048262 | determination of dorsal/ventral asymmetry(GO:0048262) |
| 0.4 | 2.3 | GO:0034316 | negative regulation of Arp2/3 complex-mediated actin nucleation(GO:0034316) |
| 0.4 | 5.3 | GO:0070934 | CRD-mediated mRNA stabilization(GO:0070934) |
| 0.4 | 2.2 | GO:1903232 | melanosome assembly(GO:1903232) |
| 0.4 | 2.9 | GO:0006659 | phosphatidylserine biosynthetic process(GO:0006659) |
| 0.4 | 1.4 | GO:2000653 | regulation of genetic imprinting(GO:2000653) |
| 0.3 | 3.0 | GO:1904885 | beta-catenin destruction complex assembly(GO:1904885) |
| 0.3 | 1.3 | GO:2001247 | positive regulation of phosphatidylcholine biosynthetic process(GO:2001247) |
| 0.3 | 1.0 | GO:0044828 | negative regulation by host of viral genome replication(GO:0044828) |
| 0.3 | 0.3 | GO:0071676 | negative regulation of mononuclear cell migration(GO:0071676) |
| 0.3 | 4.8 | GO:0070601 | centromeric sister chromatid cohesion(GO:0070601) |
| 0.3 | 2.9 | GO:0045039 | protein import into mitochondrial inner membrane(GO:0045039) |
| 0.3 | 5.1 | GO:0021670 | lateral ventricle development(GO:0021670) |
| 0.3 | 3.1 | GO:0043353 | enucleate erythrocyte differentiation(GO:0043353) embryonic process involved in female pregnancy(GO:0060136) |
| 0.3 | 2.2 | GO:2000546 | positive regulation of cell chemotaxis to fibroblast growth factor(GO:1904849) positive regulation of endothelial cell chemotaxis to fibroblast growth factor(GO:2000546) |
| 0.3 | 4.9 | GO:0035520 | monoubiquitinated protein deubiquitination(GO:0035520) |
| 0.3 | 2.4 | GO:0016557 | peroxisome membrane biogenesis(GO:0016557) |
| 0.3 | 1.2 | GO:0045048 | protein insertion into ER membrane(GO:0045048) |
| 0.3 | 2.0 | GO:0051541 | elastin metabolic process(GO:0051541) |
| 0.3 | 0.9 | GO:0003274 | endocardial cushion fusion(GO:0003274) uterine wall breakdown(GO:0042704) |
| 0.3 | 0.9 | GO:1904528 | regulation of microtubule plus-end binding(GO:1903031) positive regulation of microtubule plus-end binding(GO:1903033) positive regulation of microtubule binding(GO:1904528) |
| 0.3 | 2.0 | GO:0090166 | Golgi disassembly(GO:0090166) |
| 0.3 | 1.9 | GO:0044806 | G-quadruplex DNA unwinding(GO:0044806) |
| 0.3 | 3.8 | GO:0010839 | negative regulation of keratinocyte proliferation(GO:0010839) |
| 0.3 | 2.6 | GO:0000463 | maturation of LSU-rRNA from tricistronic rRNA transcript (SSU-rRNA, 5.8S rRNA, LSU-rRNA)(GO:0000463) |
| 0.3 | 1.8 | GO:0033591 | response to L-ascorbic acid(GO:0033591) |
| 0.2 | 0.9 | GO:0030821 | negative regulation of cyclic nucleotide catabolic process(GO:0030806) negative regulation of cAMP catabolic process(GO:0030821) |
| 0.2 | 1.8 | GO:0048386 | positive regulation of retinoic acid receptor signaling pathway(GO:0048386) |
| 0.2 | 10.1 | GO:0006409 | tRNA export from nucleus(GO:0006409) tRNA-containing ribonucleoprotein complex export from nucleus(GO:0071431) |
| 0.2 | 2.1 | GO:0010040 | response to iron(II) ion(GO:0010040) |
| 0.2 | 1.4 | GO:0006021 | inositol biosynthetic process(GO:0006021) |
| 0.2 | 2.0 | GO:0046459 | short-chain fatty acid metabolic process(GO:0046459) |
| 0.2 | 0.7 | GO:0045062 | extrathymic T cell selection(GO:0045062) |
| 0.2 | 1.1 | GO:0006620 | posttranslational protein targeting to membrane(GO:0006620) |
| 0.2 | 2.4 | GO:0032000 | positive regulation of fatty acid beta-oxidation(GO:0032000) |
| 0.2 | 1.1 | GO:1904059 | regulation of locomotor rhythm(GO:1904059) |
| 0.2 | 1.5 | GO:1902902 | negative regulation of autophagosome assembly(GO:1902902) |
| 0.2 | 2.5 | GO:0035970 | peptidyl-threonine dephosphorylation(GO:0035970) |
| 0.2 | 3.5 | GO:0030497 | fatty acid elongation(GO:0030497) very long-chain fatty acid biosynthetic process(GO:0042761) |
| 0.2 | 2.4 | GO:0048843 | negative regulation of axon extension involved in axon guidance(GO:0048843) |
| 0.2 | 0.2 | GO:0051534 | negative regulation of NFAT protein import into nucleus(GO:0051534) |
| 0.2 | 1.3 | GO:0051549 | positive regulation of keratinocyte migration(GO:0051549) |
| 0.2 | 1.5 | GO:0035694 | mitochondrial protein catabolic process(GO:0035694) |
| 0.2 | 1.7 | GO:0000290 | deadenylation-dependent decapping of nuclear-transcribed mRNA(GO:0000290) |
| 0.2 | 0.5 | GO:0070681 | glutaminyl-tRNAGln biosynthesis via transamidation(GO:0070681) |
| 0.2 | 1.0 | GO:0055064 | chloride ion homeostasis(GO:0055064) |
| 0.2 | 1.0 | GO:0002943 | tRNA dihydrouridine synthesis(GO:0002943) |
| 0.2 | 1.1 | GO:0090481 | pyrimidine nucleotide-sugar transmembrane transport(GO:0090481) |
| 0.2 | 3.8 | GO:0030208 | dermatan sulfate biosynthetic process(GO:0030208) |
| 0.2 | 2.1 | GO:0015074 | DNA integration(GO:0015074) |
| 0.2 | 2.1 | GO:0005981 | regulation of glycogen catabolic process(GO:0005981) |
| 0.2 | 1.4 | GO:0006265 | DNA topological change(GO:0006265) |
| 0.2 | 0.9 | GO:0035965 | cardiolipin acyl-chain remodeling(GO:0035965) |
| 0.1 | 1.2 | GO:0036500 | ATF6-mediated unfolded protein response(GO:0036500) |
| 0.1 | 0.7 | GO:0009098 | branched-chain amino acid biosynthetic process(GO:0009082) leucine biosynthetic process(GO:0009098) valine biosynthetic process(GO:0009099) |
| 0.1 | 0.1 | GO:1901166 | neural crest cell migration involved in autonomic nervous system development(GO:1901166) |
| 0.1 | 1.1 | GO:0015014 | heparan sulfate proteoglycan biosynthetic process, polysaccharide chain biosynthetic process(GO:0015014) |
| 0.1 | 1.5 | GO:0021740 | trigeminal sensory nucleus development(GO:0021730) principal sensory nucleus of trigeminal nerve development(GO:0021740) negative regulation of epithelial cell proliferation involved in lung morphogenesis(GO:2000795) |
| 0.1 | 1.5 | GO:0048251 | elastic fiber assembly(GO:0048251) |
| 0.1 | 0.4 | GO:1901301 | regulation of cargo loading into COPII-coated vesicle(GO:1901301) |
| 0.1 | 1.3 | GO:0036066 | protein O-linked fucosylation(GO:0036066) |
| 0.1 | 2.6 | GO:0006044 | N-acetylglucosamine metabolic process(GO:0006044) |
| 0.1 | 2.1 | GO:0034975 | protein folding in endoplasmic reticulum(GO:0034975) |
| 0.1 | 0.4 | GO:0070634 | transepithelial ammonium transport(GO:0070634) |
| 0.1 | 3.1 | GO:0043968 | histone H2A acetylation(GO:0043968) |
| 0.1 | 1.9 | GO:0036150 | phosphatidylserine acyl-chain remodeling(GO:0036150) |
| 0.1 | 0.5 | GO:0038165 | oncostatin-M-mediated signaling pathway(GO:0038165) leukemia inhibitory factor signaling pathway(GO:0048861) |
| 0.1 | 0.4 | GO:0002322 | B cell proliferation involved in immune response(GO:0002322) |
| 0.1 | 1.3 | GO:0015939 | pantothenate metabolic process(GO:0015939) |
| 0.1 | 2.0 | GO:0070831 | basement membrane assembly(GO:0070831) |
| 0.1 | 1.5 | GO:0045116 | protein neddylation(GO:0045116) |
| 0.1 | 1.6 | GO:0075522 | IRES-dependent viral translational initiation(GO:0075522) |
| 0.1 | 0.7 | GO:0008050 | negative regulation of female receptivity(GO:0007621) female courtship behavior(GO:0008050) |
| 0.1 | 0.4 | GO:1904550 | chemotaxis to arachidonic acid(GO:0034670) response to arachidonic acid(GO:1904550) |
| 0.1 | 1.5 | GO:0006607 | NLS-bearing protein import into nucleus(GO:0006607) |
| 0.1 | 0.3 | GO:1900042 | positive regulation of interleukin-2 secretion(GO:1900042) |
| 0.1 | 0.6 | GO:0017196 | N-terminal peptidyl-methionine acetylation(GO:0017196) |
| 0.1 | 0.5 | GO:0016240 | autophagosome docking(GO:0016240) |
| 0.1 | 0.5 | GO:1900245 | positive regulation of MDA-5 signaling pathway(GO:1900245) |
| 0.1 | 0.4 | GO:1900246 | positive regulation of RIG-I signaling pathway(GO:1900246) |
| 0.1 | 1.0 | GO:0006451 | selenocysteine incorporation(GO:0001514) translational readthrough(GO:0006451) |
| 0.1 | 0.4 | GO:0060762 | regulation of branching involved in mammary gland duct morphogenesis(GO:0060762) |
| 0.1 | 0.2 | GO:0039534 | regulation of MDA-5 signaling pathway(GO:0039533) negative regulation of MDA-5 signaling pathway(GO:0039534) |
| 0.1 | 0.6 | GO:1901315 | negative regulation of histone ubiquitination(GO:0033183) negative regulation of protein K63-linked ubiquitination(GO:1900045) regulation of histone H2A K63-linked ubiquitination(GO:1901314) negative regulation of histone H2A K63-linked ubiquitination(GO:1901315) negative regulation of protein polyubiquitination(GO:1902915) |
| 0.1 | 0.5 | GO:1903566 | positive regulation of protein localization to cilium(GO:1903566) |
| 0.1 | 0.2 | GO:0045578 | negative regulation of B cell differentiation(GO:0045578) |
| 0.1 | 1.0 | GO:0007379 | segment specification(GO:0007379) |
| 0.1 | 1.3 | GO:0031053 | primary miRNA processing(GO:0031053) |
| 0.1 | 1.1 | GO:0035562 | negative regulation of chromatin binding(GO:0035562) |
| 0.1 | 1.6 | GO:0007172 | signal complex assembly(GO:0007172) |
| 0.1 | 0.8 | GO:0007549 | dosage compensation(GO:0007549) dosage compensation by inactivation of X chromosome(GO:0009048) |
| 0.1 | 0.6 | GO:0042256 | mature ribosome assembly(GO:0042256) positive regulation of chemokine (C-C motif) ligand 5 production(GO:0071651) |
| 0.1 | 0.1 | GO:0061110 | dense core granule biogenesis(GO:0061110) regulation of dense core granule biogenesis(GO:2000705) |
| 0.1 | 0.3 | GO:0045629 | negative regulation of T-helper 2 cell differentiation(GO:0045629) |
| 0.1 | 0.3 | GO:0060502 | epithelial cell proliferation involved in lung morphogenesis(GO:0060502) |
| 0.1 | 0.6 | GO:0046940 | nucleoside monophosphate phosphorylation(GO:0046940) |
| 0.1 | 0.8 | GO:0021869 | forebrain ventricular zone progenitor cell division(GO:0021869) |
| 0.1 | 0.6 | GO:0035331 | negative regulation of hippo signaling(GO:0035331) |
| 0.1 | 0.3 | GO:0000393 | spliceosomal conformational changes to generate catalytic conformation(GO:0000393) |
| 0.1 | 1.4 | GO:0071577 | zinc II ion transmembrane transport(GO:0071577) |
| 0.1 | 3.4 | GO:0006891 | intra-Golgi vesicle-mediated transport(GO:0006891) |
| 0.1 | 0.4 | GO:0016560 | protein import into peroxisome matrix, docking(GO:0016560) |
| 0.1 | 0.6 | GO:1905146 | lysosomal protein catabolic process(GO:1905146) |
| 0.1 | 3.1 | GO:0043486 | histone exchange(GO:0043486) |
| 0.1 | 3.5 | GO:0006378 | mRNA polyadenylation(GO:0006378) RNA polyadenylation(GO:0043631) |
| 0.1 | 0.2 | GO:1904381 | Golgi apparatus mannose trimming(GO:1904381) |
| 0.1 | 4.2 | GO:0006611 | protein export from nucleus(GO:0006611) |
| 0.1 | 0.6 | GO:0098735 | positive regulation of the force of heart contraction(GO:0098735) |
| 0.1 | 1.2 | GO:1902166 | negative regulation of intrinsic apoptotic signaling pathway in response to DNA damage by p53 class mediator(GO:1902166) |
| 0.1 | 0.3 | GO:1902202 | regulation of hepatocyte growth factor receptor signaling pathway(GO:1902202) |
| 0.1 | 5.6 | GO:0000079 | regulation of cyclin-dependent protein serine/threonine kinase activity(GO:0000079) |
| 0.1 | 1.6 | GO:0000060 | protein import into nucleus, translocation(GO:0000060) |
| 0.1 | 0.8 | GO:0000338 | protein deneddylation(GO:0000338) |
| 0.1 | 0.4 | GO:0046836 | glycolipid transport(GO:0046836) |
| 0.1 | 1.1 | GO:0061157 | mRNA destabilization(GO:0061157) |
| 0.1 | 1.0 | GO:0035518 | histone H2A monoubiquitination(GO:0035518) |
| 0.1 | 2.2 | GO:0061003 | positive regulation of dendritic spine morphogenesis(GO:0061003) |
| 0.1 | 1.9 | GO:0017145 | stem cell division(GO:0017145) |
| 0.1 | 0.9 | GO:0050775 | positive regulation of dendrite morphogenesis(GO:0050775) |
| 0.0 | 0.7 | GO:0034067 | protein localization to Golgi apparatus(GO:0034067) |
| 0.0 | 3.5 | GO:0015914 | phospholipid transport(GO:0015914) |
| 0.0 | 1.8 | GO:0071353 | cellular response to interleukin-4(GO:0071353) |
| 0.0 | 1.6 | GO:0043928 | exonucleolytic nuclear-transcribed mRNA catabolic process involved in deadenylation-dependent decay(GO:0043928) |
| 0.0 | 6.8 | GO:0045445 | myoblast differentiation(GO:0045445) |
| 0.0 | 0.6 | GO:0015727 | lactate transport(GO:0015727) lactate transmembrane transport(GO:0035873) |
| 0.0 | 1.4 | GO:0051016 | barbed-end actin filament capping(GO:0051016) |
| 0.0 | 1.4 | GO:0017004 | cytochrome complex assembly(GO:0017004) |
| 0.0 | 2.2 | GO:1900739 | regulation of protein insertion into mitochondrial membrane involved in apoptotic signaling pathway(GO:1900739) positive regulation of protein insertion into mitochondrial membrane involved in apoptotic signaling pathway(GO:1900740) |
| 0.0 | 0.1 | GO:2000374 | regulation of oxygen metabolic process(GO:2000374) |
| 0.0 | 0.2 | GO:1990414 | replication-born double-strand break repair via sister chromatid exchange(GO:1990414) |
| 0.0 | 0.6 | GO:0001867 | complement activation, lectin pathway(GO:0001867) |
| 0.0 | 0.1 | GO:0045905 | translational frameshifting(GO:0006452) positive regulation of translational elongation(GO:0045901) positive regulation of translational termination(GO:0045905) |
| 0.0 | 0.1 | GO:0042659 | regulation of cell fate specification(GO:0042659) |
| 0.0 | 0.4 | GO:0070327 | thyroid hormone transport(GO:0070327) |
| 0.0 | 0.3 | GO:0000395 | mRNA 5'-splice site recognition(GO:0000395) |
| 0.0 | 0.5 | GO:0010992 | ubiquitin homeostasis(GO:0010992) |
| 0.0 | 1.1 | GO:0008608 | attachment of spindle microtubules to kinetochore(GO:0008608) |
| 0.0 | 0.6 | GO:0033141 | positive regulation of peptidyl-serine phosphorylation of STAT protein(GO:0033141) |
| 0.0 | 0.1 | GO:0021965 | spinal cord ventral commissure morphogenesis(GO:0021965) |
| 0.0 | 1.2 | GO:0071549 | cellular response to dexamethasone stimulus(GO:0071549) |
| 0.0 | 1.9 | GO:0006027 | glycosaminoglycan catabolic process(GO:0006027) |
| 0.0 | 0.6 | GO:0048935 | peripheral nervous system neuron differentiation(GO:0048934) peripheral nervous system neuron development(GO:0048935) |
| 0.0 | 2.4 | GO:0070830 | bicellular tight junction assembly(GO:0070830) |
| 0.0 | 0.6 | GO:0042753 | positive regulation of circadian rhythm(GO:0042753) |
| 0.0 | 0.5 | GO:0070734 | histone H3-K27 methylation(GO:0070734) |
| 0.0 | 2.6 | GO:0006968 | cellular defense response(GO:0006968) |
| 0.0 | 2.2 | GO:0045454 | cell redox homeostasis(GO:0045454) |
| 0.0 | 0.1 | GO:0044339 | canonical Wnt signaling pathway involved in osteoblast differentiation(GO:0044339) |
| 0.0 | 0.2 | GO:0006880 | intracellular sequestering of iron ion(GO:0006880) sequestering of iron ion(GO:0097577) |
| 0.0 | 1.1 | GO:0000462 | maturation of SSU-rRNA from tricistronic rRNA transcript (SSU-rRNA, 5.8S rRNA, LSU-rRNA)(GO:0000462) |
| 0.0 | 0.7 | GO:0070536 | protein K63-linked deubiquitination(GO:0070536) |
| 0.0 | 0.9 | GO:0045745 | positive regulation of G-protein coupled receptor protein signaling pathway(GO:0045745) |
| 0.0 | 2.7 | GO:1902036 | regulation of hematopoietic stem cell differentiation(GO:1902036) |
| 0.0 | 1.3 | GO:0032922 | circadian regulation of gene expression(GO:0032922) |
| 0.0 | 0.1 | GO:0060414 | aorta smooth muscle tissue morphogenesis(GO:0060414) |
| 0.0 | 2.4 | GO:0051289 | protein homotetramerization(GO:0051289) |
| 0.0 | 1.5 | GO:0006890 | retrograde vesicle-mediated transport, Golgi to ER(GO:0006890) |
| 0.0 | 1.0 | GO:0002011 | morphogenesis of an epithelial sheet(GO:0002011) |
| 0.0 | 2.0 | GO:0038083 | peptidyl-tyrosine autophosphorylation(GO:0038083) |
| 0.0 | 0.6 | GO:0043552 | positive regulation of phosphatidylinositol 3-kinase activity(GO:0043552) |
| 0.0 | 0.2 | GO:0043562 | cellular response to nitrogen starvation(GO:0006995) cellular response to nitrogen levels(GO:0043562) |
| 0.0 | 0.1 | GO:0034201 | response to oleic acid(GO:0034201) |
| 0.0 | 1.4 | GO:0007492 | endoderm development(GO:0007492) |
| 0.0 | 0.0 | GO:2001271 | negative regulation of cysteine-type endopeptidase activity involved in execution phase of apoptosis(GO:2001271) |
| 0.0 | 0.2 | GO:0000244 | spliceosomal tri-snRNP complex assembly(GO:0000244) |
| 0.0 | 1.2 | GO:0000381 | regulation of alternative mRNA splicing, via spliceosome(GO:0000381) |
| 0.0 | 0.4 | GO:0007250 | activation of NF-kappaB-inducing kinase activity(GO:0007250) |
| 0.0 | 0.6 | GO:0051491 | positive regulation of filopodium assembly(GO:0051491) |
| 0.0 | 0.6 | GO:0070534 | protein K63-linked ubiquitination(GO:0070534) |
| 0.0 | 0.7 | GO:0050690 | regulation of defense response to virus by virus(GO:0050690) |
| 0.0 | 0.8 | GO:0044364 | killing of cells of other organism(GO:0031640) disruption of cells of other organism(GO:0044364) |
| 0.0 | 0.6 | GO:0010470 | regulation of gastrulation(GO:0010470) |
| 0.0 | 2.4 | GO:0019079 | viral genome replication(GO:0019079) |
| 0.0 | 0.2 | GO:0034116 | regulation of heterotypic cell-cell adhesion(GO:0034114) positive regulation of heterotypic cell-cell adhesion(GO:0034116) |
| 0.0 | 0.1 | GO:0060837 | blood vessel endothelial cell differentiation(GO:0060837) arterial endothelial cell differentiation(GO:0060842) |
| 0.0 | 0.1 | GO:0061732 | mitochondrial acetyl-CoA biosynthetic process from pyruvate(GO:0061732) |
| 0.0 | 0.7 | GO:0046513 | ceramide biosynthetic process(GO:0046513) |
| 0.0 | 1.2 | GO:0051168 | nuclear export(GO:0051168) |
| 0.0 | 0.3 | GO:0070911 | global genome nucleotide-excision repair(GO:0070911) |
Gene overrepresentation in cellular component category:
| Log-likelihood per target | Total log-likelihood | Term | Description |
|---|---|---|---|
| 1.8 | 5.5 | GO:0033185 | dolichol-phosphate-mannose synthase complex(GO:0033185) |
| 1.1 | 3.2 | GO:0043511 | inhibin complex(GO:0043511) inhibin A complex(GO:0043512) |
| 0.8 | 3.0 | GO:0034665 | integrin alpha1-beta1 complex(GO:0034665) |
| 0.7 | 2.0 | GO:0043259 | laminin-1 complex(GO:0005606) laminin-10 complex(GO:0043259) laminin-11 complex(GO:0043260) |
| 0.7 | 4.6 | GO:0031415 | NatA complex(GO:0031415) |
| 0.7 | 2.6 | GO:0002189 | ribose phosphate diphosphokinase complex(GO:0002189) |
| 0.6 | 5.3 | GO:0097452 | GAIT complex(GO:0097452) |
| 0.6 | 9.7 | GO:0031080 | nuclear pore outer ring(GO:0031080) |
| 0.6 | 8.9 | GO:0016600 | flotillin complex(GO:0016600) |
| 0.5 | 2.0 | GO:0097125 | cyclin B1-CDK1 complex(GO:0097125) |
| 0.5 | 1.9 | GO:0005899 | insulin receptor complex(GO:0005899) |
| 0.5 | 2.9 | GO:0042721 | mitochondrial inner membrane protein insertion complex(GO:0042721) |
| 0.5 | 1.9 | GO:0048179 | activin receptor complex(GO:0048179) |
| 0.4 | 2.2 | GO:0031905 | early endosome lumen(GO:0031905) |
| 0.4 | 0.8 | GO:0034666 | integrin alpha2-beta1 complex(GO:0034666) |
| 0.3 | 7.2 | GO:0005652 | nuclear lamina(GO:0005652) |
| 0.3 | 0.6 | GO:0031414 | N-terminal protein acetyltransferase complex(GO:0031414) |
| 0.3 | 1.3 | GO:0031211 | serine C-palmitoyltransferase complex(GO:0017059) endoplasmic reticulum palmitoyltransferase complex(GO:0031211) |
| 0.3 | 2.4 | GO:0070761 | pre-snoRNP complex(GO:0070761) |
| 0.3 | 2.3 | GO:0061689 | tricellular tight junction(GO:0061689) |
| 0.3 | 2.5 | GO:0070765 | gamma-secretase complex(GO:0070765) |
| 0.3 | 3.7 | GO:0017119 | Golgi transport complex(GO:0017119) |
| 0.3 | 1.4 | GO:0005943 | phosphatidylinositol 3-kinase complex, class IA(GO:0005943) |
| 0.2 | 3.7 | GO:0034663 | endoplasmic reticulum chaperone complex(GO:0034663) |
| 0.2 | 8.4 | GO:0097346 | INO80-type complex(GO:0097346) |
| 0.2 | 2.2 | GO:0042382 | paraspeckles(GO:0042382) |
| 0.2 | 1.5 | GO:0070022 | transforming growth factor beta receptor homodimeric complex(GO:0070022) |
| 0.2 | 1.2 | GO:0005797 | Golgi medial cisterna(GO:0005797) |
| 0.2 | 2.2 | GO:0071439 | clathrin complex(GO:0071439) |
| 0.2 | 1.3 | GO:0034751 | aryl hydrocarbon receptor complex(GO:0034751) |
| 0.2 | 3.0 | GO:0005847 | mRNA cleavage and polyadenylation specificity factor complex(GO:0005847) |
| 0.2 | 1.4 | GO:0016589 | NURF complex(GO:0016589) |
| 0.2 | 3.6 | GO:0031332 | RISC complex(GO:0016442) RNAi effector complex(GO:0031332) |
| 0.2 | 5.6 | GO:0005852 | eukaryotic translation initiation factor 3 complex(GO:0005852) |
| 0.2 | 0.6 | GO:0097636 | intrinsic component of autophagosome membrane(GO:0097636) integral component of autophagosome membrane(GO:0097637) |
| 0.2 | 2.1 | GO:0042587 | glycogen granule(GO:0042587) PTW/PP1 phosphatase complex(GO:0072357) |
| 0.2 | 3.9 | GO:0032433 | filopodium tip(GO:0032433) |
| 0.2 | 0.5 | GO:0030956 | glutamyl-tRNA(Gln) amidotransferase complex(GO:0030956) |
| 0.2 | 0.9 | GO:0030981 | cortical microtubule cytoskeleton(GO:0030981) |
| 0.2 | 1.2 | GO:1990452 | Parkin-FBXW7-Cul1 ubiquitin ligase complex(GO:1990452) |
| 0.2 | 11.8 | GO:0010494 | cytoplasmic stress granule(GO:0010494) |
| 0.2 | 3.1 | GO:0035267 | NuA4 histone acetyltransferase complex(GO:0035267) H4/H2A histone acetyltransferase complex(GO:0043189) H4 histone acetyltransferase complex(GO:1902562) |
| 0.2 | 3.1 | GO:0043220 | Schmidt-Lanterman incisure(GO:0043220) |
| 0.2 | 0.5 | GO:1903349 | omegasome membrane(GO:1903349) |
| 0.2 | 1.4 | GO:0031298 | replication fork protection complex(GO:0031298) |
| 0.1 | 0.5 | GO:0001739 | sex chromatin(GO:0001739) |
| 0.1 | 1.2 | GO:0000124 | SAGA complex(GO:0000124) |
| 0.1 | 2.5 | GO:0005671 | Ada2/Gcn5/Ada3 transcription activator complex(GO:0005671) |
| 0.1 | 1.6 | GO:0005688 | U6 snRNP(GO:0005688) |
| 0.1 | 2.0 | GO:0033162 | melanosome membrane(GO:0033162) chitosome(GO:0045009) |
| 0.1 | 1.4 | GO:0008290 | F-actin capping protein complex(GO:0008290) WASH complex(GO:0071203) |
| 0.1 | 1.8 | GO:0097470 | ribbon synapse(GO:0097470) |
| 0.1 | 1.7 | GO:0035102 | PRC1 complex(GO:0035102) |
| 0.1 | 0.4 | GO:0070876 | SOSS complex(GO:0070876) |
| 0.1 | 0.4 | GO:0032937 | SREBP-SCAP-Insig complex(GO:0032937) |
| 0.1 | 0.7 | GO:0031313 | extrinsic component of endosome membrane(GO:0031313) |
| 0.1 | 2.1 | GO:0071782 | endoplasmic reticulum tubular network(GO:0071782) |
| 0.1 | 7.1 | GO:0005637 | nuclear inner membrane(GO:0005637) |
| 0.1 | 2.4 | GO:0031231 | integral component of peroxisomal membrane(GO:0005779) intrinsic component of peroxisomal membrane(GO:0031231) |
| 0.1 | 0.4 | GO:1990589 | ATF4-CREB1 transcription factor complex(GO:1990589) |
| 0.1 | 1.5 | GO:0044300 | cerebellar mossy fiber(GO:0044300) |
| 0.1 | 4.2 | GO:0030119 | AP-type membrane coat adaptor complex(GO:0030119) |
| 0.1 | 0.3 | GO:0071012 | catalytic step 1 spliceosome(GO:0071012) |
| 0.1 | 2.0 | GO:0030687 | preribosome, large subunit precursor(GO:0030687) |
| 0.1 | 0.3 | GO:0098554 | cytoplasmic side of endoplasmic reticulum membrane(GO:0098554) |
| 0.1 | 0.7 | GO:0030118 | clathrin coat(GO:0030118) |
| 0.1 | 5.4 | GO:0005643 | nuclear pore(GO:0005643) |
| 0.1 | 2.9 | GO:0005782 | peroxisomal matrix(GO:0005782) microbody lumen(GO:0031907) |
| 0.0 | 0.6 | GO:0032045 | guanyl-nucleotide exchange factor complex(GO:0032045) |
| 0.0 | 2.2 | GO:0005844 | polysome(GO:0005844) |
| 0.0 | 5.9 | GO:0030175 | filopodium(GO:0030175) |
| 0.0 | 0.3 | GO:0032437 | cuticular plate(GO:0032437) |
| 0.0 | 2.2 | GO:0009295 | nucleoid(GO:0009295) mitochondrial nucleoid(GO:0042645) |
| 0.0 | 1.5 | GO:0097228 | sperm principal piece(GO:0097228) |
| 0.0 | 0.9 | GO:0071682 | endocytic vesicle lumen(GO:0071682) |
| 0.0 | 1.7 | GO:1904115 | axon cytoplasm(GO:1904115) |
| 0.0 | 4.2 | GO:0005758 | mitochondrial intermembrane space(GO:0005758) |
| 0.0 | 12.9 | GO:0031965 | nuclear membrane(GO:0031965) |
| 0.0 | 1.9 | GO:0043034 | costamere(GO:0043034) |
| 0.0 | 3.1 | GO:0030670 | phagocytic vesicle membrane(GO:0030670) |
| 0.0 | 3.8 | GO:0042579 | peroxisome(GO:0005777) microbody(GO:0042579) |
| 0.0 | 0.2 | GO:0044326 | dendritic spine neck(GO:0044326) |
| 0.0 | 0.5 | GO:0005869 | dynactin complex(GO:0005869) |
| 0.0 | 0.2 | GO:1990130 | Iml1 complex(GO:1990130) |
| 0.0 | 0.9 | GO:0000780 | condensed nuclear chromosome, centromeric region(GO:0000780) |
| 0.0 | 7.6 | GO:0005681 | spliceosomal complex(GO:0005681) |
| 0.0 | 5.2 | GO:0030176 | integral component of endoplasmic reticulum membrane(GO:0030176) |
| 0.0 | 0.2 | GO:0030688 | preribosome, small subunit precursor(GO:0030688) |
| 0.0 | 4.5 | GO:0043202 | lysosomal lumen(GO:0043202) |
| 0.0 | 0.4 | GO:0005721 | pericentric heterochromatin(GO:0005721) |
| 0.0 | 2.9 | GO:0036064 | ciliary basal body(GO:0036064) |
| 0.0 | 12.9 | GO:0005759 | mitochondrial matrix(GO:0005759) |
| 0.0 | 2.0 | GO:0035580 | specific granule lumen(GO:0035580) |
| 0.0 | 3.6 | GO:0016605 | PML body(GO:0016605) |
| 0.0 | 3.4 | GO:0005635 | nuclear envelope(GO:0005635) |
| 0.0 | 7.7 | GO:0000151 | ubiquitin ligase complex(GO:0000151) |
| 0.0 | 1.2 | GO:0001533 | cornified envelope(GO:0001533) |
| 0.0 | 2.8 | GO:0031093 | platelet alpha granule lumen(GO:0031093) |
| 0.0 | 3.9 | GO:0000793 | condensed chromosome(GO:0000793) |
| 0.0 | 1.9 | GO:0001725 | stress fiber(GO:0001725) contractile actin filament bundle(GO:0097517) |
| 0.0 | 0.5 | GO:0031304 | intrinsic component of mitochondrial inner membrane(GO:0031304) integral component of mitochondrial inner membrane(GO:0031305) |
| 0.0 | 1.1 | GO:0022627 | cytosolic small ribosomal subunit(GO:0022627) |
| 0.0 | 0.6 | GO:0031519 | PcG protein complex(GO:0031519) |
| 0.0 | 0.7 | GO:0016581 | NuRD complex(GO:0016581) CHD-type complex(GO:0090545) |
| 0.0 | 0.3 | GO:0030669 | clathrin-coated endocytic vesicle membrane(GO:0030669) |
| 0.0 | 1.3 | GO:0005882 | intermediate filament(GO:0005882) |
| 0.0 | 0.6 | GO:0043198 | dendritic shaft(GO:0043198) |
| 0.0 | 6.3 | GO:0031012 | extracellular matrix(GO:0031012) |
| 0.0 | 5.6 | GO:0005925 | focal adhesion(GO:0005925) |
Gene overrepresentation in molecular function category:
| Log-likelihood per target | Total log-likelihood | Term | Description |
|---|---|---|---|
| 2.5 | 7.4 | GO:0001069 | regulatory region RNA binding(GO:0001069) |
| 1.8 | 5.5 | GO:0004582 | dolichyl-phosphate beta-D-mannosyltransferase activity(GO:0004582) |
| 1.3 | 4.0 | GO:1990050 | phosphatidic acid transporter activity(GO:1990050) |
| 1.2 | 7.3 | GO:0004359 | glutaminase activity(GO:0004359) |
| 0.9 | 3.4 | GO:0004001 | adenosine kinase activity(GO:0004001) |
| 0.8 | 2.3 | GO:0080023 | 3R-hydroxyacyl-CoA dehydratase activity(GO:0080023) |
| 0.7 | 2.2 | GO:0035651 | AP-3 adaptor complex binding(GO:0035651) |
| 0.7 | 2.9 | GO:0005111 | type 2 fibroblast growth factor receptor binding(GO:0005111) |
| 0.7 | 5.0 | GO:0060698 | endoribonuclease inhibitor activity(GO:0060698) |
| 0.7 | 2.1 | GO:0030350 | iron-responsive element binding(GO:0030350) |
| 0.6 | 6.4 | GO:0035251 | UDP-glucosyltransferase activity(GO:0035251) |
| 0.6 | 1.7 | GO:0004534 | 5'-3' exoribonuclease activity(GO:0004534) |
| 0.5 | 4.3 | GO:0008046 | axon guidance receptor activity(GO:0008046) |
| 0.5 | 1.5 | GO:0004720 | protein-lysine 6-oxidase activity(GO:0004720) |
| 0.5 | 3.9 | GO:0098639 | collagen binding involved in cell-matrix adhesion(GO:0098639) |
| 0.5 | 6.0 | GO:1990825 | sequence-specific mRNA binding(GO:1990825) |
| 0.5 | 1.4 | GO:0003917 | DNA topoisomerase type I activity(GO:0003917) |
| 0.5 | 1.4 | GO:0031403 | lithium ion binding(GO:0031403) |
| 0.4 | 1.8 | GO:0008449 | N-acetylglucosamine-6-sulfatase activity(GO:0008449) |
| 0.4 | 1.3 | GO:0004874 | aryl hydrocarbon receptor activity(GO:0004874) |
| 0.4 | 2.6 | GO:0004749 | ribose phosphate diphosphokinase activity(GO:0004749) |
| 0.4 | 2.6 | GO:0016435 | rRNA (guanine) methyltransferase activity(GO:0016435) |
| 0.4 | 1.7 | GO:0035373 | chondroitin sulfate proteoglycan binding(GO:0035373) |
| 0.4 | 2.1 | GO:0005152 | interleukin-1 receptor antagonist activity(GO:0005152) |
| 0.4 | 2.1 | GO:0017018 | myosin phosphatase activity(GO:0017018) |
| 0.4 | 1.3 | GO:0016454 | serine C-palmitoyltransferase activity(GO:0004758) C-palmitoyltransferase activity(GO:0016454) |
| 0.4 | 2.1 | GO:0051998 | carboxyl-O-methyltransferase activity(GO:0010340) protein carboxyl O-methyltransferase activity(GO:0051998) |
| 0.4 | 3.2 | GO:0070699 | type II activin receptor binding(GO:0070699) |
| 0.4 | 1.9 | GO:0004045 | aminoacyl-tRNA hydrolase activity(GO:0004045) |
| 0.4 | 5.3 | GO:0004596 | peptide alpha-N-acetyltransferase activity(GO:0004596) |
| 0.4 | 1.1 | GO:0050509 | N-acetylglucosaminyl-proteoglycan 4-beta-glucuronosyltransferase activity(GO:0050509) |
| 0.3 | 1.6 | GO:0034481 | chondroitin sulfotransferase activity(GO:0034481) |
| 0.3 | 1.9 | GO:0016361 | activin receptor activity, type I(GO:0016361) |
| 0.3 | 1.6 | GO:0004515 | nicotinate-nucleotide adenylyltransferase activity(GO:0004515) |
| 0.3 | 4.4 | GO:0005049 | nuclear export signal receptor activity(GO:0005049) |
| 0.3 | 4.4 | GO:0034450 | ubiquitin-ubiquitin ligase activity(GO:0034450) |
| 0.3 | 2.3 | GO:0071933 | Arp2/3 complex binding(GO:0071933) |
| 0.3 | 2.0 | GO:0016618 | hydroxypyruvate reductase activity(GO:0016618) glyoxylate reductase (NADP) activity(GO:0030267) |
| 0.3 | 5.0 | GO:0097602 | cullin family protein binding(GO:0097602) |
| 0.3 | 1.9 | GO:1904929 | coreceptor activity involved in Wnt signaling pathway, planar cell polarity pathway(GO:1904929) |
| 0.3 | 3.1 | GO:1990247 | N6-methyladenosine-containing RNA binding(GO:1990247) |
| 0.2 | 0.7 | GO:0005010 | insulin-like growth factor-activated receptor activity(GO:0005010) |
| 0.2 | 0.9 | GO:0016509 | long-chain-3-hydroxyacyl-CoA dehydrogenase activity(GO:0016509) |
| 0.2 | 1.1 | GO:0030618 | transforming growth factor beta receptor, pathway-specific cytoplasmic mediator activity(GO:0030618) |
| 0.2 | 0.4 | GO:0017089 | glycolipid transporter activity(GO:0017089) |
| 0.2 | 3.8 | GO:0042043 | neurexin family protein binding(GO:0042043) |
| 0.2 | 9.5 | GO:0008536 | Ran GTPase binding(GO:0008536) |
| 0.2 | 3.7 | GO:0005068 | transmembrane receptor protein tyrosine kinase adaptor activity(GO:0005068) |
| 0.2 | 1.3 | GO:0004594 | pantothenate kinase activity(GO:0004594) |
| 0.2 | 8.1 | GO:0008143 | poly(A) binding(GO:0008143) |
| 0.2 | 1.4 | GO:0071535 | RING-like zinc finger domain binding(GO:0071535) |
| 0.2 | 2.2 | GO:0032051 | clathrin light chain binding(GO:0032051) |
| 0.2 | 1.6 | GO:1990829 | C-rich single-stranded DNA binding(GO:1990829) |
| 0.2 | 4.3 | GO:0000030 | mannosyltransferase activity(GO:0000030) |
| 0.2 | 4.2 | GO:0070273 | phosphatidylinositol-4-phosphate binding(GO:0070273) |
| 0.2 | 1.3 | GO:0042978 | ornithine decarboxylase activator activity(GO:0042978) |
| 0.2 | 3.7 | GO:0051787 | misfolded protein binding(GO:0051787) |
| 0.2 | 1.5 | GO:0004176 | ATP-dependent peptidase activity(GO:0004176) |
| 0.2 | 0.5 | GO:0004923 | leukemia inhibitory factor receptor activity(GO:0004923) |
| 0.2 | 0.5 | GO:0050567 | glutaminyl-tRNA synthase (glutamine-hydrolyzing) activity(GO:0050567) |
| 0.2 | 3.6 | GO:0035497 | cAMP response element binding(GO:0035497) |
| 0.2 | 4.3 | GO:0070628 | proteasome binding(GO:0070628) |
| 0.2 | 2.5 | GO:0008140 | cAMP response element binding protein binding(GO:0008140) |
| 0.2 | 0.9 | GO:0034714 | type III transforming growth factor beta receptor binding(GO:0034714) |
| 0.2 | 2.4 | GO:0001094 | TFIID-class transcription factor binding(GO:0001094) |
| 0.2 | 3.1 | GO:0051400 | BH domain binding(GO:0051400) |
| 0.2 | 1.0 | GO:0017150 | tRNA dihydrouridine synthase activity(GO:0017150) |
| 0.2 | 4.2 | GO:0004859 | phospholipase inhibitor activity(GO:0004859) |
| 0.2 | 0.6 | GO:0099580 | ion antiporter activity involved in regulation of postsynaptic membrane potential(GO:0099580) |
| 0.2 | 1.2 | GO:0102337 | fatty acid elongase activity(GO:0009922) 3-oxo-arachidoyl-CoA synthase activity(GO:0102336) 3-oxo-cerotoyl-CoA synthase activity(GO:0102337) 3-oxo-lignoceronyl-CoA synthase activity(GO:0102338) |
| 0.1 | 0.7 | GO:0052656 | branched-chain-amino-acid transaminase activity(GO:0004084) L-leucine transaminase activity(GO:0052654) L-valine transaminase activity(GO:0052655) L-isoleucine transaminase activity(GO:0052656) |
| 0.1 | 3.8 | GO:0004697 | protein kinase C activity(GO:0004697) |
| 0.1 | 2.0 | GO:0017034 | Rap guanyl-nucleotide exchange factor activity(GO:0017034) |
| 0.1 | 1.1 | GO:0015165 | pyrimidine nucleotide-sugar transmembrane transporter activity(GO:0015165) |
| 0.1 | 1.4 | GO:0035005 | 1-phosphatidylinositol-4-phosphate 3-kinase activity(GO:0035005) |
| 0.1 | 5.5 | GO:0017025 | TBP-class protein binding(GO:0017025) |
| 0.1 | 3.2 | GO:0016876 | aminoacyl-tRNA ligase activity(GO:0004812) ligase activity, forming carbon-oxygen bonds(GO:0016875) ligase activity, forming aminoacyl-tRNA and related compounds(GO:0016876) |
| 0.1 | 1.9 | GO:0004653 | polypeptide N-acetylgalactosaminyltransferase activity(GO:0004653) |
| 0.1 | 1.2 | GO:0033192 | calmodulin-dependent protein phosphatase activity(GO:0033192) |
| 0.1 | 2.2 | GO:0017128 | phospholipid scramblase activity(GO:0017128) |
| 0.1 | 7.8 | GO:0008138 | protein tyrosine/serine/threonine phosphatase activity(GO:0008138) |
| 0.1 | 2.3 | GO:0047617 | acyl-CoA hydrolase activity(GO:0047617) |
| 0.1 | 2.4 | GO:0035173 | histone kinase activity(GO:0035173) |
| 0.1 | 1.2 | GO:0000340 | RNA 7-methylguanosine cap binding(GO:0000340) |
| 0.1 | 0.4 | GO:0008511 | sodium:potassium:chloride symporter activity(GO:0008511) |
| 0.1 | 0.6 | GO:0046899 | nucleoside triphosphate adenylate kinase activity(GO:0046899) |
| 0.1 | 9.0 | GO:0048365 | Rac GTPase binding(GO:0048365) |
| 0.1 | 6.7 | GO:0005160 | transforming growth factor beta receptor binding(GO:0005160) |
| 0.1 | 2.8 | GO:0017056 | structural constituent of nuclear pore(GO:0017056) |
| 0.1 | 1.2 | GO:0001075 | transcription factor activity, RNA polymerase II core promoter sequence-specific binding involved in preinitiation complex assembly(GO:0001075) |
| 0.1 | 1.9 | GO:0035256 | G-protein coupled glutamate receptor binding(GO:0035256) |
| 0.1 | 3.8 | GO:0005540 | hyaluronic acid binding(GO:0005540) |
| 0.1 | 1.4 | GO:0016846 | carbon-sulfur lyase activity(GO:0016846) |
| 0.1 | 0.3 | GO:0032427 | GBD domain binding(GO:0032427) |
| 0.1 | 1.0 | GO:0004791 | thioredoxin-disulfide reductase activity(GO:0004791) |
| 0.1 | 2.7 | GO:0071949 | FAD binding(GO:0071949) |
| 0.1 | 3.1 | GO:0001671 | ATPase activator activity(GO:0001671) |
| 0.1 | 2.8 | GO:0005001 | transmembrane receptor protein tyrosine phosphatase activity(GO:0005001) transmembrane receptor protein phosphatase activity(GO:0019198) |
| 0.1 | 2.0 | GO:0030742 | GTP-dependent protein binding(GO:0030742) |
| 0.1 | 6.8 | GO:0004843 | thiol-dependent ubiquitin-specific protease activity(GO:0004843) |
| 0.1 | 2.4 | GO:0005388 | calcium-transporting ATPase activity(GO:0005388) |
| 0.1 | 3.7 | GO:0051879 | Hsp90 protein binding(GO:0051879) |
| 0.1 | 3.1 | GO:0003785 | actin monomer binding(GO:0003785) |
| 0.1 | 2.8 | GO:0017091 | AU-rich element binding(GO:0017091) |
| 0.1 | 0.9 | GO:0031545 | peptidyl-proline 4-dioxygenase activity(GO:0031545) |
| 0.1 | 0.4 | GO:0005052 | peroxisome matrix targeting signal-1 binding(GO:0005052) |
| 0.1 | 1.1 | GO:0016857 | racemase and epimerase activity, acting on carbohydrates and derivatives(GO:0016857) |
| 0.1 | 1.5 | GO:0035615 | clathrin adaptor activity(GO:0035615) endocytic adaptor activity(GO:0098748) |
| 0.1 | 1.4 | GO:0005385 | zinc ion transmembrane transporter activity(GO:0005385) |
| 0.1 | 2.5 | GO:0043015 | gamma-tubulin binding(GO:0043015) |
| 0.1 | 2.4 | GO:0030159 | receptor signaling complex scaffold activity(GO:0030159) |
| 0.1 | 3.7 | GO:0019212 | phosphatase inhibitor activity(GO:0019212) |
| 0.1 | 0.5 | GO:0050733 | RS domain binding(GO:0050733) |
| 0.1 | 2.5 | GO:0042056 | chemoattractant activity(GO:0042056) |
| 0.1 | 1.5 | GO:0102391 | decanoate--CoA ligase activity(GO:0102391) |
| 0.1 | 1.0 | GO:0004089 | carbonate dehydratase activity(GO:0004089) |
| 0.1 | 0.2 | GO:0043035 | chromatin insulator sequence binding(GO:0043035) |
| 0.1 | 1.6 | GO:0017166 | vinculin binding(GO:0017166) |
| 0.1 | 0.4 | GO:0015349 | thyroid hormone transmembrane transporter activity(GO:0015349) |
| 0.1 | 0.7 | GO:0070324 | thyroid hormone binding(GO:0070324) |
| 0.0 | 0.6 | GO:0030280 | structural constituent of epidermis(GO:0030280) |
| 0.0 | 2.0 | GO:0031492 | nucleosomal DNA binding(GO:0031492) |
| 0.0 | 4.6 | GO:0008565 | protein transporter activity(GO:0008565) |
| 0.0 | 1.9 | GO:0001786 | phosphatidylserine binding(GO:0001786) |
| 0.0 | 0.6 | GO:0015129 | lactate transmembrane transporter activity(GO:0015129) |
| 0.0 | 0.7 | GO:0030215 | semaphorin receptor binding(GO:0030215) |
| 0.0 | 0.6 | GO:0031386 | protein tag(GO:0031386) |
| 0.0 | 0.6 | GO:0005132 | type I interferon receptor binding(GO:0005132) |
| 0.0 | 0.4 | GO:0070883 | nucleocytoplasmic transporter activity(GO:0005487) pre-miRNA binding(GO:0070883) |
| 0.0 | 0.5 | GO:0046976 | histone methyltransferase activity (H3-K27 specific)(GO:0046976) |
| 0.0 | 0.9 | GO:0051010 | microtubule plus-end binding(GO:0051010) |
| 0.0 | 0.1 | GO:0005042 | netrin receptor activity(GO:0005042) |
| 0.0 | 1.1 | GO:0031369 | translation initiation factor binding(GO:0031369) |
| 0.0 | 4.8 | GO:0003705 | transcription factor activity, RNA polymerase II distal enhancer sequence-specific binding(GO:0003705) |
| 0.0 | 4.2 | GO:0003697 | single-stranded DNA binding(GO:0003697) |
| 0.0 | 0.2 | GO:0004571 | mannosyl-oligosaccharide 1,2-alpha-mannosidase activity(GO:0004571) |
| 0.0 | 2.0 | GO:0005507 | copper ion binding(GO:0005507) |
| 0.0 | 0.5 | GO:0016004 | phospholipase activator activity(GO:0016004) |
| 0.0 | 1.0 | GO:0008395 | steroid hydroxylase activity(GO:0008395) |
| 0.0 | 0.1 | GO:0004739 | pyruvate dehydrogenase (acetyl-transferring) activity(GO:0004739) |
| 0.0 | 0.1 | GO:0004687 | myosin light chain kinase activity(GO:0004687) |
| 0.0 | 0.9 | GO:0030553 | cGMP binding(GO:0030553) |
| 0.0 | 1.0 | GO:0005544 | calcium-dependent phospholipid binding(GO:0005544) |
| 0.0 | 2.7 | GO:0000149 | SNARE binding(GO:0000149) |
| 0.0 | 0.1 | GO:0070905 | serine binding(GO:0070905) |
| 0.0 | 0.6 | GO:0030676 | Rac guanyl-nucleotide exchange factor activity(GO:0030676) |
| 0.0 | 1.6 | GO:0003730 | mRNA 3'-UTR binding(GO:0003730) |
| 0.0 | 2.2 | GO:0000979 | RNA polymerase II core promoter sequence-specific DNA binding(GO:0000979) |
| 0.0 | 0.2 | GO:0089720 | caspase binding(GO:0089720) |
| 0.0 | 1.5 | GO:0003777 | microtubule motor activity(GO:0003777) |
| 0.0 | 1.4 | GO:0004715 | non-membrane spanning protein tyrosine kinase activity(GO:0004715) |
| 0.0 | 0.1 | GO:0004666 | prostaglandin-endoperoxide synthase activity(GO:0004666) |
| 0.0 | 0.4 | GO:0051721 | protein phosphatase 2A binding(GO:0051721) |
| 0.0 | 1.0 | GO:0005201 | extracellular matrix structural constituent(GO:0005201) |
| 0.0 | 2.1 | GO:0008201 | heparin binding(GO:0008201) |
| 0.0 | 0.5 | GO:0005546 | phosphatidylinositol-4,5-bisphosphate binding(GO:0005546) |
| 0.0 | 1.7 | GO:0016874 | ligase activity(GO:0016874) |
Gene overrepresentation in curated gene sets: canonical pathways category:
| Log-likelihood per target | Total log-likelihood | Term | Description |
|---|---|---|---|
| 0.1 | 3.0 | PID ALK2 PATHWAY | ALK2 signaling events |
| 0.1 | 13.0 | PID P53 REGULATION PATHWAY | p53 pathway |
| 0.1 | 5.7 | PID LYMPH ANGIOGENESIS PATHWAY | VEGFR3 signaling in lymphatic endothelium |
| 0.1 | 2.0 | SA G2 AND M PHASES | Cdc25 activates the cdc2/cyclin B complex to induce the G2/M transition. |
| 0.1 | 5.2 | PID INSULIN GLUCOSE PATHWAY | Insulin-mediated glucose transport |
| 0.1 | 4.6 | PID IGF1 PATHWAY | IGF1 pathway |
| 0.1 | 6.4 | PID IL2 PI3K PATHWAY | IL2 signaling events mediated by PI3K |
| 0.1 | 2.7 | PID HIF1A PATHWAY | Hypoxic and oxygen homeostasis regulation of HIF-1-alpha |
| 0.1 | 6.4 | PID BMP PATHWAY | BMP receptor signaling |
| 0.1 | 2.9 | PID PRL SIGNALING EVENTS PATHWAY | Signaling events mediated by PRL |
| 0.1 | 5.0 | PID FANCONI PATHWAY | Fanconi anemia pathway |
| 0.1 | 3.8 | PID TOLL ENDOGENOUS PATHWAY | Endogenous TLR signaling |
| 0.1 | 3.2 | PID SYNDECAN 3 PATHWAY | Syndecan-3-mediated signaling events |
| 0.1 | 2.0 | PID INTEGRIN4 PATHWAY | Alpha6 beta4 integrin-ligand interactions |
| 0.1 | 8.8 | PID E2F PATHWAY | E2F transcription factor network |
| 0.1 | 2.3 | PID ALK1 PATHWAY | ALK1 signaling events |
| 0.1 | 2.9 | ST ERK1 ERK2 MAPK PATHWAY | ERK1/ERK2 MAPK Pathway |
| 0.1 | 1.2 | PID BETA CATENIN DEG PATHWAY | Degradation of beta catenin |
| 0.1 | 3.0 | PID GLYPICAN 1PATHWAY | Glypican 1 network |
| 0.1 | 3.4 | PID KIT PATHWAY | Signaling events mediated by Stem cell factor receptor (c-Kit) |
| 0.1 | 2.1 | PID TCPTP PATHWAY | Signaling events mediated by TCPTP |
| 0.1 | 4.1 | PID AJDISS 2PATHWAY | Posttranslational regulation of adherens junction stability and dissassembly |
| 0.1 | 0.6 | PID EPHA2 FWD PATHWAY | EPHA2 forward signaling |
| 0.0 | 0.9 | PID P38 MK2 PATHWAY | p38 signaling mediated by MAPKAP kinases |
| 0.0 | 2.0 | PID TGFBR PATHWAY | TGF-beta receptor signaling |
| 0.0 | 2.4 | PID PLK1 PATHWAY | PLK1 signaling events |
| 0.0 | 0.9 | PID NCADHERIN PATHWAY | N-cadherin signaling events |
| 0.0 | 2.6 | PID CASPASE PATHWAY | Caspase cascade in apoptosis |
| 0.0 | 2.5 | PID MYC ACTIV PATHWAY | Validated targets of C-MYC transcriptional activation |
| 0.0 | 0.9 | ST WNT CA2 CYCLIC GMP PATHWAY | Wnt/Ca2+/cyclic GMP signaling. |
| 0.0 | 1.1 | PID DELTA NP63 PATHWAY | Validated transcriptional targets of deltaNp63 isoforms |
| 0.0 | 0.9 | PID P38 ALPHA BETA DOWNSTREAM PATHWAY | Signaling mediated by p38-alpha and p38-beta |
| 0.0 | 1.6 | PID TELOMERASE PATHWAY | Regulation of Telomerase |
| 0.0 | 3.8 | NABA ECM AFFILIATED | Genes encoding proteins affiliated structurally or functionally to extracellular matrix proteins |
| 0.0 | 0.1 | PID TCR RAS PATHWAY | Ras signaling in the CD4+ TCR pathway |
| 0.0 | 0.4 | PID RANBP2 PATHWAY | Sumoylation by RanBP2 regulates transcriptional repression |
| 0.0 | 0.4 | PID FOXM1 PATHWAY | FOXM1 transcription factor network |
| 0.0 | 0.3 | PID ERBB NETWORK PATHWAY | ErbB receptor signaling network |
| 0.0 | 0.7 | PID ERBB1 INTERNALIZATION PATHWAY | Internalization of ErbB1 |
| 0.0 | 1.0 | PID CMYB PATHWAY | C-MYB transcription factor network |
| 0.0 | 0.8 | PID HNF3A PATHWAY | FOXA1 transcription factor network |
| 0.0 | 0.2 | PID BARD1 PATHWAY | BARD1 signaling events |
| 0.0 | 0.6 | PID FAS PATHWAY | FAS (CD95) signaling pathway |
| 0.0 | 0.6 | PID CD8 TCR DOWNSTREAM PATHWAY | Downstream signaling in naïve CD8+ T cells |
| 0.0 | 2.5 | NABA ECM GLYCOPROTEINS | Genes encoding structural ECM glycoproteins |
| 0.0 | 0.3 | PID IL23 PATHWAY | IL23-mediated signaling events |
| 0.0 | 0.5 | PID RXR VDR PATHWAY | RXR and RAR heterodimerization with other nuclear receptor |
Gene overrepresentation in curated gene sets: REACTOME pathways category:
| Log-likelihood per target | Total log-likelihood | Term | Description |
|---|---|---|---|
| 0.4 | 0.4 | REACTOME NEP NS2 INTERACTS WITH THE CELLULAR EXPORT MACHINERY | Genes involved in NEP/NS2 Interacts with the Cellular Export Machinery |
| 0.4 | 2.8 | REACTOME REGULATION OF THE FANCONI ANEMIA PATHWAY | Genes involved in Regulation of the Fanconi anemia pathway |
| 0.3 | 7.0 | REACTOME DESTABILIZATION OF MRNA BY TRISTETRAPROLIN TTP | Genes involved in Destabilization of mRNA by Tristetraprolin (TTP) |
| 0.3 | 5.5 | REACTOME SYNTHESIS OF SUBSTRATES IN N GLYCAN BIOSYTHESIS | Genes involved in Synthesis of substrates in N-glycan biosythesis |
| 0.3 | 11.8 | REACTOME TRANSPORT OF RIBONUCLEOPROTEINS INTO THE HOST NUCLEUS | Genes involved in Transport of Ribonucleoproteins into the Host Nucleus |
| 0.3 | 12.5 | REACTOME DOWNREGULATION OF TGF BETA RECEPTOR SIGNALING | Genes involved in Downregulation of TGF-beta receptor signaling |
| 0.3 | 3.7 | REACTOME P75NTR RECRUITS SIGNALLING COMPLEXES | Genes involved in p75NTR recruits signalling complexes |
| 0.3 | 2.7 | REACTOME CDC6 ASSOCIATION WITH THE ORC ORIGIN COMPLEX | Genes involved in CDC6 association with the ORC:origin complex |
| 0.3 | 3.2 | REACTOME GLYCOPROTEIN HORMONES | Genes involved in Glycoprotein hormones |
| 0.3 | 7.3 | REACTOME AMINO ACID SYNTHESIS AND INTERCONVERSION TRANSAMINATION | Genes involved in Amino acid synthesis and interconversion (transamination) |
| 0.2 | 7.9 | REACTOME G1 S SPECIFIC TRANSCRIPTION | Genes involved in G1/S-Specific Transcription |
| 0.2 | 5.4 | REACTOME FGFR1 LIGAND BINDING AND ACTIVATION | Genes involved in FGFR1 ligand binding and activation |
| 0.2 | 3.2 | REACTOME MITOCHONDRIAL TRNA AMINOACYLATION | Genes involved in Mitochondrial tRNA aminoacylation |
| 0.2 | 2.1 | REACTOME APOBEC3G MEDIATED RESISTANCE TO HIV1 INFECTION | Genes involved in APOBEC3G mediated resistance to HIV-1 infection |
| 0.2 | 2.0 | REACTOME ARMS MEDIATED ACTIVATION | Genes involved in ARMS-mediated activation |
| 0.2 | 3.7 | REACTOME GAP JUNCTION DEGRADATION | Genes involved in Gap junction degradation |
| 0.2 | 5.4 | REACTOME CHONDROITIN SULFATE BIOSYNTHESIS | Genes involved in Chondroitin sulfate biosynthesis |
| 0.2 | 2.7 | REACTOME OXYGEN DEPENDENT PROLINE HYDROXYLATION OF HYPOXIA INDUCIBLE FACTOR ALPHA | Genes involved in Oxygen-dependent Proline Hydroxylation of Hypoxia-inducible Factor Alpha |
| 0.2 | 2.2 | REACTOME PROCESSING OF INTRONLESS PRE MRNAS | Genes involved in Processing of Intronless Pre-mRNAs |
| 0.2 | 3.0 | REACTOME SOS MEDIATED SIGNALLING | Genes involved in SOS-mediated signalling |
| 0.2 | 3.6 | REACTOME ACTIVATION OF RAC | Genes involved in Activation of Rac |
| 0.2 | 1.2 | REACTOME TRANSPORT OF MATURE MRNA DERIVED FROM AN INTRONLESS TRANSCRIPT | Genes involved in Transport of Mature mRNA Derived from an Intronless Transcript |
| 0.1 | 1.0 | REACTOME SYNTHESIS OF BILE ACIDS AND BILE SALTS VIA 24 HYDROXYCHOLESTEROL | Genes involved in Synthesis of bile acids and bile salts via 24-hydroxycholesterol |
| 0.1 | 6.4 | REACTOME GLYCOSPHINGOLIPID METABOLISM | Genes involved in Glycosphingolipid metabolism |
| 0.1 | 1.6 | REACTOME MRNA DECAY BY 5 TO 3 EXORIBONUCLEASE | Genes involved in mRNA Decay by 5' to 3' Exoribonuclease |
| 0.1 | 2.4 | REACTOME ABCA TRANSPORTERS IN LIPID HOMEOSTASIS | Genes involved in ABCA transporters in lipid homeostasis |
| 0.1 | 3.0 | REACTOME CTNNB1 PHOSPHORYLATION CASCADE | Genes involved in Beta-catenin phosphorylation cascade |
| 0.1 | 5.8 | REACTOME NEGATIVE REGULATORS OF RIG I MDA5 SIGNALING | Genes involved in Negative regulators of RIG-I/MDA5 signaling |
| 0.1 | 2.7 | REACTOME PEROXISOMAL LIPID METABOLISM | Genes involved in Peroxisomal lipid metabolism |
| 0.1 | 2.9 | REACTOME HS GAG BIOSYNTHESIS | Genes involved in HS-GAG biosynthesis |
| 0.1 | 2.7 | REACTOME SYNTHESIS OF VERY LONG CHAIN FATTY ACYL COAS | Genes involved in Synthesis of very long-chain fatty acyl-CoAs |
| 0.1 | 1.4 | REACTOME ZINC TRANSPORTERS | Genes involved in Zinc transporters |
| 0.1 | 2.0 | REACTOME OTHER SEMAPHORIN INTERACTIONS | Genes involved in Other semaphorin interactions |
| 0.1 | 1.3 | REACTOME VITAMIN B5 PANTOTHENATE METABOLISM | Genes involved in Vitamin B5 (pantothenate) metabolism |
| 0.1 | 1.0 | REACTOME REVERSIBLE HYDRATION OF CARBON DIOXIDE | Genes involved in Reversible Hydration of Carbon Dioxide |
| 0.1 | 2.5 | REACTOME LYSOSOME VESICLE BIOGENESIS | Genes involved in Lysosome Vesicle Biogenesis |
| 0.1 | 1.4 | REACTOME ADVANCED GLYCOSYLATION ENDPRODUCT RECEPTOR SIGNALING | Genes involved in Advanced glycosylation endproduct receptor signaling |
| 0.1 | 1.4 | REACTOME TIE2 SIGNALING | Genes involved in Tie2 Signaling |
| 0.1 | 1.6 | REACTOME ANTIGEN PRESENTATION FOLDING ASSEMBLY AND PEPTIDE LOADING OF CLASS I MHC | Genes involved in Antigen Presentation: Folding, assembly and peptide loading of class I MHC |
| 0.1 | 1.6 | REACTOME SIGNALING BY ROBO RECEPTOR | Genes involved in Signaling by Robo receptor |
| 0.1 | 0.9 | REACTOME MITOCHONDRIAL FATTY ACID BETA OXIDATION | Genes involved in Mitochondrial Fatty Acid Beta-Oxidation |
| 0.1 | 2.2 | REACTOME GOLGI ASSOCIATED VESICLE BIOGENESIS | Genes involved in Golgi Associated Vesicle Biogenesis |
| 0.1 | 1.5 | REACTOME KINESINS | Genes involved in Kinesins |
| 0.1 | 0.8 | REACTOME ROLE OF DCC IN REGULATING APOPTOSIS | Genes involved in Role of DCC in regulating apoptosis |
| 0.0 | 0.7 | REACTOME SEMA3A PLEXIN REPULSION SIGNALING BY INHIBITING INTEGRIN ADHESION | Genes involved in SEMA3A-Plexin repulsion signaling by inhibiting Integrin adhesion |
| 0.0 | 0.7 | REACTOME PLATELET ADHESION TO EXPOSED COLLAGEN | Genes involved in Platelet Adhesion to exposed collagen |
| 0.0 | 1.1 | REACTOME PURINE SALVAGE | Genes involved in Purine salvage |
| 0.0 | 1.1 | REACTOME DOWNREGULATION OF SMAD2 3 SMAD4 TRANSCRIPTIONAL ACTIVITY | Genes involved in Downregulation of SMAD2/3:SMAD4 transcriptional activity |
| 0.0 | 1.5 | REACTOME RNA POL III TRANSCRIPTION TERMINATION | Genes involved in RNA Polymerase III Transcription Termination |
| 0.0 | 1.2 | REACTOME PROLACTIN RECEPTOR SIGNALING | Genes involved in Prolactin receptor signaling |
| 0.0 | 0.6 | REACTOME PLATELET CALCIUM HOMEOSTASIS | Genes involved in Platelet calcium homeostasis |
| 0.0 | 1.9 | REACTOME O LINKED GLYCOSYLATION OF MUCINS | Genes involved in O-linked glycosylation of mucins |
| 0.0 | 3.2 | REACTOME APOPTOTIC EXECUTION PHASE | Genes involved in Apoptotic execution phase |
| 0.0 | 1.8 | REACTOME ION TRANSPORT BY P TYPE ATPASES | Genes involved in Ion transport by P-type ATPases |
| 0.0 | 1.0 | REACTOME SPHINGOLIPID METABOLISM | Genes involved in Sphingolipid metabolism |
| 0.0 | 2.6 | REACTOME LOSS OF NLP FROM MITOTIC CENTROSOMES | Genes involved in Loss of Nlp from mitotic centrosomes |
| 0.0 | 0.3 | REACTOME NEPHRIN INTERACTIONS | Genes involved in Nephrin interactions |
| 0.0 | 0.6 | REACTOME TRAF6 MEDIATED IRF7 ACTIVATION | Genes involved in TRAF6 mediated IRF7 activation |
| 0.0 | 0.8 | REACTOME TRANSPORT OF VITAMINS NUCLEOSIDES AND RELATED MOLECULES | Genes involved in Transport of vitamins, nucleosides, and related molecules |
| 0.0 | 2.8 | REACTOME RESPONSE TO ELEVATED PLATELET CYTOSOLIC CA2 | Genes involved in Response to elevated platelet cytosolic Ca2+ |
| 0.0 | 0.4 | REACTOME DOWNREGULATION OF ERBB2 ERBB3 SIGNALING | Genes involved in Downregulation of ERBB2:ERBB3 signaling |
| 0.0 | 1.3 | REACTOME REGULATION OF ORNITHINE DECARBOXYLASE ODC | Genes involved in Regulation of ornithine decarboxylase (ODC) |
| 0.0 | 0.4 | REACTOME CREB PHOSPHORYLATION THROUGH THE ACTIVATION OF CAMKII | Genes involved in CREB phosphorylation through the activation of CaMKII |
| 0.0 | 0.3 | REACTOME SHC1 EVENTS IN ERBB4 SIGNALING | Genes involved in SHC1 events in ERBB4 signaling |
| 0.0 | 1.1 | REACTOME FORMATION OF THE TERNARY COMPLEX AND SUBSEQUENTLY THE 43S COMPLEX | Genes involved in Formation of the ternary complex, and subsequently, the 43S complex |
| 0.0 | 0.4 | REACTOME BRANCHED CHAIN AMINO ACID CATABOLISM | Genes involved in Branched-chain amino acid catabolism |
| 0.0 | 0.6 | REACTOME BMAL1 CLOCK NPAS2 ACTIVATES CIRCADIAN EXPRESSION | Genes involved in BMAL1:CLOCK/NPAS2 Activates Circadian Expression |
| 0.0 | 0.2 | REACTOME DCC MEDIATED ATTRACTIVE SIGNALING | Genes involved in DCC mediated attractive signaling |
| 0.0 | 0.3 | REACTOME MRNA SPLICING MINOR PATHWAY | Genes involved in mRNA Splicing - Minor Pathway |