Project
GNF SymAtlas + NCI-60 cancer cell lines, human (Su, 2004; Ross, 2000)
Navigation
Downloads
Results for UGCAUUG
Z-value: 0.24
Motif logo

miRNA associated with seed UGCAUUG
| Name | miRBASE accession |
|---|---|
|
hsa-miR-33a-5p
|
MIMAT0000091 |
|
hsa-miR-33b-5p
|
MIMAT0003301 |
Activity profile of UGCAUUG motif
Sorted Z-values of UGCAUUG motif
Network of associatons between targets according to the STRING database.

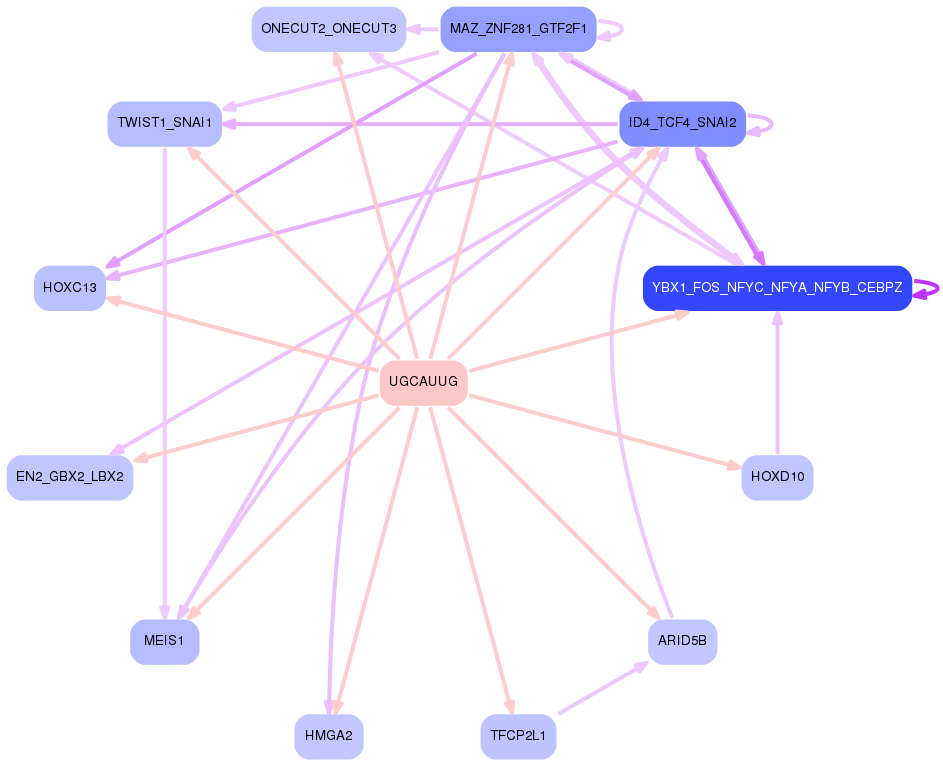
First level regulatory network of UGCAUUG
Gene Ontology Analysis
Gene overrepresentation in biological process category:
| Log-likelihood per target | Total log-likelihood | Term | Description |
|---|---|---|---|
| 0.3 | 1.0 | GO:0003308 | negative regulation of Wnt signaling pathway involved in heart development(GO:0003308) negative regulation of cell fate specification(GO:0009996) |
| 0.2 | 0.6 | GO:0070350 | white fat cell proliferation(GO:0070343) regulation of white fat cell proliferation(GO:0070350) |
| 0.2 | 0.6 | GO:0090402 | oncogene-induced cell senescence(GO:0090402) |
| 0.2 | 1.2 | GO:0030644 | cellular chloride ion homeostasis(GO:0030644) |
| 0.1 | 1.3 | GO:2000601 | positive regulation of Arp2/3 complex-mediated actin nucleation(GO:2000601) |
| 0.1 | 0.5 | GO:0099558 | maintenance of synapse structure(GO:0099558) |
| 0.1 | 1.4 | GO:1900028 | negative regulation of ruffle assembly(GO:1900028) |
| 0.1 | 0.3 | GO:2000276 | negative regulation of oxidative phosphorylation uncoupler activity(GO:2000276) cell proliferation involved in heart valve development(GO:2000793) |
| 0.1 | 0.5 | GO:0033353 | S-adenosylmethionine cycle(GO:0033353) |
| 0.1 | 0.2 | GO:0015917 | aminophospholipid transport(GO:0015917) |
| 0.1 | 0.4 | GO:0021590 | cerebellum maturation(GO:0021590) cerebellar cortex maturation(GO:0021699) |
| 0.1 | 0.3 | GO:0072658 | maintenance of protein location in membrane(GO:0072658) maintenance of protein location in plasma membrane(GO:0072660) positive regulation of membrane depolarization during cardiac muscle cell action potential(GO:1900827) |
| 0.1 | 0.4 | GO:0048549 | positive regulation of pinocytosis(GO:0048549) |
| 0.1 | 0.3 | GO:2000317 | negative regulation of T-helper 17 type immune response(GO:2000317) negative regulation of T-helper 17 cell differentiation(GO:2000320) |
| 0.1 | 0.3 | GO:0043314 | negative regulation of neutrophil degranulation(GO:0043314) |
| 0.1 | 0.3 | GO:0008063 | Toll signaling pathway(GO:0008063) |
| 0.1 | 0.3 | GO:0021856 | cerebral cortex tangential migration using cell-axon interactions(GO:0021824) gonadotrophin-releasing hormone neuronal migration to the hypothalamus(GO:0021828) hypothalamic tangential migration using cell-axon interactions(GO:0021856) sensory system development(GO:0048880) facioacoustic ganglion development(GO:1903375) |
| 0.1 | 1.4 | GO:0071294 | cellular response to zinc ion(GO:0071294) |
| 0.1 | 0.2 | GO:1901420 | negative regulation of response to alcohol(GO:1901420) |
| 0.1 | 0.3 | GO:0006398 | mRNA 3'-end processing by stem-loop binding and cleavage(GO:0006398) |
| 0.1 | 0.4 | GO:0043697 | dedifferentiation(GO:0043696) cell dedifferentiation(GO:0043697) |
| 0.0 | 0.5 | GO:0097116 | gephyrin clustering involved in postsynaptic density assembly(GO:0097116) |
| 0.0 | 0.3 | GO:1904684 | negative regulation of metalloendopeptidase activity(GO:1904684) |
| 0.0 | 0.1 | GO:0097156 | fasciculation of motor neuron axon(GO:0097156) |
| 0.0 | 0.5 | GO:0043587 | tongue morphogenesis(GO:0043587) |
| 0.0 | 0.2 | GO:0001555 | oocyte growth(GO:0001555) |
| 0.0 | 0.6 | GO:0060628 | regulation of ER to Golgi vesicle-mediated transport(GO:0060628) |
| 0.0 | 0.1 | GO:1901895 | regulation of the force of heart contraction by cardiac conduction(GO:0086092) regulation of calcium ion binding(GO:1901876) negative regulation of calcium ion binding(GO:1901877) negative regulation of calcium-transporting ATPase activity(GO:1901895) |
| 0.0 | 0.4 | GO:0007028 | cytoplasm organization(GO:0007028) |
| 0.0 | 0.1 | GO:1904430 | negative regulation of t-circle formation(GO:1904430) |
| 0.0 | 0.2 | GO:0051533 | positive regulation of NFAT protein import into nucleus(GO:0051533) |
| 0.0 | 0.3 | GO:2000189 | positive regulation of cholesterol homeostasis(GO:2000189) |
| 0.0 | 0.1 | GO:0072276 | metanephric glomerulus morphogenesis(GO:0072275) metanephric glomerulus vasculature morphogenesis(GO:0072276) metanephric glomerular capillary formation(GO:0072277) |
| 0.0 | 0.3 | GO:0098908 | regulation of neuronal action potential(GO:0098908) |
| 0.0 | 0.6 | GO:0060044 | negative regulation of cardiac muscle cell proliferation(GO:0060044) |
| 0.0 | 0.2 | GO:0090204 | protein localization to nuclear pore(GO:0090204) |
| 0.0 | 0.3 | GO:0098814 | spontaneous neurotransmitter secretion(GO:0061669) spontaneous synaptic transmission(GO:0098814) |
| 0.0 | 0.3 | GO:0061179 | negative regulation of insulin secretion involved in cellular response to glucose stimulus(GO:0061179) |
| 0.0 | 0.3 | GO:0045964 | positive regulation of catecholamine metabolic process(GO:0045915) positive regulation of dopamine metabolic process(GO:0045964) |
| 0.0 | 0.3 | GO:0010265 | SCF complex assembly(GO:0010265) |
| 0.0 | 0.2 | GO:2000786 | positive regulation of autophagosome assembly(GO:2000786) |
| 0.0 | 0.2 | GO:0086024 | adrenergic receptor signaling pathway involved in positive regulation of heart rate(GO:0086024) |
| 0.0 | 4.5 | GO:0007156 | homophilic cell adhesion via plasma membrane adhesion molecules(GO:0007156) |
| 0.0 | 0.8 | GO:0000729 | DNA double-strand break processing(GO:0000729) |
| 0.0 | 0.4 | GO:0071786 | endoplasmic reticulum tubular network organization(GO:0071786) |
| 0.0 | 0.1 | GO:0045629 | negative regulation of T-helper 2 cell differentiation(GO:0045629) |
| 0.0 | 0.8 | GO:0048665 | neuron fate specification(GO:0048665) |
| 0.0 | 0.3 | GO:0010990 | regulation of SMAD protein complex assembly(GO:0010990) negative regulation of SMAD protein complex assembly(GO:0010991) |
| 0.0 | 0.2 | GO:0061088 | regulation of sequestering of zinc ion(GO:0061088) |
| 0.0 | 0.1 | GO:0045048 | protein insertion into ER membrane(GO:0045048) |
| 0.0 | 0.9 | GO:0016577 | histone demethylation(GO:0016577) |
| 0.0 | 0.2 | GO:0098700 | neurotransmitter loading into synaptic vesicle(GO:0098700) |
| 0.0 | 0.3 | GO:0070102 | interleukin-6-mediated signaling pathway(GO:0070102) |
| 0.0 | 0.2 | GO:1990403 | embryonic brain development(GO:1990403) |
| 0.0 | 0.1 | GO:0060013 | righting reflex(GO:0060013) |
| 0.0 | 0.5 | GO:0036152 | phosphatidylethanolamine acyl-chain remodeling(GO:0036152) |
| 0.0 | 0.2 | GO:1901843 | positive regulation of high voltage-gated calcium channel activity(GO:1901843) |
| 0.0 | 0.1 | GO:0046619 | optic placode formation involved in camera-type eye formation(GO:0046619) |
| 0.0 | 0.1 | GO:1901897 | regulation of relaxation of cardiac muscle(GO:1901897) |
| 0.0 | 0.1 | GO:0050882 | voluntary musculoskeletal movement(GO:0050882) |
| 0.0 | 0.1 | GO:0018095 | protein polyglutamylation(GO:0018095) |
| 0.0 | 0.3 | GO:0070831 | basement membrane assembly(GO:0070831) |
| 0.0 | 0.2 | GO:0000098 | sulfur amino acid catabolic process(GO:0000098) |
| 0.0 | 0.1 | GO:0001878 | response to yeast(GO:0001878) |
| 0.0 | 0.3 | GO:2000785 | regulation of autophagosome assembly(GO:2000785) |
| 0.0 | 0.1 | GO:0051791 | medium-chain fatty acid metabolic process(GO:0051791) |
| 0.0 | 0.5 | GO:0006198 | cAMP catabolic process(GO:0006198) |
| 0.0 | 0.1 | GO:0010172 | embryonic body morphogenesis(GO:0010172) |
Gene overrepresentation in cellular component category:
| Log-likelihood per target | Total log-likelihood | Term | Description |
|---|---|---|---|
| 0.1 | 1.3 | GO:0031209 | SCAR complex(GO:0031209) |
| 0.1 | 0.3 | GO:0005606 | laminin-1 complex(GO:0005606) laminin-10 complex(GO:0043259) laminin-11 complex(GO:0043260) |
| 0.1 | 0.6 | GO:0035985 | senescence-associated heterochromatin focus(GO:0035985) |
| 0.1 | 0.8 | GO:0031371 | ubiquitin conjugating enzyme complex(GO:0031371) |
| 0.0 | 0.2 | GO:0071458 | integral component of cytoplasmic side of endoplasmic reticulum membrane(GO:0071458) |
| 0.0 | 0.3 | GO:0031467 | Cul7-RING ubiquitin ligase complex(GO:0031467) |
| 0.0 | 0.5 | GO:0043083 | synaptic cleft(GO:0043083) |
| 0.0 | 0.6 | GO:0016580 | Sin3 complex(GO:0016580) |
| 0.0 | 0.4 | GO:0033643 | host cell part(GO:0033643) |
| 0.0 | 0.2 | GO:0070775 | H3 histone acetyltransferase complex(GO:0070775) MOZ/MORF histone acetyltransferase complex(GO:0070776) |
| 0.0 | 0.3 | GO:0005847 | mRNA cleavage and polyadenylation specificity factor complex(GO:0005847) |
| 0.0 | 0.2 | GO:0044666 | MLL3/4 complex(GO:0044666) |
| 0.0 | 1.1 | GO:0043198 | dendritic shaft(GO:0043198) |
| 0.0 | 0.4 | GO:0071782 | endoplasmic reticulum tubular network(GO:0071782) |
| 0.0 | 0.3 | GO:0035631 | CD40 receptor complex(GO:0035631) |
| 0.0 | 0.6 | GO:0046658 | anchored component of plasma membrane(GO:0046658) |
| 0.0 | 1.4 | GO:0043195 | terminal bouton(GO:0043195) |
| 0.0 | 0.2 | GO:0005662 | DNA replication factor A complex(GO:0005662) |
| 0.0 | 0.1 | GO:0016602 | CCAAT-binding factor complex(GO:0016602) |
| 0.0 | 0.3 | GO:0016342 | catenin complex(GO:0016342) |
| 0.0 | 0.3 | GO:0043194 | axon initial segment(GO:0043194) |
| 0.0 | 0.4 | GO:0030057 | desmosome(GO:0030057) |
| 0.0 | 0.2 | GO:0005883 | neurofilament(GO:0005883) |
| 0.0 | 0.1 | GO:0070187 | telosome(GO:0070187) |
| 0.0 | 0.1 | GO:0005879 | axonemal microtubule(GO:0005879) |
| 0.0 | 0.2 | GO:0044613 | nuclear pore central transport channel(GO:0044613) |
| 0.0 | 0.5 | GO:0019005 | SCF ubiquitin ligase complex(GO:0019005) |
Gene overrepresentation in molecular function category:
| Log-likelihood per target | Total log-likelihood | Term | Description |
|---|---|---|---|
| 0.7 | 2.0 | GO:0008427 | calcium-dependent protein kinase inhibitor activity(GO:0008427) |
| 0.1 | 0.4 | GO:0031849 | olfactory receptor binding(GO:0031849) |
| 0.1 | 0.6 | GO:0004677 | DNA-dependent protein kinase activity(GO:0004677) |
| 0.1 | 0.3 | GO:0036505 | prosaposin receptor activity(GO:0036505) |
| 0.1 | 1.0 | GO:0039706 | co-receptor binding(GO:0039706) |
| 0.1 | 0.5 | GO:0016802 | adenosylhomocysteinase activity(GO:0004013) trialkylsulfonium hydrolase activity(GO:0016802) |
| 0.1 | 0.4 | GO:0098770 | FBXO family protein binding(GO:0098770) |
| 0.1 | 1.2 | GO:0015379 | potassium:chloride symporter activity(GO:0015379) potassium ion symporter activity(GO:0022820) |
| 0.1 | 0.2 | GO:0030226 | apolipoprotein receptor activity(GO:0030226) |
| 0.1 | 0.3 | GO:0042282 | hydroxymethylglutaryl-CoA reductase (NADPH) activity(GO:0004420) hydroxymethylglutaryl-CoA reductase activity(GO:0042282) |
| 0.1 | 0.2 | GO:0016309 | 1-phosphatidylinositol-5-phosphate 4-kinase activity(GO:0016309) |
| 0.1 | 0.5 | GO:0047144 | 2-acylglycerol-3-phosphate O-acyltransferase activity(GO:0047144) |
| 0.0 | 0.4 | GO:0032036 | myosin heavy chain binding(GO:0032036) |
| 0.0 | 0.2 | GO:0042500 | aspartic endopeptidase activity, intramembrane cleaving(GO:0042500) |
| 0.0 | 0.1 | GO:0005017 | platelet-derived growth factor-activated receptor activity(GO:0005017) |
| 0.0 | 0.3 | GO:0015272 | ATP-activated inward rectifier potassium channel activity(GO:0015272) |
| 0.0 | 1.5 | GO:0032451 | demethylase activity(GO:0032451) |
| 0.0 | 1.4 | GO:0003785 | actin monomer binding(GO:0003785) |
| 0.0 | 0.1 | GO:0042030 | ATPase inhibitor activity(GO:0042030) |
| 0.0 | 0.2 | GO:0030160 | GKAP/Homer scaffold activity(GO:0030160) |
| 0.0 | 0.1 | GO:0031862 | prostanoid receptor binding(GO:0031862) |
| 0.0 | 0.5 | GO:0033130 | acetylcholine receptor binding(GO:0033130) |
| 0.0 | 0.4 | GO:0038191 | neuropilin binding(GO:0038191) |
| 0.0 | 0.3 | GO:0034713 | type I transforming growth factor beta receptor binding(GO:0034713) |
| 0.0 | 0.1 | GO:0070740 | tubulin-glutamic acid ligase activity(GO:0070740) |
| 0.0 | 0.2 | GO:0046935 | 1-phosphatidylinositol-3-kinase regulator activity(GO:0046935) |
| 0.0 | 0.1 | GO:0086059 | voltage-gated calcium channel activity involved SA node cell action potential(GO:0086059) |
| 0.0 | 0.8 | GO:0061631 | ubiquitin conjugating enzyme activity(GO:0061631) |
| 0.0 | 0.1 | GO:0004594 | pantothenate kinase activity(GO:0004594) |
| 0.0 | 0.3 | GO:0031996 | thioesterase binding(GO:0031996) |
| 0.0 | 0.1 | GO:0004652 | polynucleotide adenylyltransferase activity(GO:0004652) |
| 0.0 | 0.2 | GO:1990247 | N6-methyladenosine-containing RNA binding(GO:1990247) |
| 0.0 | 0.7 | GO:0004115 | 3',5'-cyclic-AMP phosphodiesterase activity(GO:0004115) |
| 0.0 | 1.3 | GO:0048365 | Rac GTPase binding(GO:0048365) |
| 0.0 | 0.1 | GO:0042731 | PH domain binding(GO:0042731) |
| 0.0 | 0.6 | GO:0001106 | RNA polymerase II transcription corepressor activity(GO:0001106) |
| 0.0 | 0.3 | GO:0008191 | metalloendopeptidase inhibitor activity(GO:0008191) |
| 0.0 | 0.2 | GO:0042800 | histone methyltransferase activity (H3-K4 specific)(GO:0042800) |
| 0.0 | 0.1 | GO:0016406 | carnitine O-acyltransferase activity(GO:0016406) |
| 0.0 | 0.1 | GO:0004723 | calcium-dependent protein serine/threonine phosphatase activity(GO:0004723) |
| 0.0 | 0.1 | GO:0015277 | kainate selective glutamate receptor activity(GO:0015277) |
Gene overrepresentation in curated gene sets: canonical pathways category:
| Log-likelihood per target | Total log-likelihood | Term | Description |
|---|---|---|---|
| 0.0 | 1.0 | PID WNT SIGNALING PATHWAY | Wnt signaling network |
| 0.0 | 0.6 | PID HEDGEHOG 2PATHWAY | Signaling events mediated by the Hedgehog family |
| 0.0 | 1.2 | PID ECADHERIN NASCENT AJ PATHWAY | E-cadherin signaling in the nascent adherens junction |
| 0.0 | 0.9 | SIG REGULATION OF THE ACTIN CYTOSKELETON BY RHO GTPASES | Genes related to regulation of the actin cytoskeleton |
| 0.0 | 0.3 | PID INTEGRIN4 PATHWAY | Alpha6 beta4 integrin-ligand interactions |
Gene overrepresentation in curated gene sets: REACTOME pathways category:
| Log-likelihood per target | Total log-likelihood | Term | Description |
|---|---|---|---|
| 0.0 | 1.4 | REACTOME SIGNALING BY ROBO RECEPTOR | Genes involved in Signaling by Robo receptor |
| 0.0 | 0.5 | REACTOME ACYL CHAIN REMODELLING OF PE | Genes involved in Acyl chain remodelling of PE |
| 0.0 | 0.3 | REACTOME SEMA3A PLEXIN REPULSION SIGNALING BY INHIBITING INTEGRIN ADHESION | Genes involved in SEMA3A-Plexin repulsion signaling by inhibiting Integrin adhesion |
| 0.0 | 0.3 | REACTOME PROCESSING OF INTRONLESS PRE MRNAS | Genes involved in Processing of Intronless Pre-mRNAs |
| 0.0 | 0.3 | REACTOME TRAF3 DEPENDENT IRF ACTIVATION PATHWAY | Genes involved in TRAF3-dependent IRF activation pathway |
| 0.0 | 0.1 | REACTOME PACKAGING OF TELOMERE ENDS | Genes involved in Packaging Of Telomere Ends |