Project
GNF SymAtlas + NCI-60 cancer cell lines, human (Su, 2004; Ross, 2000)
Navigation
Downloads
Results for UGUGCGU
Z-value: 0.06
Motif logo

miRNA associated with seed UGUGCGU
| Name | miRBASE accession |
|---|---|
|
hsa-miR-210-3p
|
MIMAT0000267 |
Activity profile of UGUGCGU motif
Sorted Z-values of UGUGCGU motif
Network of associatons between targets according to the STRING database.

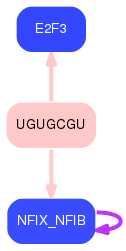
First level regulatory network of UGUGCGU
Gene Ontology Analysis
Gene overrepresentation in biological process category:
| Log-likelihood per target | Total log-likelihood | Term | Description |
|---|---|---|---|
| 0.1 | 0.2 | GO:0090038 | negative regulation of protein kinase C signaling(GO:0090038) |
| 0.0 | 0.4 | GO:0009650 | UV protection(GO:0009650) |
| 0.0 | 0.2 | GO:0006123 | mitochondrial electron transport, cytochrome c to oxygen(GO:0006123) |
| 0.0 | 0.1 | GO:0070345 | negative regulation of fat cell proliferation(GO:0070345) |
Gene overrepresentation in cellular component category:
| Log-likelihood per target | Total log-likelihood | Term | Description |
|---|---|---|---|
| 0.0 | 0.2 | GO:0009331 | glycerol-3-phosphate dehydrogenase complex(GO:0009331) |
| 0.0 | 0.2 | GO:0005751 | mitochondrial respiratory chain complex IV(GO:0005751) |
Gene overrepresentation in molecular function category:
| Log-likelihood per target | Total log-likelihood | Term | Description |
|---|---|---|---|
| 0.0 | 0.1 | GO:0003831 | beta-N-acetylglucosaminylglycopeptide beta-1,4-galactosyltransferase activity(GO:0003831) |