| 45.5 |
136.5 |
GO:0051939 |
gamma-aminobutyric acid import(GO:0051939) |
| 44.3 |
132.8 |
GO:0001869 |
regulation of complement activation, lectin pathway(GO:0001868) negative regulation of complement activation, lectin pathway(GO:0001869) |
| 34.5 |
172.5 |
GO:1902847 |
regulation of neuronal signal transduction(GO:1902847) positive regulation of neurofibrillary tangle assembly(GO:1902998) |
| 34.0 |
578.2 |
GO:0090360 |
platelet-derived growth factor production(GO:0090360) regulation of platelet-derived growth factor production(GO:0090361) |
| 33.4 |
133.8 |
GO:0031117 |
positive regulation of microtubule depolymerization(GO:0031117) |
| 30.6 |
520.2 |
GO:0007021 |
tubulin complex assembly(GO:0007021) |
| 29.3 |
117.3 |
GO:0033693 |
neurofilament bundle assembly(GO:0033693) |
| 29.0 |
87.0 |
GO:0006982 |
response to lipid hydroperoxide(GO:0006982) |
| 27.3 |
81.9 |
GO:0051941 |
regulation of amino acid uptake involved in synaptic transmission(GO:0051941) regulation of glutamate uptake involved in transmission of nerve impulse(GO:0051946) regulation of L-glutamate import(GO:1900920) |
| 26.8 |
187.5 |
GO:0070560 |
protein secretion by platelet(GO:0070560) |
| 23.3 |
23.3 |
GO:0021957 |
corticospinal tract morphogenesis(GO:0021957) |
| 22.9 |
68.8 |
GO:0050760 |
negative regulation of thymidylate synthase biosynthetic process(GO:0050760) |
| 22.6 |
90.3 |
GO:0003331 |
regulation of extracellular matrix constituent secretion(GO:0003330) positive regulation of extracellular matrix constituent secretion(GO:0003331) |
| 22.3 |
178.7 |
GO:0070235 |
regulation of activation-induced cell death of T cells(GO:0070235) negative regulation of activation-induced cell death of T cells(GO:0070236) |
| 22.2 |
66.5 |
GO:1904692 |
positive regulation of type B pancreatic cell proliferation(GO:1904692) |
| 21.2 |
63.5 |
GO:0060988 |
lipid tube assembly(GO:0060988) |
| 20.8 |
62.4 |
GO:0002416 |
IgG immunoglobulin transcytosis in epithelial cells mediated by FcRn immunoglobulin receptor(GO:0002416) |
| 19.6 |
98.2 |
GO:0044855 |
plasma membrane raft distribution(GO:0044855) plasma membrane raft localization(GO:0044856) plasma membrane raft polarization(GO:0044858) regulation of plasma membrane raft polarization(GO:1903906) |
| 19.4 |
77.7 |
GO:0010900 |
negative regulation of phosphatidylcholine catabolic process(GO:0010900) |
| 19.1 |
57.4 |
GO:1904397 |
negative regulation of neuromuscular junction development(GO:1904397) |
| 19.1 |
114.7 |
GO:0060313 |
negative regulation of blood vessel remodeling(GO:0060313) |
| 18.8 |
94.0 |
GO:0002904 |
positive regulation of B cell apoptotic process(GO:0002904) |
| 18.8 |
56.3 |
GO:0072275 |
metanephric glomerulus morphogenesis(GO:0072275) metanephric glomerulus vasculature morphogenesis(GO:0072276) metanephric glomerular capillary formation(GO:0072277) |
| 18.6 |
37.2 |
GO:0071879 |
positive regulation of adrenergic receptor signaling pathway(GO:0071879) |
| 18.6 |
93.0 |
GO:1990262 |
regulation of anti-Mullerian hormone signaling pathway(GO:1902612) negative regulation of anti-Mullerian hormone signaling pathway(GO:1902613) anti-Mullerian hormone signaling pathway(GO:1990262) |
| 18.5 |
74.1 |
GO:1902530 |
regulation of protein linear polyubiquitination(GO:1902528) positive regulation of protein linear polyubiquitination(GO:1902530) |
| 18.4 |
55.3 |
GO:0071494 |
cellular response to UV-C(GO:0071494) |
| 18.2 |
54.6 |
GO:0070317 |
negative regulation of G0 to G1 transition(GO:0070317) |
| 18.0 |
72.1 |
GO:0019072 |
viral genome packaging(GO:0019072) viral RNA genome packaging(GO:0019074) |
| 17.9 |
71.7 |
GO:0014053 |
negative regulation of gamma-aminobutyric acid secretion(GO:0014053) aspartate secretion(GO:0061528) regulation of aspartate secretion(GO:1904448) positive regulation of aspartate secretion(GO:1904450) |
| 17.9 |
107.2 |
GO:0030644 |
cellular chloride ion homeostasis(GO:0030644) |
| 17.5 |
157.9 |
GO:0002175 |
protein localization to paranode region of axon(GO:0002175) |
| 17.3 |
17.3 |
GO:1900274 |
regulation of phospholipase C activity(GO:1900274) |
| 16.6 |
33.3 |
GO:0001794 |
type IIa hypersensitivity(GO:0001794) regulation of type IIa hypersensitivity(GO:0001796) type II hypersensitivity(GO:0002445) regulation of type II hypersensitivity(GO:0002892) |
| 16.3 |
65.1 |
GO:0033159 |
negative regulation of protein import into nucleus, translocation(GO:0033159) |
| 16.0 |
48.1 |
GO:0061760 |
antifungal innate immune response(GO:0061760) |
| 15.7 |
94.4 |
GO:0035633 |
maintenance of blood-brain barrier(GO:0035633) |
| 15.4 |
46.1 |
GO:0007181 |
transforming growth factor beta receptor complex assembly(GO:0007181) |
| 15.4 |
30.7 |
GO:2000820 |
negative regulation of transcription from RNA polymerase II promoter involved in smooth muscle cell differentiation(GO:2000820) |
| 15.3 |
46.0 |
GO:0014813 |
skeletal muscle satellite cell commitment(GO:0014813) |
| 15.3 |
45.8 |
GO:0030185 |
nitric oxide transport(GO:0030185) |
| 15.0 |
15.0 |
GO:1900226 |
negative regulation of NLRP3 inflammasome complex assembly(GO:1900226) |
| 14.6 |
145.9 |
GO:0097647 |
calcitonin family receptor signaling pathway(GO:0097646) amylin receptor signaling pathway(GO:0097647) |
| 14.5 |
86.8 |
GO:0038016 |
insulin receptor internalization(GO:0038016) |
| 14.5 |
43.4 |
GO:0043012 |
regulation of fusion of sperm to egg plasma membrane(GO:0043012) |
| 14.4 |
57.5 |
GO:1901339 |
regulation of store-operated calcium channel activity(GO:1901339) |
| 14.3 |
57.3 |
GO:1904980 |
positive regulation of endosome organization(GO:1904980) |
| 14.1 |
70.4 |
GO:0031630 |
regulation of synaptic vesicle fusion to presynaptic membrane(GO:0031630) |
| 14.0 |
14.0 |
GO:1904933 |
regulation of cell proliferation in midbrain(GO:1904933) |
| 13.9 |
180.5 |
GO:2001199 |
negative regulation of dendritic cell differentiation(GO:2001199) |
| 13.8 |
13.8 |
GO:0036090 |
cleavage furrow ingression(GO:0036090) |
| 13.8 |
55.2 |
GO:1903631 |
regulation of calcium-dependent ATPase activity(GO:1903610) negative regulation of calcium-dependent ATPase activity(GO:1903611) regulation of dUTP diphosphatase activity(GO:1903627) positive regulation of dUTP diphosphatase activity(GO:1903629) negative regulation of aminoacyl-tRNA ligase activity(GO:1903631) regulation of leucine-tRNA ligase activity(GO:1903633) negative regulation of leucine-tRNA ligase activity(GO:1903634) |
| 13.7 |
41.2 |
GO:1900275 |
negative regulation of phospholipase C activity(GO:1900275) |
| 13.7 |
13.7 |
GO:0045987 |
positive regulation of smooth muscle contraction(GO:0045987) |
| 13.7 |
123.3 |
GO:0071673 |
positive regulation of smooth muscle cell chemotaxis(GO:0071673) |
| 13.7 |
27.4 |
GO:0002884 |
negative regulation of hypersensitivity(GO:0002884) |
| 13.7 |
13.7 |
GO:0050666 |
regulation of sulfur amino acid metabolic process(GO:0031335) regulation of homocysteine metabolic process(GO:0050666) |
| 13.6 |
40.7 |
GO:1903279 |
regulation of calcium:sodium antiporter activity(GO:1903279) |
| 13.5 |
54.1 |
GO:0036369 |
transcription factor catabolic process(GO:0036369) |
| 13.2 |
13.2 |
GO:0036146 |
cellular response to mycotoxin(GO:0036146) |
| 13.1 |
39.4 |
GO:0090341 |
negative regulation of secretion of lysosomal enzymes(GO:0090341) |
| 13.1 |
39.4 |
GO:1902283 |
negative regulation of primary amine oxidase activity(GO:1902283) |
| 13.1 |
52.5 |
GO:0051866 |
general adaptation syndrome(GO:0051866) |
| 12.8 |
38.4 |
GO:0072365 |
regulation of cellular ketone metabolic process by negative regulation of transcription from RNA polymerase II promoter(GO:0072365) |
| 12.8 |
63.9 |
GO:2001076 |
regulation of metanephric ureteric bud development(GO:2001074) positive regulation of metanephric ureteric bud development(GO:2001076) |
| 12.6 |
37.9 |
GO:2000296 |
negative regulation of hydrogen peroxide catabolic process(GO:2000296) |
| 12.6 |
12.6 |
GO:1900109 |
regulation of histone H3-K9 dimethylation(GO:1900109) |
| 12.5 |
37.4 |
GO:0070846 |
misfolded protein transport(GO:0070843) polyubiquitinated protein transport(GO:0070844) polyubiquitinated misfolded protein transport(GO:0070845) Hsp90 deacetylation(GO:0070846) |
| 12.4 |
62.0 |
GO:0014052 |
regulation of gamma-aminobutyric acid secretion(GO:0014052) |
| 12.2 |
48.8 |
GO:0035054 |
embryonic heart tube anterior/posterior pattern specification(GO:0035054) |
| 12.1 |
24.3 |
GO:0044782 |
cilium organization(GO:0044782) |
| 12.1 |
12.1 |
GO:0075071 |
autophagy of host cells involved in interaction with symbiont(GO:0075044) autophagy involved in symbiotic interaction(GO:0075071) |
| 12.0 |
155.9 |
GO:0086036 |
regulation of cardiac muscle cell membrane potential(GO:0086036) |
| 11.9 |
59.5 |
GO:0032849 |
positive regulation of cellular pH reduction(GO:0032849) |
| 11.9 |
35.6 |
GO:2001151 |
regulation of renal water transport(GO:2001151) positive regulation of renal water transport(GO:2001153) |
| 11.7 |
35.2 |
GO:0014016 |
neuroblast differentiation(GO:0014016) |
| 11.7 |
11.7 |
GO:0002865 |
negative regulation of acute inflammatory response to antigenic stimulus(GO:0002865) |
| 11.6 |
23.3 |
GO:0050802 |
circadian sleep/wake cycle, sleep(GO:0050802) |
| 11.6 |
162.3 |
GO:0060371 |
regulation of atrial cardiac muscle cell membrane depolarization(GO:0060371) |
| 11.6 |
162.0 |
GO:0048712 |
negative regulation of astrocyte differentiation(GO:0048712) |
| 11.6 |
23.1 |
GO:0044333 |
Wnt signaling pathway involved in digestive tract morphogenesis(GO:0044333) |
| 11.5 |
34.6 |
GO:0014850 |
response to muscle activity(GO:0014850) |
| 11.5 |
115.2 |
GO:2000427 |
positive regulation of apoptotic cell clearance(GO:2000427) |
| 11.5 |
34.4 |
GO:0042137 |
sequestering of neurotransmitter(GO:0042137) |
| 11.4 |
137.1 |
GO:0051581 |
negative regulation of neurotransmitter uptake(GO:0051581) regulation of serotonin uptake(GO:0051611) negative regulation of serotonin uptake(GO:0051612) |
| 11.4 |
34.2 |
GO:0090285 |
negative regulation of protein glycosylation in Golgi(GO:0090285) |
| 11.3 |
22.6 |
GO:1902722 |
positive regulation of prolactin secretion(GO:1902722) |
| 11.2 |
33.6 |
GO:0099558 |
maintenance of synapse structure(GO:0099558) |
| 11.1 |
33.4 |
GO:1901628 |
positive regulation of postsynaptic membrane organization(GO:1901628) |
| 11.1 |
11.1 |
GO:1900452 |
regulation of long term synaptic depression(GO:1900452) |
| 10.9 |
32.8 |
GO:0033602 |
negative regulation of dopamine secretion(GO:0033602) |
| 10.9 |
65.3 |
GO:1902988 |
neurofibrillary tangle assembly(GO:1902988) |
| 10.8 |
10.8 |
GO:0014049 |
positive regulation of glutamate secretion(GO:0014049) |
| 10.7 |
171.7 |
GO:0070445 |
oligodendrocyte progenitor proliferation(GO:0070444) regulation of oligodendrocyte progenitor proliferation(GO:0070445) |
| 10.6 |
42.6 |
GO:0002399 |
MHC class II protein complex assembly(GO:0002399) |
| 10.6 |
42.3 |
GO:0019355 |
nicotinamide nucleotide biosynthetic process from aspartate(GO:0019355) 'de novo' NAD biosynthetic process(GO:0034627) 'de novo' NAD biosynthetic process from aspartate(GO:0034628) |
| 10.5 |
21.1 |
GO:1901074 |
regulation of engulfment of apoptotic cell(GO:1901074) |
| 10.4 |
20.9 |
GO:1904616 |
regulation of actin filament binding(GO:1904529) regulation of actin binding(GO:1904616) |
| 10.4 |
93.9 |
GO:0003190 |
atrioventricular valve formation(GO:0003190) |
| 10.4 |
20.9 |
GO:0007354 |
zygotic determination of anterior/posterior axis, embryo(GO:0007354) |
| 10.4 |
62.4 |
GO:0051138 |
positive regulation of NK T cell differentiation(GO:0051138) |
| 10.3 |
144.5 |
GO:2001135 |
regulation of endocytic recycling(GO:2001135) |
| 10.3 |
51.4 |
GO:0061762 |
CAMKK-AMPK signaling cascade(GO:0061762) |
| 10.3 |
10.3 |
GO:0048852 |
hypophysis morphogenesis(GO:0048850) diencephalon morphogenesis(GO:0048852) |
| 10.3 |
20.5 |
GO:0090182 |
regulation of secretion of lysosomal enzymes(GO:0090182) |
| 10.2 |
30.7 |
GO:0072134 |
nephrogenic mesenchyme morphogenesis(GO:0072134) |
| 10.2 |
20.5 |
GO:0046878 |
positive regulation of saliva secretion(GO:0046878) |
| 10.1 |
40.5 |
GO:1900738 |
positive regulation of phospholipase C-activating G-protein coupled receptor signaling pathway(GO:1900738) |
| 10.1 |
10.1 |
GO:0071284 |
cellular response to lead ion(GO:0071284) |
| 10.0 |
20.0 |
GO:0010807 |
regulation of synaptic vesicle priming(GO:0010807) |
| 9.9 |
19.8 |
GO:0098915 |
membrane repolarization during ventricular cardiac muscle cell action potential(GO:0098915) |
| 9.9 |
29.7 |
GO:0070079 |
peptidyl-lysine hydroxylation to 5-hydroxy-L-lysine(GO:0018395) histone arginine demethylation(GO:0070077) histone H3-R2 demethylation(GO:0070078) histone H4-R3 demethylation(GO:0070079) |
| 9.9 |
59.2 |
GO:0035469 |
determination of pancreatic left/right asymmetry(GO:0035469) |
| 9.8 |
9.8 |
GO:0019482 |
beta-alanine metabolic process(GO:0019482) |
| 9.8 |
58.7 |
GO:0071874 |
cellular response to norepinephrine stimulus(GO:0071874) |
| 9.8 |
19.5 |
GO:0010645 |
regulation of cell communication by chemical coupling(GO:0010645) positive regulation of cell communication by chemical coupling(GO:0010652) |
| 9.7 |
19.4 |
GO:0000189 |
MAPK import into nucleus(GO:0000189) |
| 9.7 |
9.7 |
GO:0002265 |
astrocyte activation involved in immune response(GO:0002265) |
| 9.7 |
67.9 |
GO:1990504 |
dense core granule exocytosis(GO:1990504) |
| 9.7 |
19.4 |
GO:0051885 |
positive regulation of anagen(GO:0051885) |
| 9.7 |
67.6 |
GO:0034587 |
piRNA metabolic process(GO:0034587) |
| 9.7 |
38.6 |
GO:0034443 |
negative regulation of lipoprotein oxidation(GO:0034443) |
| 9.6 |
28.9 |
GO:0071139 |
resolution of recombination intermediates(GO:0071139) resolution of mitotic recombination intermediates(GO:0071140) |
| 9.6 |
67.3 |
GO:0032100 |
positive regulation of response to food(GO:0032097) positive regulation of appetite(GO:0032100) |
| 9.6 |
67.0 |
GO:0060770 |
negative regulation of epithelial cell proliferation involved in prostate gland development(GO:0060770) |
| 9.5 |
28.4 |
GO:0003218 |
cardiac left ventricle formation(GO:0003218) |
| 9.4 |
37.7 |
GO:0070426 |
positive regulation of nucleotide-binding oligomerization domain containing signaling pathway(GO:0070426) positive regulation of nucleotide-binding oligomerization domain containing 2 signaling pathway(GO:0070434) |
| 9.4 |
94.0 |
GO:0019227 |
neuronal action potential propagation(GO:0019227) action potential propagation(GO:0098870) |
| 9.4 |
47.0 |
GO:2001181 |
positive regulation of interleukin-10 secretion(GO:2001181) |
| 9.4 |
47.0 |
GO:0071727 |
toll-like receptor TLR1:TLR2 signaling pathway(GO:0038123) response to triacyl bacterial lipopeptide(GO:0071725) cellular response to triacyl bacterial lipopeptide(GO:0071727) |
| 9.4 |
46.8 |
GO:0015891 |
iron chelate transport(GO:0015688) siderophore transport(GO:0015891) |
| 9.4 |
37.4 |
GO:0046968 |
peptide antigen transport(GO:0046968) |
| 9.4 |
28.1 |
GO:2000053 |
regulation of Wnt signaling pathway involved in dorsal/ventral axis specification(GO:2000053) |
| 9.3 |
28.0 |
GO:1990168 |
protein K33-linked deubiquitination(GO:1990168) |
| 9.3 |
37.3 |
GO:0010650 |
positive regulation of cell communication by electrical coupling(GO:0010650) maintenance of protein location in membrane(GO:0072658) maintenance of protein location in plasma membrane(GO:0072660) positive regulation of membrane depolarization during cardiac muscle cell action potential(GO:1900827) |
| 9.3 |
129.6 |
GO:1902548 |
negative regulation of cellular response to vascular endothelial growth factor stimulus(GO:1902548) |
| 9.2 |
64.4 |
GO:1902075 |
cellular response to salt(GO:1902075) |
| 9.1 |
100.6 |
GO:0048172 |
regulation of short-term neuronal synaptic plasticity(GO:0048172) |
| 9.0 |
36.1 |
GO:0006542 |
glutamine biosynthetic process(GO:0006542) |
| 9.0 |
36.1 |
GO:0006562 |
proline catabolic process(GO:0006562) |
| 8.9 |
26.7 |
GO:1904582 |
regulation of intracellular mRNA localization(GO:1904580) positive regulation of intracellular mRNA localization(GO:1904582) |
| 8.9 |
35.6 |
GO:0045409 |
negative regulation of interleukin-6 biosynthetic process(GO:0045409) |
| 8.9 |
44.5 |
GO:0018352 |
protein-pyridoxal-5-phosphate linkage(GO:0018352) |
| 8.9 |
26.6 |
GO:0002774 |
Fc receptor mediated inhibitory signaling pathway(GO:0002774) |
| 8.9 |
8.9 |
GO:0034146 |
toll-like receptor 5 signaling pathway(GO:0034146) |
| 8.9 |
35.4 |
GO:0006669 |
sphinganine-1-phosphate biosynthetic process(GO:0006669) |
| 8.8 |
17.5 |
GO:0086047 |
membrane depolarization during Purkinje myocyte cell action potential(GO:0086047) |
| 8.7 |
174.2 |
GO:0019371 |
cyclooxygenase pathway(GO:0019371) |
| 8.7 |
8.7 |
GO:0071947 |
protein deubiquitination involved in ubiquitin-dependent protein catabolic process(GO:0071947) |
| 8.7 |
8.7 |
GO:0070100 |
negative regulation of chemokine-mediated signaling pathway(GO:0070100) |
| 8.6 |
8.6 |
GO:0097017 |
renal protein absorption(GO:0097017) |
| 8.6 |
8.6 |
GO:0060353 |
regulation of cell adhesion molecule production(GO:0060353) positive regulation of cell adhesion molecule production(GO:0060355) |
| 8.6 |
8.6 |
GO:0001755 |
neural crest cell migration(GO:0001755) |
| 8.6 |
42.8 |
GO:0030070 |
insulin processing(GO:0030070) |
| 8.5 |
34.1 |
GO:0038042 |
dimeric G-protein coupled receptor signaling pathway(GO:0038042) |
| 8.5 |
34.1 |
GO:0061091 |
regulation of phospholipid translocation(GO:0061091) positive regulation of phospholipid translocation(GO:0061092) |
| 8.4 |
33.5 |
GO:0002408 |
myeloid dendritic cell chemotaxis(GO:0002408) |
| 8.4 |
8.4 |
GO:0060385 |
axonogenesis involved in innervation(GO:0060385) |
| 8.4 |
16.7 |
GO:0044821 |
meiotic telomere tethering at nuclear periphery(GO:0044821) meiotic attachment of telomere to nuclear envelope(GO:0070197) chromosome attachment to the nuclear envelope(GO:0097240) |
| 8.3 |
25.0 |
GO:0021913 |
regulation of transcription from RNA polymerase II promoter involved in ventral spinal cord interneuron specification(GO:0021913) |
| 8.3 |
8.3 |
GO:1902263 |
apoptotic process involved in embryonic digit morphogenesis(GO:1902263) |
| 8.3 |
24.9 |
GO:0060032 |
notochord regression(GO:0060032) |
| 8.3 |
41.5 |
GO:0042360 |
vitamin E metabolic process(GO:0042360) |
| 8.3 |
397.5 |
GO:0007214 |
gamma-aminobutyric acid signaling pathway(GO:0007214) |
| 8.3 |
24.8 |
GO:0055048 |
regulation of spindle elongation(GO:0032887) regulation of mitotic spindle elongation(GO:0032888) anastral spindle assembly(GO:0055048) protein localization to spindle pole body(GO:0071988) regulation of protein localization to spindle pole body(GO:1902363) positive regulation of protein localization to spindle pole body(GO:1902365) positive regulation of mitotic spindle elongation(GO:1902846) |
| 8.2 |
346.3 |
GO:0048791 |
calcium ion-regulated exocytosis of neurotransmitter(GO:0048791) |
| 8.2 |
8.2 |
GO:0030948 |
negative regulation of vascular endothelial growth factor receptor signaling pathway(GO:0030948) |
| 8.2 |
16.3 |
GO:2001186 |
negative regulation of CD8-positive, alpha-beta T cell activation(GO:2001186) |
| 8.2 |
8.2 |
GO:0048682 |
axon extension involved in regeneration(GO:0048677) sprouting of injured axon(GO:0048682) |
| 8.2 |
24.5 |
GO:0098758 |
response to interleukin-8(GO:0098758) cellular response to interleukin-8(GO:0098759) |
| 8.1 |
81.3 |
GO:0097113 |
AMPA glutamate receptor clustering(GO:0097113) glutamate receptor clustering(GO:0097688) |
| 8.1 |
97.4 |
GO:0046958 |
nonassociative learning(GO:0046958) |
| 8.1 |
24.3 |
GO:1902474 |
positive regulation of protein localization to synapse(GO:1902474) |
| 8.1 |
32.4 |
GO:2000313 |
fibroblast growth factor receptor signaling pathway involved in neural plate anterior/posterior pattern formation(GO:0060825) regulation of neural crest formation(GO:0090299) negative regulation of neural crest formation(GO:0090301) regulation of fibroblast growth factor receptor signaling pathway involved in neural plate anterior/posterior pattern formation(GO:2000313) negative regulation of fibroblast growth factor receptor signaling pathway involved in neural plate anterior/posterior pattern formation(GO:2000314) |
| 8.0 |
24.0 |
GO:0021999 |
neural plate anterior/posterior regionalization(GO:0021999) |
| 8.0 |
23.9 |
GO:0042412 |
taurine biosynthetic process(GO:0042412) |
| 7.9 |
15.8 |
GO:0035973 |
aggrephagy(GO:0035973) |
| 7.9 |
142.2 |
GO:0051823 |
regulation of synapse structural plasticity(GO:0051823) |
| 7.9 |
94.7 |
GO:1900112 |
regulation of histone H3-K9 trimethylation(GO:1900112) |
| 7.9 |
71.0 |
GO:1902902 |
negative regulation of autophagosome assembly(GO:1902902) |
| 7.9 |
55.1 |
GO:1903977 |
positive regulation of glial cell migration(GO:1903977) |
| 7.9 |
23.6 |
GO:1902809 |
skeletal muscle fiber differentiation(GO:0098528) regulation of skeletal muscle fiber differentiation(GO:1902809) |
| 7.8 |
46.9 |
GO:0071205 |
protein localization to juxtaparanode region of axon(GO:0071205) |
| 7.8 |
85.9 |
GO:0097091 |
synaptic vesicle clustering(GO:0097091) |
| 7.8 |
39.0 |
GO:0019732 |
antifungal humoral response(GO:0019732) |
| 7.8 |
62.2 |
GO:0060025 |
primary heart field specification(GO:0003138) sinoatrial valve development(GO:0003172) sinoatrial valve morphogenesis(GO:0003185) regulation of synaptic activity(GO:0060025) |
| 7.8 |
15.5 |
GO:0021966 |
corticospinal neuron axon guidance(GO:0021966) |
| 7.7 |
15.5 |
GO:0033591 |
response to L-ascorbic acid(GO:0033591) |
| 7.7 |
92.8 |
GO:0021979 |
hypothalamus cell differentiation(GO:0021979) |
| 7.7 |
7.7 |
GO:0060024 |
rhythmic synaptic transmission(GO:0060024) |
| 7.7 |
23.0 |
GO:0051414 |
response to cortisol(GO:0051414) |
| 7.6 |
83.7 |
GO:0097116 |
gephyrin clustering involved in postsynaptic density assembly(GO:0097116) |
| 7.6 |
15.2 |
GO:2000664 |
positive regulation of interleukin-5 secretion(GO:2000664) |
| 7.6 |
22.7 |
GO:0021722 |
superior olivary nucleus development(GO:0021718) superior olivary nucleus maturation(GO:0021722) |
| 7.5 |
7.5 |
GO:0031959 |
mineralocorticoid receptor signaling pathway(GO:0031959) |
| 7.5 |
30.1 |
GO:0051037 |
regulation of transcription involved in meiotic cell cycle(GO:0051037) |
| 7.5 |
37.6 |
GO:0001957 |
intramembranous ossification(GO:0001957) direct ossification(GO:0036072) |
| 7.5 |
7.5 |
GO:0048263 |
determination of dorsal identity(GO:0048263) |
| 7.5 |
14.9 |
GO:0060160 |
negative regulation of dopamine receptor signaling pathway(GO:0060160) |
| 7.5 |
37.3 |
GO:0071543 |
diadenosine polyphosphate catabolic process(GO:0015961) diphosphoinositol polyphosphate metabolic process(GO:0071543) diadenosine pentaphosphate metabolic process(GO:1901906) diadenosine pentaphosphate catabolic process(GO:1901907) diadenosine hexaphosphate metabolic process(GO:1901908) diadenosine hexaphosphate catabolic process(GO:1901909) adenosine 5'-(hexahydrogen pentaphosphate) metabolic process(GO:1901910) adenosine 5'-(hexahydrogen pentaphosphate) catabolic process(GO:1901911) |
| 7.4 |
14.8 |
GO:0007412 |
axon target recognition(GO:0007412) |
| 7.4 |
14.8 |
GO:1903116 |
positive regulation of actin filament-based movement(GO:1903116) |
| 7.4 |
22.1 |
GO:0009449 |
gamma-aminobutyric acid biosynthetic process(GO:0009449) |
| 7.4 |
22.1 |
GO:0099566 |
regulation of postsynaptic cytosolic calcium ion concentration(GO:0099566) |
| 7.3 |
21.9 |
GO:0098582 |
innate vocalization behavior(GO:0098582) |
| 7.3 |
21.8 |
GO:1904596 |
regulation of connective tissue replacement involved in inflammatory response wound healing(GO:1904596) negative regulation of connective tissue replacement involved in inflammatory response wound healing(GO:1904597) regulation of advanced glycation end-product receptor activity(GO:1904603) negative regulation of advanced glycation end-product receptor activity(GO:1904604) negative regulation of connective tissue replacement(GO:1905204) |
| 7.3 |
7.3 |
GO:0016340 |
calcium-dependent cell-matrix adhesion(GO:0016340) |
| 7.3 |
36.3 |
GO:0045872 |
positive regulation of rhodopsin gene expression(GO:0045872) |
| 7.3 |
7.3 |
GO:0043615 |
astrocyte cell migration(GO:0043615) |
| 7.3 |
14.5 |
GO:0055095 |
lipoprotein particle mediated signaling(GO:0055095) low-density lipoprotein particle mediated signaling(GO:0055096) |
| 7.2 |
14.5 |
GO:1902564 |
negative regulation of neutrophil activation(GO:1902564) negative regulation of eosinophil activation(GO:1902567) negative regulation of membrane invagination(GO:1905154) |
| 7.2 |
29.0 |
GO:0070278 |
extracellular matrix constituent secretion(GO:0070278) |
| 7.2 |
7.2 |
GO:0008628 |
hormone-mediated apoptotic signaling pathway(GO:0008628) |
| 7.2 |
7.2 |
GO:0032227 |
negative regulation of synaptic transmission, dopaminergic(GO:0032227) |
| 7.2 |
35.9 |
GO:0034959 |
substance P catabolic process(GO:0010814) calcitonin catabolic process(GO:0010816) endothelin maturation(GO:0034959) |
| 7.2 |
28.7 |
GO:0097676 |
histone H3-K36 dimethylation(GO:0097676) |
| 7.2 |
14.4 |
GO:0007538 |
primary sex determination(GO:0007538) |
| 7.1 |
42.7 |
GO:0033274 |
response to vitamin B2(GO:0033274) heterochromatin maintenance(GO:0070829) |
| 7.1 |
14.1 |
GO:0001978 |
regulation of systemic arterial blood pressure by carotid sinus baroreceptor feedback(GO:0001978) baroreceptor response to increased systemic arterial blood pressure(GO:0001983) |
| 7.1 |
28.2 |
GO:1990414 |
replication-born double-strand break repair via sister chromatid exchange(GO:1990414) |
| 7.1 |
98.8 |
GO:0032291 |
central nervous system myelination(GO:0022010) axon ensheathment in central nervous system(GO:0032291) |
| 7.0 |
7.0 |
GO:0070316 |
regulation of G0 to G1 transition(GO:0070316) |
| 7.0 |
7.0 |
GO:0070309 |
lens fiber cell morphogenesis(GO:0070309) |
| 7.0 |
77.2 |
GO:0097011 |
cellular response to granulocyte macrophage colony-stimulating factor stimulus(GO:0097011) response to granulocyte macrophage colony-stimulating factor(GO:0097012) |
| 7.0 |
42.0 |
GO:0001554 |
luteolysis(GO:0001554) |
| 7.0 |
7.0 |
GO:0048861 |
leukemia inhibitory factor signaling pathway(GO:0048861) |
| 7.0 |
90.6 |
GO:0007196 |
adenylate cyclase-inhibiting G-protein coupled glutamate receptor signaling pathway(GO:0007196) |
| 7.0 |
34.8 |
GO:0033058 |
directional locomotion(GO:0033058) |
| 6.9 |
27.7 |
GO:0019086 |
late viral transcription(GO:0019086) |
| 6.9 |
20.8 |
GO:0010847 |
regulation of chromatin assembly(GO:0010847) |
| 6.9 |
20.8 |
GO:0008065 |
establishment of blood-nerve barrier(GO:0008065) |
| 6.9 |
20.7 |
GO:0010752 |
regulation of cGMP-mediated signaling(GO:0010752) |
| 6.9 |
13.8 |
GO:0070634 |
transepithelial ammonium transport(GO:0070634) |
| 6.8 |
27.4 |
GO:2000297 |
negative regulation of synapse maturation(GO:2000297) |
| 6.8 |
47.8 |
GO:0018095 |
protein polyglutamylation(GO:0018095) |
| 6.8 |
6.8 |
GO:2000463 |
positive regulation of excitatory postsynaptic potential(GO:2000463) |
| 6.8 |
40.6 |
GO:0060573 |
ventral spinal cord interneuron specification(GO:0021521) cell fate specification involved in pattern specification(GO:0060573) |
| 6.7 |
60.6 |
GO:1903142 |
positive regulation of endothelial cell development(GO:1901552) positive regulation of establishment of endothelial barrier(GO:1903142) |
| 6.7 |
20.2 |
GO:1990764 |
regulation of myofibroblast contraction(GO:1904328) myofibroblast contraction(GO:1990764) |
| 6.7 |
13.4 |
GO:0002118 |
aggressive behavior(GO:0002118) |
| 6.7 |
20.0 |
GO:0018094 |
protein polyglycylation(GO:0018094) |
| 6.6 |
13.3 |
GO:0036515 |
serotonergic neuron axon guidance(GO:0036515) |
| 6.6 |
99.5 |
GO:0021694 |
cerebellar Purkinje cell layer formation(GO:0021694) cerebellar Purkinje cell differentiation(GO:0021702) |
| 6.6 |
46.1 |
GO:0033603 |
positive regulation of dopamine secretion(GO:0033603) |
| 6.6 |
19.8 |
GO:0061209 |
cell proliferation involved in mesonephros development(GO:0061209) mesenchymal cell proliferation involved in ureteric bud development(GO:0072138) |
| 6.6 |
26.3 |
GO:1900454 |
positive regulation of long term synaptic depression(GO:1900454) |
| 6.6 |
118.2 |
GO:0099517 |
anterograde synaptic vesicle transport(GO:0048490) synaptic vesicle cytoskeletal transport(GO:0099514) synaptic vesicle transport along microtubule(GO:0099517) |
| 6.6 |
26.2 |
GO:0045065 |
cytotoxic T cell differentiation(GO:0045065) |
| 6.5 |
19.5 |
GO:0071812 |
regulation of fever generation by regulation of prostaglandin secretion(GO:0071810) positive regulation of fever generation by positive regulation of prostaglandin secretion(GO:0071812) positive regulation of ERK1 and ERK2 cascade via TNFSF11-mediated signaling(GO:0071848) regulation of fever generation by prostaglandin secretion(GO:0100009) |
| 6.5 |
97.6 |
GO:0070571 |
negative regulation of neuron projection regeneration(GO:0070571) |
| 6.5 |
26.0 |
GO:0006940 |
regulation of smooth muscle contraction(GO:0006940) |
| 6.5 |
65.1 |
GO:0036371 |
protein localization to M-band(GO:0036309) protein localization to T-tubule(GO:0036371) |
| 6.5 |
19.4 |
GO:0002818 |
intracellular defense response(GO:0002818) |
| 6.5 |
6.5 |
GO:1902732 |
positive regulation of chondrocyte proliferation(GO:1902732) |
| 6.5 |
19.4 |
GO:0072137 |
condensed mesenchymal cell proliferation(GO:0072137) |
| 6.5 |
25.9 |
GO:0046113 |
nucleobase catabolic process(GO:0046113) |
| 6.4 |
32.1 |
GO:0071442 |
regulation of histone H3-K14 acetylation(GO:0071440) positive regulation of histone H3-K14 acetylation(GO:0071442) |
| 6.4 |
70.3 |
GO:0070050 |
neuron cellular homeostasis(GO:0070050) |
| 6.4 |
108.3 |
GO:0060907 |
positive regulation of macrophage cytokine production(GO:0060907) |
| 6.4 |
19.1 |
GO:0008626 |
granzyme-mediated apoptotic signaling pathway(GO:0008626) |
| 6.4 |
12.7 |
GO:0042746 |
regulation of circadian sleep/wake cycle, wakefulness(GO:0010840) circadian sleep/wake cycle, wakefulness(GO:0042746) |
| 6.3 |
12.7 |
GO:1901624 |
negative regulation of lymphocyte chemotaxis(GO:1901624) |
| 6.3 |
19.0 |
GO:0071529 |
cementum mineralization(GO:0071529) |
| 6.3 |
31.6 |
GO:1902093 |
positive regulation of sperm motility(GO:1902093) |
| 6.3 |
6.3 |
GO:0014873 |
response to muscle activity involved in regulation of muscle adaptation(GO:0014873) |
| 6.3 |
18.9 |
GO:1904204 |
regulation of skeletal muscle hypertrophy(GO:1904204) |
| 6.3 |
18.8 |
GO:1904578 |
response to thapsigargin(GO:1904578) cellular response to thapsigargin(GO:1904579) response to hypobaric hypoxia(GO:1990910) |
| 6.3 |
18.8 |
GO:1905073 |
occluding junction disassembly(GO:1905071) regulation of occluding junction disassembly(GO:1905073) positive regulation of occluding junction disassembly(GO:1905075) |
| 6.2 |
43.7 |
GO:0045007 |
depurination(GO:0045007) |
| 6.2 |
6.2 |
GO:0016081 |
synaptic vesicle docking(GO:0016081) |
| 6.2 |
6.2 |
GO:0034442 |
regulation of lipoprotein oxidation(GO:0034442) |
| 6.2 |
12.4 |
GO:0035696 |
monocyte extravasation(GO:0035696) regulation of monocyte extravasation(GO:2000437) |
| 6.2 |
43.5 |
GO:2000324 |
positive regulation of glucocorticoid receptor signaling pathway(GO:2000324) |
| 6.2 |
12.4 |
GO:0052255 |
induction by symbiont of host defense response(GO:0044416) induction of host immune response by virus(GO:0046730) active induction of host immune response by virus(GO:0046732) modulation by symbiont of host defense response(GO:0052031) induction by organism of defense response of other organism involved in symbiotic interaction(GO:0052251) modulation by organism of defense response of other organism involved in symbiotic interaction(GO:0052255) positive regulation by symbiont of host defense response(GO:0052509) positive regulation by organism of defense response of other organism involved in symbiotic interaction(GO:0052510) modulation by organism of immune response of other organism involved in symbiotic interaction(GO:0052552) modulation by symbiont of host immune response(GO:0052553) modulation by virus of host immune response(GO:0075528) |
| 6.2 |
6.2 |
GO:2000546 |
positive regulation of cell chemotaxis to fibroblast growth factor(GO:1904849) positive regulation of endothelial cell chemotaxis to fibroblast growth factor(GO:2000546) |
| 6.2 |
37.2 |
GO:2000418 |
positive regulation of eosinophil migration(GO:2000418) |
| 6.1 |
24.5 |
GO:0071409 |
cellular response to cycloheximide(GO:0071409) |
| 6.1 |
36.7 |
GO:0071477 |
hypotonic salinity response(GO:0042539) cellular hypotonic salinity response(GO:0071477) |
| 6.1 |
122.1 |
GO:0090036 |
regulation of protein kinase C signaling(GO:0090036) |
| 6.1 |
6.1 |
GO:1902669 |
positive regulation of axon guidance(GO:1902669) |
| 6.1 |
6.1 |
GO:0097484 |
dendrite extension(GO:0097484) |
| 6.1 |
91.2 |
GO:0030208 |
dermatan sulfate biosynthetic process(GO:0030208) |
| 6.1 |
30.4 |
GO:0006127 |
glycerophosphate shuttle(GO:0006127) |
| 6.1 |
24.3 |
GO:0070940 |
dephosphorylation of RNA polymerase II C-terminal domain(GO:0070940) |
| 6.1 |
18.2 |
GO:0045906 |
negative regulation of vasoconstriction(GO:0045906) |
| 6.1 |
18.2 |
GO:0003430 |
growth plate cartilage chondrocyte growth(GO:0003430) growth plate cartilage chondrocyte development(GO:0003431) |
| 6.1 |
175.5 |
GO:0032011 |
ARF protein signal transduction(GO:0032011) |
| 6.0 |
12.1 |
GO:0016103 |
diterpenoid catabolic process(GO:0016103) retinoic acid catabolic process(GO:0034653) |
| 6.0 |
6.0 |
GO:1902949 |
positive regulation of tau-protein kinase activity(GO:1902949) |
| 6.0 |
36.0 |
GO:1901509 |
regulation of endothelial tube morphogenesis(GO:1901509) |
| 6.0 |
23.9 |
GO:2000535 |
regulation of entry of bacterium into host cell(GO:2000535) |
| 6.0 |
53.8 |
GO:0032482 |
Rab protein signal transduction(GO:0032482) |
| 6.0 |
17.9 |
GO:2000830 |
vacuolar phosphate transport(GO:0007037) positive regulation of mitotic cell cycle DNA replication(GO:1903465) positive regulation of parathyroid hormone secretion(GO:2000830) |
| 5.9 |
5.9 |
GO:1900425 |
negative regulation of defense response to bacterium(GO:1900425) |
| 5.9 |
5.9 |
GO:0035801 |
adrenal cortex development(GO:0035801) adrenal cortex formation(GO:0035802) |
| 5.9 |
11.8 |
GO:0044828 |
negative regulation by host of viral genome replication(GO:0044828) |
| 5.9 |
29.5 |
GO:0090131 |
mesenchyme migration(GO:0090131) |
| 5.9 |
11.8 |
GO:0001994 |
norepinephrine-epinephrine vasoconstriction involved in regulation of systemic arterial blood pressure(GO:0001994) |
| 5.9 |
17.6 |
GO:0098937 |
dendritic transport(GO:0098935) anterograde dendritic transport(GO:0098937) |
| 5.9 |
17.6 |
GO:0016185 |
synaptic vesicle budding from presynaptic endocytic zone membrane(GO:0016185) |
| 5.9 |
35.2 |
GO:0072102 |
glomerulus morphogenesis(GO:0072102) |
| 5.9 |
23.4 |
GO:0045647 |
negative regulation of erythrocyte differentiation(GO:0045647) |
| 5.8 |
35.1 |
GO:0061737 |
leukotriene signaling pathway(GO:0061737) |
| 5.8 |
35.1 |
GO:0035602 |
fibroblast growth factor receptor signaling pathway involved in negative regulation of apoptotic process in bone marrow(GO:0035602) fibroblast growth factor receptor signaling pathway involved in hemopoiesis(GO:0035603) fibroblast growth factor receptor signaling pathway involved in positive regulation of cell proliferation in bone marrow(GO:0035604) fibroblast growth factor receptor signaling pathway involved in orbitofrontal cortex development(GO:0035607) |
| 5.8 |
11.7 |
GO:0097114 |
NMDA glutamate receptor clustering(GO:0097114) |
| 5.8 |
5.8 |
GO:0007497 |
posterior midgut development(GO:0007497) |
| 5.8 |
23.3 |
GO:0036100 |
leukotriene catabolic process(GO:0036100) leukotriene B4 catabolic process(GO:0036101) leukotriene B4 metabolic process(GO:0036102) icosanoid catabolic process(GO:1901523) fatty acid derivative catabolic process(GO:1901569) |
| 5.8 |
23.3 |
GO:0002540 |
arachidonic acid metabolite production involved in inflammatory response(GO:0002538) leukotriene production involved in inflammatory response(GO:0002540) |
| 5.8 |
29.0 |
GO:0048242 |
regulation of epinephrine secretion(GO:0014060) epinephrine secretion(GO:0048242) |
| 5.8 |
23.2 |
GO:0001992 |
regulation of systemic arterial blood pressure by vasopressin(GO:0001992) |
| 5.8 |
5.8 |
GO:0014724 |
regulation of twitch skeletal muscle contraction(GO:0014724) |
| 5.8 |
5.8 |
GO:0071221 |
response to bacterial lipoprotein(GO:0032493) response to bacterial lipopeptide(GO:0070339) cellular response to bacterial lipoprotein(GO:0071220) cellular response to bacterial lipopeptide(GO:0071221) |
| 5.8 |
11.5 |
GO:0021778 |
spinal cord oligodendrocyte cell differentiation(GO:0021529) spinal cord oligodendrocyte cell fate specification(GO:0021530) oligodendrocyte cell fate specification(GO:0021778) oligodendrocyte cell fate commitment(GO:0021779) glial cell fate specification(GO:0021780) |
| 5.7 |
17.2 |
GO:0015808 |
L-alanine transport(GO:0015808) |
| 5.7 |
22.9 |
GO:0002881 |
negative regulation of chronic inflammatory response to non-antigenic stimulus(GO:0002881) |
| 5.7 |
28.4 |
GO:0010615 |
positive regulation of cardiac muscle adaptation(GO:0010615) positive regulation of cardiac muscle hypertrophy in response to stress(GO:1903244) |
| 5.7 |
22.7 |
GO:0090245 |
axis elongation involved in somitogenesis(GO:0090245) |
| 5.7 |
5.7 |
GO:0045836 |
positive regulation of meiotic nuclear division(GO:0045836) |
| 5.7 |
39.6 |
GO:0090160 |
Golgi to lysosome transport(GO:0090160) |
| 5.6 |
22.6 |
GO:0007161 |
calcium-independent cell-matrix adhesion(GO:0007161) |
| 5.6 |
78.8 |
GO:0006776 |
vitamin A metabolic process(GO:0006776) |
| 5.6 |
50.6 |
GO:0032119 |
sequestering of zinc ion(GO:0032119) |
| 5.6 |
61.8 |
GO:0048251 |
elastic fiber assembly(GO:0048251) |
| 5.6 |
22.4 |
GO:0071418 |
cellular response to amine stimulus(GO:0071418) |
| 5.6 |
5.6 |
GO:0032328 |
alanine transport(GO:0032328) |
| 5.6 |
27.9 |
GO:2000860 |
positive regulation of mineralocorticoid secretion(GO:2000857) positive regulation of aldosterone secretion(GO:2000860) |
| 5.5 |
22.1 |
GO:0002370 |
natural killer cell cytokine production(GO:0002370) regulation of natural killer cell cytokine production(GO:0002727) |
| 5.5 |
27.5 |
GO:2000467 |
positive regulation of glycogen (starch) synthase activity(GO:2000467) |
| 5.5 |
22.0 |
GO:0015793 |
glycerol transport(GO:0015793) |
| 5.5 |
21.9 |
GO:1902261 |
positive regulation of delayed rectifier potassium channel activity(GO:1902261) |
| 5.5 |
16.4 |
GO:1990166 |
protein localization to site of double-strand break(GO:1990166) |
| 5.5 |
32.8 |
GO:0038145 |
macrophage colony-stimulating factor signaling pathway(GO:0038145) |
| 5.4 |
5.4 |
GO:0036342 |
post-anal tail morphogenesis(GO:0036342) |
| 5.4 |
27.2 |
GO:2001023 |
regulation of response to drug(GO:2001023) |
| 5.4 |
5.4 |
GO:0060134 |
prepulse inhibition(GO:0060134) |
| 5.4 |
10.8 |
GO:0050720 |
interleukin-1 beta biosynthetic process(GO:0050720) |
| 5.4 |
5.4 |
GO:0090403 |
oxidative stress-induced premature senescence(GO:0090403) |
| 5.4 |
21.5 |
GO:0035627 |
ceramide transport(GO:0035627) |
| 5.4 |
5.4 |
GO:0006113 |
fermentation(GO:0006113) regulation of fermentation(GO:0043465) |
| 5.3 |
26.7 |
GO:0046208 |
spermine catabolic process(GO:0046208) |
| 5.3 |
21.3 |
GO:0050902 |
leukocyte adhesive activation(GO:0050902) |
| 5.3 |
79.7 |
GO:0007258 |
JUN phosphorylation(GO:0007258) |
| 5.3 |
15.9 |
GO:0048213 |
Golgi vesicle prefusion complex stabilization(GO:0048213) |
| 5.3 |
21.2 |
GO:0060414 |
aorta smooth muscle tissue morphogenesis(GO:0060414) |
| 5.3 |
47.5 |
GO:0014827 |
intestine smooth muscle contraction(GO:0014827) |
| 5.3 |
10.6 |
GO:0090188 |
negative regulation of pancreatic juice secretion(GO:0090188) |
| 5.3 |
31.6 |
GO:0046092 |
deoxycytidine metabolic process(GO:0046092) |
| 5.3 |
57.8 |
GO:0006032 |
chitin metabolic process(GO:0006030) chitin catabolic process(GO:0006032) |
| 5.3 |
52.5 |
GO:1904262 |
negative regulation of TORC1 signaling(GO:1904262) |
| 5.3 |
68.3 |
GO:0043046 |
DNA methylation involved in gamete generation(GO:0043046) |
| 5.3 |
10.5 |
GO:0001692 |
histamine metabolic process(GO:0001692) |
| 5.2 |
31.5 |
GO:0016926 |
protein desumoylation(GO:0016926) |
| 5.2 |
26.2 |
GO:0051029 |
rRNA transport(GO:0051029) |
| 5.2 |
26.2 |
GO:0035524 |
proline transmembrane transport(GO:0035524) |
| 5.2 |
62.8 |
GO:0006069 |
ethanol oxidation(GO:0006069) |
| 5.2 |
36.5 |
GO:0009128 |
purine nucleoside monophosphate catabolic process(GO:0009128) |
| 5.2 |
10.4 |
GO:0010533 |
regulation of activation of Janus kinase activity(GO:0010533) |
| 5.2 |
62.5 |
GO:0001867 |
complement activation, lectin pathway(GO:0001867) |
| 5.2 |
26.0 |
GO:0060075 |
regulation of resting membrane potential(GO:0060075) |
| 5.2 |
15.6 |
GO:0002143 |
tRNA wobble position uridine thiolation(GO:0002143) |
| 5.2 |
20.8 |
GO:0090219 |
negative regulation of lipid kinase activity(GO:0090219) |
| 5.2 |
20.7 |
GO:0001661 |
conditioned taste aversion(GO:0001661) |
| 5.2 |
31.1 |
GO:0050966 |
detection of mechanical stimulus involved in sensory perception of pain(GO:0050966) |
| 5.2 |
15.5 |
GO:1990108 |
protein linear deubiquitination(GO:1990108) |
| 5.2 |
31.0 |
GO:0090141 |
positive regulation of mitochondrial fission(GO:0090141) |
| 5.2 |
10.3 |
GO:0002361 |
CD4-positive, CD25-positive, alpha-beta regulatory T cell differentiation(GO:0002361) |
| 5.2 |
15.5 |
GO:0051533 |
positive regulation of NFAT protein import into nucleus(GO:0051533) |
| 5.1 |
10.3 |
GO:0032218 |
riboflavin transport(GO:0032218) |
| 5.1 |
25.6 |
GO:0051918 |
negative regulation of fibrinolysis(GO:0051918) |
| 5.1 |
46.1 |
GO:0016322 |
neuron remodeling(GO:0016322) |
| 5.1 |
15.3 |
GO:0048630 |
skeletal muscle tissue growth(GO:0048630) |
| 5.1 |
15.3 |
GO:0050910 |
detection of mechanical stimulus involved in sensory perception of sound(GO:0050910) |
| 5.1 |
50.9 |
GO:0097186 |
amelogenesis(GO:0097186) |
| 5.1 |
183.0 |
GO:0008038 |
neuron recognition(GO:0008038) |
| 5.1 |
30.4 |
GO:0006543 |
glutamine catabolic process(GO:0006543) |
| 5.1 |
15.2 |
GO:0003219 |
cardiac right ventricle formation(GO:0003219) |
| 5.1 |
15.2 |
GO:0051710 |
regulation of cytolysis in other organism(GO:0051710) |
| 5.0 |
151.5 |
GO:0097503 |
sialylation(GO:0097503) |
| 5.0 |
60.1 |
GO:0019934 |
cGMP-mediated signaling(GO:0019934) |
| 5.0 |
20.0 |
GO:0021891 |
olfactory bulb interneuron development(GO:0021891) |
| 5.0 |
15.0 |
GO:0061591 |
calcium activated phospholipid scrambling(GO:0061588) calcium activated phosphatidylcholine scrambling(GO:0061590) calcium activated galactosylceramide scrambling(GO:0061591) |
| 5.0 |
19.9 |
GO:0021615 |
glossopharyngeal nerve morphogenesis(GO:0021615) |
| 5.0 |
14.9 |
GO:1903526 |
negative regulation of membrane tubulation(GO:1903526) |
| 5.0 |
19.9 |
GO:0032764 |
negative regulation of mast cell cytokine production(GO:0032764) |
| 5.0 |
19.9 |
GO:0018230 |
peptidyl-L-cysteine S-palmitoylation(GO:0018230) peptidyl-S-diacylglycerol-L-cysteine biosynthetic process from peptidyl-cysteine(GO:0018231) |
| 4.9 |
9.9 |
GO:2000170 |
positive regulation of peptidyl-cysteine S-nitrosylation(GO:2000170) |
| 4.9 |
34.6 |
GO:0010641 |
positive regulation of platelet-derived growth factor receptor signaling pathway(GO:0010641) |
| 4.9 |
19.7 |
GO:0032290 |
peripheral nervous system myelin formation(GO:0032290) |
| 4.9 |
24.6 |
GO:0001555 |
oocyte growth(GO:0001555) |
| 4.9 |
19.7 |
GO:2000638 |
regulation of SREBP signaling pathway(GO:2000638) negative regulation of SREBP signaling pathway(GO:2000639) |
| 4.9 |
19.7 |
GO:0045023 |
G0 to G1 transition(GO:0045023) |
| 4.9 |
14.7 |
GO:0033364 |
mast cell secretory granule organization(GO:0033364) |
| 4.9 |
19.6 |
GO:0038098 |
sequestering of BMP from receptor via BMP binding(GO:0038098) |
| 4.9 |
14.6 |
GO:0070625 |
zymogen granule exocytosis(GO:0070625) |
| 4.9 |
9.7 |
GO:0051902 |
negative regulation of mitochondrial depolarization(GO:0051902) |
| 4.9 |
92.3 |
GO:0034389 |
lipid particle organization(GO:0034389) |
| 4.8 |
19.4 |
GO:1904304 |
regulation of gastro-intestinal system smooth muscle contraction(GO:1904304) positive regulation of gastro-intestinal system smooth muscle contraction(GO:1904306) |
| 4.8 |
38.7 |
GO:0015747 |
urate transport(GO:0015747) |
| 4.8 |
14.5 |
GO:0060282 |
positive regulation of oocyte development(GO:0060282) |
| 4.8 |
9.6 |
GO:0021853 |
cerebral cortex GABAergic interneuron migration(GO:0021853) interneuron migration(GO:1904936) |
| 4.8 |
4.8 |
GO:0008355 |
olfactory learning(GO:0008355) |
| 4.8 |
81.5 |
GO:0007158 |
neuron cell-cell adhesion(GO:0007158) |
| 4.8 |
14.4 |
GO:1990164 |
histone H2A phosphorylation(GO:1990164) |
| 4.8 |
4.8 |
GO:0050912 |
detection of chemical stimulus involved in sensory perception of taste(GO:0050912) |
| 4.8 |
4.8 |
GO:0071639 |
positive regulation of monocyte chemotactic protein-1 production(GO:0071639) |
| 4.8 |
19.0 |
GO:0006020 |
inositol metabolic process(GO:0006020) |
| 4.7 |
42.7 |
GO:0060267 |
positive regulation of respiratory burst(GO:0060267) |
| 4.7 |
4.7 |
GO:0060406 |
positive regulation of penile erection(GO:0060406) |
| 4.7 |
9.4 |
GO:2001013 |
epithelial cell proliferation involved in renal tubule morphogenesis(GO:2001013) |
| 4.7 |
14.1 |
GO:0097112 |
gamma-aminobutyric acid receptor clustering(GO:0097112) |
| 4.7 |
9.4 |
GO:0072344 |
rescue of stalled ribosome(GO:0072344) |
| 4.7 |
14.1 |
GO:0019046 |
release from viral latency(GO:0019046) |
| 4.7 |
14.1 |
GO:0060040 |
retinal bipolar neuron differentiation(GO:0060040) |
| 4.7 |
42.3 |
GO:1902018 |
negative regulation of cilium assembly(GO:1902018) |
| 4.7 |
23.4 |
GO:0050893 |
sensory processing(GO:0050893) |
| 4.7 |
9.4 |
GO:0032224 |
positive regulation of synaptic transmission, cholinergic(GO:0032224) |
| 4.7 |
9.3 |
GO:0001574 |
ganglioside biosynthetic process(GO:0001574) |
| 4.7 |
14.0 |
GO:1903984 |
positive regulation of TRAIL-activated apoptotic signaling pathway(GO:1903984) |
| 4.7 |
27.9 |
GO:0033088 |
negative regulation of immature T cell proliferation in thymus(GO:0033088) |
| 4.6 |
4.6 |
GO:0043415 |
positive regulation of skeletal muscle tissue regeneration(GO:0043415) regulation of skeletal muscle tissue regeneration(GO:0043416) |
| 4.6 |
46.4 |
GO:1901223 |
negative regulation of NIK/NF-kappaB signaling(GO:1901223) |
| 4.6 |
18.4 |
GO:0009182 |
purine deoxyribonucleoside diphosphate metabolic process(GO:0009182) |
| 4.6 |
4.6 |
GO:0021781 |
glial cell fate commitment(GO:0021781) |
| 4.6 |
23.0 |
GO:0006041 |
glucosamine metabolic process(GO:0006041) |
| 4.6 |
137.8 |
GO:0045494 |
photoreceptor cell maintenance(GO:0045494) |
| 4.6 |
9.2 |
GO:0002215 |
defense response to nematode(GO:0002215) |
| 4.6 |
22.9 |
GO:0006072 |
glycerol-3-phosphate metabolic process(GO:0006072) glycerol-3-phosphate biosynthetic process(GO:0046167) |
| 4.6 |
36.6 |
GO:0016191 |
synaptic vesicle uncoating(GO:0016191) |
| 4.6 |
50.4 |
GO:0070208 |
protein heterotrimerization(GO:0070208) |
| 4.6 |
13.7 |
GO:1901492 |
positive regulation of lymphangiogenesis(GO:1901492) |
| 4.6 |
45.7 |
GO:0033227 |
dsRNA transport(GO:0033227) |
| 4.6 |
22.8 |
GO:2000766 |
negative regulation of cytoplasmic translation(GO:2000766) |
| 4.5 |
18.1 |
GO:0014062 |
regulation of serotonin secretion(GO:0014062) |
| 4.5 |
36.1 |
GO:0008354 |
germ cell migration(GO:0008354) |
| 4.5 |
31.6 |
GO:0034199 |
activation of protein kinase A activity(GO:0034199) |
| 4.5 |
27.0 |
GO:0035063 |
nuclear speck organization(GO:0035063) |
| 4.5 |
18.0 |
GO:1902723 |
negative regulation of skeletal muscle cell proliferation(GO:0014859) negative regulation of skeletal muscle satellite cell proliferation(GO:1902723) |
| 4.5 |
13.5 |
GO:0005989 |
lactose metabolic process(GO:0005988) lactose biosynthetic process(GO:0005989) |
| 4.5 |
4.5 |
GO:0019755 |
one-carbon compound transport(GO:0019755) |
| 4.5 |
17.9 |
GO:0010157 |
response to chlorate(GO:0010157) |
| 4.5 |
53.6 |
GO:0001539 |
cilium or flagellum-dependent cell motility(GO:0001539) |
| 4.5 |
22.3 |
GO:0006655 |
phosphatidylglycerol biosynthetic process(GO:0006655) |
| 4.4 |
13.3 |
GO:0035624 |
receptor transactivation(GO:0035624) |
| 4.4 |
4.4 |
GO:0097032 |
respiratory chain complex II assembly(GO:0034552) mitochondrial respiratory chain complex II assembly(GO:0034553) mitochondrial respiratory chain complex II biogenesis(GO:0097032) |
| 4.4 |
13.3 |
GO:0009720 |
detection of hormone stimulus(GO:0009720) |
| 4.4 |
4.4 |
GO:0043589 |
skin morphogenesis(GO:0043589) |
| 4.4 |
119.4 |
GO:0042403 |
thyroid hormone metabolic process(GO:0042403) |
| 4.4 |
17.7 |
GO:0000821 |
regulation of arginine metabolic process(GO:0000821) |
| 4.4 |
8.8 |
GO:0014051 |
gamma-aminobutyric acid secretion(GO:0014051) |
| 4.4 |
22.1 |
GO:0090080 |
positive regulation of MAPKKK cascade by fibroblast growth factor receptor signaling pathway(GO:0090080) |
| 4.4 |
13.2 |
GO:0072233 |
thick ascending limb development(GO:0072023) metanephric thick ascending limb development(GO:0072233) |
| 4.4 |
26.4 |
GO:0043129 |
surfactant homeostasis(GO:0043129) |
| 4.4 |
8.8 |
GO:0048669 |
collateral sprouting in absence of injury(GO:0048669) |
| 4.4 |
17.6 |
GO:0009822 |
alkaloid catabolic process(GO:0009822) |
| 4.4 |
4.4 |
GO:0032304 |
negative regulation of icosanoid secretion(GO:0032304) |
| 4.4 |
4.4 |
GO:0044800 |
fusion of virus membrane with host plasma membrane(GO:0019064) membrane fusion involved in viral entry into host cell(GO:0039663) multi-organism membrane fusion(GO:0044800) |
| 4.4 |
21.9 |
GO:0060214 |
endocardium formation(GO:0060214) |
| 4.4 |
13.1 |
GO:0010915 |
regulation of very-low-density lipoprotein particle clearance(GO:0010915) negative regulation of very-low-density lipoprotein particle clearance(GO:0010916) |
| 4.4 |
8.7 |
GO:0032431 |
activation of phospholipase A2 activity(GO:0032431) |
| 4.4 |
13.1 |
GO:0021555 |
midbrain-hindbrain boundary morphogenesis(GO:0021555) |
| 4.4 |
8.7 |
GO:2000382 |
positive regulation of mesoderm development(GO:2000382) |
| 4.4 |
13.1 |
GO:0060974 |
neural crest cell migration involved in heart formation(GO:0003147) cell migration involved in heart formation(GO:0060974) anterior neural tube closure(GO:0061713) |
| 4.4 |
17.4 |
GO:0060010 |
Sertoli cell fate commitment(GO:0060010) |
| 4.4 |
52.2 |
GO:0051938 |
L-glutamate import(GO:0051938) |
| 4.3 |
91.2 |
GO:0006895 |
Golgi to endosome transport(GO:0006895) |
| 4.3 |
73.7 |
GO:1903830 |
magnesium ion transmembrane transport(GO:1903830) |
| 4.3 |
8.7 |
GO:1902174 |
positive regulation of keratinocyte apoptotic process(GO:1902174) |
| 4.3 |
13.0 |
GO:2001016 |
positive regulation of skeletal muscle cell differentiation(GO:2001016) |
| 4.3 |
21.7 |
GO:0015812 |
gamma-aminobutyric acid transport(GO:0015812) |
| 4.3 |
17.3 |
GO:0071918 |
urea transmembrane transport(GO:0071918) |
| 4.3 |
39.0 |
GO:0098535 |
de novo centriole assembly(GO:0098535) |
| 4.3 |
8.7 |
GO:0002581 |
negative regulation of antigen processing and presentation of peptide or polysaccharide antigen via MHC class II(GO:0002581) |
| 4.3 |
52.0 |
GO:0031284 |
positive regulation of guanylate cyclase activity(GO:0031284) |
| 4.3 |
39.0 |
GO:0036066 |
protein O-linked fucosylation(GO:0036066) |
| 4.3 |
51.9 |
GO:0032957 |
inositol trisphosphate metabolic process(GO:0032957) |
| 4.3 |
86.3 |
GO:0010763 |
positive regulation of fibroblast migration(GO:0010763) |
| 4.3 |
21.5 |
GO:1900004 |
negative regulation of serine-type endopeptidase activity(GO:1900004) negative regulation of serine-type peptidase activity(GO:1902572) |
| 4.3 |
98.9 |
GO:0007616 |
long-term memory(GO:0007616) |
| 4.3 |
60.2 |
GO:0015874 |
norepinephrine transport(GO:0015874) |
| 4.3 |
4.3 |
GO:0061518 |
macrophage proliferation(GO:0061517) microglial cell proliferation(GO:0061518) |
| 4.3 |
4.3 |
GO:0015840 |
urea transport(GO:0015840) |
| 4.3 |
17.1 |
GO:0003366 |
cell-matrix adhesion involved in ameboidal cell migration(GO:0003366) |
| 4.3 |
38.3 |
GO:2000124 |
regulation of endocannabinoid signaling pathway(GO:2000124) |
| 4.2 |
12.7 |
GO:0043605 |
cellular amide catabolic process(GO:0043605) |
| 4.2 |
17.0 |
GO:0002913 |
positive regulation of T cell anergy(GO:0002669) positive regulation of lymphocyte anergy(GO:0002913) |
| 4.2 |
8.5 |
GO:0010159 |
specification of organ position(GO:0010159) |
| 4.2 |
16.9 |
GO:0021815 |
cell motility involved in cerebral cortex radial glia guided migration(GO:0021814) modulation of microtubule cytoskeleton involved in cerebral cortex radial glia guided migration(GO:0021815) |
| 4.2 |
38.0 |
GO:0006942 |
regulation of striated muscle contraction(GO:0006942) |
| 4.2 |
76.0 |
GO:2000251 |
positive regulation of actin cytoskeleton reorganization(GO:2000251) |
| 4.2 |
4.2 |
GO:0071877 |
regulation of adrenergic receptor signaling pathway(GO:0071877) |
| 4.2 |
4.2 |
GO:1902232 |
regulation of positive thymic T cell selection(GO:1902232) |
| 4.2 |
92.6 |
GO:0036152 |
phosphatidylethanolamine acyl-chain remodeling(GO:0036152) |
| 4.2 |
4.2 |
GO:1900227 |
positive regulation of NLRP3 inflammasome complex assembly(GO:1900227) |
| 4.2 |
4.2 |
GO:2001302 |
lipoxin biosynthetic process(GO:2001301) lipoxin A4 metabolic process(GO:2001302) lipoxin A4 biosynthetic process(GO:2001303) |
| 4.2 |
16.7 |
GO:0071233 |
cellular response to leucine(GO:0071233) |
| 4.2 |
4.2 |
GO:0060599 |
lateral sprouting involved in mammary gland duct morphogenesis(GO:0060599) |
| 4.2 |
45.9 |
GO:0030321 |
transepithelial chloride transport(GO:0030321) |
| 4.2 |
16.6 |
GO:1904327 |
protein localization to cytosolic proteasome complex(GO:1904327) protein localization to cytosolic proteasome complex involved in ERAD pathway(GO:1904379) |
| 4.2 |
12.5 |
GO:0060644 |
mammary gland epithelial cell differentiation(GO:0060644) |
| 4.1 |
12.4 |
GO:0070105 |
regulation of interleukin-6-mediated signaling pathway(GO:0070103) positive regulation of interleukin-6-mediated signaling pathway(GO:0070105) |
| 4.1 |
8.3 |
GO:0018963 |
phthalate metabolic process(GO:0018963) |
| 4.1 |
24.7 |
GO:1900748 |
positive regulation of vascular endothelial growth factor signaling pathway(GO:1900748) |
| 4.1 |
4.1 |
GO:0009624 |
response to nematode(GO:0009624) |
| 4.1 |
4.1 |
GO:1903348 |
positive regulation of bicellular tight junction assembly(GO:1903348) |
| 4.1 |
12.3 |
GO:0090527 |
actin filament reorganization(GO:0090527) |
| 4.1 |
20.4 |
GO:0030309 |
poly-N-acetyllactosamine metabolic process(GO:0030309) poly-N-acetyllactosamine biosynthetic process(GO:0030311) |
| 4.1 |
16.3 |
GO:0007217 |
tachykinin receptor signaling pathway(GO:0007217) |
| 4.1 |
20.4 |
GO:0032489 |
regulation of Cdc42 protein signal transduction(GO:0032489) |
| 4.0 |
4.0 |
GO:0060018 |
astrocyte fate commitment(GO:0060018) |
| 4.0 |
12.1 |
GO:0006683 |
galactosylceramide catabolic process(GO:0006683) |
| 4.0 |
44.5 |
GO:0002775 |
antimicrobial peptide production(GO:0002775) antibacterial peptide production(GO:0002778) |
| 4.0 |
20.2 |
GO:1904996 |
positive regulation of leukocyte adhesion to vascular endothelial cell(GO:1904996) |
| 4.0 |
4.0 |
GO:0036462 |
TRAIL-activated apoptotic signaling pathway(GO:0036462) |
| 4.0 |
72.4 |
GO:0042135 |
neurotransmitter catabolic process(GO:0042135) |
| 4.0 |
8.0 |
GO:1900239 |
phenotypic switching(GO:0036166) regulation of phenotypic switching(GO:1900239) |
| 4.0 |
4.0 |
GO:0045799 |
positive regulation of chromatin assembly or disassembly(GO:0045799) |
| 4.0 |
12.0 |
GO:0006540 |
glutamate decarboxylation to succinate(GO:0006540) |
| 4.0 |
4.0 |
GO:0015783 |
GDP-fucose transport(GO:0015783) purine nucleotide-sugar transport(GO:0036079) |
| 4.0 |
12.0 |
GO:0042231 |
interleukin-13 biosynthetic process(GO:0042231) |
| 4.0 |
12.0 |
GO:0061026 |
cardiac muscle tissue regeneration(GO:0061026) |
| 4.0 |
4.0 |
GO:0048808 |
male genitalia morphogenesis(GO:0048808) male anatomical structure morphogenesis(GO:0090598) |
| 4.0 |
7.9 |
GO:0086053 |
SA node cell to atrial cardiac muscle cell communication by electrical coupling(GO:0086021) AV node cell to bundle of His cell communication by electrical coupling(GO:0086053) |
| 4.0 |
11.9 |
GO:0015870 |
acetylcholine transport(GO:0015870) acetate ester transport(GO:1901374) |
| 4.0 |
11.9 |
GO:0032713 |
negative regulation of interleukin-4 production(GO:0032713) |
| 3.9 |
31.6 |
GO:0070995 |
NADPH oxidation(GO:0070995) |
| 3.9 |
7.9 |
GO:0045085 |
negative regulation of interleukin-2 biosynthetic process(GO:0045085) |
| 3.9 |
62.8 |
GO:0045662 |
negative regulation of myoblast differentiation(GO:0045662) |
| 3.9 |
94.1 |
GO:0035249 |
synaptic transmission, glutamatergic(GO:0035249) |
| 3.9 |
3.9 |
GO:0046321 |
positive regulation of fatty acid oxidation(GO:0046321) |
| 3.9 |
27.4 |
GO:0098703 |
calcium ion import across plasma membrane(GO:0098703) calcium ion import into cell(GO:1990035) |
| 3.9 |
74.0 |
GO:0006957 |
complement activation, alternative pathway(GO:0006957) |
| 3.9 |
3.9 |
GO:1901490 |
regulation of lymphangiogenesis(GO:1901490) negative regulation of lymphangiogenesis(GO:1901491) |
| 3.9 |
11.6 |
GO:0035574 |
histone H4-K20 demethylation(GO:0035574) |
| 3.9 |
27.1 |
GO:0070127 |
tRNA aminoacylation for mitochondrial protein translation(GO:0070127) |
| 3.9 |
19.3 |
GO:0005985 |
sucrose metabolic process(GO:0005985) |
| 3.9 |
3.9 |
GO:1904907 |
negative regulation of maintenance of sister chromatid cohesion(GO:0034092) negative regulation of maintenance of mitotic sister chromatid cohesion(GO:0034183) maintenance of mitotic sister chromatid cohesion, telomeric(GO:0099403) mitotic sister chromatid cohesion, telomeric(GO:0099404) regulation of maintenance of mitotic sister chromatid cohesion, telomeric(GO:1904907) negative regulation of maintenance of mitotic sister chromatid cohesion, telomeric(GO:1904908) |
| 3.8 |
11.5 |
GO:0038178 |
complement component C5a signaling pathway(GO:0038178) |
| 3.8 |
3.8 |
GO:0033861 |
negative regulation of NAD(P)H oxidase activity(GO:0033861) |
| 3.8 |
19.2 |
GO:0060157 |
urinary bladder development(GO:0060157) |
| 3.8 |
30.6 |
GO:1904781 |
positive regulation of protein localization to centrosome(GO:1904781) |
| 3.8 |
19.1 |
GO:0061624 |
fructose catabolic process(GO:0006001) fructose catabolic process to hydroxyacetone phosphate and glyceraldehyde-3-phosphate(GO:0061624) |
| 3.8 |
19.1 |
GO:0060718 |
chorionic trophoblast cell differentiation(GO:0060718) |
| 3.8 |
186.9 |
GO:0015701 |
bicarbonate transport(GO:0015701) |
| 3.8 |
30.5 |
GO:0050882 |
voluntary musculoskeletal movement(GO:0050882) |
| 3.8 |
45.3 |
GO:1990573 |
potassium ion import across plasma membrane(GO:1990573) |
| 3.8 |
3.8 |
GO:0071257 |
cellular response to electrical stimulus(GO:0071257) |
| 3.8 |
11.3 |
GO:0002025 |
vasodilation by norepinephrine-epinephrine involved in regulation of systemic arterial blood pressure(GO:0002025) |
| 3.8 |
15.0 |
GO:0045763 |
negative regulation of cellular amino acid metabolic process(GO:0045763) |
| 3.8 |
18.8 |
GO:0046606 |
negative regulation of centrosome duplication(GO:0010826) negative regulation of centrosome cycle(GO:0046606) |
| 3.7 |
7.5 |
GO:0071468 |
cellular response to acidic pH(GO:0071468) |
| 3.7 |
3.7 |
GO:1901097 |
negative regulation of autophagosome maturation(GO:1901097) |
| 3.7 |
52.3 |
GO:0035878 |
nail development(GO:0035878) |
| 3.7 |
14.9 |
GO:0006701 |
progesterone biosynthetic process(GO:0006701) |
| 3.7 |
26.1 |
GO:2001300 |
lipoxin metabolic process(GO:2001300) |
| 3.7 |
22.1 |
GO:0061734 |
parkin-mediated mitophagy in response to mitochondrial depolarization(GO:0061734) |
| 3.7 |
18.3 |
GO:0043117 |
positive regulation of vascular permeability(GO:0043117) |
| 3.7 |
7.3 |
GO:0035962 |
response to interleukin-13(GO:0035962) |
| 3.6 |
51.1 |
GO:0043374 |
CD8-positive, alpha-beta T cell differentiation(GO:0043374) |
| 3.6 |
87.5 |
GO:0015695 |
organic cation transport(GO:0015695) |
| 3.6 |
10.9 |
GO:2000342 |
negative regulation of chemokine (C-X-C motif) ligand 2 production(GO:2000342) |
| 3.6 |
7.2 |
GO:0001842 |
neural fold formation(GO:0001842) |
| 3.6 |
25.3 |
GO:0006477 |
protein sulfation(GO:0006477) |
| 3.6 |
3.6 |
GO:0002584 |
negative regulation of antigen processing and presentation of peptide antigen(GO:0002584) |
| 3.6 |
14.4 |
GO:0070587 |
negative regulation of heterotypic cell-cell adhesion(GO:0034115) regulation of cell-cell adhesion involved in gastrulation(GO:0070587) |
| 3.6 |
10.8 |
GO:0018125 |
peptidyl-cysteine methylation(GO:0018125) |
| 3.6 |
35.8 |
GO:0071625 |
vocalization behavior(GO:0071625) |
| 3.6 |
7.2 |
GO:0008212 |
mineralocorticoid biosynthetic process(GO:0006705) mineralocorticoid metabolic process(GO:0008212) |
| 3.6 |
7.2 |
GO:0032352 |
positive regulation of hormone metabolic process(GO:0032352) |
| 3.6 |
25.0 |
GO:0043435 |
response to corticotropin-releasing hormone(GO:0043435) cellular response to corticotropin-releasing hormone stimulus(GO:0071376) |
| 3.6 |
7.1 |
GO:0003245 |
cardiac muscle tissue growth involved in heart morphogenesis(GO:0003245) |
| 3.6 |
10.7 |
GO:0071787 |
endoplasmic reticulum tubular network assembly(GO:0071787) |
| 3.6 |
14.3 |
GO:0035865 |
cellular response to potassium ion(GO:0035865) |
| 3.6 |
14.3 |
GO:0030037 |
actin filament reorganization involved in cell cycle(GO:0030037) |
| 3.6 |
35.6 |
GO:0042985 |
negative regulation of amyloid precursor protein biosynthetic process(GO:0042985) |
| 3.6 |
7.1 |
GO:0060729 |
intestinal epithelial structure maintenance(GO:0060729) |
| 3.5 |
3.5 |
GO:0014043 |
negative regulation of neuron maturation(GO:0014043) |
| 3.5 |
7.1 |
GO:0036376 |
sodium ion export from cell(GO:0036376) |
| 3.5 |
176.6 |
GO:1901385 |
regulation of voltage-gated calcium channel activity(GO:1901385) |
| 3.5 |
17.7 |
GO:0060830 |
ciliary receptor clustering involved in smoothened signaling pathway(GO:0060830) |
| 3.5 |
17.6 |
GO:1901475 |
pyruvate transport(GO:0006848) pyruvate transmembrane transport(GO:1901475) |
| 3.5 |
14.1 |
GO:1904381 |
Golgi apparatus mannose trimming(GO:1904381) |
| 3.5 |
35.1 |
GO:2000318 |
positive regulation of T-helper 17 type immune response(GO:2000318) |
| 3.5 |
7.0 |
GO:0010735 |
positive regulation of transcription via serum response element binding(GO:0010735) |
| 3.5 |
34.9 |
GO:0010882 |
regulation of cardiac muscle contraction by calcium ion signaling(GO:0010882) |
| 3.5 |
27.8 |
GO:0043950 |
positive regulation of cAMP-mediated signaling(GO:0043950) |
| 3.5 |
10.4 |
GO:0036046 |
protein demalonylation(GO:0036046) peptidyl-lysine demalonylation(GO:0036047) protein desuccinylation(GO:0036048) peptidyl-lysine desuccinylation(GO:0036049) protein deglutarylation(GO:0061698) peptidyl-lysine deglutarylation(GO:0061699) |
| 3.5 |
17.3 |
GO:2000672 |
regulation of motor neuron apoptotic process(GO:2000671) negative regulation of motor neuron apoptotic process(GO:2000672) |
| 3.4 |
44.8 |
GO:0006600 |
creatine metabolic process(GO:0006600) |
| 3.4 |
79.2 |
GO:0014047 |
glutamate secretion(GO:0014047) |
| 3.4 |
13.8 |
GO:0032972 |
regulation of muscle filament sliding speed(GO:0032972) |
| 3.4 |
41.3 |
GO:0001542 |
ovulation from ovarian follicle(GO:0001542) |
| 3.4 |
3.4 |
GO:0098908 |
regulation of neuronal action potential(GO:0098908) |
| 3.4 |
55.0 |
GO:2000169 |
negative regulation of peptidyl-cysteine S-nitrosylation(GO:1902083) regulation of peptidyl-cysteine S-nitrosylation(GO:2000169) |
| 3.4 |
13.7 |
GO:0009233 |
menaquinone metabolic process(GO:0009233) |
| 3.4 |
6.8 |
GO:2001274 |
negative regulation of glucose import in response to insulin stimulus(GO:2001274) |
| 3.4 |
41.0 |
GO:0032688 |
negative regulation of interferon-beta production(GO:0032688) |
| 3.4 |
10.2 |
GO:0086097 |
phospholipase C-activating angiotensin-activated signaling pathway(GO:0086097) |
| 3.4 |
23.9 |
GO:0002328 |
pro-B cell differentiation(GO:0002328) |
| 3.4 |
30.7 |
GO:0071415 |
cellular response to caffeine(GO:0071313) cellular response to purine-containing compound(GO:0071415) |
| 3.4 |
20.4 |
GO:0043031 |
negative regulation of macrophage activation(GO:0043031) |
| 3.4 |
6.8 |
GO:0001759 |
organ induction(GO:0001759) |
| 3.4 |
17.0 |
GO:0009407 |
toxin catabolic process(GO:0009407) secondary metabolite catabolic process(GO:0090487) |
| 3.4 |
17.0 |
GO:0071420 |
cellular response to histamine(GO:0071420) |
| 3.4 |
3.4 |
GO:0042487 |
regulation of odontogenesis of dentin-containing tooth(GO:0042487) |
| 3.4 |
3.4 |
GO:0034454 |
microtubule anchoring at centrosome(GO:0034454) |
| 3.4 |
3.4 |
GO:1902256 |
apoptotic process involved in outflow tract morphogenesis(GO:0003275) regulation of apoptotic process involved in outflow tract morphogenesis(GO:1902256) |
| 3.4 |
30.4 |
GO:0060670 |
branching involved in labyrinthine layer morphogenesis(GO:0060670) |
| 3.4 |
13.5 |
GO:0048680 |
positive regulation of axon regeneration(GO:0048680) |
| 3.4 |
33.7 |
GO:1902746 |
regulation of lens fiber cell differentiation(GO:1902746) |
| 3.4 |
16.8 |
GO:1904994 |
regulation of leukocyte adhesion to vascular endothelial cell(GO:1904994) |
| 3.4 |
33.6 |
GO:0043578 |
nuclear matrix organization(GO:0043578) |
| 3.4 |
10.1 |
GO:0035544 |
negative regulation of SNARE complex assembly(GO:0035544) |
| 3.4 |
10.1 |
GO:1904491 |
protein localization to ciliary transition zone(GO:1904491) |
| 3.3 |
10.0 |
GO:1904430 |
negative regulation of t-circle formation(GO:1904430) |
| 3.3 |
23.4 |
GO:0034983 |
peptidyl-lysine deacetylation(GO:0034983) |
| 3.3 |
13.4 |
GO:0002357 |
defense response to tumor cell(GO:0002357) |
| 3.3 |
13.4 |
GO:0060158 |
phospholipase C-activating dopamine receptor signaling pathway(GO:0060158) |
| 3.3 |
86.8 |
GO:0042417 |
dopamine metabolic process(GO:0042417) |
| 3.3 |
33.3 |
GO:0030322 |
stabilization of membrane potential(GO:0030322) |
| 3.3 |
20.0 |
GO:0018343 |
protein farnesylation(GO:0018343) |
| 3.3 |
6.6 |
GO:0046271 |
phenylpropanoid catabolic process(GO:0046271) |
| 3.3 |
3.3 |
GO:0072313 |
metanephric glomerular epithelium development(GO:0072244) metanephric glomerular visceral epithelial cell differentiation(GO:0072248) metanephric glomerular visceral epithelial cell development(GO:0072249) metanephric glomerular epithelial cell differentiation(GO:0072312) metanephric glomerular epithelial cell development(GO:0072313) |
| 3.3 |
16.6 |
GO:0034312 |
diol biosynthetic process(GO:0034312) sphingosine biosynthetic process(GO:0046512) sphingoid biosynthetic process(GO:0046520) |
| 3.3 |
19.8 |
GO:1901525 |
negative regulation of macromitophagy(GO:1901525) |
| 3.3 |
6.6 |
GO:0042636 |
negative regulation of hair cycle(GO:0042636) |
| 3.3 |
6.6 |
GO:0090290 |
positive regulation of osteoclast proliferation(GO:0090290) |
| 3.3 |
52.7 |
GO:0010172 |
embryonic body morphogenesis(GO:0010172) |
| 3.3 |
9.9 |
GO:0006498 |
N-terminal protein lipidation(GO:0006498) |
| 3.3 |
6.6 |
GO:0097105 |
presynaptic membrane assembly(GO:0097105) |
| 3.3 |
36.1 |
GO:0010499 |
proteasomal ubiquitin-independent protein catabolic process(GO:0010499) |
| 3.3 |
3.3 |
GO:1904948 |
midbrain dopaminergic neuron differentiation(GO:1904948) |
| 3.3 |
26.1 |
GO:0002438 |
acute inflammatory response to antigenic stimulus(GO:0002438) |
| 3.3 |
3.3 |
GO:0021571 |
rhombomere 5 development(GO:0021571) |
| 3.3 |
16.3 |
GO:0060684 |
epithelial-mesenchymal cell signaling(GO:0060684) |
| 3.3 |
9.8 |
GO:1905051 |
regulation of base-excision repair(GO:1905051) positive regulation of base-excision repair(GO:1905053) |
| 3.2 |
6.5 |
GO:0061304 |
retinal blood vessel morphogenesis(GO:0061304) |
| 3.2 |
9.7 |
GO:0032571 |
response to vitamin K(GO:0032571) |
| 3.2 |
6.5 |
GO:0044340 |
canonical Wnt signaling pathway involved in regulation of cell proliferation(GO:0044340) |
| 3.2 |
35.5 |
GO:0010919 |
regulation of inositol phosphate biosynthetic process(GO:0010919) positive regulation of inositol phosphate biosynthetic process(GO:0060732) |
| 3.2 |
6.4 |
GO:0060662 |
tube lumen cavitation(GO:0060605) salivary gland cavitation(GO:0060662) |
| 3.2 |
6.4 |
GO:0043504 |
mitochondrial DNA repair(GO:0043504) |
| 3.2 |
12.9 |
GO:1990834 |
response to odorant(GO:1990834) |
| 3.2 |
9.6 |
GO:0008272 |
sulfate transport(GO:0008272) |
| 3.2 |
6.4 |
GO:0060287 |
epithelial cilium movement involved in determination of left/right asymmetry(GO:0060287) |
| 3.2 |
12.8 |
GO:2000192 |
negative regulation of fatty acid transport(GO:2000192) |
| 3.2 |
9.5 |
GO:0048104 |
establishment of body hair or bristle planar orientation(GO:0048104) establishment of body hair planar orientation(GO:0048105) |
| 3.2 |
22.2 |
GO:0032455 |
nerve growth factor processing(GO:0032455) |
| 3.2 |
3.2 |
GO:0032971 |
regulation of muscle filament sliding(GO:0032971) |
| 3.2 |
28.5 |
GO:0015871 |
choline transport(GO:0015871) |
| 3.2 |
50.6 |
GO:0007189 |
adenylate cyclase-activating G-protein coupled receptor signaling pathway(GO:0007189) |
| 3.2 |
3.2 |
GO:0051097 |
negative regulation of helicase activity(GO:0051097) |
| 3.2 |
3.2 |
GO:1903015 |
regulation of exo-alpha-sialidase activity(GO:1903015) |
| 3.2 |
12.6 |
GO:0097460 |
ferrous iron import into cell(GO:0097460) ferrous iron import across plasma membrane(GO:0098707) |
| 3.2 |
12.6 |
GO:0099563 |
modification of synaptic structure(GO:0099563) |
| 3.2 |
3.2 |
GO:1900154 |
regulation of bone trabecula formation(GO:1900154) negative regulation of bone trabecula formation(GO:1900155) |
| 3.1 |
62.9 |
GO:0021904 |
dorsal/ventral neural tube patterning(GO:0021904) |
| 3.1 |
15.7 |
GO:0038170 |
somatostatin receptor signaling pathway(GO:0038169) somatostatin signaling pathway(GO:0038170) |
| 3.1 |
9.4 |
GO:0018101 |
protein citrullination(GO:0018101) histone citrullination(GO:0036414) |
| 3.1 |
9.4 |
GO:1903538 |
meiotic spindle elongation(GO:0051232) meiotic cell cycle process involved in oocyte maturation(GO:1903537) regulation of meiotic cell cycle process involved in oocyte maturation(GO:1903538) |
| 3.1 |
3.1 |
GO:0035313 |
wound healing, spreading of epidermal cells(GO:0035313) |
| 3.1 |
18.7 |
GO:0002430 |
complement receptor mediated signaling pathway(GO:0002430) |
| 3.1 |
12.5 |
GO:0034128 |
negative regulation of MyD88-independent toll-like receptor signaling pathway(GO:0034128) |
| 3.1 |
9.3 |
GO:1903892 |
negative regulation of ATF6-mediated unfolded protein response(GO:1903892) |
| 3.1 |
6.2 |
GO:1904923 |
regulation of mitophagy in response to mitochondrial depolarization(GO:1904923) |
| 3.1 |
3.1 |
GO:0043619 |
regulation of transcription from RNA polymerase II promoter in response to oxidative stress(GO:0043619) |
| 3.1 |
34.0 |
GO:0090042 |
tubulin deacetylation(GO:0090042) regulation of tubulin deacetylation(GO:0090043) |
| 3.1 |
43.3 |
GO:0038065 |
collagen-activated signaling pathway(GO:0038065) |
| 3.1 |
3.1 |
GO:0002428 |
antigen processing and presentation of peptide antigen via MHC class Ib(GO:0002428) |
| 3.1 |
3.1 |
GO:0071286 |
cellular response to magnesium ion(GO:0071286) |
| 3.1 |
24.5 |
GO:0061709 |
reticulophagy(GO:0061709) |
| 3.1 |
76.5 |
GO:0001580 |
detection of chemical stimulus involved in sensory perception of bitter taste(GO:0001580) |
| 3.1 |
12.2 |
GO:0048671 |
negative regulation of collateral sprouting(GO:0048671) |
| 3.1 |
3.1 |
GO:2000191 |
regulation of fatty acid transport(GO:2000191) |
| 3.1 |
51.9 |
GO:0010669 |
epithelial structure maintenance(GO:0010669) |
| 3.0 |
6.1 |
GO:1901876 |
regulation of calcium ion binding(GO:1901876) negative regulation of calcium ion binding(GO:1901877) |
| 3.0 |
3.0 |
GO:0060005 |
vestibular reflex(GO:0060005) |
| 3.0 |
21.3 |
GO:0006857 |
oligopeptide transport(GO:0006857) |
| 3.0 |
9.1 |
GO:0060501 |
positive regulation of epithelial cell proliferation involved in lung morphogenesis(GO:0060501) |
| 3.0 |
36.3 |
GO:0023035 |
CD40 signaling pathway(GO:0023035) |
| 3.0 |
12.1 |
GO:0032736 |
positive regulation of interleukin-13 production(GO:0032736) |
| 3.0 |
3.0 |
GO:1990637 |
response to prolactin(GO:1990637) |
| 3.0 |
9.0 |
GO:0031069 |
hair follicle morphogenesis(GO:0031069) |
| 3.0 |
9.0 |
GO:0000023 |
maltose metabolic process(GO:0000023) |
| 3.0 |
60.0 |
GO:0031293 |
membrane protein intracellular domain proteolysis(GO:0031293) |
| 3.0 |
23.9 |
GO:0097369 |
sodium ion import(GO:0097369) |
| 3.0 |
20.9 |
GO:0042148 |
strand invasion(GO:0042148) |
| 3.0 |
8.9 |
GO:1905064 |
negative regulation of vascular smooth muscle cell differentiation(GO:1905064) |
| 3.0 |
3.0 |
GO:0046533 |
negative regulation of photoreceptor cell differentiation(GO:0046533) |
| 3.0 |
11.9 |
GO:0030885 |
regulation of myeloid dendritic cell activation(GO:0030885) |
| 3.0 |
3.0 |
GO:2000189 |
positive regulation of cholesterol homeostasis(GO:2000189) |
| 3.0 |
14.8 |
GO:0051122 |
hepoxilin metabolic process(GO:0051121) hepoxilin biosynthetic process(GO:0051122) |
| 3.0 |
11.9 |
GO:0031443 |
fast-twitch skeletal muscle fiber contraction(GO:0031443) |
| 3.0 |
8.9 |
GO:0045626 |
negative regulation of T-helper 1 cell differentiation(GO:0045626) |
| 2.9 |
2.9 |
GO:1900107 |
regulation of nodal signaling pathway(GO:1900107) |
| 2.9 |
14.7 |
GO:0060363 |
cranial suture morphogenesis(GO:0060363) |
| 2.9 |
11.8 |
GO:2000503 |
regulation of natural killer cell chemotaxis(GO:2000501) positive regulation of natural killer cell chemotaxis(GO:2000503) |
| 2.9 |
8.8 |
GO:0044565 |
dendritic cell proliferation(GO:0044565) |
| 2.9 |
11.7 |
GO:2000291 |
regulation of myoblast proliferation(GO:2000291) |
| 2.9 |
181.8 |
GO:0030574 |
collagen catabolic process(GO:0030574) |
| 2.9 |
8.8 |
GO:1902490 |
regulation of sperm capacitation(GO:1902490) |
| 2.9 |
5.8 |
GO:0016045 |
detection of bacterium(GO:0016045) |
| 2.9 |
20.4 |
GO:0055003 |
cardiac myofibril assembly(GO:0055003) |
| 2.9 |
11.6 |
GO:0060800 |
regulation of cell differentiation involved in embryonic placenta development(GO:0060800) |
| 2.9 |
2.9 |
GO:0021798 |
forebrain dorsal/ventral pattern formation(GO:0021798) |
| 2.9 |
17.4 |
GO:0071105 |
response to interleukin-11(GO:0071105) |
| 2.9 |
5.8 |
GO:0021914 |
negative regulation of smoothened signaling pathway involved in ventral spinal cord patterning(GO:0021914) |
| 2.9 |
8.7 |
GO:0015855 |
pyrimidine nucleobase transport(GO:0015855) purine nucleobase transmembrane transport(GO:1904823) |
| 2.9 |
5.8 |
GO:0033210 |
leptin-mediated signaling pathway(GO:0033210) |
| 2.9 |
34.6 |
GO:0051281 |
positive regulation of release of sequestered calcium ion into cytosol(GO:0051281) |
| 2.9 |
5.8 |
GO:1903378 |
positive regulation of oxidative stress-induced neuron intrinsic apoptotic signaling pathway(GO:1903378) |
| 2.9 |
46.2 |
GO:0060394 |
negative regulation of pathway-restricted SMAD protein phosphorylation(GO:0060394) |
| 2.9 |
26.0 |
GO:0043217 |
myelin maintenance(GO:0043217) |
| 2.9 |
31.7 |
GO:0051386 |
regulation of neurotrophin TRK receptor signaling pathway(GO:0051386) |
| 2.9 |
20.1 |
GO:0052203 |
modulation by symbiont of host molecular function(GO:0052055) modulation of catalytic activity in other organism involved in symbiotic interaction(GO:0052203) modulation by host of symbiont catalytic activity(GO:0052422) |
| 2.9 |
8.6 |
GO:0050653 |
chondroitin sulfate proteoglycan biosynthetic process, polysaccharide chain biosynthetic process(GO:0050653) |
| 2.9 |
11.5 |
GO:0036124 |
histone H3-K9 trimethylation(GO:0036124) |
| 2.9 |
11.4 |
GO:0072708 |
response to sorbitol(GO:0072708) |
| 2.8 |
2.8 |
GO:2000777 |
positive regulation of proteasomal ubiquitin-dependent protein catabolic process involved in cellular response to hypoxia(GO:2000777) |
| 2.8 |
2.8 |
GO:1990641 |
regulation of iron ion transport(GO:0034756) regulation of iron ion transmembrane transport(GO:0034759) response to iron ion starvation(GO:1990641) |
| 2.8 |
8.5 |
GO:0051970 |
negative regulation of transmission of nerve impulse(GO:0051970) |
| 2.8 |
5.7 |
GO:1900190 |
biofilm formation(GO:0042710) single-species biofilm formation(GO:0044010) single-species biofilm formation in or on host organism(GO:0044407) regulation of single-species biofilm formation(GO:1900190) negative regulation of single-species biofilm formation(GO:1900191) regulation of single-species biofilm formation in or on host organism(GO:1900228) negative regulation of single-species biofilm formation in or on host organism(GO:1900229) |
| 2.8 |
36.7 |
GO:0051457 |
maintenance of protein location in nucleus(GO:0051457) |
| 2.8 |
16.9 |
GO:0060742 |
epithelial cell differentiation involved in prostate gland development(GO:0060742) |
| 2.8 |
11.2 |
GO:0051344 |
negative regulation of cyclic-nucleotide phosphodiesterase activity(GO:0051344) |
| 2.8 |
19.6 |
GO:0006003 |
fructose 2,6-bisphosphate metabolic process(GO:0006003) |
| 2.8 |
42.0 |
GO:0009950 |
dorsal/ventral axis specification(GO:0009950) |
| 2.8 |
14.0 |
GO:1902037 |
negative regulation of hematopoietic stem cell differentiation(GO:1902037) |
| 2.8 |
8.4 |
GO:0034497 |
protein localization to pre-autophagosomal structure(GO:0034497) |
| 2.8 |
5.6 |
GO:1990086 |
lens fiber cell apoptotic process(GO:1990086) |
| 2.8 |
2.8 |
GO:0090091 |
positive regulation of extracellular matrix disassembly(GO:0090091) |
| 2.8 |
41.7 |
GO:0018026 |
peptidyl-lysine monomethylation(GO:0018026) |
| 2.8 |
2.8 |
GO:0035634 |
response to stilbenoid(GO:0035634) |
| 2.8 |
2.8 |
GO:0050955 |
thermoception(GO:0050955) |
| 2.8 |
2.8 |
GO:1903336 |
negative regulation of vacuolar transport(GO:1903336) |
| 2.8 |
11.0 |
GO:0018199 |
peptidyl-glutamine modification(GO:0018199) |
| 2.7 |
8.2 |
GO:0060314 |
regulation of ryanodine-sensitive calcium-release channel activity(GO:0060314) |
| 2.7 |
35.7 |
GO:0048642 |
negative regulation of skeletal muscle tissue development(GO:0048642) |
| 2.7 |
11.0 |
GO:0036269 |
swimming behavior(GO:0036269) |
| 2.7 |
19.1 |
GO:0051930 |
regulation of sensory perception of pain(GO:0051930) regulation of sensory perception(GO:0051931) |
| 2.7 |
10.9 |
GO:0001777 |
T cell homeostatic proliferation(GO:0001777) regulation of T cell homeostatic proliferation(GO:0046013) |
| 2.7 |
8.2 |
GO:0038193 |
thromboxane A2 signaling pathway(GO:0038193) |
| 2.7 |
8.1 |
GO:0009397 |
folic acid-containing compound catabolic process(GO:0009397) pteridine-containing compound catabolic process(GO:0042560) |
| 2.7 |
10.8 |
GO:0097411 |
hypoxia-inducible factor-1alpha signaling pathway(GO:0097411) |
| 2.7 |
89.3 |
GO:0033173 |
calcineurin-NFAT signaling cascade(GO:0033173) |
| 2.7 |
2.7 |
GO:0003176 |
aortic valve development(GO:0003176) aortic valve morphogenesis(GO:0003180) |
| 2.7 |
2.7 |
GO:2000380 |
regulation of mesoderm development(GO:2000380) |
| 2.7 |
2.7 |
GO:0016098 |
monoterpenoid metabolic process(GO:0016098) |
| 2.7 |
45.6 |
GO:0030517 |
negative regulation of axon extension(GO:0030517) |
| 2.7 |
10.7 |
GO:0042905 |
9-cis-retinoic acid biosynthetic process(GO:0042904) 9-cis-retinoic acid metabolic process(GO:0042905) |
| 2.7 |
5.4 |
GO:1903059 |
regulation of protein lipidation(GO:1903059) positive regulation of protein lipidation(GO:1903061) |
| 2.7 |
2.7 |
GO:0071280 |
cellular response to copper ion(GO:0071280) |
| 2.7 |
5.3 |
GO:0000429 |
carbon catabolite regulation of transcription from RNA polymerase II promoter(GO:0000429) carbon catabolite activation of transcription from RNA polymerase II promoter(GO:0000436) |
| 2.7 |
5.3 |
GO:0030241 |
skeletal muscle myosin thick filament assembly(GO:0030241) |
| 2.7 |
24.0 |
GO:0060050 |
positive regulation of protein glycosylation(GO:0060050) |
| 2.7 |
10.7 |
GO:0003016 |
respiratory system process(GO:0003016) |
| 2.7 |
2.7 |
GO:1900104 |
hyaluranon cable assembly(GO:0036118) regulation of hyaluranon cable assembly(GO:1900104) positive regulation of hyaluranon cable assembly(GO:1900106) |
| 2.7 |
8.0 |
GO:0071883 |
activation of MAPK activity by adrenergic receptor signaling pathway(GO:0071883) |
| 2.7 |
2.7 |
GO:0060676 |
ureteric bud formation(GO:0060676) |
| 2.7 |
8.0 |
GO:0010890 |
positive regulation of sequestering of triglyceride(GO:0010890) |
| 2.7 |
10.7 |
GO:0007512 |
adult heart development(GO:0007512) |
| 2.7 |
29.3 |
GO:0010668 |
ectodermal cell differentiation(GO:0010668) |
| 2.7 |
21.2 |
GO:0060081 |
membrane hyperpolarization(GO:0060081) |
| 2.6 |
13.2 |
GO:0051725 |
protein de-ADP-ribosylation(GO:0051725) |
| 2.6 |
5.3 |
GO:0035989 |
tendon development(GO:0035989) |
| 2.6 |
44.8 |
GO:0006646 |
phosphatidylethanolamine biosynthetic process(GO:0006646) |
| 2.6 |
15.8 |
GO:0042074 |
cell migration involved in gastrulation(GO:0042074) |
| 2.6 |
7.9 |
GO:0042357 |
thiamine diphosphate metabolic process(GO:0042357) |
| 2.6 |
10.5 |
GO:0030259 |
lipid glycosylation(GO:0030259) |
| 2.6 |
5.2 |
GO:0060708 |
spongiotrophoblast differentiation(GO:0060708) |
| 2.6 |
2.6 |
GO:0072177 |
mesonephric duct development(GO:0072177) |
| 2.6 |
2.6 |
GO:0010693 |
negative regulation of alkaline phosphatase activity(GO:0010693) |
| 2.6 |
31.2 |
GO:0042737 |
drug catabolic process(GO:0042737) |
| 2.6 |
10.4 |
GO:0006049 |
UDP-N-acetylglucosamine catabolic process(GO:0006049) |
| 2.6 |
10.4 |
GO:0045591 |
positive regulation of regulatory T cell differentiation(GO:0045591) |
| 2.6 |
38.9 |
GO:0015872 |
dopamine transport(GO:0015872) |
| 2.6 |
38.9 |
GO:0021854 |
hypothalamus development(GO:0021854) |
| 2.6 |
31.0 |
GO:1901897 |
regulation of relaxation of cardiac muscle(GO:1901897) |
| 2.6 |
2.6 |
GO:0009826 |
unidimensional cell growth(GO:0009826) |
| 2.6 |
2.6 |
GO:0032914 |
positive regulation of transforming growth factor beta1 production(GO:0032914) |
| 2.6 |
10.3 |
GO:2000346 |
negative regulation of hepatocyte proliferation(GO:2000346) |
| 2.6 |
10.2 |
GO:1905225 |
thyroid-stimulating hormone signaling pathway(GO:0038194) response to thyrotropin-releasing hormone(GO:1905225) |
| 2.6 |
2.6 |
GO:0090086 |
negative regulation of protein deubiquitination(GO:0090086) |
| 2.5 |
15.3 |
GO:0042373 |
vitamin K metabolic process(GO:0042373) |
| 2.5 |
15.3 |
GO:0045725 |
positive regulation of glycogen biosynthetic process(GO:0045725) |
| 2.5 |
2.5 |
GO:0070673 |
response to interleukin-18(GO:0070673) |
| 2.5 |
17.8 |
GO:0031987 |
locomotion involved in locomotory behavior(GO:0031987) |
| 2.5 |
5.1 |
GO:0098735 |
positive regulation of the force of heart contraction(GO:0098735) |
| 2.5 |
88.7 |
GO:0050919 |
negative chemotaxis(GO:0050919) |
| 2.5 |
7.6 |
GO:0030573 |
bile acid catabolic process(GO:0030573) |
| 2.5 |
10.1 |
GO:0045059 |
positive thymic T cell selection(GO:0045059) |
| 2.5 |
5.0 |
GO:0045590 |
negative regulation of regulatory T cell differentiation(GO:0045590) |
| 2.5 |
12.6 |
GO:0060841 |
venous blood vessel development(GO:0060841) |
| 2.5 |
12.5 |
GO:1905146 |
lysosomal protein catabolic process(GO:1905146) |
| 2.5 |
5.0 |
GO:0006883 |
cellular sodium ion homeostasis(GO:0006883) |
| 2.5 |
12.5 |
GO:0060290 |
transdifferentiation(GO:0060290) |
| 2.5 |
7.5 |
GO:0042118 |
endothelial cell activation(GO:0042118) |
| 2.5 |
10.0 |
GO:0006880 |
intracellular sequestering of iron ion(GO:0006880) sequestering of iron ion(GO:0097577) |
| 2.5 |
5.0 |
GO:0051005 |
negative regulation of lipoprotein lipase activity(GO:0051005) |
| 2.5 |
7.5 |
GO:0045903 |
positive regulation of translational fidelity(GO:0045903) |
| 2.5 |
5.0 |
GO:0030205 |
dermatan sulfate metabolic process(GO:0030205) |
| 2.5 |
5.0 |
GO:0035790 |
platelet-derived growth factor receptor-alpha signaling pathway(GO:0035790) |
| 2.5 |
10.0 |
GO:0048102 |
autophagic cell death(GO:0048102) |
| 2.5 |
14.9 |
GO:0031643 |
positive regulation of myelination(GO:0031643) |
| 2.5 |
49.8 |
GO:0001954 |
positive regulation of cell-matrix adhesion(GO:0001954) |
| 2.5 |
42.2 |
GO:0003322 |
pancreatic A cell development(GO:0003322) |
| 2.5 |
5.0 |
GO:0001975 |
response to amphetamine(GO:0001975) |
| 2.5 |
2.5 |
GO:0001955 |
blood vessel maturation(GO:0001955) |
| 2.5 |
12.4 |
GO:0051415 |
interphase microtubule nucleation by interphase microtubule organizing center(GO:0051415) microtubule nucleation by microtubule organizing center(GO:0051418) |
| 2.5 |
14.8 |
GO:0032958 |
inositol phosphate biosynthetic process(GO:0032958) |
| 2.5 |
7.4 |
GO:0010793 |
regulation of mRNA export from nucleus(GO:0010793) |
| 2.5 |
4.9 |
GO:0060896 |
neural plate pattern specification(GO:0060896) |
| 2.5 |
2.5 |
GO:0048841 |
regulation of axon extension involved in axon guidance(GO:0048841) |
| 2.5 |
46.7 |
GO:0010761 |
fibroblast migration(GO:0010761) |
| 2.5 |
2.5 |
GO:0010934 |
macrophage cytokine production(GO:0010934) |
| 2.4 |
12.2 |
GO:0006154 |
adenosine catabolic process(GO:0006154) hypoxanthine salvage(GO:0043103) inosine biosynthetic process(GO:0046103) |
| 2.4 |
19.6 |
GO:0043653 |
mitochondrial fragmentation involved in apoptotic process(GO:0043653) |
| 2.4 |
7.3 |
GO:0051295 |
establishment of meiotic spindle localization(GO:0051295) |
| 2.4 |
19.5 |
GO:0001767 |
establishment of lymphocyte polarity(GO:0001767) |
| 2.4 |
80.5 |
GO:0018149 |
peptide cross-linking(GO:0018149) |
| 2.4 |
2.4 |
GO:0030213 |
hyaluronan biosynthetic process(GO:0030213) |
| 2.4 |
2.4 |
GO:0055075 |
potassium ion homeostasis(GO:0055075) |
| 2.4 |
2.4 |
GO:0033686 |
positive regulation of luteinizing hormone secretion(GO:0033686) |
| 2.4 |
2.4 |
GO:1902004 |
positive regulation of beta-amyloid formation(GO:1902004) |
| 2.4 |
7.2 |
GO:0072675 |
multinuclear osteoclast differentiation(GO:0072674) osteoclast fusion(GO:0072675) |
| 2.4 |
4.8 |
GO:0071499 |
cellular response to laminar fluid shear stress(GO:0071499) |
| 2.4 |
88.9 |
GO:0007212 |
dopamine receptor signaling pathway(GO:0007212) |
| 2.4 |
2.4 |
GO:0097267 |
omega-hydroxylase P450 pathway(GO:0097267) |
| 2.4 |
4.8 |
GO:0060125 |
negative regulation of growth hormone secretion(GO:0060125) |
| 2.4 |
21.6 |
GO:0050930 |
induction of positive chemotaxis(GO:0050930) |
| 2.4 |
4.8 |
GO:0001964 |
startle response(GO:0001964) |
| 2.4 |
11.9 |
GO:0006569 |
tryptophan catabolic process(GO:0006569) indole-containing compound catabolic process(GO:0042436) indolalkylamine catabolic process(GO:0046218) |
| 2.4 |
19.0 |
GO:0032534 |
regulation of microvillus assembly(GO:0032534) |
| 2.4 |
21.4 |
GO:0030210 |
heparin metabolic process(GO:0030202) heparin biosynthetic process(GO:0030210) |
| 2.4 |
2.4 |
GO:0038162 |
erythropoietin-mediated signaling pathway(GO:0038162) |
| 2.4 |
16.5 |
GO:0045879 |
negative regulation of smoothened signaling pathway(GO:0045879) |
| 2.4 |
4.7 |
GO:0015811 |
L-cystine transport(GO:0015811) |
| 2.3 |
7.0 |
GO:0050861 |
positive regulation of B cell receptor signaling pathway(GO:0050861) |
| 2.3 |
7.0 |
GO:0070945 |
neutrophil mediated killing of gram-negative bacterium(GO:0070945) |
| 2.3 |
11.7 |
GO:1900245 |
positive regulation of MDA-5 signaling pathway(GO:1900245) |
| 2.3 |
16.3 |
GO:0070314 |
G1 to G0 transition(GO:0070314) |
| 2.3 |
4.7 |
GO:0042631 |
cellular response to water deprivation(GO:0042631) |
| 2.3 |
32.4 |
GO:1904714 |
regulation of chaperone-mediated autophagy(GO:1904714) |
| 2.3 |
6.9 |
GO:0036292 |
DNA rewinding(GO:0036292) |
| 2.3 |
23.1 |
GO:0021895 |
cerebral cortex neuron differentiation(GO:0021895) |
| 2.3 |
11.5 |
GO:0007220 |
Notch receptor processing(GO:0007220) |
| 2.3 |
11.5 |
GO:2000400 |
positive regulation of T cell differentiation in thymus(GO:0033089) positive regulation of thymocyte aggregation(GO:2000400) |
| 2.3 |
18.3 |
GO:1900028 |
negative regulation of ruffle assembly(GO:1900028) |
| 2.3 |
4.6 |
GO:0071557 |
histone H3-K27 demethylation(GO:0071557) |
| 2.3 |
9.2 |
GO:0014807 |
regulation of somitogenesis(GO:0014807) |
| 2.3 |
16.0 |
GO:0045721 |
negative regulation of gluconeogenesis(GO:0045721) |
| 2.3 |
29.7 |
GO:1901750 |
leukotriene D4 metabolic process(GO:1901748) leukotriene D4 biosynthetic process(GO:1901750) |
| 2.3 |
18.2 |
GO:0000160 |
phosphorelay signal transduction system(GO:0000160) |
| 2.3 |
4.5 |
GO:0070633 |
transepithelial transport(GO:0070633) |
| 2.3 |
2.3 |
GO:1901529 |
positive regulation of anion channel activity(GO:1901529) |
| 2.3 |
13.6 |
GO:0007506 |
gonadal mesoderm development(GO:0007506) |
| 2.3 |
11.3 |
GO:0032494 |
response to peptidoglycan(GO:0032494) |
| 2.3 |
18.1 |
GO:0044065 |
regulation of respiratory system process(GO:0044065) |
| 2.3 |
11.3 |
GO:1901094 |
regulation of protein tetramerization(GO:1901090) negative regulation of protein tetramerization(GO:1901091) regulation of protein homotetramerization(GO:1901093) negative regulation of protein homotetramerization(GO:1901094) |
| 2.3 |
13.5 |
GO:0022027 |
interkinetic nuclear migration(GO:0022027) |
| 2.3 |
24.8 |
GO:0044804 |
nucleophagy(GO:0044804) |
| 2.2 |
6.7 |
GO:0051136 |
regulation of extrathymic T cell differentiation(GO:0033082) regulation of NK T cell differentiation(GO:0051136) sebum secreting cell proliferation(GO:1990654) |
| 2.2 |
17.9 |
GO:0006013 |
mannose metabolic process(GO:0006013) |
| 2.2 |
17.9 |
GO:0019262 |
N-acetylneuraminate catabolic process(GO:0019262) |
| 2.2 |
13.4 |
GO:2000786 |
positive regulation of autophagosome assembly(GO:2000786) |
| 2.2 |
22.3 |
GO:2000310 |
regulation of N-methyl-D-aspartate selective glutamate receptor activity(GO:2000310) |
| 2.2 |
29.0 |
GO:1902043 |
positive regulation of extrinsic apoptotic signaling pathway via death domain receptors(GO:1902043) |
| 2.2 |
8.9 |
GO:0070977 |
bone maturation(GO:0070977) |
| 2.2 |
28.8 |
GO:0072538 |
T-helper 17 type immune response(GO:0072538) |
| 2.2 |
13.2 |
GO:0035617 |
stress granule disassembly(GO:0035617) |
| 2.2 |
13.1 |
GO:0009134 |
nucleoside diphosphate catabolic process(GO:0009134) |
| 2.2 |
10.9 |
GO:0060346 |
bone trabecula formation(GO:0060346) |
| 2.2 |
4.4 |
GO:0032225 |
regulation of synaptic transmission, dopaminergic(GO:0032225) |
| 2.2 |
28.4 |
GO:0070070 |
proton-transporting V-type ATPase complex assembly(GO:0070070) vacuolar proton-transporting V-type ATPase complex assembly(GO:0070072) |
| 2.2 |
2.2 |
GO:0090298 |
negative regulation of mitochondrial DNA replication(GO:0090298) negative regulation of mitochondrial DNA metabolic process(GO:1901859) |
| 2.2 |
10.9 |
GO:0008090 |
retrograde axonal transport(GO:0008090) |
| 2.2 |
21.5 |
GO:0002029 |
desensitization of G-protein coupled receptor protein signaling pathway(GO:0002029) negative adaptation of signaling pathway(GO:0022401) |
| 2.2 |
79.7 |
GO:0032729 |
positive regulation of interferon-gamma production(GO:0032729) |
| 2.1 |
62.2 |
GO:0086010 |
membrane depolarization during action potential(GO:0086010) |
| 2.1 |
6.4 |
GO:0001865 |
NK T cell differentiation(GO:0001865) |
| 2.1 |
8.6 |
GO:0021691 |
cerebellar Purkinje cell layer maturation(GO:0021691) |
| 2.1 |
6.4 |
GO:0015888 |
thiamine transport(GO:0015888) thiamine transmembrane transport(GO:0071934) |
| 2.1 |
10.7 |
GO:0042753 |
positive regulation of circadian rhythm(GO:0042753) |
| 2.1 |
17.0 |
GO:0048003 |
antigen processing and presentation via MHC class Ib(GO:0002475) antigen processing and presentation of lipid antigen via MHC class Ib(GO:0048003) antigen processing and presentation, exogenous lipid antigen via MHC class Ib(GO:0048007) |
| 2.1 |
6.4 |
GO:1901053 |
sarcosine metabolic process(GO:1901052) sarcosine catabolic process(GO:1901053) |
| 2.1 |
27.6 |
GO:0050771 |
negative regulation of axonogenesis(GO:0050771) |
| 2.1 |
6.4 |
GO:0040019 |
positive regulation of embryonic development(GO:0040019) |
| 2.1 |
6.4 |
GO:0045110 |
intermediate filament bundle assembly(GO:0045110) |
| 2.1 |
4.2 |
GO:0034441 |
plasma lipoprotein particle oxidation(GO:0034441) |
| 2.1 |
4.2 |
GO:0034124 |
regulation of MyD88-dependent toll-like receptor signaling pathway(GO:0034124) |
| 2.1 |
4.2 |
GO:0060445 |
branching involved in salivary gland morphogenesis(GO:0060445) |
| 2.1 |
25.3 |
GO:0021954 |
central nervous system neuron development(GO:0021954) |
| 2.1 |
6.3 |
GO:0045348 |
positive regulation of MHC class II biosynthetic process(GO:0045348) |
| 2.1 |
2.1 |
GO:0048541 |
mucosal-associated lymphoid tissue development(GO:0048537) Peyer's patch development(GO:0048541) Peyer's patch morphogenesis(GO:0061146) |
| 2.1 |
14.7 |
GO:0031998 |
regulation of fatty acid beta-oxidation(GO:0031998) |
| 2.1 |
2.1 |
GO:0051877 |
pigment granule aggregation in cell center(GO:0051877) |
| 2.1 |
21.0 |
GO:0051481 |
negative regulation of cytosolic calcium ion concentration(GO:0051481) |
| 2.1 |
18.8 |
GO:0043249 |
erythrocyte maturation(GO:0043249) |
| 2.1 |
2.1 |
GO:0019532 |
oxalate transport(GO:0019532) |
| 2.1 |
2.1 |
GO:1904970 |
brush border assembly(GO:1904970) |
| 2.1 |
4.2 |
GO:0061357 |
positive regulation of Wnt protein secretion(GO:0061357) |
| 2.1 |
39.3 |
GO:0097120 |
receptor localization to synapse(GO:0097120) |
| 2.1 |
2.1 |
GO:2000018 |
regulation of male gonad development(GO:2000018) |
| 2.1 |
4.1 |
GO:0010759 |
positive regulation of macrophage chemotaxis(GO:0010759) |
| 2.1 |
6.2 |
GO:0060689 |
cell differentiation involved in salivary gland development(GO:0060689) |
| 2.1 |
2.1 |
GO:0006990 |
positive regulation of transcription from RNA polymerase II promoter involved in unfolded protein response(GO:0006990) |
| 2.0 |
14.3 |
GO:0046465 |
dolichyl diphosphate biosynthetic process(GO:0006489) dolichyl diphosphate metabolic process(GO:0046465) |
| 2.0 |
10.2 |
GO:0051593 |
response to folic acid(GO:0051593) |
| 2.0 |
20.4 |
GO:0071276 |
cellular response to cadmium ion(GO:0071276) |
| 2.0 |
18.3 |
GO:0002523 |
leukocyte migration involved in inflammatory response(GO:0002523) |
| 2.0 |
12.2 |
GO:0030860 |
regulation of polarized epithelial cell differentiation(GO:0030860) |
| 2.0 |
235.7 |
GO:0006958 |
complement activation, classical pathway(GO:0006958) |
| 2.0 |
16.2 |
GO:0034656 |
nucleobase-containing small molecule catabolic process(GO:0034656) |
| 2.0 |
48.7 |
GO:2000369 |
regulation of clathrin-mediated endocytosis(GO:2000369) |
| 2.0 |
4.1 |
GO:0050655 |
dermatan sulfate proteoglycan metabolic process(GO:0050655) |
| 2.0 |
12.2 |
GO:0010719 |
negative regulation of epithelial to mesenchymal transition(GO:0010719) |
| 2.0 |
2.0 |
GO:0002513 |
tolerance induction to self antigen(GO:0002513) |
| 2.0 |
10.0 |
GO:0042758 |
long-chain fatty acid catabolic process(GO:0042758) |
| 2.0 |
6.0 |
GO:0098507 |
polynucleotide 5' dephosphorylation(GO:0098507) |
| 2.0 |
119.5 |
GO:0006501 |
C-terminal protein lipidation(GO:0006501) |
| 2.0 |
11.9 |
GO:0034122 |
negative regulation of toll-like receptor signaling pathway(GO:0034122) |
| 2.0 |
45.7 |
GO:0046928 |
regulation of neurotransmitter secretion(GO:0046928) |
| 2.0 |
4.0 |
GO:0060666 |
dichotomous subdivision of terminal units involved in salivary gland branching(GO:0060666) |
| 2.0 |
7.9 |
GO:0038092 |
nodal signaling pathway(GO:0038092) |
| 2.0 |
77.2 |
GO:0009214 |
cyclic nucleotide catabolic process(GO:0009214) |
| 2.0 |
39.5 |
GO:0021952 |
central nervous system projection neuron axonogenesis(GO:0021952) |
| 2.0 |
9.9 |
GO:0031666 |
positive regulation of lipopolysaccharide-mediated signaling pathway(GO:0031666) |
| 2.0 |
13.8 |
GO:0015732 |
prostaglandin transport(GO:0015732) |
| 2.0 |
5.9 |
GO:0018377 |
protein myristoylation(GO:0018377) |
| 2.0 |
13.8 |
GO:0006203 |
dGTP catabolic process(GO:0006203) |
| 2.0 |
9.8 |
GO:0032377 |
regulation of intracellular lipid transport(GO:0032377) regulation of intracellular sterol transport(GO:0032380) regulation of intracellular cholesterol transport(GO:0032383) |
| 2.0 |
3.9 |
GO:0002024 |
diet induced thermogenesis(GO:0002024) |
| 2.0 |
7.8 |
GO:0071110 |
protein biotinylation(GO:0009305) histone biotinylation(GO:0071110) |
| 1.9 |
3.9 |
GO:0097237 |
cellular response to toxic substance(GO:0097237) |
| 1.9 |
3.9 |
GO:2000253 |
positive regulation of feeding behavior(GO:2000253) |
| 1.9 |
3.9 |
GO:0002725 |
negative regulation of T cell cytokine production(GO:0002725) |
| 1.9 |
52.0 |
GO:0035428 |
hexose transmembrane transport(GO:0035428) glucose transmembrane transport(GO:1904659) |
| 1.9 |
5.8 |
GO:0038163 |
thrombopoietin-mediated signaling pathway(GO:0038163) |
| 1.9 |
17.3 |
GO:0071380 |
cellular response to prostaglandin E stimulus(GO:0071380) |
| 1.9 |
3.8 |
GO:0021692 |
cerebellar Purkinje cell layer morphogenesis(GO:0021692) |
| 1.9 |
5.7 |
GO:0060022 |
hard palate development(GO:0060022) |
| 1.9 |
3.8 |
GO:0043032 |
positive regulation of macrophage activation(GO:0043032) |
| 1.9 |
15.3 |
GO:0006686 |
sphingomyelin biosynthetic process(GO:0006686) |
| 1.9 |
13.3 |
GO:0007620 |
copulation(GO:0007620) |
| 1.9 |
9.5 |
GO:0034382 |
chylomicron remnant clearance(GO:0034382) triglyceride-rich lipoprotein particle clearance(GO:0071830) |
| 1.9 |
5.7 |
GO:0043606 |
histidine catabolic process(GO:0006548) histidine catabolic process to glutamate and formamide(GO:0019556) histidine catabolic process to glutamate and formate(GO:0019557) formamide metabolic process(GO:0043606) imidazole-containing compound catabolic process(GO:0052805) |
| 1.9 |
1.9 |
GO:0070640 |
vitamin D3 metabolic process(GO:0070640) |
| 1.9 |
3.8 |
GO:0061386 |
closure of optic fissure(GO:0061386) |
| 1.9 |
50.6 |
GO:0007218 |
neuropeptide signaling pathway(GO:0007218) |
| 1.9 |
22.4 |
GO:1902259 |
regulation of delayed rectifier potassium channel activity(GO:1902259) |
| 1.9 |
20.5 |
GO:0047484 |
regulation of response to osmotic stress(GO:0047484) |
| 1.8 |
1.8 |
GO:0038003 |
opioid receptor signaling pathway(GO:0038003) |
| 1.8 |
1.8 |
GO:0034138 |
toll-like receptor 3 signaling pathway(GO:0034138) |
| 1.8 |
36.7 |
GO:0033540 |
fatty acid beta-oxidation using acyl-CoA oxidase(GO:0033540) |
| 1.8 |
1.8 |
GO:0007521 |
muscle cell fate determination(GO:0007521) |
| 1.8 |
9.1 |
GO:1990440 |
positive regulation of transcription from RNA polymerase II promoter in response to endoplasmic reticulum stress(GO:1990440) |
| 1.8 |
5.5 |
GO:0016256 |
N-glycan processing to lysosome(GO:0016256) |
| 1.8 |
10.9 |
GO:0050982 |
detection of mechanical stimulus(GO:0050982) |
| 1.8 |
41.6 |
GO:0043567 |
regulation of insulin-like growth factor receptor signaling pathway(GO:0043567) |
| 1.8 |
7.2 |
GO:1902231 |
positive regulation of intrinsic apoptotic signaling pathway in response to DNA damage(GO:1902231) |
| 1.8 |
3.6 |
GO:0090324 |
negative regulation of oxidative phosphorylation(GO:0090324) |
| 1.8 |
1.8 |
GO:0006651 |
diacylglycerol biosynthetic process(GO:0006651) |
| 1.8 |
7.1 |
GO:0002074 |
extraocular skeletal muscle development(GO:0002074) |
| 1.8 |
10.7 |
GO:2000194 |
regulation of female gonad development(GO:2000194) |
| 1.8 |
28.5 |
GO:0006111 |
regulation of gluconeogenesis(GO:0006111) |
| 1.8 |
5.3 |
GO:0002384 |
hepatic immune response(GO:0002384) |
| 1.8 |
7.1 |
GO:0006704 |
glucocorticoid biosynthetic process(GO:0006704) |
| 1.8 |
63.9 |
GO:0045600 |
positive regulation of fat cell differentiation(GO:0045600) |
| 1.8 |
5.3 |
GO:1990918 |
meiotic DNA double-strand break processing(GO:0000706) double-strand break repair involved in meiotic recombination(GO:1990918) |
| 1.8 |
1.8 |
GO:1902473 |
regulation of protein localization to synapse(GO:1902473) |
| 1.8 |
7.1 |
GO:0097089 |
methyl-branched fatty acid metabolic process(GO:0097089) |
| 1.8 |
5.3 |
GO:0030186 |
melatonin metabolic process(GO:0030186) melatonin biosynthetic process(GO:0030187) |
| 1.8 |
7.0 |
GO:0097167 |
circadian regulation of translation(GO:0097167) |
| 1.8 |
56.3 |
GO:0043551 |
regulation of phosphatidylinositol 3-kinase activity(GO:0043551) |
| 1.8 |
7.0 |
GO:0098914 |
membrane repolarization during atrial cardiac muscle cell action potential(GO:0098914) |
| 1.8 |
5.3 |
GO:1903012 |
positive regulation of bone development(GO:1903012) positive regulation of osteoclast development(GO:2001206) |
| 1.8 |
3.5 |
GO:0048840 |
otolith development(GO:0048840) |
| 1.7 |
7.0 |
GO:0080009 |
mRNA methylation(GO:0080009) |
| 1.7 |
62.6 |
GO:0071277 |
cellular response to calcium ion(GO:0071277) |
| 1.7 |
8.7 |
GO:0093001 |
glycolysis from storage polysaccharide through glucose-1-phosphate(GO:0093001) |
| 1.7 |
3.5 |
GO:0071603 |
endothelial cell-cell adhesion(GO:0071603) |
| 1.7 |
5.2 |
GO:1990253 |
cellular response to leucine starvation(GO:1990253) |
| 1.7 |
8.7 |
GO:0071493 |
cellular response to UV-B(GO:0071493) |
| 1.7 |
5.2 |
GO:0045919 |
positive regulation of cytolysis(GO:0045919) |
| 1.7 |
5.2 |
GO:0051969 |
regulation of transmission of nerve impulse(GO:0051969) |
| 1.7 |
11.9 |
GO:0046604 |
positive regulation of mitotic centrosome separation(GO:0046604) |
| 1.7 |
100.2 |
GO:1902476 |
chloride transmembrane transport(GO:1902476) |
| 1.7 |
149.2 |
GO:0090630 |
activation of GTPase activity(GO:0090630) |
| 1.7 |
50.5 |
GO:0007274 |
neuromuscular synaptic transmission(GO:0007274) |
| 1.7 |
10.1 |
GO:0008343 |
adult feeding behavior(GO:0008343) |
| 1.7 |
21.9 |
GO:1904776 |
regulation of protein localization to cell cortex(GO:1904776) positive regulation of protein localization to cell cortex(GO:1904778) |
| 1.7 |
1.7 |
GO:0070943 |
neutrophil mediated cytotoxicity(GO:0070942) neutrophil mediated killing of symbiont cell(GO:0070943) neutrophil mediated killing of bacterium(GO:0070944) |
| 1.7 |
3.3 |
GO:2001225 |
regulation of chloride transport(GO:2001225) |
| 1.7 |
40.0 |
GO:0007190 |
activation of adenylate cyclase activity(GO:0007190) |
| 1.7 |
3.3 |
GO:0019853 |
L-ascorbic acid biosynthetic process(GO:0019853) |
| 1.7 |
5.0 |
GO:0050957 |
equilibrioception(GO:0050957) |
| 1.7 |
3.3 |
GO:0048664 |
neuron fate determination(GO:0048664) |
| 1.7 |
18.2 |
GO:0019369 |
arachidonic acid metabolic process(GO:0019369) |
| 1.6 |
11.5 |
GO:0097354 |
protein prenylation(GO:0018342) prenylation(GO:0097354) |
| 1.6 |
4.9 |
GO:0031018 |
endocrine pancreas development(GO:0031018) |
| 1.6 |
14.6 |
GO:0090140 |
regulation of mitochondrial fission(GO:0090140) |
| 1.6 |
1.6 |
GO:0016479 |
negative regulation of transcription from RNA polymerase I promoter(GO:0016479) |
| 1.6 |
24.3 |
GO:0042572 |
retinol metabolic process(GO:0042572) |
| 1.6 |
6.5 |
GO:0071526 |
semaphorin-plexin signaling pathway(GO:0071526) |
| 1.6 |
1.6 |
GO:0002667 |
lymphocyte anergy(GO:0002249) regulation of T cell anergy(GO:0002667) T cell anergy(GO:0002870) regulation of lymphocyte anergy(GO:0002911) |
| 1.6 |
4.8 |
GO:0060453 |
regulation of gastric acid secretion(GO:0060453) |
| 1.6 |
11.2 |
GO:0016576 |
histone dephosphorylation(GO:0016576) |
| 1.6 |
1.6 |
GO:0060374 |
mast cell differentiation(GO:0060374) |
| 1.6 |
3.2 |
GO:0021523 |
somatic motor neuron differentiation(GO:0021523) |
| 1.6 |
4.8 |
GO:0035871 |
protein K11-linked deubiquitination(GO:0035871) |
| 1.6 |
4.8 |
GO:0072757 |
cellular response to camptothecin(GO:0072757) |
| 1.6 |
8.0 |
GO:0045161 |
neuronal ion channel clustering(GO:0045161) |
| 1.6 |
11.1 |
GO:0043113 |
receptor clustering(GO:0043113) |
| 1.6 |
4.8 |
GO:0061107 |
seminal vesicle development(GO:0061107) |
| 1.6 |
4.8 |
GO:0045425 |
granulocyte macrophage colony-stimulating factor biosynthetic process(GO:0042253) regulation of granulocyte macrophage colony-stimulating factor biosynthetic process(GO:0045423) positive regulation of granulocyte macrophage colony-stimulating factor biosynthetic process(GO:0045425) |
| 1.6 |
3.2 |
GO:0033564 |
anterior/posterior axon guidance(GO:0033564) |
| 1.6 |
11.0 |
GO:0072643 |
interferon-gamma secretion(GO:0072643) |
| 1.6 |
48.6 |
GO:0038083 |
peptidyl-tyrosine autophosphorylation(GO:0038083) |
| 1.6 |
1.6 |
GO:0060534 |
trachea cartilage development(GO:0060534) |
| 1.6 |
18.8 |
GO:0061117 |
negative regulation of cardiac muscle tissue growth(GO:0055022) negative regulation of heart growth(GO:0061117) |
| 1.6 |
6.2 |
GO:0015740 |
C4-dicarboxylate transport(GO:0015740) |
| 1.6 |
14.0 |
GO:0043562 |
cellular response to nitrogen starvation(GO:0006995) cellular response to nitrogen levels(GO:0043562) |
| 1.6 |
28.0 |
GO:0071108 |
protein K48-linked deubiquitination(GO:0071108) |
| 1.6 |
18.6 |
GO:0019317 |
fucose catabolic process(GO:0019317) L-fucose metabolic process(GO:0042354) L-fucose catabolic process(GO:0042355) |
| 1.6 |
10.9 |
GO:2001014 |
regulation of skeletal muscle cell differentiation(GO:2001014) |
| 1.5 |
38.4 |
GO:0048247 |
lymphocyte chemotaxis(GO:0048247) |
| 1.5 |
6.1 |
GO:0060384 |
innervation(GO:0060384) |
| 1.5 |
3.1 |
GO:0035610 |
protein side chain deglutamylation(GO:0035610) |
| 1.5 |
9.2 |
GO:0030157 |
pancreatic juice secretion(GO:0030157) |
| 1.5 |
12.2 |
GO:0048070 |
regulation of developmental pigmentation(GO:0048070) |
| 1.5 |
1.5 |
GO:0061031 |
endodermal digestive tract morphogenesis(GO:0061031) |
| 1.5 |
12.2 |
GO:0072592 |
oxygen metabolic process(GO:0072592) |
| 1.5 |
12.1 |
GO:0060033 |
anatomical structure regression(GO:0060033) |
| 1.5 |
19.5 |
GO:0045124 |
regulation of bone resorption(GO:0045124) |
| 1.5 |
6.0 |
GO:0014894 |
response to muscle inactivity involved in regulation of muscle adaptation(GO:0014877) response to denervation involved in regulation of muscle adaptation(GO:0014894) |
| 1.5 |
4.5 |
GO:0046603 |
negative regulation of mitotic centrosome separation(GO:0046603) |
| 1.5 |
1.5 |
GO:0002625 |
regulation of T cell antigen processing and presentation(GO:0002625) |
| 1.5 |
29.9 |
GO:0043268 |
positive regulation of potassium ion transport(GO:0043268) |
| 1.5 |
4.5 |
GO:2001270 |
regulation of cysteine-type endopeptidase activity involved in execution phase of apoptosis(GO:2001270) |
| 1.5 |
10.4 |
GO:0003376 |
sphingosine-1-phosphate signaling pathway(GO:0003376) |
| 1.5 |
4.5 |
GO:0009313 |
oligosaccharide catabolic process(GO:0009313) |
| 1.5 |
25.2 |
GO:0098743 |
cell aggregation(GO:0098743) |
| 1.5 |
5.9 |
GO:2000479 |
regulation of cAMP-dependent protein kinase activity(GO:2000479) |
| 1.5 |
64.9 |
GO:0007422 |
peripheral nervous system development(GO:0007422) |
| 1.5 |
47.2 |
GO:0016486 |
peptide hormone processing(GO:0016486) |
| 1.5 |
55.8 |
GO:1903779 |
regulation of cardiac conduction(GO:1903779) |
| 1.5 |
13.2 |
GO:0031033 |
myosin filament organization(GO:0031033) |
| 1.5 |
5.8 |
GO:0060051 |
negative regulation of protein glycosylation(GO:0060051) |
| 1.5 |
10.2 |
GO:0006983 |
ER overload response(GO:0006983) |
| 1.5 |
4.4 |
GO:0006566 |
threonine metabolic process(GO:0006566) |
| 1.5 |
46.4 |
GO:0010107 |
potassium ion import(GO:0010107) |
| 1.4 |
7.2 |
GO:0031119 |
tRNA pseudouridine synthesis(GO:0031119) |
| 1.4 |
4.3 |
GO:0099526 |
presynaptic signal transduction(GO:0098928) presynapse to nucleus signaling pathway(GO:0099526) |
| 1.4 |
8.6 |
GO:0007598 |
blood coagulation, extrinsic pathway(GO:0007598) |
| 1.4 |
15.7 |
GO:0036158 |
outer dynein arm assembly(GO:0036158) |
| 1.4 |
4.3 |
GO:2000661 |
positive regulation of interleukin-1-mediated signaling pathway(GO:2000661) |
| 1.4 |
85.4 |
GO:0000381 |
regulation of alternative mRNA splicing, via spliceosome(GO:0000381) |
| 1.4 |
5.7 |
GO:0044829 |
positive regulation by host of viral genome replication(GO:0044829) |
| 1.4 |
12.8 |
GO:1900449 |
regulation of glutamate receptor signaling pathway(GO:1900449) |
| 1.4 |
15.4 |
GO:0021978 |
telencephalon regionalization(GO:0021978) |
| 1.4 |
8.3 |
GO:0009404 |
toxin metabolic process(GO:0009404) |
| 1.4 |
1.4 |
GO:1904779 |
regulation of protein localization to centrosome(GO:1904779) |
| 1.4 |
5.5 |
GO:0007628 |
adult walking behavior(GO:0007628) |
| 1.4 |
2.8 |
GO:0070458 |
detoxification of nitrogen compound(GO:0051410) cellular detoxification of nitrogen compound(GO:0070458) |
| 1.4 |
16.3 |
GO:0033617 |
mitochondrial respiratory chain complex IV assembly(GO:0033617) |
| 1.4 |
2.7 |
GO:1902774 |
late endosome to lysosome transport(GO:1902774) |
| 1.4 |
71.9 |
GO:0006968 |
cellular defense response(GO:0006968) |
| 1.4 |
1.4 |
GO:0061687 |
detoxification of inorganic compound(GO:0061687) |
| 1.4 |
8.1 |
GO:0048016 |
inositol phosphate-mediated signaling(GO:0048016) |
| 1.3 |
32.4 |
GO:0050806 |
positive regulation of synaptic transmission(GO:0050806) |
| 1.3 |
654.6 |
GO:0043547 |
positive regulation of GTPase activity(GO:0043547) |
| 1.3 |
4.0 |
GO:0030854 |
positive regulation of granulocyte differentiation(GO:0030854) |
| 1.3 |
6.7 |
GO:0035507 |
regulation of myosin-light-chain-phosphatase activity(GO:0035507) |
| 1.3 |
1.3 |
GO:0051152 |
positive regulation of smooth muscle cell differentiation(GO:0051152) |
| 1.3 |
6.6 |
GO:0034086 |
maintenance of sister chromatid cohesion(GO:0034086) maintenance of mitotic sister chromatid cohesion(GO:0034088) |
| 1.3 |
1.3 |
GO:0014005 |
microglia differentiation(GO:0014004) microglia development(GO:0014005) |
| 1.3 |
1.3 |
GO:2000389 |
regulation of neutrophil extravasation(GO:2000389) |
| 1.3 |
53.3 |
GO:0009583 |
detection of light stimulus(GO:0009583) |
| 1.3 |
3.9 |
GO:0045897 |
positive regulation of transcription during mitosis(GO:0045897) |
| 1.3 |
5.2 |
GO:0038165 |
oncostatin-M-mediated signaling pathway(GO:0038165) |
| 1.3 |
1.3 |
GO:0050927 |
positive regulation of positive chemotaxis(GO:0050927) |
| 1.3 |
11.4 |
GO:0060037 |
pharyngeal system development(GO:0060037) |
| 1.3 |
3.8 |
GO:0034154 |
toll-like receptor 7 signaling pathway(GO:0034154) |
| 1.3 |
2.5 |
GO:0006114 |
glycerol biosynthetic process(GO:0006114) |
| 1.3 |
3.8 |
GO:0097272 |
ammonia homeostasis(GO:0097272) |
| 1.3 |
1.3 |
GO:1902993 |
positive regulation of amyloid precursor protein catabolic process(GO:1902993) |
| 1.3 |
16.3 |
GO:0033169 |
histone H3-K9 demethylation(GO:0033169) |
| 1.2 |
7.5 |
GO:0045956 |
positive regulation of calcium ion-dependent exocytosis(GO:0045956) |
| 1.2 |
12.4 |
GO:0005513 |
detection of calcium ion(GO:0005513) |
| 1.2 |
6.2 |
GO:0035457 |
cellular response to interferon-alpha(GO:0035457) |
| 1.2 |
9.9 |
GO:0042551 |
neuron maturation(GO:0042551) |
| 1.2 |
16.0 |
GO:0006703 |
estrogen biosynthetic process(GO:0006703) |
| 1.2 |
4.9 |
GO:0016139 |
glycoside catabolic process(GO:0016139) |
| 1.2 |
21.5 |
GO:0046597 |
negative regulation of viral entry into host cell(GO:0046597) |
| 1.2 |
2.4 |
GO:0042832 |
defense response to protozoan(GO:0042832) |
| 1.2 |
14.2 |
GO:0035774 |
positive regulation of insulin secretion involved in cellular response to glucose stimulus(GO:0035774) |
| 1.2 |
10.6 |
GO:0042953 |
lipoprotein transport(GO:0042953) lipoprotein localization(GO:0044872) |
| 1.2 |
8.2 |
GO:0055090 |
acylglycerol homeostasis(GO:0055090) triglyceride homeostasis(GO:0070328) |
| 1.2 |
5.9 |
GO:0010470 |
regulation of gastrulation(GO:0010470) |
| 1.2 |
2.3 |
GO:0043576 |
regulation of respiratory gaseous exchange(GO:0043576) |
| 1.2 |
3.5 |
GO:0002467 |
germinal center formation(GO:0002467) |
| 1.2 |
5.8 |
GO:0048539 |
bone marrow development(GO:0048539) |
| 1.2 |
4.6 |
GO:0010623 |
programmed cell death involved in cell development(GO:0010623) |
| 1.1 |
3.4 |
GO:0030823 |
regulation of cGMP metabolic process(GO:0030823) |
| 1.1 |
2.3 |
GO:0036149 |
phosphatidylinositol acyl-chain remodeling(GO:0036149) |
| 1.1 |
1.1 |
GO:0045829 |
negative regulation of isotype switching(GO:0045829) |
| 1.1 |
9.1 |
GO:0006384 |
transcription initiation from RNA polymerase III promoter(GO:0006384) |
| 1.1 |
7.9 |
GO:0007398 |
ectoderm development(GO:0007398) |
| 1.1 |
4.5 |
GO:0002644 |
negative regulation of tolerance induction(GO:0002644) |
| 1.1 |
83.5 |
GO:0071805 |
cellular potassium ion transport(GO:0071804) potassium ion transmembrane transport(GO:0071805) |
| 1.1 |
18.0 |
GO:0045332 |
lipid translocation(GO:0034204) phospholipid translocation(GO:0045332) |
| 1.1 |
2.2 |
GO:0060068 |
vagina development(GO:0060068) |
| 1.1 |
2.2 |
GO:0019530 |
taurine metabolic process(GO:0019530) |
| 1.1 |
3.3 |
GO:0010025 |
wax biosynthetic process(GO:0010025) wax metabolic process(GO:0010166) |
| 1.1 |
1.1 |
GO:0045448 |
regulation of mitotic cell cycle, embryonic(GO:0009794) mitotic cell cycle, embryonic(GO:0045448) |
| 1.1 |
41.8 |
GO:0007187 |
G-protein coupled receptor signaling pathway, coupled to cyclic nucleotide second messenger(GO:0007187) |
| 1.1 |
6.4 |
GO:1905123 |
regulation of glucosylceramidase activity(GO:1905123) |
| 1.1 |
1.1 |
GO:1903546 |
protein localization to photoreceptor outer segment(GO:1903546) |
| 1.1 |
1.1 |
GO:0032621 |
interleukin-18 production(GO:0032621) |
| 1.1 |
14.9 |
GO:0019731 |
antibacterial humoral response(GO:0019731) |
| 1.0 |
3.1 |
GO:0019075 |
virus maturation(GO:0019075) |
| 1.0 |
3.1 |
GO:0098700 |
neurotransmitter loading into synaptic vesicle(GO:0098700) |
| 1.0 |
2.1 |
GO:0045347 |
negative regulation of MHC class II biosynthetic process(GO:0045347) |
| 1.0 |
26.0 |
GO:0003333 |
amino acid transmembrane transport(GO:0003333) |
| 1.0 |
16.5 |
GO:0018146 |
keratan sulfate biosynthetic process(GO:0018146) |
| 1.0 |
6.2 |
GO:0043550 |
regulation of lipid kinase activity(GO:0043550) |
| 1.0 |
8.2 |
GO:0006452 |
translational frameshifting(GO:0006452) positive regulation of translational termination(GO:0045905) |
| 1.0 |
6.1 |
GO:0007625 |
grooming behavior(GO:0007625) |
| 1.0 |
3.1 |
GO:0071896 |
protein localization to adherens junction(GO:0071896) |
| 1.0 |
16.3 |
GO:0007205 |
protein kinase C-activating G-protein coupled receptor signaling pathway(GO:0007205) |
| 1.0 |
6.1 |
GO:0051694 |
pointed-end actin filament capping(GO:0051694) |
| 1.0 |
6.0 |
GO:0014887 |
muscle hypertrophy in response to stress(GO:0003299) cardiac muscle adaptation(GO:0014887) cardiac muscle hypertrophy in response to stress(GO:0014898) |
| 1.0 |
5.0 |
GO:1903361 |
protein localization to basolateral plasma membrane(GO:1903361) |
| 1.0 |
7.0 |
GO:0010968 |
regulation of microtubule nucleation(GO:0010968) |
| 1.0 |
49.4 |
GO:0010923 |
negative regulation of phosphatase activity(GO:0010923) |
| 1.0 |
3.9 |
GO:0035609 |
C-terminal protein deglutamylation(GO:0035609) |
| 1.0 |
1.9 |
GO:1903689 |
regulation of wound healing, spreading of epidermal cells(GO:1903689) |
| 1.0 |
3.9 |
GO:0034638 |
phosphatidylcholine catabolic process(GO:0034638) |
| 1.0 |
4.8 |
GO:0038161 |
prolactin signaling pathway(GO:0038161) |
| 1.0 |
1.0 |
GO:0071467 |
cellular response to pH(GO:0071467) |
| 0.9 |
1.9 |
GO:0042756 |
drinking behavior(GO:0042756) |
| 0.9 |
4.7 |
GO:0060525 |
prostate glandular acinus development(GO:0060525) |
| 0.9 |
1.9 |
GO:0061582 |
intestinal epithelial cell migration(GO:0061582) |
| 0.9 |
0.9 |
GO:0072385 |
minus-end-directed organelle transport along microtubule(GO:0072385) |
| 0.9 |
13.0 |
GO:0007340 |
acrosome reaction(GO:0007340) |
| 0.9 |
3.7 |
GO:0043456 |
regulation of pentose-phosphate shunt(GO:0043456) |
| 0.9 |
11.1 |
GO:0071594 |
T cell differentiation in thymus(GO:0033077) thymocyte aggregation(GO:0071594) |
| 0.9 |
1.8 |
GO:0017158 |
regulation of calcium ion-dependent exocytosis(GO:0017158) |
| 0.9 |
5.5 |
GO:0006565 |
L-serine catabolic process(GO:0006565) |
| 0.9 |
38.2 |
GO:0046854 |
phosphatidylinositol phosphorylation(GO:0046854) |
| 0.9 |
17.2 |
GO:1901687 |
glutathione derivative metabolic process(GO:1901685) glutathione derivative biosynthetic process(GO:1901687) |
| 0.9 |
0.9 |
GO:1904017 |
cellular response to Thyroglobulin triiodothyronine(GO:1904017) |
| 0.9 |
2.7 |
GO:0051684 |
maintenance of Golgi location(GO:0051684) |
| 0.9 |
1.8 |
GO:1901317 |
regulation of sperm motility(GO:1901317) |
| 0.9 |
6.3 |
GO:0007141 |
male meiosis I(GO:0007141) |
| 0.9 |
8.0 |
GO:0098868 |
bone growth(GO:0098868) |
| 0.9 |
12.4 |
GO:0019433 |
triglyceride catabolic process(GO:0019433) |
| 0.9 |
30.0 |
GO:0046426 |
negative regulation of JAK-STAT cascade(GO:0046426) negative regulation of STAT cascade(GO:1904893) |
| 0.9 |
2.6 |
GO:0018874 |
benzoate metabolic process(GO:0018874) butyrate metabolic process(GO:0019605) |
| 0.9 |
6.2 |
GO:0051145 |
smooth muscle cell differentiation(GO:0051145) |
| 0.9 |
13.2 |
GO:0071850 |
mitotic cell cycle arrest(GO:0071850) |
| 0.9 |
3.5 |
GO:0001714 |
endodermal cell fate specification(GO:0001714) |
| 0.9 |
8.7 |
GO:0006824 |
cobalt ion transport(GO:0006824) |
| 0.9 |
0.9 |
GO:0002741 |
positive regulation of cytokine secretion involved in immune response(GO:0002741) |
| 0.9 |
12.9 |
GO:0016558 |
protein import into peroxisome matrix(GO:0016558) |
| 0.9 |
10.3 |
GO:0009312 |
oligosaccharide biosynthetic process(GO:0009312) |
| 0.9 |
0.9 |
GO:0009750 |
response to fructose(GO:0009750) |
| 0.9 |
1.7 |
GO:0015791 |
polyol transport(GO:0015791) |
| 0.9 |
6.8 |
GO:0009299 |
mRNA transcription(GO:0009299) |
| 0.9 |
0.9 |
GO:0097374 |
sensory neuron axon guidance(GO:0097374) |
| 0.8 |
0.8 |
GO:0036023 |
limb joint morphogenesis(GO:0036022) embryonic skeletal limb joint morphogenesis(GO:0036023) |
| 0.8 |
2.5 |
GO:0007016 |
cytoskeletal anchoring at plasma membrane(GO:0007016) |
| 0.8 |
0.8 |
GO:0048865 |
stem cell fate commitment(GO:0048865) |
| 0.8 |
6.6 |
GO:0046460 |
neutral lipid biosynthetic process(GO:0046460) acylglycerol biosynthetic process(GO:0046463) |
| 0.8 |
2.5 |
GO:1904528 |
positive regulation of microtubule binding(GO:1904528) |
| 0.8 |
22.8 |
GO:0070098 |
chemokine-mediated signaling pathway(GO:0070098) |
| 0.8 |
1.6 |
GO:0002710 |
negative regulation of T cell mediated immunity(GO:0002710) |
| 0.8 |
4.0 |
GO:1901142 |
insulin metabolic process(GO:1901142) |
| 0.8 |
1.6 |
GO:0002686 |
negative regulation of leukocyte migration(GO:0002686) |
| 0.8 |
2.4 |
GO:0051450 |
myoblast proliferation(GO:0051450) |
| 0.8 |
6.3 |
GO:0010996 |
response to auditory stimulus(GO:0010996) |
| 0.8 |
1.6 |
GO:0034311 |
sphingosine metabolic process(GO:0006670) diol metabolic process(GO:0034311) |
| 0.8 |
0.8 |
GO:0015801 |
aromatic amino acid transport(GO:0015801) |
| 0.8 |
3.9 |
GO:0072520 |
seminiferous tubule development(GO:0072520) |
| 0.8 |
3.8 |
GO:0006813 |
potassium ion transport(GO:0006813) |
| 0.8 |
2.3 |
GO:0002949 |
tRNA threonylcarbamoyladenosine modification(GO:0002949) |
| 0.8 |
13.6 |
GO:0051965 |
positive regulation of synapse assembly(GO:0051965) |
| 0.7 |
7.5 |
GO:0048854 |
brain morphogenesis(GO:0048854) |
| 0.7 |
0.7 |
GO:0070233 |
negative regulation of T cell apoptotic process(GO:0070233) |
| 0.7 |
95.2 |
GO:0007156 |
homophilic cell adhesion via plasma membrane adhesion molecules(GO:0007156) |
| 0.7 |
7.4 |
GO:0070734 |
histone H3-K27 methylation(GO:0070734) |
| 0.7 |
3.7 |
GO:0001709 |
cell fate determination(GO:0001709) |
| 0.7 |
2.9 |
GO:0035937 |
histone H3-K4 demethylation, trimethyl-H3-K4-specific(GO:0034721) estrogen secretion(GO:0035937) estradiol secretion(GO:0035938) regulation of estrogen secretion(GO:2000861) regulation of estradiol secretion(GO:2000864) |
| 0.7 |
7.2 |
GO:0035330 |
regulation of hippo signaling(GO:0035330) |
| 0.7 |
12.9 |
GO:0015012 |
heparan sulfate proteoglycan biosynthetic process(GO:0015012) |
| 0.7 |
1.4 |
GO:1990822 |
basic amino acid transmembrane transport(GO:1990822) |
| 0.7 |
2.1 |
GO:0044278 |
cell wall disruption in other organism(GO:0044278) |
| 0.7 |
4.9 |
GO:0003351 |
epithelial cilium movement(GO:0003351) |
| 0.7 |
0.7 |
GO:0002933 |
lipid hydroxylation(GO:0002933) |
| 0.7 |
10.1 |
GO:0072488 |
ammonium transmembrane transport(GO:0072488) |
| 0.7 |
13.5 |
GO:0000042 |
protein targeting to Golgi(GO:0000042) |
| 0.7 |
4.0 |
GO:0006398 |
mRNA 3'-end processing by stem-loop binding and cleavage(GO:0006398) |
| 0.7 |
2.0 |
GO:0018298 |
protein-chromophore linkage(GO:0018298) |
| 0.7 |
0.7 |
GO:0019376 |
galactolipid catabolic process(GO:0019376) |
| 0.7 |
3.3 |
GO:0033353 |
S-adenosylmethionine cycle(GO:0033353) S-adenosylhomocysteine metabolic process(GO:0046498) |
| 0.7 |
4.6 |
GO:0071711 |
basement membrane organization(GO:0071711) |
| 0.7 |
3.9 |
GO:0051898 |
negative regulation of protein kinase B signaling(GO:0051898) |
| 0.7 |
5.2 |
GO:0060856 |
establishment of blood-brain barrier(GO:0060856) |
| 0.6 |
6.5 |
GO:0035640 |
exploration behavior(GO:0035640) |
| 0.6 |
1.3 |
GO:0046469 |
platelet activating factor metabolic process(GO:0046469) |
| 0.6 |
3.2 |
GO:0070131 |
positive regulation of mitochondrial translation(GO:0070131) |
| 0.6 |
0.6 |
GO:0010572 |
positive regulation of platelet activation(GO:0010572) |
| 0.6 |
64.2 |
GO:0050907 |
detection of chemical stimulus involved in sensory perception(GO:0050907) |
| 0.6 |
9.6 |
GO:0045026 |
plasma membrane fusion(GO:0045026) |
| 0.6 |
1.3 |
GO:0009642 |
response to light intensity(GO:0009642) |
| 0.6 |
9.4 |
GO:0016079 |
synaptic vesicle exocytosis(GO:0016079) |
| 0.6 |
2.5 |
GO:0043030 |
regulation of macrophage activation(GO:0043030) |
| 0.6 |
23.1 |
GO:0006836 |
neurotransmitter transport(GO:0006836) |
| 0.6 |
4.4 |
GO:0042044 |
water transport(GO:0006833) fluid transport(GO:0042044) |
| 0.6 |
1.9 |
GO:0003323 |
type B pancreatic cell development(GO:0003323) |
| 0.6 |
0.6 |
GO:2001223 |
negative regulation of neuron migration(GO:2001223) |
| 0.6 |
6.8 |
GO:0043983 |
histone H4-K12 acetylation(GO:0043983) |
| 0.6 |
22.1 |
GO:0070664 |
negative regulation of leukocyte proliferation(GO:0070664) |
| 0.6 |
1.8 |
GO:0031627 |
telomeric loop formation(GO:0031627) |
| 0.6 |
7.2 |
GO:0035082 |
axoneme assembly(GO:0035082) |
| 0.6 |
2.4 |
GO:2001106 |
regulation of Rho guanyl-nucleotide exchange factor activity(GO:2001106) |
| 0.6 |
2.8 |
GO:0007028 |
cytoplasm organization(GO:0007028) |
| 0.6 |
1.1 |
GO:0006710 |
androgen catabolic process(GO:0006710) |
| 0.5 |
2.2 |
GO:0017185 |
peptidyl-lysine hydroxylation(GO:0017185) |
| 0.5 |
7.5 |
GO:0033141 |
positive regulation of peptidyl-serine phosphorylation of STAT protein(GO:0033141) |
| 0.5 |
0.5 |
GO:0010726 |
positive regulation of hydrogen peroxide metabolic process(GO:0010726) |
| 0.5 |
1.0 |
GO:0046203 |
spermidine catabolic process(GO:0046203) |
| 0.5 |
2.6 |
GO:0051974 |
negative regulation of telomerase activity(GO:0051974) |
| 0.5 |
1.5 |
GO:0050913 |
sensory perception of bitter taste(GO:0050913) |
| 0.5 |
2.5 |
GO:0034453 |
microtubule anchoring(GO:0034453) |
| 0.5 |
1.4 |
GO:0072600 |
establishment of protein localization to Golgi(GO:0072600) |
| 0.5 |
0.5 |
GO:0006568 |
tryptophan metabolic process(GO:0006568) |
| 0.5 |
5.8 |
GO:0070306 |
lens fiber cell differentiation(GO:0070306) |
| 0.5 |
0.5 |
GO:0042940 |
D-amino acid transport(GO:0042940) |
| 0.5 |
3.8 |
GO:0005979 |
regulation of glycogen biosynthetic process(GO:0005979) regulation of glucan biosynthetic process(GO:0010962) |
| 0.5 |
11.8 |
GO:0007368 |
determination of left/right symmetry(GO:0007368) |
| 0.5 |
16.9 |
GO:0007626 |
locomotory behavior(GO:0007626) |
| 0.5 |
3.3 |
GO:0017196 |
N-terminal peptidyl-methionine acetylation(GO:0017196) |
| 0.5 |
0.5 |
GO:1903939 |
regulation of TORC2 signaling(GO:1903939) |
| 0.5 |
3.2 |
GO:1901678 |
iron coordination entity transport(GO:1901678) |
| 0.5 |
0.9 |
GO:0035565 |
regulation of pronephros size(GO:0035565) pronephros morphogenesis(GO:0072114) |
| 0.5 |
10.8 |
GO:0071347 |
cellular response to interleukin-1(GO:0071347) |
| 0.4 |
2.7 |
GO:0060397 |
JAK-STAT cascade involved in growth hormone signaling pathway(GO:0060397) |
| 0.4 |
0.9 |
GO:0001757 |
somite specification(GO:0001757) |
| 0.4 |
2.2 |
GO:0016554 |
cytidine to uridine editing(GO:0016554) |
| 0.4 |
5.2 |
GO:0046950 |
cellular ketone body metabolic process(GO:0046950) |
| 0.4 |
10.3 |
GO:0043252 |
sodium-independent organic anion transport(GO:0043252) |
| 0.4 |
0.9 |
GO:0048635 |
negative regulation of muscle organ development(GO:0048635) |
| 0.4 |
2.5 |
GO:0032364 |
oxygen homeostasis(GO:0032364) |
| 0.4 |
2.5 |
GO:0006287 |
base-excision repair, gap-filling(GO:0006287) |
| 0.4 |
4.1 |
GO:0006068 |
ethanol metabolic process(GO:0006067) ethanol catabolic process(GO:0006068) |
| 0.4 |
2.4 |
GO:0034058 |
endosomal vesicle fusion(GO:0034058) |
| 0.4 |
6.9 |
GO:0030166 |
proteoglycan biosynthetic process(GO:0030166) |
| 0.4 |
14.7 |
GO:0043507 |
positive regulation of JUN kinase activity(GO:0043507) |
| 0.4 |
0.7 |
GO:0090034 |
regulation of chaperone-mediated protein complex assembly(GO:0090034) positive regulation of chaperone-mediated protein complex assembly(GO:0090035) |
| 0.4 |
0.7 |
GO:0019287 |
isopentenyl diphosphate biosynthetic process, mevalonate pathway(GO:0019287) |
| 0.4 |
1.8 |
GO:0072017 |
distal tubule development(GO:0072017) |
| 0.4 |
4.7 |
GO:0032196 |
transposition(GO:0032196) |
| 0.4 |
1.4 |
GO:0035542 |
regulation of SNARE complex assembly(GO:0035542) |
| 0.4 |
8.2 |
GO:0098534 |
centriole assembly(GO:0098534) |
| 0.3 |
0.7 |
GO:1904063 |
negative regulation of cation transmembrane transport(GO:1904063) |
| 0.3 |
2.4 |
GO:0014911 |
positive regulation of smooth muscle cell migration(GO:0014911) |
| 0.3 |
0.3 |
GO:0009593 |
detection of chemical stimulus(GO:0009593) |
| 0.3 |
0.3 |
GO:0038028 |
insulin receptor signaling pathway via phosphatidylinositol 3-kinase(GO:0038028) |
| 0.3 |
1.0 |
GO:0003215 |
cardiac right ventricle morphogenesis(GO:0003215) |
| 0.3 |
2.0 |
GO:0070212 |
protein poly-ADP-ribosylation(GO:0070212) |
| 0.3 |
3.2 |
GO:0006029 |
proteoglycan metabolic process(GO:0006029) |
| 0.3 |
2.5 |
GO:0006516 |
glycoprotein catabolic process(GO:0006516) |
| 0.3 |
1.8 |
GO:0044030 |
regulation of DNA methylation(GO:0044030) |
| 0.3 |
0.3 |
GO:0035094 |
response to nicotine(GO:0035094) |
| 0.3 |
0.6 |
GO:0072093 |
renal vesicle formation(GO:0072033) ureteric bud invasion(GO:0072092) metanephric renal vesicle formation(GO:0072093) |
| 0.3 |
1.4 |
GO:2000096 |
positive regulation of Wnt signaling pathway, planar cell polarity pathway(GO:2000096) |
| 0.3 |
0.6 |
GO:1902172 |
keratinocyte apoptotic process(GO:0097283) regulation of keratinocyte apoptotic process(GO:1902172) |
| 0.3 |
0.6 |
GO:0018410 |
C-terminal protein amino acid modification(GO:0018410) |
| 0.3 |
0.6 |
GO:0042670 |
retinal cone cell differentiation(GO:0042670) retinal cone cell development(GO:0046549) |
| 0.3 |
1.4 |
GO:0032324 |
molybdopterin cofactor biosynthetic process(GO:0032324) molybdopterin cofactor metabolic process(GO:0043545) prosthetic group metabolic process(GO:0051189) |
| 0.3 |
0.8 |
GO:0035048 |
splicing factor protein import into nucleus(GO:0035048) |
| 0.3 |
4.6 |
GO:0006835 |
dicarboxylic acid transport(GO:0006835) |
| 0.3 |
2.1 |
GO:0031087 |
deadenylation-independent decapping of nuclear-transcribed mRNA(GO:0031087) |
| 0.3 |
1.8 |
GO:0030815 |
negative regulation of cAMP metabolic process(GO:0030815) |
| 0.3 |
0.3 |
GO:1900040 |
regulation of interleukin-2 secretion(GO:1900040) |
| 0.2 |
0.2 |
GO:0001946 |
lymphangiogenesis(GO:0001946) |
| 0.2 |
0.2 |
GO:0060632 |
regulation of microtubule-based movement(GO:0060632) |
| 0.2 |
0.2 |
GO:2001183 |
negative regulation of interleukin-12 secretion(GO:2001183) |
| 0.2 |
1.4 |
GO:0035116 |
embryonic hindlimb morphogenesis(GO:0035116) |
| 0.2 |
2.8 |
GO:0043984 |
histone H4-K16 acetylation(GO:0043984) |
| 0.2 |
0.7 |
GO:0001831 |
trophectodermal cellular morphogenesis(GO:0001831) |
| 0.2 |
0.5 |
GO:1904350 |
regulation of protein catabolic process in the vacuole(GO:1904350) |
| 0.2 |
0.5 |
GO:0006537 |
glutamate biosynthetic process(GO:0006537) |
| 0.2 |
0.2 |
GO:0090281 |
negative regulation of calcium ion import(GO:0090281) |
| 0.2 |
0.4 |
GO:0046015 |
regulation of transcription by glucose(GO:0046015) |
| 0.2 |
0.8 |
GO:0008063 |
Toll signaling pathway(GO:0008063) |
| 0.2 |
2.3 |
GO:0014029 |
neural crest formation(GO:0014029) |
| 0.2 |
0.6 |
GO:1903567 |
negative regulation of protein localization to cilium(GO:1903565) regulation of protein localization to ciliary membrane(GO:1903567) negative regulation of protein localization to ciliary membrane(GO:1903568) |
| 0.2 |
1.9 |
GO:0032007 |
negative regulation of TOR signaling(GO:0032007) |
| 0.2 |
1.5 |
GO:0001573 |
ganglioside metabolic process(GO:0001573) |
| 0.2 |
0.9 |
GO:0000393 |
spliceosomal conformational changes to generate catalytic conformation(GO:0000393) |
| 0.2 |
1.0 |
GO:2000785 |
regulation of autophagosome assembly(GO:2000785) |
| 0.2 |
0.5 |
GO:0032331 |
negative regulation of chondrocyte differentiation(GO:0032331) |
| 0.2 |
4.6 |
GO:0016266 |
O-glycan processing(GO:0016266) |
| 0.2 |
1.2 |
GO:0032329 |
serine transport(GO:0032329) |
| 0.2 |
0.5 |
GO:0048312 |
intracellular distribution of mitochondria(GO:0048312) |
| 0.1 |
0.3 |
GO:0009804 |
coumarin metabolic process(GO:0009804) |
| 0.1 |
6.0 |
GO:0006826 |
iron ion transport(GO:0006826) |
| 0.1 |
2.7 |
GO:0006744 |
ubiquinone biosynthetic process(GO:0006744) quinone biosynthetic process(GO:1901663) |
| 0.1 |
0.4 |
GO:0021670 |
lateral ventricle development(GO:0021670) |
| 0.1 |
0.1 |
GO:0044339 |
canonical Wnt signaling pathway involved in osteoblast differentiation(GO:0044339) |
| 0.1 |
1.0 |
GO:0046466 |
membrane lipid catabolic process(GO:0046466) |
| 0.1 |
0.7 |
GO:0032463 |
negative regulation of protein homooligomerization(GO:0032463) |
| 0.1 |
5.2 |
GO:0046718 |
viral entry into host cell(GO:0046718) |
| 0.1 |
0.3 |
GO:0042402 |
cellular biogenic amine catabolic process(GO:0042402) |
| 0.1 |
0.2 |
GO:0030813 |
positive regulation of nucleotide catabolic process(GO:0030813) |
| 0.1 |
0.2 |
GO:0051923 |
sulfation(GO:0051923) |
| 0.1 |
0.9 |
GO:0045599 |
negative regulation of fat cell differentiation(GO:0045599) |
| 0.1 |
0.3 |
GO:0032926 |
negative regulation of activin receptor signaling pathway(GO:0032926) |
| 0.1 |
0.2 |
GO:0097094 |
craniofacial suture morphogenesis(GO:0097094) |
| 0.1 |
0.2 |
GO:0060017 |
parathyroid gland development(GO:0060017) |
| 0.1 |
0.6 |
GO:2001224 |
positive regulation of neuron migration(GO:2001224) |
| 0.1 |
0.9 |
GO:0097320 |
membrane tubulation(GO:0097320) |
| 0.0 |
0.3 |
GO:0002089 |
lens morphogenesis in camera-type eye(GO:0002089) |
| 0.0 |
0.2 |
GO:0003338 |
metanephros morphogenesis(GO:0003338) |
| 0.0 |
0.1 |
GO:0048484 |
enteric nervous system development(GO:0048484) |
| 0.0 |
0.2 |
GO:2001269 |
positive regulation of cysteine-type endopeptidase activity involved in apoptotic signaling pathway(GO:2001269) |
| 0.0 |
0.4 |
GO:0070206 |
protein trimerization(GO:0070206) |
| 0.0 |
0.1 |
GO:0032695 |
negative regulation of interleukin-12 production(GO:0032695) |
| 0.0 |
3.0 |
GO:0060271 |
cilium morphogenesis(GO:0060271) |
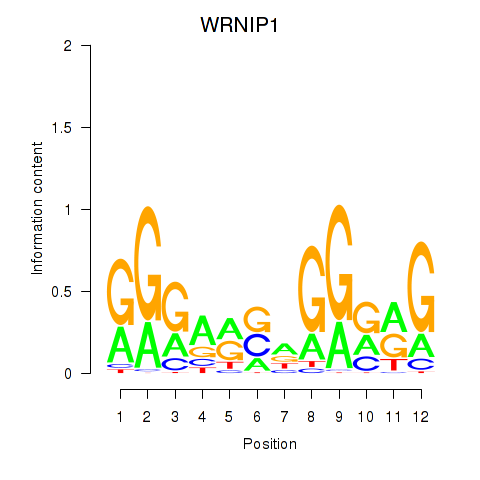
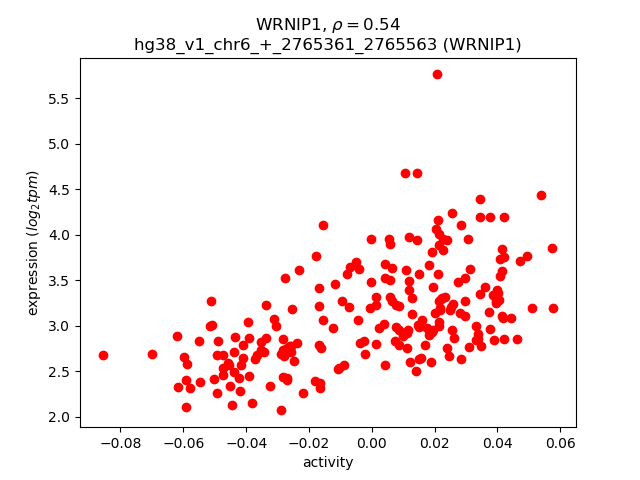

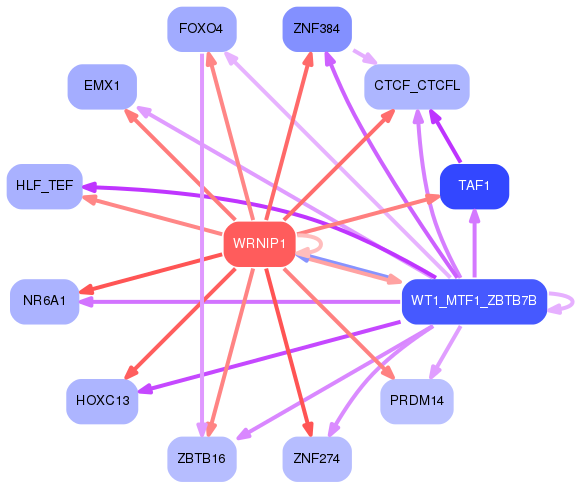