Project
GNF SymAtlas + NCI-60 cancer cell lines, human (Su, 2004; Ross, 2000)
Navigation
Downloads
Results for ZBTB3
Z-value: 0.74
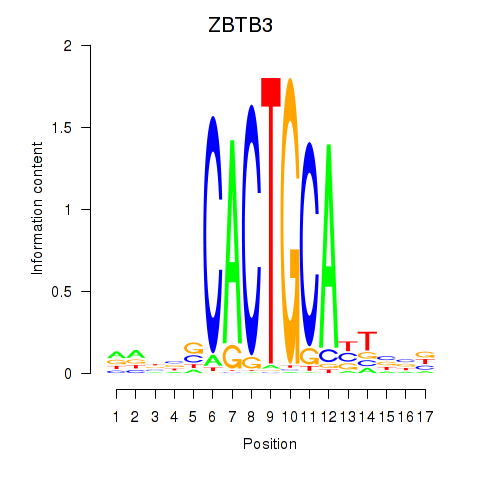
Motif logo
Transcription factors associated with ZBTB3
| Gene Symbol | Gene ID | Gene Info |
|---|---|---|
|
ZBTB3
|
ENSG00000185670.9 | ZBTB3 |
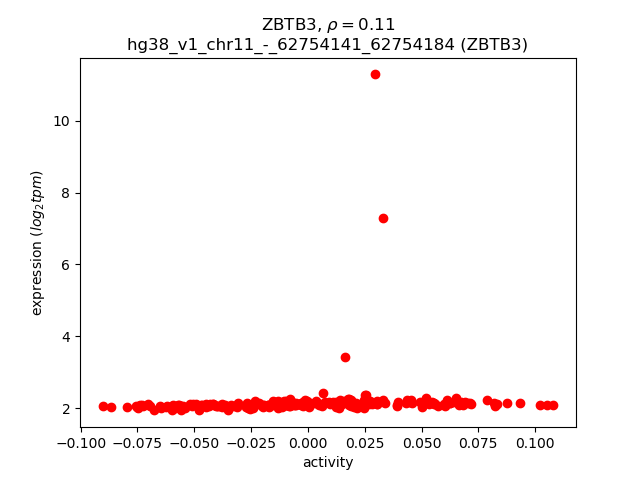
Activity-expression correlation:
| Gene | Promoter | Pearson corr. coef. | P-value | Plot |
|---|---|---|---|---|
| ZBTB3 | hg38_v1_chr11_-_62754141_62754184 | 0.11 | 9.6e-02 | Click! |
Activity profile of ZBTB3 motif
Sorted Z-values of ZBTB3 motif
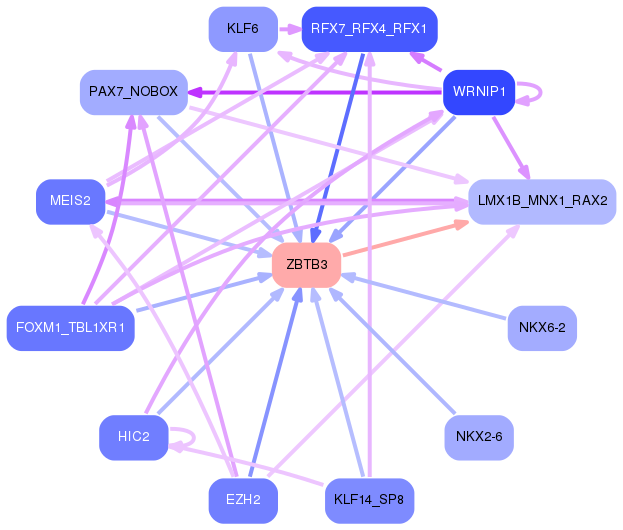
Network of associatons between targets according to the STRING database.

First level regulatory network of ZBTB3
| Promoter | Score | Transcript | Gene | Gene Info |
|---|---|---|---|---|
| chr9_+_71911468 | 18.01 |
ENST00000377031.7
|
C9orf85
|
chromosome 9 open reading frame 85 |
| chr21_-_46605073 | 15.04 |
ENST00000291700.9
ENST00000367071.4 |
S100B
|
S100 calcium binding protein B |
| chr19_+_35030626 | 13.29 |
ENST00000638536.1
|
SCN1B
|
sodium voltage-gated channel beta subunit 1 |
| chr19_+_35030438 | 12.51 |
ENST00000415950.5
ENST00000262631.11 |
SCN1B
|
sodium voltage-gated channel beta subunit 1 |
| chr1_+_244835616 | 12.24 |
ENST00000366528.3
ENST00000411948.7 |
COX20
|
cytochrome c oxidase assembly factor COX20 |
| chr16_-_19884828 | 12.19 |
ENST00000300571.7
ENST00000570142.5 ENST00000562469.5 |
GPRC5B
|
G protein-coupled receptor class C group 5 member B |
| chr4_-_73069696 | 11.96 |
ENST00000507544.3
ENST00000295890.8 |
COX18
|
cytochrome c oxidase assembly factor COX18 |
| chr5_+_75512058 | 11.28 |
ENST00000514296.5
|
POLK
|
DNA polymerase kappa |
| chr2_-_2326210 | 10.83 |
ENST00000647755.1
|
MYT1L
|
myelin transcription factor 1 like |
| chr2_-_151971750 | 10.81 |
ENST00000636598.1
|
CACNB4
|
calcium voltage-gated channel auxiliary subunit beta 4 |
| chr3_-_39281261 | 10.02 |
ENST00000541347.5
ENST00000412814.1 |
CX3CR1
|
C-X3-C motif chemokine receptor 1 |
| chr5_+_170861990 | 9.87 |
ENST00000523189.6
|
RANBP17
|
RAN binding protein 17 |
| chr19_-_39532809 | 9.87 |
ENST00000326282.5
|
EID2B
|
EP300 interacting inhibitor of differentiation 2B |
| chr11_+_123358416 | 9.05 |
ENST00000638157.1
|
GRAMD1B
|
GRAM domain containing 1B |
| chr4_-_5893075 | 9.03 |
ENST00000324989.12
|
CRMP1
|
collapsin response mediator protein 1 |
| chr5_+_77086682 | 8.59 |
ENST00000643365.1
ENST00000645183.1 ENST00000645374.1 ENST00000647364.1 ENST00000643848.1 ENST00000643603.1 ENST00000645459.1 ENST00000643269.1 ENST00000503969.6 ENST00000646262.1 |
ZBED3-AS1
ENSG00000284762.1
|
ZBED3 antisense RNA 1 phosphodiesterase 8B |
| chr16_-_2135898 | 8.54 |
ENST00000262304.9
ENST00000423118.5 |
PKD1
|
polycystin 1, transient receptor potential channel interacting |
| chr1_+_159171607 | 8.45 |
ENST00000368124.8
ENST00000368125.9 ENST00000416746.1 |
CADM3
|
cell adhesion molecule 3 |
| chr2_-_2326378 | 7.66 |
ENST00000647618.1
|
MYT1L
|
myelin transcription factor 1 like |
| chr20_+_63658286 | 7.63 |
ENST00000360203.11
ENST00000508582.7 ENST00000318100.9 ENST00000356810.5 |
RTEL1
|
regulator of telomere elongation helicase 1 |
| chr9_+_71911615 | 6.84 |
ENST00000334731.7
ENST00000486911.2 |
C9orf85
|
chromosome 9 open reading frame 85 |
| chr11_+_64924673 | 6.65 |
ENST00000164133.7
ENST00000532850.1 |
PPP2R5B
|
protein phosphatase 2 regulatory subunit B'beta |
| chr11_+_26332117 | 5.72 |
ENST00000531646.1
ENST00000256737.8 |
ANO3
|
anoctamin 3 |
| chr10_-_124744280 | 5.46 |
ENST00000337318.8
|
FAM53B
|
family with sequence similarity 53 member B |
| chr17_+_7627963 | 5.32 |
ENST00000575729.5
ENST00000340624.9 |
SHBG
|
sex hormone binding globulin |
| chr6_-_31972290 | 5.19 |
ENST00000375349.7
|
DXO
|
decapping exoribonuclease |
| chrX_+_135032346 | 4.98 |
ENST00000257013.9
|
RTL8C
|
retrotransposon Gag like 8C |
| chr11_-_130916437 | 4.83 |
ENST00000533214.1
ENST00000528555.5 ENST00000530356.5 ENST00000265909.9 |
SNX19
|
sorting nexin 19 |
| chr6_-_31971958 | 4.67 |
ENST00000375356.7
|
DXO
|
decapping exoribonuclease |
| chr19_-_3772211 | 4.54 |
ENST00000555978.5
ENST00000555633.3 |
RAX2
|
retina and anterior neural fold homeobox 2 |
| chr19_+_52274443 | 4.53 |
ENST00000600821.5
ENST00000595149.5 ENST00000595000.5 ENST00000593612.1 |
ZNF766
|
zinc finger protein 766 |
| chr6_-_31972123 | 4.21 |
ENST00000337523.10
|
DXO
|
decapping exoribonuclease |
| chr12_+_41188301 | 4.11 |
ENST00000402685.7
|
PDZRN4
|
PDZ domain containing ring finger 4 |
| chr8_-_42768781 | 3.95 |
ENST00000276410.7
|
CHRNA6
|
cholinergic receptor nicotinic alpha 6 subunit |
| chr14_-_91947654 | 3.86 |
ENST00000342058.9
|
FBLN5
|
fibulin 5 |
| chr1_-_204494752 | 3.78 |
ENST00000684373.1
|
PIK3C2B
|
phosphatidylinositol-4-phosphate 3-kinase catalytic subunit type 2 beta |
| chr5_+_76083360 | 3.65 |
ENST00000502798.7
|
SV2C
|
synaptic vesicle glycoprotein 2C |
| chrX_+_11758159 | 3.47 |
ENST00000361672.6
ENST00000337339.7 ENST00000647869.1 ENST00000312196.10 ENST00000647857.1 ENST00000649130.1 |
MSL3
|
MSL complex subunit 3 |
| chrX_-_386900 | 3.34 |
ENST00000390665.9
|
PPP2R3B
|
protein phosphatase 2 regulatory subunit B''beta |
| chr6_+_122779707 | 3.30 |
ENST00000368444.8
ENST00000356535.4 |
FABP7
|
fatty acid binding protein 7 |
| chr1_-_110606347 | 3.29 |
ENST00000316361.10
|
KCNA2
|
potassium voltage-gated channel subfamily A member 2 |
| chr2_-_74343397 | 3.19 |
ENST00000394019.6
ENST00000377634.8 ENST00000436454.1 |
SLC4A5
|
solute carrier family 4 member 5 |
| chr19_-_55038256 | 3.10 |
ENST00000417454.5
ENST00000310373.7 ENST00000333884.2 |
GP6
|
glycoprotein VI platelet |
| chr8_-_42768602 | 3.10 |
ENST00000534622.5
|
CHRNA6
|
cholinergic receptor nicotinic alpha 6 subunit |
| chr1_-_169586539 | 2.92 |
ENST00000367796.3
|
F5
|
coagulation factor V |
| chr1_-_110606009 | 2.65 |
ENST00000640774.2
ENST00000638616.2 |
KCNA2
|
potassium voltage-gated channel subfamily A member 2 |
| chr10_+_97572493 | 2.65 |
ENST00000307518.9
ENST00000298808.9 |
ANKRD2
|
ankyrin repeat domain 2 |
| chr14_-_91947383 | 2.58 |
ENST00000267620.14
|
FBLN5
|
fibulin 5 |
| chr5_+_114362043 | 2.51 |
ENST00000673685.1
|
KCNN2
|
potassium calcium-activated channel subfamily N member 2 |
| chr5_-_150290093 | 2.25 |
ENST00000672479.1
|
CAMK2A
|
calcium/calmodulin dependent protein kinase II alpha |
| chr9_+_123033660 | 2.22 |
ENST00000616002.3
|
GPR21
|
G protein-coupled receptor 21 |
| chr17_-_58517835 | 2.18 |
ENST00000579921.1
ENST00000579925.5 ENST00000323456.9 |
MTMR4
|
myotubularin related protein 4 |
| chrX_-_155334580 | 2.16 |
ENST00000369449.7
ENST00000321926.4 |
CLIC2
|
chloride intracellular channel 2 |
| chr5_-_170297746 | 2.11 |
ENST00000046794.10
|
LCP2
|
lymphocyte cytosolic protein 2 |
| chr1_-_169586471 | 1.97 |
ENST00000367797.9
|
F5
|
coagulation factor V |
| chr1_+_209827964 | 1.97 |
ENST00000491415.7
|
UTP25
|
UTP25 small subunit processor component |
| chr5_+_141135199 | 1.89 |
ENST00000231134.8
ENST00000623915.1 |
PCDHB5
|
protocadherin beta 5 |
| chr2_-_2326161 | 1.88 |
ENST00000649810.1
ENST00000648318.1 |
MYT1L
|
myelin transcription factor 1 like |
| chr10_-_75109172 | 1.73 |
ENST00000372700.7
ENST00000473072.2 ENST00000491677.6 ENST00000372702.7 |
DUSP13
|
dual specificity phosphatase 13 |
| chr5_-_95081482 | 1.72 |
ENST00000312216.12
ENST00000512425.5 ENST00000505208.5 ENST00000429576.6 ENST00000508509.5 ENST00000510732.5 |
MCTP1
|
multiple C2 and transmembrane domain containing 1 |
| chr10_-_75109085 | 1.67 |
ENST00000607131.5
|
DUSP13
|
dual specificity phosphatase 13 |
| chr11_-_83071917 | 1.64 |
ENST00000534141.5
|
RAB30
|
RAB30, member RAS oncogene family |
| chrX_+_71144818 | 1.47 |
ENST00000536169.5
ENST00000358741.4 ENST00000395855.6 ENST00000374051.7 |
NLGN3
|
neuroligin 3 |
| chr6_+_42173358 | 1.38 |
ENST00000372958.2
|
GUCA1A
|
guanylate cyclase activator 1A |
| chr16_+_89720980 | 1.28 |
ENST00000289816.9
ENST00000568064.5 |
ZNF276
|
zinc finger protein 276 |
| chr18_+_12407896 | 1.27 |
ENST00000590956.5
ENST00000336990.8 ENST00000440960.6 ENST00000588729.5 |
PRELID3A
|
PRELI domain containing 3A |
| chr20_+_56412393 | 1.26 |
ENST00000679529.1
|
CASS4
|
Cas scaffold protein family member 4 |
| chr19_-_6670151 | 1.25 |
ENST00000675206.1
|
TNFSF14
|
TNF superfamily member 14 |
| chr6_+_30882914 | 1.22 |
ENST00000509639.5
ENST00000412274.6 ENST00000507901.5 ENST00000507046.5 ENST00000437124.6 ENST00000454612.6 ENST00000396342.6 |
DDR1
|
discoidin domain receptor tyrosine kinase 1 |
| chr3_+_178558700 | 1.21 |
ENST00000432997.5
ENST00000455865.5 |
KCNMB2
|
potassium calcium-activated channel subfamily M regulatory beta subunit 2 |
| chrX_-_86047527 | 1.13 |
ENST00000615443.1
ENST00000357749.7 |
CHM
|
CHM Rab escort protein |
| chr19_-_6670117 | 1.09 |
ENST00000245912.7
|
TNFSF14
|
TNF superfamily member 14 |
| chr21_+_43789522 | 1.05 |
ENST00000497547.2
|
RRP1
|
ribosomal RNA processing 1 |
| chr7_-_127585566 | 1.00 |
ENST00000321407.3
|
GCC1
|
GRIP and coiled-coil domain containing 1 |
| chr1_+_171781635 | 0.99 |
ENST00000361735.4
ENST00000362019.7 ENST00000367737.9 |
EEF1AKNMT
|
eEF1A lysine and N-terminal methyltransferase |
| chr6_+_138773747 | 0.96 |
ENST00000617445.5
|
CCDC28A
|
coiled-coil domain containing 28A |
| chr15_+_32030481 | 0.94 |
ENST00000454250.7
ENST00000675428.1 ENST00000637552.1 |
CHRNA7
|
cholinergic receptor nicotinic alpha 7 subunit |
| chr20_+_56412112 | 0.92 |
ENST00000360314.7
|
CASS4
|
Cas scaffold protein family member 4 |
| chr12_-_114406133 | 0.88 |
ENST00000405440.7
|
TBX5
|
T-box transcription factor 5 |
| chr17_-_5584448 | 0.87 |
ENST00000269280.8
ENST00000571451.6 ENST00000572272.6 ENST00000613500.4 ENST00000619223.4 ENST00000617618.4 ENST00000345221.7 ENST00000262467.10 |
NLRP1
|
NLR family pyrin domain containing 1 |
| chr20_+_56412249 | 0.85 |
ENST00000679887.1
ENST00000434344.2 |
CASS4
|
Cas scaffold protein family member 4 |
| chr11_+_67240047 | 0.83 |
ENST00000530342.2
|
KDM2A
|
lysine demethylase 2A |
| chr17_+_74987581 | 0.81 |
ENST00000337231.5
|
CDR2L
|
cerebellar degeneration related protein 2 like |
| chr2_-_153478753 | 0.74 |
ENST00000325926.4
|
RPRM
|
reprimo, TP53 dependent G2 arrest mediator homolog |
| chr1_+_160190567 | 0.73 |
ENST00000368078.8
|
CASQ1
|
calsequestrin 1 |
| chr3_+_98531965 | 0.72 |
ENST00000284311.5
|
GPR15
|
G protein-coupled receptor 15 |
| chr15_+_32030506 | 0.56 |
ENST00000306901.9
ENST00000636440.1 |
CHRNA7
|
cholinergic receptor nicotinic alpha 7 subunit |
| chr7_+_143935233 | 0.46 |
ENST00000408955.3
|
OR2F2
|
olfactory receptor family 2 subfamily F member 2 |
| chr4_-_15938740 | 0.36 |
ENST00000382333.2
|
FGFBP1
|
fibroblast growth factor binding protein 1 |
| chr6_+_44158807 | 0.35 |
ENST00000532171.5
ENST00000398776.2 |
CAPN11
|
calpain 11 |
| chr11_-_83071819 | 0.32 |
ENST00000524635.1
ENST00000526205.5 ENST00000533486.5 ENST00000533276.6 ENST00000527633.6 |
RAB30
|
RAB30, member RAS oncogene family |
| chr1_+_171257930 | 0.23 |
ENST00000354841.4
|
FMO1
|
flavin containing dimethylaniline monoxygenase 1 |
| chr17_+_77127865 | 0.21 |
ENST00000586429.5
|
SEC14L1
|
SEC14 like lipid binding 1 |
| chr4_-_122621011 | 0.18 |
ENST00000611104.2
ENST00000648588.1 |
IL21
|
interleukin 21 |
Gene Ontology Analysis
Gene overrepresentation in biological process category:
| Log-likelihood per target | Total log-likelihood | Term | Description |
|---|---|---|---|
| 4.3 | 25.8 | GO:0021966 | corticospinal neuron axon guidance(GO:0021966) |
| 3.0 | 9.0 | GO:1904529 | regulation of actin filament binding(GO:1904529) regulation of actin binding(GO:1904616) |
| 2.5 | 7.6 | GO:1904430 | negative regulation of t-circle formation(GO:1904430) |
| 2.5 | 10.0 | GO:0002881 | negative regulation of chronic inflammatory response to non-antigenic stimulus(GO:0002881) |
| 2.2 | 6.7 | GO:0070317 | negative regulation of G0 to G1 transition(GO:0070317) |
| 2.1 | 8.5 | GO:0072237 | metanephric proximal tubule development(GO:0072237) |
| 1.9 | 5.7 | GO:0061591 | calcium activated phospholipid scrambling(GO:0061588) calcium activated phosphatidylcholine scrambling(GO:0061590) calcium activated galactosylceramide scrambling(GO:0061591) |
| 1.6 | 3.2 | GO:0033326 | cerebrospinal fluid secretion(GO:0033326) |
| 1.2 | 4.8 | GO:1990502 | dense core granule maturation(GO:1990502) |
| 1.2 | 24.2 | GO:0008535 | respiratory chain complex IV assembly(GO:0008535) |
| 1.1 | 15.0 | GO:2001015 | negative regulation of skeletal muscle cell differentiation(GO:2001015) |
| 0.8 | 4.9 | GO:0032571 | response to vitamin K(GO:0032571) |
| 0.8 | 14.1 | GO:0071028 | nuclear RNA surveillance(GO:0071027) nuclear mRNA surveillance(GO:0071028) |
| 0.6 | 12.2 | GO:0060907 | positive regulation of macrophage cytokine production(GO:0060907) |
| 0.6 | 5.9 | GO:0021633 | optic nerve structural organization(GO:0021633) |
| 0.6 | 2.3 | GO:0008588 | release of cytoplasmic sequestered NF-kappaB(GO:0008588) |
| 0.5 | 20.4 | GO:0048665 | neuron fate specification(GO:0048665) |
| 0.5 | 5.8 | GO:0048251 | elastic fiber assembly(GO:0048251) |
| 0.4 | 1.5 | GO:0060024 | rhythmic synaptic transmission(GO:0060024) |
| 0.4 | 11.3 | GO:0042276 | error-prone translesion synthesis(GO:0042276) |
| 0.3 | 0.9 | GO:0072513 | cardiac left ventricle formation(GO:0003218) positive regulation of secondary heart field cardioblast proliferation(GO:0072513) |
| 0.2 | 1.5 | GO:0050893 | sensory processing(GO:0050893) |
| 0.2 | 2.9 | GO:0014894 | response to muscle inactivity involved in regulation of muscle adaptation(GO:0014877) response to denervation involved in regulation of muscle adaptation(GO:0014894) |
| 0.2 | 7.0 | GO:0014046 | dopamine secretion(GO:0014046) regulation of dopamine secretion(GO:0014059) |
| 0.2 | 2.2 | GO:0060315 | negative regulation of ryanodine-sensitive calcium-release channel activity(GO:0060315) |
| 0.2 | 2.5 | GO:0098914 | membrane repolarization during atrial cardiac muscle cell action potential(GO:0098914) |
| 0.2 | 2.7 | GO:2000291 | regulation of myoblast proliferation(GO:2000291) |
| 0.2 | 10.8 | GO:1901385 | regulation of voltage-gated calcium channel activity(GO:1901385) |
| 0.2 | 3.3 | GO:0060134 | prepulse inhibition(GO:0060134) |
| 0.1 | 5.5 | GO:0035411 | catenin import into nucleus(GO:0035411) |
| 0.1 | 1.2 | GO:0061302 | smooth muscle cell-matrix adhesion(GO:0061302) |
| 0.1 | 8.5 | GO:0007157 | heterophilic cell-cell adhesion via plasma membrane cell adhesion molecules(GO:0007157) |
| 0.1 | 1.1 | GO:0018344 | protein geranylgeranylation(GO:0018344) |
| 0.1 | 2.2 | GO:0038166 | angiotensin-activated signaling pathway(GO:0038166) |
| 0.1 | 1.4 | GO:0031284 | positive regulation of guanylate cyclase activity(GO:0031284) |
| 0.1 | 3.5 | GO:0043984 | histone H4-K16 acetylation(GO:0043984) |
| 0.1 | 1.2 | GO:0005513 | detection of calcium ion(GO:0005513) |
| 0.1 | 5.3 | GO:0006611 | protein export from nucleus(GO:0006611) |
| 0.1 | 1.9 | GO:0016339 | calcium-dependent cell-cell adhesion via plasma membrane cell adhesion molecules(GO:0016339) |
| 0.1 | 0.4 | GO:0045743 | positive regulation of fibroblast growth factor receptor signaling pathway(GO:0045743) |
| 0.1 | 0.8 | GO:0070544 | histone H3-K36 demethylation(GO:0070544) |
| 0.1 | 2.2 | GO:0040018 | positive regulation of multicellular organism growth(GO:0040018) |
| 0.0 | 3.8 | GO:0036092 | phosphatidylinositol-3-phosphate biosynthetic process(GO:0036092) |
| 0.0 | 1.0 | GO:0000042 | protein targeting to Golgi(GO:0000042) |
| 0.0 | 0.9 | GO:0032495 | response to muramyl dipeptide(GO:0032495) |
| 0.0 | 0.2 | GO:0070995 | NADPH oxidation(GO:0070995) |
| 0.0 | 3.4 | GO:0035335 | peptidyl-tyrosine dephosphorylation(GO:0035335) |
| 0.0 | 5.2 | GO:0030168 | platelet activation(GO:0030168) |
| 0.0 | 4.5 | GO:0007601 | visual perception(GO:0007601) |
| 0.0 | 0.2 | GO:0045078 | positive regulation of interferon-gamma biosynthetic process(GO:0045078) |
| 0.0 | 0.2 | GO:0015871 | choline transport(GO:0015871) |
| 0.0 | 1.3 | GO:0015914 | phospholipid transport(GO:0015914) |
| 0.0 | 0.7 | GO:0072678 | T cell migration(GO:0072678) |
| 0.0 | 7.4 | GO:0007517 | muscle organ development(GO:0007517) |
| 0.0 | 3.2 | GO:0006836 | neurotransmitter transport(GO:0006836) |
| 0.0 | 3.6 | GO:0007050 | cell cycle arrest(GO:0007050) |
| 0.0 | 1.7 | GO:0019722 | calcium-mediated signaling(GO:0019722) |
Gene overrepresentation in cellular component category:
| Log-likelihood per target | Total log-likelihood | Term | Description |
|---|---|---|---|
| 1.0 | 25.8 | GO:0001518 | voltage-gated sodium channel complex(GO:0001518) |
| 0.6 | 5.8 | GO:0071953 | elastic fiber(GO:0071953) |
| 0.5 | 16.0 | GO:0044298 | neuronal cell body membrane(GO:0032809) cell body membrane(GO:0044298) |
| 0.4 | 3.5 | GO:0072487 | MSL complex(GO:0072487) |
| 0.4 | 2.1 | GO:0036398 | TCR signalosome(GO:0036398) |
| 0.4 | 12.0 | GO:0031305 | intrinsic component of mitochondrial inner membrane(GO:0031304) integral component of mitochondrial inner membrane(GO:0031305) |
| 0.3 | 3.1 | GO:0097197 | tetraspanin-enriched microdomain(GO:0097197) |
| 0.3 | 8.5 | GO:0005892 | acetylcholine-gated channel complex(GO:0005892) |
| 0.3 | 1.1 | GO:0005968 | Rab-protein geranylgeranyltransferase complex(GO:0005968) |
| 0.2 | 10.0 | GO:0000159 | protein phosphatase type 2A complex(GO:0000159) |
| 0.2 | 0.7 | GO:0014802 | terminal cisterna(GO:0014802) |
| 0.2 | 0.9 | GO:0072558 | NLRP1 inflammasome complex(GO:0072558) |
| 0.2 | 10.8 | GO:0005891 | voltage-gated calcium channel complex(GO:0005891) |
| 0.1 | 3.8 | GO:0005942 | phosphatidylinositol 3-kinase complex(GO:0005942) |
| 0.1 | 1.0 | GO:0030688 | preribosome, small subunit precursor(GO:0030688) |
| 0.1 | 6.3 | GO:0030660 | Golgi-associated vesicle membrane(GO:0030660) |
| 0.1 | 9.9 | GO:0005643 | nuclear pore(GO:0005643) |
| 0.1 | 15.0 | GO:0001726 | ruffle(GO:0001726) |
| 0.1 | 1.4 | GO:0097381 | photoreceptor disc membrane(GO:0097381) |
| 0.1 | 4.9 | GO:0033116 | endoplasmic reticulum-Golgi intermediate compartment membrane(GO:0033116) |
| 0.1 | 7.9 | GO:0005913 | cell-cell adherens junction(GO:0005913) |
| 0.0 | 9.0 | GO:0030496 | midbody(GO:0030496) |
| 0.0 | 7.6 | GO:0000781 | chromosome, telomeric region(GO:0000781) |
| 0.0 | 2.0 | GO:0005801 | cis-Golgi network(GO:0005801) |
| 0.0 | 3.7 | GO:0099501 | synaptic vesicle membrane(GO:0030672) exocytic vesicle membrane(GO:0099501) |
| 0.0 | 2.2 | GO:0034707 | chloride channel complex(GO:0034707) |
| 0.0 | 5.2 | GO:0031674 | I band(GO:0031674) |
| 0.0 | 19.3 | GO:0030659 | cytoplasmic vesicle membrane(GO:0030659) |
| 0.0 | 1.3 | GO:0000777 | condensed chromosome kinetochore(GO:0000777) |
| 0.0 | 1.3 | GO:0005758 | mitochondrial intermembrane space(GO:0005758) |
| 0.0 | 1.2 | GO:0034705 | voltage-gated potassium channel complex(GO:0008076) potassium channel complex(GO:0034705) |
Gene overrepresentation in molecular function category:
| Log-likelihood per target | Total log-likelihood | Term | Description |
|---|---|---|---|
| 5.2 | 25.8 | GO:0086062 | voltage-gated sodium channel activity involved in Purkinje myocyte action potential(GO:0086062) |
| 3.5 | 14.1 | GO:0034353 | RNA pyrophosphohydrolase activity(GO:0034353) |
| 2.5 | 10.0 | GO:0016495 | C-X3-C chemokine receptor activity(GO:0016495) |
| 0.9 | 2.7 | GO:0061629 | RNA polymerase II sequence-specific DNA binding transcription factor binding(GO:0061629) |
| 0.8 | 5.3 | GO:0005497 | androgen binding(GO:0005497) |
| 0.7 | 15.0 | GO:0050786 | RAGE receptor binding(GO:0050786) |
| 0.7 | 9.9 | GO:0005049 | nuclear export signal receptor activity(GO:0005049) |
| 0.6 | 2.2 | GO:0001588 | dopamine neurotransmitter receptor activity, coupled via Gs(GO:0001588) |
| 0.4 | 1.3 | GO:1990050 | phosphatidic acid transporter activity(GO:1990050) |
| 0.4 | 9.0 | GO:0031005 | filamin binding(GO:0031005) |
| 0.4 | 5.7 | GO:0005229 | intracellular calcium activated chloride channel activity(GO:0005229) |
| 0.4 | 3.8 | GO:0035005 | lipid kinase activity(GO:0001727) 1-phosphatidylinositol-4-phosphate 3-kinase activity(GO:0035005) |
| 0.4 | 11.3 | GO:0003887 | DNA-directed DNA polymerase activity(GO:0003887) |
| 0.3 | 10.8 | GO:0008331 | high voltage-gated calcium channel activity(GO:0008331) |
| 0.3 | 8.5 | GO:0022848 | acetylcholine-gated cation channel activity(GO:0022848) |
| 0.3 | 1.4 | GO:0008048 | calcium sensitive guanylate cyclase activator activity(GO:0008048) |
| 0.3 | 5.9 | GO:0015271 | outward rectifier potassium channel activity(GO:0015271) |
| 0.3 | 2.5 | GO:0016286 | small conductance calcium-activated potassium channel activity(GO:0016286) |
| 0.2 | 1.1 | GO:0004663 | Rab geranylgeranyltransferase activity(GO:0004663) |
| 0.2 | 1.2 | GO:0038062 | protein tyrosine kinase collagen receptor activity(GO:0038062) |
| 0.2 | 3.2 | GO:0008510 | sodium:bicarbonate symporter activity(GO:0008510) |
| 0.2 | 7.6 | GO:0051539 | 4 iron, 4 sulfur cluster binding(GO:0051539) |
| 0.1 | 4.8 | GO:0032266 | phosphatidylinositol-3-phosphate binding(GO:0032266) |
| 0.1 | 20.4 | GO:0001078 | transcriptional repressor activity, RNA polymerase II core promoter proximal region sequence-specific binding(GO:0001078) |
| 0.1 | 12.2 | GO:0030295 | protein kinase activator activity(GO:0030295) |
| 0.1 | 2.2 | GO:0052629 | phosphatidylinositol-3,5-bisphosphate 3-phosphatase activity(GO:0052629) |
| 0.1 | 12.0 | GO:0008565 | protein transporter activity(GO:0008565) |
| 0.1 | 1.5 | GO:0042043 | neurexin family protein binding(GO:0042043) |
| 0.1 | 10.0 | GO:0019888 | protein phosphatase regulator activity(GO:0019888) |
| 0.1 | 8.5 | GO:0005262 | calcium channel activity(GO:0005262) |
| 0.1 | 2.2 | GO:0004602 | glutathione peroxidase activity(GO:0004602) |
| 0.1 | 3.4 | GO:0008138 | protein tyrosine/serine/threonine phosphatase activity(GO:0008138) |
| 0.1 | 4.9 | GO:0005507 | copper ion binding(GO:0005507) |
| 0.1 | 0.8 | GO:0051864 | histone demethylase activity (H3-K36 specific)(GO:0051864) |
| 0.1 | 2.3 | GO:0043027 | cysteine-type endopeptidase inhibitor activity involved in apoptotic process(GO:0043027) |
| 0.0 | 1.2 | GO:0005227 | calcium activated cation channel activity(GO:0005227) calcium-activated potassium channel activity(GO:0015269) |
| 0.0 | 3.5 | GO:0035064 | methylated histone binding(GO:0035064) |
| 0.0 | 0.2 | GO:0005134 | interleukin-2 receptor binding(GO:0005134) |
| 0.0 | 0.2 | GO:0039552 | RIG-I binding(GO:0039552) |
| 0.0 | 5.8 | GO:0005178 | integrin binding(GO:0005178) |
| 0.0 | 0.2 | GO:0004499 | N,N-dimethylaniline monooxygenase activity(GO:0004499) |
| 0.0 | 0.9 | GO:0008656 | cysteine-type endopeptidase activator activity involved in apoptotic process(GO:0008656) |
| 0.0 | 3.1 | GO:0005518 | collagen binding(GO:0005518) |
| 0.0 | 1.7 | GO:0005544 | calcium-dependent phospholipid binding(GO:0005544) |
| 0.0 | 2.2 | GO:0035254 | glutamate receptor binding(GO:0035254) |
| 0.0 | 0.4 | GO:0017134 | fibroblast growth factor binding(GO:0017134) |
| 0.0 | 5.4 | GO:0000978 | RNA polymerase II core promoter proximal region sequence-specific DNA binding(GO:0000978) |
Gene overrepresentation in curated gene sets: canonical pathways category:
| Log-likelihood per target | Total log-likelihood | Term | Description |
|---|---|---|---|
| 0.1 | 2.1 | PID TCR JNK PATHWAY | JNK signaling in the CD4+ TCR pathway |
| 0.1 | 5.3 | PID AR NONGENOMIC PATHWAY | Nongenotropic Androgen signaling |
| 0.1 | 1.4 | PID CONE PATHWAY | Visual signal transduction: Cones |
| 0.1 | 2.2 | ST WNT CA2 CYCLIC GMP PATHWAY | Wnt/Ca2+/cyclic GMP signaling. |
| 0.1 | 0.9 | PID ANTHRAX PATHWAY | Cellular roles of Anthrax toxin |
| 0.0 | 3.8 | PID KIT PATHWAY | Signaling events mediated by Stem cell factor receptor (c-Kit) |
| 0.0 | 17.7 | NABA SECRETED FACTORS | Genes encoding secreted soluble factors |
| 0.0 | 3.3 | PID RB 1PATHWAY | Regulation of retinoblastoma protein |
| 0.0 | 2.6 | NABA ECM GLYCOPROTEINS | Genes encoding structural ECM glycoproteins |
Gene overrepresentation in curated gene sets: REACTOME pathways category:
| Log-likelihood per target | Total log-likelihood | Term | Description |
|---|---|---|---|
| 0.6 | 25.8 | REACTOME INTERACTION BETWEEN L1 AND ANKYRINS | Genes involved in Interaction between L1 and Ankyrins |
| 0.6 | 15.0 | REACTOME ADVANCED GLYCOSYLATION ENDPRODUCT RECEPTOR SIGNALING | Genes involved in Advanced glycosylation endproduct receptor signaling |
| 0.4 | 8.5 | REACTOME HIGHLY CALCIUM PERMEABLE POSTSYNAPTIC NICOTINIC ACETYLCHOLINE RECEPTORS | Genes involved in Highly calcium permeable postsynaptic nicotinic acetylcholine receptors |
| 0.4 | 3.3 | REACTOME INHIBITION OF REPLICATION INITIATION OF DAMAGED DNA BY RB1 E2F1 | Genes involved in Inhibition of replication initiation of damaged DNA by RB1/E2F1 |
| 0.3 | 9.0 | REACTOME CRMPS IN SEMA3A SIGNALING | Genes involved in CRMPs in Sema3A signaling |
| 0.3 | 4.9 | REACTOME COMMON PATHWAY | Genes involved in Common Pathway |
| 0.2 | 6.7 | REACTOME PLATELET SENSITIZATION BY LDL | Genes involved in Platelet sensitization by LDL |
| 0.2 | 10.0 | REACTOME CHEMOKINE RECEPTORS BIND CHEMOKINES | Genes involved in Chemokine receptors bind chemokines |
| 0.1 | 2.2 | REACTOME SYNTHESIS OF PIPS AT THE LATE ENDOSOME MEMBRANE | Genes involved in Synthesis of PIPs at the late endosome membrane |
| 0.1 | 10.3 | REACTOME NCAM1 INTERACTIONS | Genes involved in NCAM1 interactions |
| 0.1 | 5.9 | REACTOME VOLTAGE GATED POTASSIUM CHANNELS | Genes involved in Voltage gated Potassium channels |
| 0.1 | 3.8 | REACTOME SYNTHESIS OF PIPS AT THE PLASMA MEMBRANE | Genes involved in Synthesis of PIPs at the plasma membrane |
| 0.1 | 2.2 | REACTOME UNBLOCKING OF NMDA RECEPTOR GLUTAMATE BINDING AND ACTIVATION | Genes involved in Unblocking of NMDA receptor, glutamate binding and activation |
| 0.1 | 2.1 | REACTOME GPVI MEDIATED ACTIVATION CASCADE | Genes involved in GPVI-mediated activation cascade |
| 0.0 | 3.7 | REACTOME POTASSIUM CHANNELS | Genes involved in Potassium Channels |
| 0.0 | 0.9 | REACTOME INFLAMMASOMES | Genes involved in Inflammasomes |
| 0.0 | 0.9 | REACTOME YAP1 AND WWTR1 TAZ STIMULATED GENE EXPRESSION | Genes involved in YAP1- and WWTR1 (TAZ)-stimulated gene expression |
| 0.0 | 3.2 | REACTOME TRANSPORT OF INORGANIC CATIONS ANIONS AND AMINO ACIDS OLIGOPEPTIDES | Genes involved in Transport of inorganic cations/anions and amino acids/oligopeptides |