Project
GNF SymAtlas + NCI-60 cancer cell lines, human (Su, 2004; Ross, 2000)
Navigation
Downloads
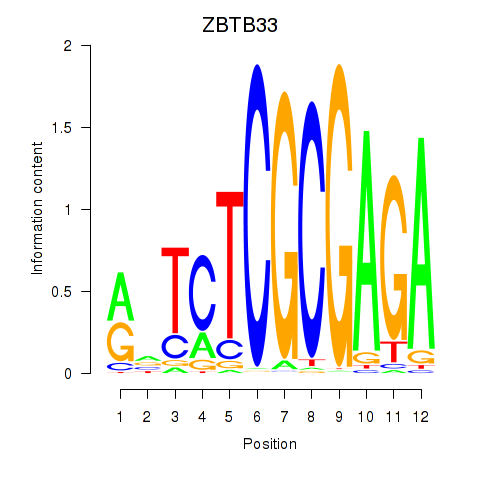
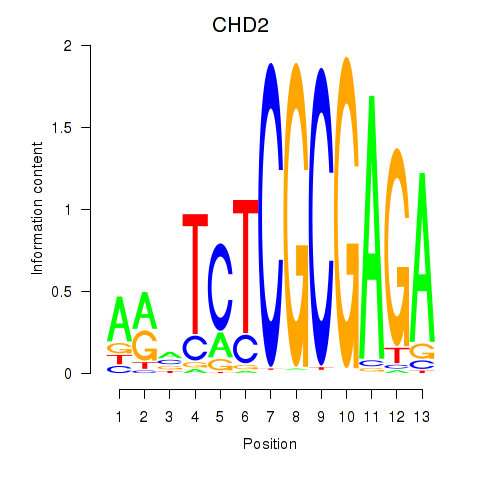
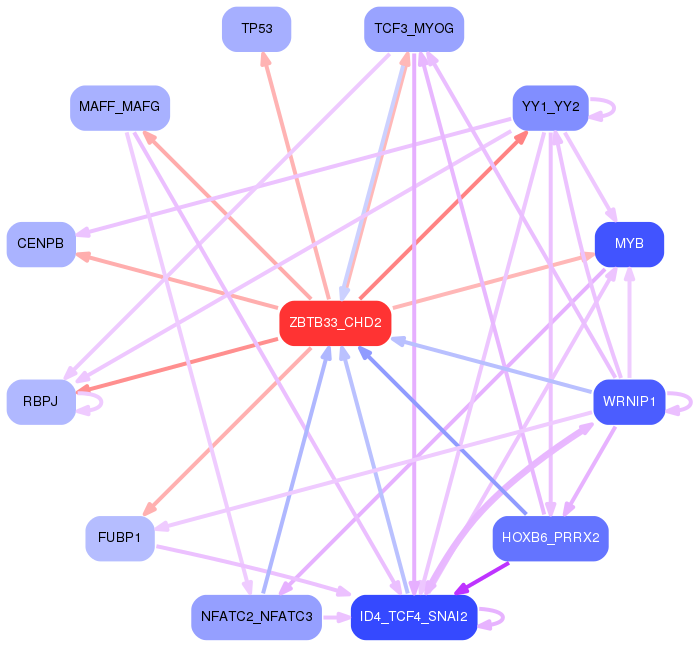
Results for ZBTB33_CHD2
Z-value: 3.93
Motif logo
Transcription factors associated with ZBTB33_CHD2
| Gene Symbol | Gene ID | Gene Info |
|---|---|---|
|
ZBTB33
|
ENSG00000177485.7 | ZBTB33 |
|
CHD2
|
ENSG00000173575.22 | CHD2 |
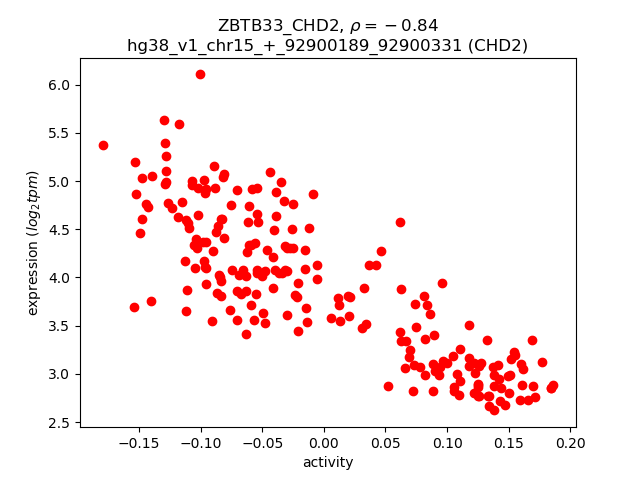
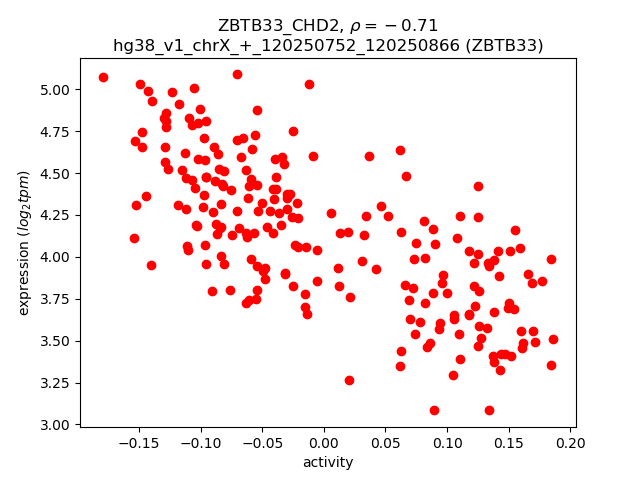
Activity-expression correlation:
| Gene | Promoter | Pearson corr. coef. | P-value | Plot |
|---|---|---|---|---|
| CHD2 | hg38_v1_chr15_+_92900189_92900331 | -0.84 | 1.9e-59 | Click! |
| ZBTB33 | hg38_v1_chrX_+_120250752_120250866 | -0.71 | 2.5e-34 | Click! |
Activity profile of ZBTB33_CHD2 motif
Sorted Z-values of ZBTB33_CHD2 motif
Network of associatons between targets according to the STRING database.

First level regulatory network of ZBTB33_CHD2
Gene Ontology Analysis
Gene overrepresentation in biological process category:
| Log-likelihood per target | Total log-likelihood | Term | Description |
|---|---|---|---|
| 31.2 | 156.1 | GO:0015742 | alpha-ketoglutarate transport(GO:0015742) |
| 28.3 | 113.3 | GO:0002188 | translation reinitiation(GO:0002188) |
| 27.0 | 107.8 | GO:0080154 | regulation of fertilization(GO:0080154) |
| 26.1 | 78.2 | GO:0070682 | proteasome regulatory particle assembly(GO:0070682) |
| 23.4 | 140.2 | GO:0014835 | myoblast differentiation involved in skeletal muscle regeneration(GO:0014835) positive regulation of interleukin-12 secretion(GO:2001184) |
| 20.2 | 80.7 | GO:1904045 | cellular response to aldosterone(GO:1904045) |
| 19.7 | 59.2 | GO:0097698 | telomere maintenance via base-excision repair(GO:0097698) |
| 18.9 | 94.5 | GO:1900262 | regulation of DNA-directed DNA polymerase activity(GO:1900262) positive regulation of DNA-directed DNA polymerase activity(GO:1900264) |
| 18.7 | 93.5 | GO:1902361 | mitochondrial pyruvate transport(GO:0006850) mitochondrial pyruvate transmembrane transport(GO:1902361) |
| 18.5 | 129.6 | GO:1905068 | arterial endothelial cell fate commitment(GO:0060844) blood vessel lumenization(GO:0072554) positive regulation of ephrin receptor signaling pathway(GO:1901189) positive regulation of canonical Wnt signaling pathway involved in cardiac muscle cell fate commitment(GO:1901297) positive regulation of canonical Wnt signaling pathway involved in heart development(GO:1905068) |
| 17.9 | 53.7 | GO:0060528 | secretory columnal luminar epithelial cell differentiation involved in prostate glandular acinus development(GO:0060528) |
| 17.5 | 139.9 | GO:1902255 | positive regulation of intrinsic apoptotic signaling pathway by p53 class mediator(GO:1902255) |
| 16.5 | 99.3 | GO:0015853 | adenine transport(GO:0015853) |
| 16.1 | 96.7 | GO:0033132 | negative regulation of glucokinase activity(GO:0033132) negative regulation of hexokinase activity(GO:1903300) |
| 16.1 | 64.4 | GO:0035880 | embryonic nail plate morphogenesis(GO:0035880) |
| 16.0 | 48.1 | GO:1903778 | protein localization to vacuolar membrane(GO:1903778) |
| 15.7 | 62.9 | GO:0072369 | regulation of lipid transport by positive regulation of transcription from RNA polymerase II promoter(GO:0072369) |
| 15.4 | 46.1 | GO:0000472 | endonucleolytic cleavage to generate mature 5'-end of SSU-rRNA from (SSU-rRNA, 5.8S rRNA, LSU-rRNA)(GO:0000472) rRNA 5'-end processing(GO:0000967) ncRNA 5'-end processing(GO:0034471) |
| 14.8 | 59.3 | GO:1904154 | positive regulation of retrograde protein transport, ER to cytosol(GO:1904154) |
| 14.8 | 73.9 | GO:0007221 | positive regulation of transcription of Notch receptor target(GO:0007221) |
| 14.5 | 57.9 | GO:2000255 | negative regulation of male germ cell proliferation(GO:2000255) |
| 13.2 | 52.9 | GO:1904569 | regulation of selenocysteine incorporation(GO:1904569) |
| 12.9 | 141.7 | GO:0006552 | leucine catabolic process(GO:0006552) |
| 12.6 | 12.6 | GO:1901295 | canonical Wnt signaling pathway involved in cardiac muscle cell fate commitment(GO:0061317) regulation of canonical Wnt signaling pathway involved in cardiac muscle cell fate commitment(GO:1901295) regulation of canonical Wnt signaling pathway involved in heart development(GO:1905066) |
| 12.3 | 49.2 | GO:0042264 | peptidyl-aspartic acid hydroxylation(GO:0042264) |
| 12.2 | 61.0 | GO:0006620 | posttranslational protein targeting to membrane(GO:0006620) |
| 11.9 | 47.6 | GO:0046947 | hydroxylysine metabolic process(GO:0046946) hydroxylysine biosynthetic process(GO:0046947) |
| 11.7 | 537.5 | GO:0070979 | protein K11-linked ubiquitination(GO:0070979) |
| 11.7 | 70.1 | GO:0032911 | negative regulation of transforming growth factor beta1 production(GO:0032911) |
| 11.4 | 136.7 | GO:0007076 | mitotic chromosome condensation(GO:0007076) |
| 11.3 | 157.6 | GO:1904871 | regulation of protein localization to Cajal body(GO:1904869) positive regulation of protein localization to Cajal body(GO:1904871) |
| 10.5 | 62.7 | GO:0033490 | cholesterol biosynthetic process via desmosterol(GO:0033489) cholesterol biosynthetic process via lathosterol(GO:0033490) |
| 10.1 | 20.3 | GO:0090666 | scaRNA localization to Cajal body(GO:0090666) |
| 10.1 | 40.3 | GO:0010796 | regulation of multivesicular body size(GO:0010796) |
| 9.9 | 128.4 | GO:0000244 | spliceosomal tri-snRNP complex assembly(GO:0000244) |
| 9.7 | 202.8 | GO:0007064 | mitotic sister chromatid cohesion(GO:0007064) |
| 9.5 | 76.3 | GO:0071651 | positive regulation of chemokine (C-C motif) ligand 5 production(GO:0071651) |
| 9.4 | 28.3 | GO:0071043 | CUT catabolic process(GO:0071034) CUT metabolic process(GO:0071043) |
| 8.9 | 26.6 | GO:1990022 | RNA polymerase II complex import to nucleus(GO:0044376) RNA polymerase III complex localization to nucleus(GO:1990022) |
| 8.6 | 77.3 | GO:0060699 | regulation of endoribonuclease activity(GO:0060699) |
| 8.3 | 33.3 | GO:0070370 | heat acclimation(GO:0010286) cellular heat acclimation(GO:0070370) |
| 8.0 | 79.6 | GO:1901409 | positive regulation of phosphorylation of RNA polymerase II C-terminal domain(GO:1901409) |
| 7.8 | 38.8 | GO:0033484 | nitric oxide homeostasis(GO:0033484) |
| 7.8 | 38.8 | GO:0033387 | putrescine biosynthetic process from ornithine(GO:0033387) |
| 7.7 | 23.2 | GO:1902626 | assembly of large subunit precursor of preribosome(GO:1902626) |
| 7.7 | 30.7 | GO:0060335 | positive regulation of response to interferon-gamma(GO:0060332) positive regulation of interferon-gamma-mediated signaling pathway(GO:0060335) |
| 7.5 | 45.1 | GO:0042780 | tRNA 3'-end processing(GO:0042780) |
| 7.4 | 95.6 | GO:0034501 | protein localization to kinetochore(GO:0034501) |
| 7.3 | 51.4 | GO:0090235 | regulation of metaphase plate congression(GO:0090235) |
| 7.3 | 21.9 | GO:0006166 | purine ribonucleoside salvage(GO:0006166) |
| 7.2 | 28.9 | GO:0009256 | 10-formyltetrahydrofolate metabolic process(GO:0009256) |
| 7.2 | 50.1 | GO:0015846 | polyamine transport(GO:0015846) |
| 7.1 | 42.6 | GO:0071460 | cellular response to cell-matrix adhesion(GO:0071460) |
| 7.0 | 21.0 | GO:1904751 | positive regulation of protein localization to nucleolus(GO:1904751) |
| 6.9 | 48.4 | GO:0007144 | female meiosis I(GO:0007144) |
| 6.8 | 20.4 | GO:0014016 | neuroblast differentiation(GO:0014016) |
| 6.8 | 20.4 | GO:2000176 | regulation of pro-T cell differentiation(GO:2000174) positive regulation of pro-T cell differentiation(GO:2000176) |
| 6.7 | 26.7 | GO:0042776 | mitochondrial ATP synthesis coupled proton transport(GO:0042776) |
| 6.3 | 93.9 | GO:0006983 | ER overload response(GO:0006983) |
| 6.0 | 30.2 | GO:0071163 | DNA replication preinitiation complex assembly(GO:0071163) |
| 5.9 | 17.7 | GO:1904897 | regulation of hepatic stellate cell proliferation(GO:1904897) positive regulation of hepatic stellate cell proliferation(GO:1904899) hepatic stellate cell proliferation(GO:1990922) |
| 5.5 | 38.7 | GO:0033353 | S-adenosylmethionine cycle(GO:0033353) |
| 5.5 | 44.1 | GO:0036444 | calcium ion transmembrane import into mitochondrion(GO:0036444) |
| 5.4 | 16.3 | GO:0060266 | negative regulation of respiratory burst involved in inflammatory response(GO:0060266) |
| 5.3 | 180.6 | GO:0019054 | NLS-bearing protein import into nucleus(GO:0006607) modulation by virus of host process(GO:0019054) |
| 5.3 | 157.6 | GO:0000470 | maturation of LSU-rRNA(GO:0000470) |
| 5.2 | 31.3 | GO:1904688 | regulation of cap-independent translational initiation(GO:1903677) positive regulation of cap-independent translational initiation(GO:1903679) regulation of cytoplasmic translational initiation(GO:1904688) positive regulation of cytoplasmic translational initiation(GO:1904690) |
| 5.1 | 56.5 | GO:0001833 | inner cell mass cell proliferation(GO:0001833) |
| 5.1 | 25.5 | GO:1902766 | skeletal muscle satellite cell migration(GO:1902766) |
| 5.1 | 20.3 | GO:0061668 | mitochondrial ribosome assembly(GO:0061668) mitochondrial large ribosomal subunit assembly(GO:1902775) |
| 5.0 | 30.0 | GO:0006398 | mRNA 3'-end processing by stem-loop binding and cleavage(GO:0006398) |
| 5.0 | 14.9 | GO:1902822 | cleavage furrow ingression(GO:0036090) lysosomal membrane organization(GO:0097212) regulation of late endosome to lysosome transport(GO:1902822) |
| 5.0 | 29.8 | GO:0002943 | tRNA dihydrouridine synthesis(GO:0002943) |
| 4.9 | 63.5 | GO:0019388 | galactose catabolic process(GO:0019388) |
| 4.9 | 44.0 | GO:0045040 | protein import into mitochondrial outer membrane(GO:0045040) |
| 4.9 | 63.1 | GO:0043248 | proteasome assembly(GO:0043248) |
| 4.8 | 14.5 | GO:0034729 | histone H3-K79 methylation(GO:0034729) |
| 4.7 | 14.2 | GO:0043137 | DNA replication, removal of RNA primer(GO:0043137) |
| 4.4 | 110.9 | GO:0009263 | deoxyribonucleotide biosynthetic process(GO:0009263) |
| 4.3 | 95.3 | GO:0000028 | ribosomal small subunit assembly(GO:0000028) |
| 4.3 | 34.5 | GO:2000483 | negative regulation of interleukin-8 secretion(GO:2000483) |
| 4.1 | 8.2 | GO:0097695 | establishment of RNA localization to telomere(GO:0097694) establishment of macromolecular complex localization to telomere(GO:0097695) |
| 4.0 | 8.0 | GO:0018312 | peptidyl-serine ADP-ribosylation(GO:0018312) |
| 3.9 | 35.5 | GO:0035507 | regulation of myosin-light-chain-phosphatase activity(GO:0035507) |
| 3.9 | 11.8 | GO:1901301 | regulation of cargo loading into COPII-coated vesicle(GO:1901301) |
| 3.9 | 89.0 | GO:0008334 | histone mRNA metabolic process(GO:0008334) |
| 3.8 | 19.2 | GO:1900245 | positive regulation of MDA-5 signaling pathway(GO:1900245) |
| 3.8 | 45.4 | GO:0035414 | negative regulation of catenin import into nucleus(GO:0035414) |
| 3.5 | 24.5 | GO:0016584 | nucleosome positioning(GO:0016584) |
| 3.4 | 24.1 | GO:0090170 | regulation of Golgi inheritance(GO:0090170) |
| 3.4 | 30.9 | GO:0046070 | deoxyribonucleoside monophosphate biosynthetic process(GO:0009157) dGTP metabolic process(GO:0046070) |
| 3.4 | 64.2 | GO:0033539 | fatty acid beta-oxidation using acyl-CoA dehydrogenase(GO:0033539) |
| 3.4 | 30.3 | GO:0010265 | SCF complex assembly(GO:0010265) |
| 3.3 | 46.8 | GO:0051096 | positive regulation of helicase activity(GO:0051096) |
| 3.3 | 43.4 | GO:0000076 | DNA replication checkpoint(GO:0000076) |
| 3.2 | 16.1 | GO:0006529 | asparagine biosynthetic process(GO:0006529) |
| 3.2 | 41.7 | GO:0060340 | positive regulation of type I interferon-mediated signaling pathway(GO:0060340) |
| 3.2 | 25.6 | GO:1904798 | positive regulation of core promoter binding(GO:1904798) |
| 3.2 | 105.6 | GO:0042744 | hydrogen peroxide catabolic process(GO:0042744) |
| 3.1 | 61.8 | GO:0060716 | labyrinthine layer blood vessel development(GO:0060716) |
| 3.0 | 24.3 | GO:0032020 | ISG15-protein conjugation(GO:0032020) |
| 3.0 | 24.2 | GO:0010835 | regulation of protein ADP-ribosylation(GO:0010835) |
| 3.0 | 45.2 | GO:0000338 | protein deneddylation(GO:0000338) |
| 3.0 | 12.0 | GO:0033634 | positive regulation of cell-cell adhesion mediated by integrin(GO:0033634) |
| 3.0 | 8.9 | GO:0042256 | mature ribosome assembly(GO:0042256) |
| 2.9 | 17.7 | GO:1902739 | interferon-alpha secretion(GO:0072642) regulation of interferon-alpha secretion(GO:1902739) positive regulation of interferon-alpha secretion(GO:1902741) |
| 2.9 | 8.8 | GO:0002326 | B cell lineage commitment(GO:0002326) |
| 2.9 | 8.8 | GO:0043461 | proton-transporting ATP synthase complex assembly(GO:0043461) proton-transporting ATP synthase complex biogenesis(GO:0070272) |
| 2.9 | 28.9 | GO:0090267 | positive regulation of mitotic cell cycle spindle assembly checkpoint(GO:0090267) |
| 2.9 | 17.2 | GO:0045743 | positive regulation of fibroblast growth factor receptor signaling pathway(GO:0045743) |
| 2.9 | 8.6 | GO:0031393 | negative regulation of prostaglandin biosynthetic process(GO:0031393) |
| 2.8 | 8.4 | GO:0051684 | maintenance of Golgi location(GO:0051684) |
| 2.7 | 8.0 | GO:0090158 | endoplasmic reticulum membrane organization(GO:0090158) |
| 2.7 | 2.7 | GO:0071283 | cellular response to iron(III) ion(GO:0071283) |
| 2.7 | 50.6 | GO:0006123 | mitochondrial electron transport, cytochrome c to oxygen(GO:0006123) |
| 2.6 | 10.6 | GO:0046116 | queuosine biosynthetic process(GO:0008616) queuosine metabolic process(GO:0046116) |
| 2.6 | 18.4 | GO:2000812 | regulation of barbed-end actin filament capping(GO:2000812) |
| 2.6 | 31.3 | GO:0006449 | regulation of translational termination(GO:0006449) |
| 2.6 | 335.2 | GO:0006613 | cotranslational protein targeting to membrane(GO:0006613) |
| 2.6 | 7.7 | GO:0051464 | positive regulation of hair follicle maturation(GO:0048818) positive regulation of cortisol secretion(GO:0051464) positive regulation of catagen(GO:0051795) |
| 2.6 | 7.7 | GO:2000048 | negative regulation of cell-cell adhesion mediated by cadherin(GO:2000048) |
| 2.5 | 32.2 | GO:0030150 | protein import into mitochondrial matrix(GO:0030150) |
| 2.4 | 17.1 | GO:0007161 | calcium-independent cell-matrix adhesion(GO:0007161) |
| 2.4 | 29.0 | GO:0001682 | tRNA 5'-leader removal(GO:0001682) |
| 2.4 | 9.6 | GO:0051182 | coenzyme transport(GO:0051182) |
| 2.4 | 7.1 | GO:0071072 | negative regulation of phospholipid biosynthetic process(GO:0071072) |
| 2.2 | 6.7 | GO:0048250 | mitochondrial iron ion transport(GO:0048250) |
| 2.2 | 19.9 | GO:0001672 | regulation of chromatin assembly or disassembly(GO:0001672) |
| 2.2 | 6.6 | GO:0003186 | tricuspid valve development(GO:0003175) tricuspid valve morphogenesis(GO:0003186) |
| 2.2 | 88.0 | GO:0043029 | T cell homeostasis(GO:0043029) |
| 2.2 | 6.5 | GO:0090611 | ubiquitin-independent protein catabolic process via the multivesicular body sorting pathway(GO:0090611) regulation of centriole elongation(GO:1903722) |
| 2.1 | 10.3 | GO:0070966 | nuclear-transcribed mRNA catabolic process, no-go decay(GO:0070966) |
| 2.0 | 4.1 | GO:0002339 | B cell selection(GO:0002339) |
| 2.0 | 28.6 | GO:0035970 | peptidyl-threonine dephosphorylation(GO:0035970) |
| 2.0 | 16.1 | GO:0045919 | positive regulation of cytolysis(GO:0045919) |
| 2.0 | 70.3 | GO:0035666 | TRIF-dependent toll-like receptor signaling pathway(GO:0035666) |
| 2.0 | 20.0 | GO:0060287 | epithelial cilium movement involved in determination of left/right asymmetry(GO:0060287) |
| 2.0 | 43.5 | GO:0032802 | low-density lipoprotein particle receptor catabolic process(GO:0032802) |
| 2.0 | 33.6 | GO:0031163 | iron-sulfur cluster assembly(GO:0016226) metallo-sulfur cluster assembly(GO:0031163) |
| 1.9 | 82.7 | GO:0034314 | Arp2/3 complex-mediated actin nucleation(GO:0034314) |
| 1.9 | 14.9 | GO:2000210 | positive regulation of anoikis(GO:2000210) |
| 1.8 | 31.4 | GO:0032688 | negative regulation of interferon-beta production(GO:0032688) |
| 1.8 | 14.2 | GO:0006729 | tetrahydrobiopterin biosynthetic process(GO:0006729) tetrahydrobiopterin metabolic process(GO:0046146) |
| 1.8 | 226.2 | GO:0007062 | sister chromatid cohesion(GO:0007062) |
| 1.7 | 1.7 | GO:1903625 | negative regulation of DNA catabolic process(GO:1903625) |
| 1.7 | 16.9 | GO:0048227 | plasma membrane to endosome transport(GO:0048227) |
| 1.7 | 46.9 | GO:0045737 | positive regulation of cyclin-dependent protein serine/threonine kinase activity(GO:0045737) |
| 1.7 | 67.8 | GO:0006622 | protein targeting to lysosome(GO:0006622) |
| 1.6 | 6.6 | GO:0019230 | proprioception(GO:0019230) equilibrioception(GO:0050957) |
| 1.6 | 8.1 | GO:1903898 | activation of signaling protein activity involved in unfolded protein response(GO:0006987) regulation of hepatocyte growth factor receptor signaling pathway(GO:1902202) positive regulation of IRE1-mediated unfolded protein response(GO:1903896) negative regulation of PERK-mediated unfolded protein response(GO:1903898) |
| 1.6 | 34.9 | GO:0002021 | response to dietary excess(GO:0002021) |
| 1.6 | 7.9 | GO:0051415 | interphase microtubule nucleation by interphase microtubule organizing center(GO:0051415) microtubule nucleation by microtubule organizing center(GO:0051418) |
| 1.6 | 36.2 | GO:2000178 | negative regulation of neural precursor cell proliferation(GO:2000178) |
| 1.6 | 26.5 | GO:0032981 | NADH dehydrogenase complex assembly(GO:0010257) mitochondrial respiratory chain complex I assembly(GO:0032981) mitochondrial respiratory chain complex I biogenesis(GO:0097031) |
| 1.5 | 3.1 | GO:0060434 | bronchus morphogenesis(GO:0060434) |
| 1.5 | 111.4 | GO:0070125 | mitochondrial translational elongation(GO:0070125) |
| 1.5 | 7.7 | GO:2001137 | positive regulation of endocytic recycling(GO:2001137) |
| 1.5 | 9.1 | GO:0071896 | protein localization to adherens junction(GO:0071896) |
| 1.5 | 16.4 | GO:0006657 | CDP-choline pathway(GO:0006657) |
| 1.5 | 29.7 | GO:0033689 | negative regulation of osteoblast proliferation(GO:0033689) |
| 1.5 | 5.9 | GO:0000451 | rRNA 2'-O-methylation(GO:0000451) |
| 1.4 | 7.1 | GO:1903361 | protein localization to basolateral plasma membrane(GO:1903361) |
| 1.4 | 18.2 | GO:1900625 | regulation of monocyte aggregation(GO:1900623) positive regulation of monocyte aggregation(GO:1900625) |
| 1.4 | 4.2 | GO:0060743 | epithelial cell maturation involved in prostate gland development(GO:0060743) |
| 1.4 | 113.7 | GO:0006890 | retrograde vesicle-mediated transport, Golgi to ER(GO:0006890) |
| 1.4 | 19.1 | GO:0061684 | chaperone-mediated autophagy(GO:0061684) regulation of chaperone-mediated autophagy(GO:1904714) |
| 1.4 | 42.4 | GO:0042273 | ribosomal large subunit biogenesis(GO:0042273) |
| 1.4 | 31.4 | GO:0006337 | nucleosome disassembly(GO:0006337) chromatin disassembly(GO:0031498) |
| 1.3 | 6.5 | GO:0045541 | negative regulation of cholesterol biosynthetic process(GO:0045541) negative regulation of cholesterol metabolic process(GO:0090206) |
| 1.3 | 6.5 | GO:0001306 | age-dependent response to oxidative stress(GO:0001306) age-dependent response to reactive oxygen species(GO:0001315) regulation of systemic arterial blood pressure by acetylcholine(GO:0003068) vasodilation by acetylcholine involved in regulation of systemic arterial blood pressure(GO:0003069) regulation of systemic arterial blood pressure by neurotransmitter(GO:0003070) age-dependent general metabolic decline(GO:0007571) |
| 1.3 | 34.7 | GO:0006517 | protein deglycosylation(GO:0006517) |
| 1.3 | 10.2 | GO:0016255 | attachment of GPI anchor to protein(GO:0016255) |
| 1.2 | 22.0 | GO:0006379 | mRNA cleavage(GO:0006379) |
| 1.2 | 13.3 | GO:0036500 | ATF6-mediated unfolded protein response(GO:0036500) |
| 1.2 | 18.8 | GO:1901838 | regulation of transcription of nuclear large rRNA transcript from RNA polymerase I promoter(GO:1901836) positive regulation of transcription of nuclear large rRNA transcript from RNA polymerase I promoter(GO:1901838) |
| 1.2 | 36.0 | GO:0043928 | exonucleolytic nuclear-transcribed mRNA catabolic process involved in deadenylation-dependent decay(GO:0043928) |
| 1.1 | 25.9 | GO:0051306 | regulation of mitotic sister chromatid separation(GO:0010965) mitotic sister chromatid separation(GO:0051306) |
| 1.1 | 42.8 | GO:0006458 | 'de novo' protein folding(GO:0006458) |
| 1.1 | 69.1 | GO:0006369 | termination of RNA polymerase II transcription(GO:0006369) |
| 1.1 | 12.6 | GO:0048255 | mRNA stabilization(GO:0048255) |
| 1.0 | 61.7 | GO:0006120 | mitochondrial electron transport, NADH to ubiquinone(GO:0006120) |
| 1.0 | 5.2 | GO:0061732 | mitochondrial acetyl-CoA biosynthetic process from pyruvate(GO:0061732) |
| 1.0 | 3.1 | GO:0035048 | splicing factor protein import into nucleus(GO:0035048) |
| 1.0 | 17.2 | GO:0070935 | 3'-UTR-mediated mRNA stabilization(GO:0070935) |
| 1.0 | 6.0 | GO:0003350 | pulmonary myocardium development(GO:0003350) |
| 1.0 | 11.7 | GO:0006268 | DNA unwinding involved in DNA replication(GO:0006268) |
| 0.9 | 3.7 | GO:0048388 | endosomal lumen acidification(GO:0048388) |
| 0.9 | 2.7 | GO:0032289 | central nervous system myelin formation(GO:0032289) |
| 0.9 | 9.0 | GO:0014894 | response to muscle inactivity involved in regulation of muscle adaptation(GO:0014877) response to denervation involved in regulation of muscle adaptation(GO:0014894) |
| 0.9 | 2.7 | GO:0000103 | sulfate assimilation(GO:0000103) |
| 0.9 | 23.2 | GO:0015937 | coenzyme A biosynthetic process(GO:0015937) |
| 0.9 | 11.5 | GO:0035563 | positive regulation of chromatin binding(GO:0035563) |
| 0.9 | 50.3 | GO:1904837 | beta-catenin-TCF complex assembly(GO:1904837) |
| 0.8 | 2.5 | GO:0043553 | negative regulation of phosphatidylinositol 3-kinase activity(GO:0043553) negative regulation of autophagosome maturation(GO:1901097) |
| 0.8 | 9.8 | GO:1905098 | negative regulation of guanyl-nucleotide exchange factor activity(GO:1905098) |
| 0.8 | 1.6 | GO:0000965 | mitochondrial RNA 3'-end processing(GO:0000965) |
| 0.8 | 28.6 | GO:0006362 | transcription elongation from RNA polymerase I promoter(GO:0006362) termination of RNA polymerase I transcription(GO:0006363) |
| 0.8 | 7.5 | GO:0007096 | regulation of exit from mitosis(GO:0007096) |
| 0.7 | 5.2 | GO:0097577 | intracellular sequestering of iron ion(GO:0006880) sequestering of iron ion(GO:0097577) |
| 0.7 | 3.0 | GO:0030047 | actin modification(GO:0030047) |
| 0.7 | 9.5 | GO:0046149 | porphyrin-containing compound catabolic process(GO:0006787) tetrapyrrole catabolic process(GO:0033015) heme catabolic process(GO:0042167) pigment catabolic process(GO:0046149) |
| 0.7 | 3.6 | GO:0016240 | autophagosome docking(GO:0016240) |
| 0.7 | 11.9 | GO:0034453 | microtubule anchoring(GO:0034453) |
| 0.7 | 9.0 | GO:2000001 | regulation of DNA damage checkpoint(GO:2000001) |
| 0.7 | 2.0 | GO:0060762 | regulation of branching involved in mammary gland duct morphogenesis(GO:0060762) |
| 0.7 | 5.4 | GO:0043353 | enucleate erythrocyte differentiation(GO:0043353) |
| 0.7 | 36.5 | GO:0051439 | negative regulation of ubiquitin-protein ligase activity involved in mitotic cell cycle(GO:0051436) regulation of ubiquitin-protein ligase activity involved in mitotic cell cycle(GO:0051439) negative regulation of ubiquitin protein ligase activity(GO:1904667) |
| 0.7 | 10.5 | GO:0043485 | endosome to melanosome transport(GO:0035646) endosome to pigment granule transport(GO:0043485) pigment granule maturation(GO:0048757) |
| 0.6 | 7.1 | GO:2000271 | positive regulation of fibroblast apoptotic process(GO:2000271) |
| 0.6 | 27.5 | GO:0035329 | hippo signaling(GO:0035329) |
| 0.6 | 3.8 | GO:0042255 | ribosome assembly(GO:0042255) |
| 0.6 | 11.4 | GO:0099514 | anterograde synaptic vesicle transport(GO:0048490) synaptic vesicle cytoskeletal transport(GO:0099514) synaptic vesicle transport along microtubule(GO:0099517) |
| 0.6 | 15.1 | GO:0032402 | melanosome transport(GO:0032402) pigment granule transport(GO:0051904) |
| 0.6 | 31.2 | GO:0043277 | apoptotic cell clearance(GO:0043277) |
| 0.6 | 37.4 | GO:0008631 | intrinsic apoptotic signaling pathway in response to oxidative stress(GO:0008631) |
| 0.6 | 10.0 | GO:0034244 | negative regulation of transcription elongation from RNA polymerase II promoter(GO:0034244) |
| 0.6 | 11.7 | GO:0045723 | positive regulation of fatty acid biosynthetic process(GO:0045723) |
| 0.6 | 34.7 | GO:0060416 | response to growth hormone(GO:0060416) |
| 0.6 | 35.2 | GO:0006635 | fatty acid beta-oxidation(GO:0006635) |
| 0.6 | 2.2 | GO:0090283 | regulation of protein glycosylation in Golgi(GO:0090283) |
| 0.5 | 10.9 | GO:0006071 | glycerol metabolic process(GO:0006071) |
| 0.5 | 7.0 | GO:1904321 | response to forskolin(GO:1904321) cellular response to forskolin(GO:1904322) |
| 0.5 | 18.4 | GO:0043666 | regulation of phosphoprotein phosphatase activity(GO:0043666) |
| 0.5 | 13.9 | GO:0007567 | parturition(GO:0007567) |
| 0.5 | 26.6 | GO:0009250 | glycogen biosynthetic process(GO:0005978) glucan biosynthetic process(GO:0009250) |
| 0.5 | 6.6 | GO:0010839 | negative regulation of keratinocyte proliferation(GO:0010839) |
| 0.5 | 225.0 | GO:0008380 | RNA splicing(GO:0008380) |
| 0.5 | 2.5 | GO:0019509 | L-methionine biosynthetic process from methylthioadenosine(GO:0019509) |
| 0.5 | 32.7 | GO:0048207 | vesicle coating(GO:0006901) vesicle targeting, rough ER to cis-Golgi(GO:0048207) COPII vesicle coating(GO:0048208) |
| 0.5 | 51.5 | GO:0007030 | Golgi organization(GO:0007030) |
| 0.5 | 9.1 | GO:0003334 | keratinocyte development(GO:0003334) |
| 0.5 | 3.8 | GO:0072656 | maintenance of protein location in mitochondrion(GO:0072656) |
| 0.5 | 1.4 | GO:0061419 | positive regulation of transcription from RNA polymerase II promoter in response to hypoxia(GO:0061419) |
| 0.5 | 3.8 | GO:0006686 | sphingomyelin biosynthetic process(GO:0006686) |
| 0.5 | 11.1 | GO:0006221 | pyrimidine nucleotide biosynthetic process(GO:0006221) |
| 0.5 | 18.6 | GO:2001244 | positive regulation of intrinsic apoptotic signaling pathway(GO:2001244) |
| 0.4 | 7.6 | GO:0031935 | regulation of chromatin silencing(GO:0031935) |
| 0.4 | 32.6 | GO:0045071 | negative regulation of viral genome replication(GO:0045071) |
| 0.4 | 12.2 | GO:0060325 | face morphogenesis(GO:0060325) |
| 0.4 | 14.6 | GO:0010738 | regulation of protein kinase A signaling(GO:0010738) |
| 0.4 | 0.8 | GO:0015917 | aminophospholipid transport(GO:0015917) |
| 0.4 | 5.2 | GO:0043174 | pyrimidine-containing compound salvage(GO:0008655) pyrimidine nucleoside salvage(GO:0043097) nucleoside salvage(GO:0043174) |
| 0.4 | 9.0 | GO:0045815 | positive regulation of gene expression, epigenetic(GO:0045815) |
| 0.4 | 6.2 | GO:0070071 | proton-transporting V-type ATPase complex assembly(GO:0070070) proton-transporting two-sector ATPase complex assembly(GO:0070071) vacuolar proton-transporting V-type ATPase complex assembly(GO:0070072) |
| 0.4 | 19.9 | GO:0000079 | regulation of cyclin-dependent protein serine/threonine kinase activity(GO:0000079) |
| 0.4 | 2.2 | GO:0010890 | positive regulation of sequestering of triglyceride(GO:0010890) |
| 0.4 | 18.9 | GO:0043171 | peptide catabolic process(GO:0043171) |
| 0.4 | 7.2 | GO:1902230 | regulation of intrinsic apoptotic signaling pathway in response to DNA damage(GO:1902229) negative regulation of intrinsic apoptotic signaling pathway in response to DNA damage(GO:1902230) |
| 0.4 | 3.2 | GO:0071157 | negative regulation of cell cycle arrest(GO:0071157) |
| 0.3 | 29.5 | GO:0007098 | centrosome cycle(GO:0007098) |
| 0.3 | 1.0 | GO:0042137 | sequestering of neurotransmitter(GO:0042137) |
| 0.3 | 7.1 | GO:0060236 | regulation of mitotic spindle organization(GO:0060236) |
| 0.3 | 5.4 | GO:0097264 | self proteolysis(GO:0097264) |
| 0.3 | 1.8 | GO:0051012 | microtubule sliding(GO:0051012) |
| 0.3 | 23.0 | GO:0018410 | C-terminal protein amino acid modification(GO:0018410) |
| 0.3 | 6.8 | GO:0071498 | cellular response to fluid shear stress(GO:0071498) |
| 0.3 | 22.6 | GO:0006397 | mRNA processing(GO:0006397) |
| 0.3 | 20.7 | GO:1902653 | cholesterol biosynthetic process(GO:0006695) secondary alcohol biosynthetic process(GO:1902653) |
| 0.2 | 3.7 | GO:0000052 | citrulline metabolic process(GO:0000052) |
| 0.2 | 6.9 | GO:0031581 | hemidesmosome assembly(GO:0031581) |
| 0.2 | 0.7 | GO:0070681 | glutaminyl-tRNAGln biosynthesis via transamidation(GO:0070681) |
| 0.2 | 4.9 | GO:0046339 | diacylglycerol metabolic process(GO:0046339) |
| 0.2 | 0.8 | GO:0050861 | positive regulation of B cell receptor signaling pathway(GO:0050861) |
| 0.2 | 9.5 | GO:0006893 | Golgi to plasma membrane transport(GO:0006893) |
| 0.2 | 5.3 | GO:2000401 | regulation of lymphocyte migration(GO:2000401) |
| 0.2 | 11.6 | GO:0007157 | heterophilic cell-cell adhesion via plasma membrane cell adhesion molecules(GO:0007157) |
| 0.2 | 4.0 | GO:0002755 | MyD88-dependent toll-like receptor signaling pathway(GO:0002755) |
| 0.2 | 13.9 | GO:0045727 | positive regulation of translation(GO:0045727) |
| 0.2 | 1.5 | GO:0097084 | vascular smooth muscle cell development(GO:0097084) |
| 0.2 | 3.4 | GO:0000462 | maturation of SSU-rRNA from tricistronic rRNA transcript (SSU-rRNA, 5.8S rRNA, LSU-rRNA)(GO:0000462) |
| 0.2 | 1.9 | GO:1904776 | regulation of protein localization to cell cortex(GO:1904776) positive regulation of protein localization to cell cortex(GO:1904778) |
| 0.2 | 4.5 | GO:0006308 | DNA catabolic process(GO:0006308) |
| 0.1 | 7.4 | GO:0046513 | ceramide biosynthetic process(GO:0046513) |
| 0.1 | 9.2 | GO:0000186 | activation of MAPKK activity(GO:0000186) |
| 0.1 | 5.8 | GO:0006611 | protein export from nucleus(GO:0006611) |
| 0.1 | 1.4 | GO:0070986 | left/right axis specification(GO:0070986) |
| 0.1 | 1.5 | GO:0060334 | regulation of interferon-gamma-mediated signaling pathway(GO:0060334) |
| 0.1 | 3.1 | GO:0045746 | negative regulation of Notch signaling pathway(GO:0045746) |
| 0.1 | 1.3 | GO:0002115 | store-operated calcium entry(GO:0002115) |
| 0.1 | 11.2 | GO:0048659 | smooth muscle cell proliferation(GO:0048659) |
| 0.1 | 2.8 | GO:0014037 | Schwann cell differentiation(GO:0014037) |
| 0.1 | 0.3 | GO:0046015 | regulation of transcription by glucose(GO:0046015) |
| 0.1 | 5.8 | GO:0006487 | protein N-linked glycosylation(GO:0006487) |
| 0.1 | 7.3 | GO:0070268 | cornification(GO:0070268) |
| 0.1 | 5.3 | GO:0043647 | inositol phosphate metabolic process(GO:0043647) |
| 0.1 | 0.5 | GO:0051310 | metaphase plate congression(GO:0051310) |
| 0.0 | 0.7 | GO:0045475 | locomotor rhythm(GO:0045475) |
| 0.0 | 0.9 | GO:0031113 | regulation of microtubule polymerization(GO:0031113) |
| 0.0 | 10.8 | GO:0007266 | Rho protein signal transduction(GO:0007266) |
| 0.0 | 3.5 | GO:0006911 | phagocytosis, engulfment(GO:0006911) |
| 0.0 | 2.5 | GO:0002504 | antigen processing and presentation of peptide antigen via MHC class II(GO:0002495) antigen processing and presentation of peptide or polysaccharide antigen via MHC class II(GO:0002504) antigen processing and presentation of exogenous peptide antigen via MHC class II(GO:0019886) |
| 0.0 | 4.9 | GO:0006939 | smooth muscle contraction(GO:0006939) |
| 0.0 | 2.1 | GO:0051289 | protein homotetramerization(GO:0051289) |
| 0.0 | 0.5 | GO:0090200 | positive regulation of release of cytochrome c from mitochondria(GO:0090200) |
| 0.0 | 0.4 | GO:0072678 | T cell migration(GO:0072678) |
| 0.0 | 1.2 | GO:0051149 | positive regulation of muscle cell differentiation(GO:0051149) |
| 0.0 | 3.6 | GO:0051301 | cell division(GO:0051301) |
Gene overrepresentation in cellular component category:
| Log-likelihood per target | Total log-likelihood | Term | Description |
|---|---|---|---|
| 32.9 | 131.5 | GO:1990423 | RZZ complex(GO:1990423) |
| 27.7 | 110.9 | GO:0005971 | ribonucleoside-diphosphate reductase complex(GO:0005971) |
| 27.6 | 82.7 | GO:0036284 | tubulobulbar complex(GO:0036284) |
| 22.8 | 182.5 | GO:0000796 | condensin complex(GO:0000796) |
| 17.7 | 141.7 | GO:1905202 | 3-methylcrotonyl-CoA carboxylase complex, mitochondrial(GO:0002169) methylcrotonoyl-CoA carboxylase complex(GO:1905202) |
| 15.7 | 94.5 | GO:0031390 | Ctf18 RFC-like complex(GO:0031390) |
| 15.4 | 46.1 | GO:0030689 | Noc complex(GO:0030689) |
| 14.4 | 129.6 | GO:0002193 | MAML1-RBP-Jkappa- ICN1 complex(GO:0002193) |
| 13.0 | 78.0 | GO:0071256 | Sec61 translocon complex(GO:0005784) translocon complex(GO:0071256) |
| 12.7 | 89.0 | GO:0005683 | U7 snRNP(GO:0005683) |
| 12.1 | 157.6 | GO:0002199 | zona pellucida receptor complex(GO:0002199) |
| 11.8 | 94.6 | GO:0032541 | cortical endoplasmic reticulum(GO:0032541) |
| 11.0 | 44.1 | GO:1990246 | uniplex complex(GO:1990246) |
| 10.8 | 32.5 | GO:0034455 | t-UTP complex(GO:0034455) |
| 8.7 | 112.7 | GO:0005688 | U6 snRNP(GO:0005688) |
| 8.1 | 40.3 | GO:0098837 | postsynaptic recycling endosome(GO:0098837) |
| 6.7 | 40.3 | GO:0000172 | ribonuclease MRP complex(GO:0000172) |
| 6.6 | 72.4 | GO:0000940 | condensed chromosome outer kinetochore(GO:0000940) |
| 6.5 | 188.3 | GO:0005680 | anaphase-promoting complex(GO:0005680) |
| 6.5 | 64.9 | GO:0034709 | methylosome(GO:0034709) |
| 6.2 | 61.8 | GO:0044754 | autolysosome(GO:0044754) |
| 5.7 | 17.1 | GO:0034677 | integrin alpha7-beta1 complex(GO:0034677) |
| 5.5 | 49.9 | GO:0031414 | N-terminal protein acetyltransferase complex(GO:0031414) |
| 5.5 | 154.8 | GO:0005763 | organellar small ribosomal subunit(GO:0000314) mitochondrial small ribosomal subunit(GO:0005763) |
| 5.3 | 84.2 | GO:0008540 | proteasome regulatory particle, base subcomplex(GO:0008540) |
| 5.3 | 84.2 | GO:0031080 | nuclear pore outer ring(GO:0031080) |
| 5.0 | 353.5 | GO:0022627 | cytosolic small ribosomal subunit(GO:0022627) |
| 4.8 | 14.5 | GO:0055087 | Ski complex(GO:0055087) |
| 4.8 | 43.4 | GO:0031298 | replication fork protection complex(GO:0031298) |
| 4.7 | 137.5 | GO:0031304 | intrinsic component of mitochondrial inner membrane(GO:0031304) integral component of mitochondrial inner membrane(GO:0031305) |
| 4.5 | 102.6 | GO:0046930 | pore complex(GO:0046930) |
| 4.3 | 81.9 | GO:0005671 | Ada2/Gcn5/Ada3 transcription activator complex(GO:0005671) |
| 4.0 | 44.0 | GO:0044666 | MLL3/4 complex(GO:0044666) |
| 3.9 | 15.5 | GO:0071986 | Ragulator complex(GO:0071986) |
| 3.6 | 148.1 | GO:0016592 | mediator complex(GO:0016592) |
| 3.5 | 24.5 | GO:0016589 | NURF complex(GO:0016589) |
| 3.3 | 30.0 | GO:0071204 | histone pre-mRNA 3'end processing complex(GO:0071204) |
| 3.3 | 23.2 | GO:0000788 | nuclear nucleosome(GO:0000788) |
| 3.3 | 9.8 | GO:0005850 | eukaryotic translation initiation factor 2 complex(GO:0005850) |
| 3.2 | 35.5 | GO:0072357 | PTW/PP1 phosphatase complex(GO:0072357) |
| 3.2 | 89.5 | GO:0035145 | exon-exon junction complex(GO:0035145) |
| 3.2 | 50.6 | GO:0045277 | respiratory chain complex IV(GO:0045277) |
| 3.1 | 21.7 | GO:0016272 | prefoldin complex(GO:0016272) |
| 3.0 | 12.2 | GO:0097057 | TRAF2-GSTP1 complex(GO:0097057) |
| 3.0 | 18.2 | GO:0000444 | MIS12/MIND type complex(GO:0000444) |
| 3.0 | 38.4 | GO:0000164 | protein phosphatase type 1 complex(GO:0000164) |
| 2.9 | 11.8 | GO:0032937 | SREBP-SCAP-Insig complex(GO:0032937) |
| 2.9 | 55.4 | GO:0005641 | nuclear envelope lumen(GO:0005641) |
| 2.9 | 306.5 | GO:0022625 | cytosolic large ribosomal subunit(GO:0022625) |
| 2.8 | 22.1 | GO:0000974 | Prp19 complex(GO:0000974) |
| 2.7 | 288.9 | GO:0005643 | nuclear pore(GO:0005643) |
| 2.7 | 16.1 | GO:1990131 | EGO complex(GO:0034448) Gtr1-Gtr2 GTPase complex(GO:1990131) |
| 2.7 | 26.7 | GO:0045275 | mitochondrial respiratory chain complex III(GO:0005750) respiratory chain complex III(GO:0045275) |
| 2.7 | 61.3 | GO:0005666 | DNA-directed RNA polymerase III complex(GO:0005666) |
| 2.6 | 44.0 | GO:0033276 | transcription factor TFTC complex(GO:0033276) |
| 2.6 | 25.6 | GO:0097550 | transcriptional preinitiation complex(GO:0097550) |
| 2.6 | 10.2 | GO:0042765 | GPI-anchor transamidase complex(GO:0042765) |
| 2.5 | 42.3 | GO:0031616 | spindle pole centrosome(GO:0031616) |
| 2.5 | 282.8 | GO:0005840 | ribosome(GO:0005840) |
| 2.2 | 72.0 | GO:0016581 | NuRD complex(GO:0016581) CHD-type complex(GO:0090545) |
| 2.2 | 30.5 | GO:0019774 | proteasome core complex, beta-subunit complex(GO:0019774) |
| 2.2 | 28.3 | GO:0000176 | nuclear exosome (RNase complex)(GO:0000176) |
| 2.0 | 43.5 | GO:0036020 | endolysosome membrane(GO:0036020) |
| 1.9 | 19.2 | GO:0005869 | dynactin complex(GO:0005869) |
| 1.9 | 15.2 | GO:0000931 | gamma-tubulin large complex(GO:0000931) gamma-tubulin ring complex(GO:0008274) |
| 1.9 | 64.4 | GO:0016327 | apicolateral plasma membrane(GO:0016327) |
| 1.9 | 66.3 | GO:0000421 | autophagosome membrane(GO:0000421) |
| 1.9 | 7.4 | GO:0031211 | serine C-palmitoyltransferase complex(GO:0017059) endoplasmic reticulum palmitoyltransferase complex(GO:0031211) |
| 1.8 | 47.6 | GO:0030867 | rough endoplasmic reticulum membrane(GO:0030867) |
| 1.8 | 54.5 | GO:0005790 | smooth endoplasmic reticulum(GO:0005790) |
| 1.8 | 7.2 | GO:0020016 | ciliary pocket(GO:0020016) ciliary pocket membrane(GO:0020018) |
| 1.8 | 5.4 | GO:0034657 | GID complex(GO:0034657) |
| 1.7 | 19.1 | GO:0005853 | eukaryotic translation elongation factor 1 complex(GO:0005853) |
| 1.7 | 91.2 | GO:0019005 | SCF ubiquitin ligase complex(GO:0019005) |
| 1.7 | 8.6 | GO:0036396 | MIS complex(GO:0036396) mRNA editing complex(GO:0045293) |
| 1.7 | 31.4 | GO:0031011 | Ino80 complex(GO:0031011) DNA helicase complex(GO:0033202) |
| 1.7 | 18.2 | GO:0035692 | macrophage migration inhibitory factor receptor complex(GO:0035692) |
| 1.6 | 9.7 | GO:0031466 | Cul5-RING ubiquitin ligase complex(GO:0031466) |
| 1.6 | 17.7 | GO:0008385 | IkappaB kinase complex(GO:0008385) |
| 1.6 | 74.4 | GO:0031941 | filamentous actin(GO:0031941) |
| 1.6 | 4.7 | GO:0005726 | perichromatin fibrils(GO:0005726) |
| 1.5 | 97.9 | GO:0015030 | Cajal body(GO:0015030) |
| 1.4 | 68.8 | GO:0009295 | nucleoid(GO:0009295) mitochondrial nucleoid(GO:0042645) |
| 1.4 | 10.0 | GO:0032021 | NELF complex(GO:0032021) |
| 1.4 | 16.8 | GO:0005689 | U12-type spliceosomal complex(GO:0005689) |
| 1.4 | 200.5 | GO:0000922 | spindle pole(GO:0000922) |
| 1.4 | 101.6 | GO:0005637 | nuclear inner membrane(GO:0005637) |
| 1.3 | 26.6 | GO:1904813 | ficolin-1-rich granule(GO:0101002) ficolin-1-rich granule lumen(GO:1904813) |
| 1.3 | 17.2 | GO:0060077 | inhibitory synapse(GO:0060077) |
| 1.3 | 15.5 | GO:0016602 | CCAAT-binding factor complex(GO:0016602) |
| 1.3 | 10.3 | GO:0070937 | CRD-mediated mRNA stability complex(GO:0070937) |
| 1.2 | 6.2 | GO:0043291 | RAVE complex(GO:0043291) |
| 1.2 | 62.9 | GO:0002102 | podosome(GO:0002102) |
| 1.2 | 62.5 | GO:0008180 | COP9 signalosome(GO:0008180) |
| 1.2 | 17.9 | GO:0005662 | DNA replication factor A complex(GO:0005662) |
| 1.2 | 14.3 | GO:0030008 | TRAPP complex(GO:0030008) |
| 1.2 | 37.6 | GO:0005844 | polysome(GO:0005844) |
| 1.2 | 10.4 | GO:0000780 | condensed nuclear chromosome, centromeric region(GO:0000780) |
| 1.1 | 2.2 | GO:0030532 | small nuclear ribonucleoprotein complex(GO:0030532) |
| 1.1 | 35.1 | GO:0030687 | preribosome, large subunit precursor(GO:0030687) |
| 1.1 | 29.5 | GO:0005791 | rough endoplasmic reticulum(GO:0005791) |
| 1.0 | 11.5 | GO:0097470 | ribbon synapse(GO:0097470) |
| 1.0 | 8.2 | GO:0070187 | telosome(GO:0070187) |
| 1.0 | 8.1 | GO:0097443 | sorting endosome(GO:0097443) |
| 1.0 | 47.5 | GO:0043034 | costamere(GO:0043034) |
| 1.0 | 4.8 | GO:0000124 | SAGA complex(GO:0000124) |
| 1.0 | 3.8 | GO:0030688 | preribosome, small subunit precursor(GO:0030688) |
| 1.0 | 31.4 | GO:0016514 | SWI/SNF complex(GO:0016514) |
| 0.9 | 90.4 | GO:0031970 | mitochondrial intermembrane space(GO:0005758) organelle envelope lumen(GO:0031970) |
| 0.9 | 83.2 | GO:0033116 | endoplasmic reticulum-Golgi intermediate compartment membrane(GO:0033116) |
| 0.9 | 152.8 | GO:0048770 | melanosome(GO:0042470) pigment granule(GO:0048770) |
| 0.9 | 10.7 | GO:0000815 | ESCRT III complex(GO:0000815) |
| 0.9 | 2.7 | GO:0031905 | early endosome lumen(GO:0031905) |
| 0.9 | 6.1 | GO:0019907 | cyclin-dependent protein kinase activating kinase holoenzyme complex(GO:0019907) |
| 0.8 | 361.7 | GO:0016607 | nuclear speck(GO:0016607) |
| 0.8 | 11.4 | GO:0030123 | AP-3 adaptor complex(GO:0030123) |
| 0.8 | 28.6 | GO:0034451 | centriolar satellite(GO:0034451) |
| 0.8 | 87.3 | GO:0035578 | azurophil granule lumen(GO:0035578) |
| 0.8 | 41.7 | GO:0010494 | cytoplasmic stress granule(GO:0010494) |
| 0.7 | 89.7 | GO:0030176 | integral component of endoplasmic reticulum membrane(GO:0030176) |
| 0.7 | 25.5 | GO:0032420 | stereocilium(GO:0032420) |
| 0.7 | 1.4 | GO:0005797 | Golgi medial cisterna(GO:0005797) |
| 0.7 | 191.5 | GO:0019866 | mitochondrial inner membrane(GO:0005743) organelle inner membrane(GO:0019866) |
| 0.6 | 5.8 | GO:0008250 | oligosaccharyltransferase complex(GO:0008250) |
| 0.6 | 278.9 | GO:0010008 | endosome membrane(GO:0010008) |
| 0.6 | 13.9 | GO:1904724 | tertiary granule lumen(GO:1904724) |
| 0.6 | 6.6 | GO:1990712 | HFE-transferrin receptor complex(GO:1990712) |
| 0.5 | 13.4 | GO:0031526 | brush border membrane(GO:0031526) |
| 0.5 | 47.7 | GO:0000784 | nuclear chromosome, telomeric region(GO:0000784) |
| 0.5 | 34.3 | GO:0005814 | centriole(GO:0005814) |
| 0.4 | 41.1 | GO:0005681 | spliceosomal complex(GO:0005681) |
| 0.4 | 0.9 | GO:0060091 | kinocilium(GO:0060091) kinociliary basal body(GO:1902636) |
| 0.4 | 34.9 | GO:0031903 | peroxisomal membrane(GO:0005778) microbody membrane(GO:0031903) |
| 0.4 | 32.7 | GO:0030864 | cortical actin cytoskeleton(GO:0030864) |
| 0.4 | 5.2 | GO:0045254 | pyruvate dehydrogenase complex(GO:0045254) |
| 0.4 | 7.1 | GO:0097025 | MPP7-DLG1-LIN7 complex(GO:0097025) |
| 0.3 | 13.5 | GO:0000779 | condensed chromosome, centromeric region(GO:0000779) |
| 0.3 | 49.2 | GO:0005819 | spindle(GO:0005819) |
| 0.3 | 81.8 | GO:0005759 | mitochondrial matrix(GO:0005759) |
| 0.3 | 1.3 | GO:0030897 | HOPS complex(GO:0030897) |
| 0.2 | 1.0 | GO:0070083 | clathrin-sculpted monoamine transport vesicle(GO:0070081) clathrin-sculpted monoamine transport vesicle membrane(GO:0070083) |
| 0.2 | 16.6 | GO:0016363 | nuclear matrix(GO:0016363) |
| 0.2 | 0.7 | GO:0030956 | glutamyl-tRNA(Gln) amidotransferase complex(GO:0030956) |
| 0.2 | 0.9 | GO:0034274 | Atg12-Atg5-Atg16 complex(GO:0034274) |
| 0.2 | 1.4 | GO:0002116 | semaphorin receptor complex(GO:0002116) |
| 0.2 | 8.0 | GO:0031201 | SNARE complex(GO:0031201) |
| 0.2 | 10.5 | GO:0016328 | lateral plasma membrane(GO:0016328) |
| 0.2 | 1.5 | GO:0016011 | dystroglycan complex(GO:0016011) sarcoglycan complex(GO:0016012) |
| 0.2 | 31.7 | GO:0000151 | ubiquitin ligase complex(GO:0000151) |
| 0.2 | 16.5 | GO:0031093 | platelet alpha granule lumen(GO:0031093) |
| 0.1 | 7.8 | GO:0097517 | stress fiber(GO:0001725) contractile actin filament bundle(GO:0097517) |
| 0.1 | 13.3 | GO:0005795 | Golgi stack(GO:0005795) |
| 0.1 | 3.4 | GO:0000159 | protein phosphatase type 2A complex(GO:0000159) |
| 0.1 | 1.8 | GO:0044447 | axoneme part(GO:0044447) |
| 0.1 | 8.3 | GO:0005913 | cell-cell adherens junction(GO:0005913) |
| 0.1 | 2.4 | GO:0097228 | sperm principal piece(GO:0097228) |
| 0.1 | 4.5 | GO:0035580 | specific granule lumen(GO:0035580) |
| 0.1 | 7.0 | GO:0005882 | intermediate filament(GO:0005882) |
| 0.1 | 2.9 | GO:0005811 | lipid particle(GO:0005811) |
| 0.1 | 31.0 | GO:0048471 | perinuclear region of cytoplasm(GO:0048471) |
| 0.0 | 2.5 | GO:0005770 | late endosome(GO:0005770) |
| 0.0 | 6.7 | GO:0009898 | cytoplasmic side of plasma membrane(GO:0009898) |
| 0.0 | 35.7 | GO:0070062 | extracellular exosome(GO:0070062) |
Gene overrepresentation in molecular function category:
| Log-likelihood per target | Total log-likelihood | Term | Description |
|---|---|---|---|
| 52.0 | 156.1 | GO:0015140 | malate transmembrane transporter activity(GO:0015140) |
| 27.7 | 110.9 | GO:0004748 | ribonucleoside-diphosphate reductase activity, thioredoxin disulfide as acceptor(GO:0004748) oxidoreductase activity, acting on CH or CH2 groups, disulfide as acceptor(GO:0016728) ribonucleoside-diphosphate reductase activity(GO:0061731) |
| 26.9 | 188.3 | GO:0010997 | anaphase-promoting complex binding(GO:0010997) |
| 22.0 | 44.0 | GO:0061628 | H3K27me3 modified histone binding(GO:0061628) |
| 21.2 | 63.5 | GO:0003978 | UDP-N-acetylglucosamine 4-epimerase activity(GO:0003974) UDP-glucose 4-epimerase activity(GO:0003978) |
| 20.9 | 62.7 | GO:0000247 | C-8 sterol isomerase activity(GO:0000247) |
| 20.4 | 163.5 | GO:0008379 | thioredoxin peroxidase activity(GO:0008379) |
| 19.1 | 76.3 | GO:0043273 | CTPase activity(GO:0043273) |
| 18.1 | 72.4 | GO:0043515 | kinetochore binding(GO:0043515) |
| 17.7 | 141.7 | GO:0004485 | methylcrotonoyl-CoA carboxylase activity(GO:0004485) |
| 16.4 | 49.2 | GO:0004597 | peptide-aspartate beta-dioxygenase activity(GO:0004597) |
| 16.4 | 98.3 | GO:0043023 | ribosomal large subunit binding(GO:0043023) |
| 16.2 | 129.3 | GO:0050733 | RS domain binding(GO:0050733) |
| 14.8 | 59.2 | GO:0008311 | double-stranded DNA 3'-5' exodeoxyribonuclease activity(GO:0008311) |
| 14.7 | 146.8 | GO:0055104 | ligase inhibitor activity(GO:0055104) ubiquitin ligase inhibitor activity(GO:1990948) |
| 13.5 | 94.5 | GO:0003689 | DNA clamp loader activity(GO:0003689) protein-DNA loading ATPase activity(GO:0033170) |
| 13.1 | 105.1 | GO:0015288 | porin activity(GO:0015288) |
| 12.9 | 606.4 | GO:0061631 | ubiquitin conjugating enzyme activity(GO:0061631) |
| 12.0 | 132.4 | GO:0051525 | NFAT protein binding(GO:0051525) |
| 11.9 | 47.6 | GO:0033823 | procollagen-lysine 5-dioxygenase activity(GO:0008475) procollagen glucosyltransferase activity(GO:0033823) |
| 11.7 | 93.5 | GO:0050833 | pyruvate transmembrane transporter activity(GO:0050833) |
| 10.6 | 53.0 | GO:0051998 | carboxyl-O-methyltransferase activity(GO:0010340) protein carboxyl O-methyltransferase activity(GO:0051998) |
| 8.7 | 43.5 | GO:0051731 | polynucleotide 5'-hydroxyl-kinase activity(GO:0051731) |
| 8.1 | 129.6 | GO:0000150 | recombinase activity(GO:0000150) |
| 7.8 | 46.9 | GO:0061575 | cyclin-dependent protein serine/threonine kinase activator activity(GO:0061575) |
| 7.6 | 52.9 | GO:0035368 | selenocysteine insertion sequence binding(GO:0035368) |
| 7.5 | 30.0 | GO:0071208 | histone pre-mRNA DCP binding(GO:0071208) |
| 7.4 | 44.2 | GO:0036033 | mediator complex binding(GO:0036033) |
| 7.2 | 7.2 | GO:0071987 | WD40-repeat domain binding(GO:0071987) |
| 7.2 | 28.9 | GO:0004477 | methenyltetrahydrofolate cyclohydrolase activity(GO:0004477) methylenetetrahydrofolate dehydrogenase (NAD+) activity(GO:0004487) methylenetetrahydrofolate dehydrogenase (NADP+) activity(GO:0004488) |
| 6.7 | 80.7 | GO:0016174 | NAD(P)H oxidase activity(GO:0016174) |
| 6.5 | 38.7 | GO:0004013 | adenosylhomocysteinase activity(GO:0004013) trialkylsulfonium hydrolase activity(GO:0016802) |
| 6.4 | 44.7 | GO:0008079 | translation release factor activity(GO:0003747) translation termination factor activity(GO:0008079) |
| 6.3 | 81.3 | GO:0031681 | G-protein beta-subunit binding(GO:0031681) |
| 5.9 | 17.7 | GO:0008384 | IkappaB kinase activity(GO:0008384) |
| 5.8 | 80.8 | GO:0005172 | vascular endothelial growth factor receptor binding(GO:0005172) |
| 5.5 | 16.4 | GO:0004307 | ethanolaminephosphotransferase activity(GO:0004307) |
| 5.4 | 59.1 | GO:0004300 | enoyl-CoA hydratase activity(GO:0004300) |
| 5.1 | 20.4 | GO:0003990 | acetylcholinesterase activity(GO:0003990) choline binding(GO:0033265) |
| 5.1 | 147.3 | GO:0004129 | cytochrome-c oxidase activity(GO:0004129) heme-copper terminal oxidase activity(GO:0015002) oxidoreductase activity, acting on a heme group of donors, oxygen as acceptor(GO:0016676) |
| 5.0 | 14.9 | GO:0004045 | aminoacyl-tRNA hydrolase activity(GO:0004045) |
| 5.0 | 29.8 | GO:0017150 | tRNA dihydrouridine synthase activity(GO:0017150) |
| 4.8 | 14.3 | GO:0008169 | C-methyltransferase activity(GO:0008169) |
| 4.7 | 14.2 | GO:0016838 | carbon-oxygen lyase activity, acting on phosphates(GO:0016838) |
| 4.3 | 8.6 | GO:0016422 | mRNA (2'-O-methyladenosine-N6-)-methyltransferase activity(GO:0016422) |
| 4.1 | 12.2 | GO:0035730 | S-nitrosoglutathione binding(GO:0035730) dinitrosyl-iron complex binding(GO:0035731) |
| 4.0 | 32.2 | GO:0015450 | P-P-bond-hydrolysis-driven protein transmembrane transporter activity(GO:0015450) |
| 4.0 | 183.7 | GO:0008139 | nuclear localization sequence binding(GO:0008139) |
| 3.9 | 47.2 | GO:1990825 | sequence-specific mRNA binding(GO:1990825) |
| 3.8 | 109.9 | GO:0005487 | nucleocytoplasmic transporter activity(GO:0005487) |
| 3.7 | 55.1 | GO:0016273 | arginine N-methyltransferase activity(GO:0016273) protein-arginine N-methyltransferase activity(GO:0016274) |
| 3.4 | 17.2 | GO:0005105 | type 1 fibroblast growth factor receptor binding(GO:0005105) |
| 3.4 | 30.9 | GO:0019136 | deoxynucleoside kinase activity(GO:0019136) |
| 3.3 | 26.6 | GO:0090599 | alpha-glucosidase activity(GO:0090599) |
| 3.3 | 16.4 | GO:0061649 | ubiquitinated histone binding(GO:0061649) |
| 3.2 | 16.1 | GO:0004066 | asparagine synthase (glutamine-hydrolyzing) activity(GO:0004066) |
| 3.2 | 667.3 | GO:0003735 | structural constituent of ribosome(GO:0003735) |
| 3.2 | 9.6 | GO:0008523 | sodium-dependent multivitamin transmembrane transporter activity(GO:0008523) |
| 2.9 | 14.7 | GO:0004140 | dephospho-CoA kinase activity(GO:0004140) |
| 2.9 | 11.7 | GO:0032422 | purine-rich negative regulatory element binding(GO:0032422) |
| 2.9 | 61.3 | GO:0001056 | RNA polymerase III activity(GO:0001056) |
| 2.9 | 40.7 | GO:0008253 | 5'-nucleotidase activity(GO:0008253) |
| 2.9 | 8.6 | GO:0005136 | interleukin-4 receptor binding(GO:0005136) |
| 2.7 | 64.4 | GO:0042813 | Wnt-activated receptor activity(GO:0042813) |
| 2.7 | 37.3 | GO:0004596 | peptide alpha-N-acetyltransferase activity(GO:0004596) |
| 2.6 | 10.2 | GO:0003923 | GPI-anchor transamidase activity(GO:0003923) |
| 2.5 | 63.1 | GO:0070628 | proteasome binding(GO:0070628) |
| 2.5 | 22.7 | GO:1990247 | N6-methyladenosine-containing RNA binding(GO:1990247) |
| 2.5 | 140.1 | GO:0043022 | ribosome binding(GO:0043022) |
| 2.5 | 7.4 | GO:0004758 | serine C-palmitoyltransferase activity(GO:0004758) C-palmitoyltransferase activity(GO:0016454) |
| 2.4 | 29.0 | GO:0004526 | ribonuclease P activity(GO:0004526) |
| 2.4 | 79.6 | GO:0016538 | cyclin-dependent protein serine/threonine kinase regulator activity(GO:0016538) |
| 2.4 | 9.5 | GO:0004074 | biliverdin reductase activity(GO:0004074) |
| 2.3 | 81.3 | GO:0044183 | protein binding involved in protein folding(GO:0044183) |
| 2.3 | 13.8 | GO:0042392 | sphingosine-1-phosphate phosphatase activity(GO:0042392) |
| 2.2 | 28.8 | GO:0017070 | U6 snRNA binding(GO:0017070) |
| 2.2 | 8.8 | GO:0070644 | vitamin D response element binding(GO:0070644) |
| 2.2 | 21.7 | GO:0004064 | arylesterase activity(GO:0004064) |
| 2.1 | 10.5 | GO:0047179 | platelet-activating factor acetyltransferase activity(GO:0047179) |
| 2.0 | 12.0 | GO:0008381 | mechanically-gated ion channel activity(GO:0008381) mechanically gated channel activity(GO:0022833) |
| 2.0 | 59.3 | GO:0042288 | MHC class I protein binding(GO:0042288) |
| 2.0 | 25.5 | GO:0004726 | non-membrane spanning protein tyrosine phosphatase activity(GO:0004726) |
| 2.0 | 5.9 | GO:0070039 | rRNA (guanosine-2'-O-)-methyltransferase activity(GO:0070039) |
| 1.9 | 40.6 | GO:0051537 | 2 iron, 2 sulfur cluster binding(GO:0051537) |
| 1.9 | 17.1 | GO:0019960 | C-X3-C chemokine binding(GO:0019960) |
| 1.9 | 43.5 | GO:0098748 | clathrin adaptor activity(GO:0035615) endocytic adaptor activity(GO:0098748) |
| 1.9 | 9.4 | GO:0048039 | ubiquinone binding(GO:0048039) |
| 1.8 | 9.0 | GO:0097322 | 7SK snRNA binding(GO:0097322) |
| 1.8 | 7.1 | GO:0047192 | 1-alkylglycerophosphocholine O-acetyltransferase activity(GO:0047192) |
| 1.8 | 14.2 | GO:0004523 | RNA-DNA hybrid ribonuclease activity(GO:0004523) |
| 1.8 | 17.7 | GO:0001135 | transcription factor activity, RNA polymerase II transcription factor recruiting(GO:0001135) |
| 1.7 | 10.4 | GO:0019237 | centromeric DNA binding(GO:0019237) |
| 1.7 | 30.8 | GO:0042800 | histone methyltransferase activity (H3-K4 specific)(GO:0042800) |
| 1.7 | 33.6 | GO:0000400 | four-way junction DNA binding(GO:0000400) |
| 1.6 | 11.5 | GO:0030267 | hydroxypyruvate reductase activity(GO:0016618) glyoxylate reductase (NADP) activity(GO:0030267) |
| 1.6 | 31.2 | GO:0003756 | protein disulfide isomerase activity(GO:0003756) intramolecular oxidoreductase activity, transposing S-S bonds(GO:0016864) |
| 1.5 | 40.3 | GO:0031489 | myosin V binding(GO:0031489) |
| 1.5 | 7.7 | GO:0004966 | galanin receptor activity(GO:0004966) |
| 1.5 | 41.3 | GO:0051059 | NF-kappaB binding(GO:0051059) |
| 1.5 | 4.5 | GO:0008192 | RNA guanylyltransferase activity(GO:0008192) |
| 1.5 | 19.6 | GO:0043014 | alpha-tubulin binding(GO:0043014) |
| 1.5 | 47.2 | GO:0030515 | snoRNA binding(GO:0030515) |
| 1.4 | 7.1 | GO:0097016 | L27 domain binding(GO:0097016) |
| 1.4 | 8.2 | GO:0071532 | ankyrin repeat binding(GO:0071532) |
| 1.4 | 5.5 | GO:0004906 | interferon-gamma receptor activity(GO:0004906) |
| 1.3 | 90.9 | GO:0009055 | electron carrier activity(GO:0009055) |
| 1.3 | 5.2 | GO:0004739 | pyruvate dehydrogenase (acetyl-transferring) activity(GO:0004739) |
| 1.3 | 16.7 | GO:0004551 | nucleotide diphosphatase activity(GO:0004551) |
| 1.3 | 30.5 | GO:0070003 | threonine-type endopeptidase activity(GO:0004298) threonine-type peptidase activity(GO:0070003) |
| 1.3 | 3.8 | GO:0080101 | phosphatidyl-N-methylethanolamine N-methyltransferase activity(GO:0000773) phosphatidylethanolamine N-methyltransferase activity(GO:0004608) phosphatidyl-N-dimethylethanolamine N-methyltransferase activity(GO:0080101) |
| 1.2 | 13.5 | GO:0039706 | co-receptor binding(GO:0039706) |
| 1.2 | 6.1 | GO:0008073 | ornithine decarboxylase inhibitor activity(GO:0008073) |
| 1.1 | 12.5 | GO:0035925 | mRNA 3'-UTR AU-rich region binding(GO:0035925) |
| 1.1 | 57.2 | GO:0016831 | carboxy-lyase activity(GO:0016831) |
| 1.0 | 26.3 | GO:0005092 | GDP-dissociation inhibitor activity(GO:0005092) |
| 1.0 | 8.0 | GO:0003910 | DNA ligase (ATP) activity(GO:0003910) |
| 1.0 | 35.5 | GO:0071889 | 14-3-3 protein binding(GO:0071889) |
| 1.0 | 51.5 | GO:0048487 | beta-tubulin binding(GO:0048487) |
| 0.9 | 7.6 | GO:0004865 | protein serine/threonine phosphatase inhibitor activity(GO:0004865) |
| 0.9 | 22.5 | GO:0046966 | thyroid hormone receptor binding(GO:0046966) |
| 0.9 | 14.9 | GO:0016004 | phospholipase activator activity(GO:0016004) |
| 0.9 | 3.7 | GO:0072320 | volume-sensitive chloride channel activity(GO:0072320) |
| 0.9 | 61.3 | GO:0031491 | nucleosome binding(GO:0031491) |
| 0.9 | 114.2 | GO:0003697 | single-stranded DNA binding(GO:0003697) |
| 0.9 | 9.7 | GO:0030911 | TPR domain binding(GO:0030911) |
| 0.9 | 11.1 | GO:0008327 | methyl-CpG binding(GO:0008327) |
| 0.8 | 54.0 | GO:0035064 | methylated histone binding(GO:0035064) |
| 0.8 | 6.5 | GO:0004784 | superoxide dismutase activity(GO:0004784) oxidoreductase activity, acting on superoxide radicals as acceptor(GO:0016721) |
| 0.8 | 2.3 | GO:0031208 | POZ domain binding(GO:0031208) |
| 0.7 | 24.1 | GO:0043539 | protein serine/threonine kinase activator activity(GO:0043539) |
| 0.7 | 18.2 | GO:0070006 | metalloaminopeptidase activity(GO:0070006) |
| 0.7 | 49.9 | GO:0030374 | ligand-dependent nuclear receptor transcription coactivator activity(GO:0030374) |
| 0.7 | 2.1 | GO:0052739 | phosphatidylserine 1-acylhydrolase activity(GO:0052739) |
| 0.7 | 6.7 | GO:0005381 | iron ion transmembrane transporter activity(GO:0005381) |
| 0.7 | 6.0 | GO:0036402 | proteasome-activating ATPase activity(GO:0036402) |
| 0.7 | 19.4 | GO:0019843 | rRNA binding(GO:0019843) |
| 0.7 | 12.6 | GO:0008494 | translation activator activity(GO:0008494) |
| 0.7 | 318.0 | GO:0045296 | cadherin binding(GO:0045296) |
| 0.6 | 53.0 | GO:0008565 | protein transporter activity(GO:0008565) |
| 0.6 | 88.0 | GO:0005262 | calcium channel activity(GO:0005262) |
| 0.6 | 16.4 | GO:0034237 | protein kinase A regulatory subunit binding(GO:0034237) |
| 0.6 | 3.4 | GO:0070016 | armadillo repeat domain binding(GO:0070016) |
| 0.6 | 7.3 | GO:0016018 | cyclosporin A binding(GO:0016018) |
| 0.6 | 16.6 | GO:0030507 | spectrin binding(GO:0030507) |
| 0.6 | 92.5 | GO:0005200 | structural constituent of cytoskeleton(GO:0005200) |
| 0.5 | 3.7 | GO:0016403 | dimethylargininase activity(GO:0016403) |
| 0.5 | 7.5 | GO:0030215 | semaphorin receptor binding(GO:0030215) |
| 0.5 | 48.4 | GO:0051087 | chaperone binding(GO:0051087) |
| 0.5 | 17.8 | GO:0000175 | 3'-5'-exoribonuclease activity(GO:0000175) |
| 0.5 | 20.9 | GO:0050681 | androgen receptor binding(GO:0050681) |
| 0.5 | 18.2 | GO:0005540 | hyaluronic acid binding(GO:0005540) |
| 0.5 | 39.3 | GO:0004722 | protein serine/threonine phosphatase activity(GO:0004722) |
| 0.4 | 8.0 | GO:0097602 | cullin family protein binding(GO:0097602) |
| 0.4 | 156.3 | GO:0005525 | GTP binding(GO:0005525) |
| 0.4 | 3.8 | GO:0004340 | glucokinase activity(GO:0004340) hexokinase activity(GO:0004396) fructokinase activity(GO:0008865) mannokinase activity(GO:0019158) |
| 0.4 | 0.8 | GO:0004699 | calcium-independent protein kinase C activity(GO:0004699) |
| 0.4 | 62.5 | GO:0017124 | SH3 domain binding(GO:0017124) |
| 0.4 | 0.7 | GO:0050567 | glutaminyl-tRNA synthase (glutamine-hydrolyzing) activity(GO:0050567) |
| 0.4 | 9.5 | GO:0070410 | co-SMAD binding(GO:0070410) |
| 0.4 | 2.8 | GO:0038132 | neuregulin binding(GO:0038132) |
| 0.3 | 23.4 | GO:0042826 | histone deacetylase binding(GO:0042826) |
| 0.3 | 31.6 | GO:0004715 | non-membrane spanning protein tyrosine kinase activity(GO:0004715) |
| 0.3 | 0.7 | GO:0005250 | A-type (transient outward) potassium channel activity(GO:0005250) |
| 0.3 | 6.6 | GO:0045295 | gamma-catenin binding(GO:0045295) |
| 0.3 | 24.6 | GO:0032947 | protein complex scaffold(GO:0032947) |
| 0.3 | 8.2 | GO:0031418 | L-ascorbic acid binding(GO:0031418) |
| 0.3 | 13.1 | GO:0050136 | NADH dehydrogenase (ubiquinone) activity(GO:0008137) NADH dehydrogenase (quinone) activity(GO:0050136) |
| 0.3 | 13.7 | GO:0008135 | translation factor activity, RNA binding(GO:0008135) |
| 0.2 | 1.0 | GO:0015222 | serotonin transmembrane transporter activity(GO:0015222) |
| 0.2 | 2.7 | GO:0070566 | adenylyltransferase activity(GO:0070566) |
| 0.2 | 6.0 | GO:0019239 | deaminase activity(GO:0019239) |
| 0.2 | 1.6 | GO:0001165 | RNA polymerase I upstream control element sequence-specific DNA binding(GO:0001165) |
| 0.2 | 0.9 | GO:0004427 | inorganic diphosphatase activity(GO:0004427) |
| 0.2 | 6.5 | GO:0004435 | phosphatidylinositol phospholipase C activity(GO:0004435) |
| 0.2 | 23.2 | GO:0042393 | histone binding(GO:0042393) |
| 0.2 | 5.3 | GO:0030544 | Hsp70 protein binding(GO:0030544) |
| 0.2 | 8.4 | GO:0005484 | SNAP receptor activity(GO:0005484) |
| 0.2 | 10.3 | GO:0016763 | transferase activity, transferring pentosyl groups(GO:0016763) |
| 0.2 | 0.9 | GO:0019776 | Atg8 ligase activity(GO:0019776) |
| 0.2 | 5.6 | GO:0033558 | protein deacetylase activity(GO:0033558) |
| 0.2 | 4.9 | GO:0008307 | structural constituent of muscle(GO:0008307) |
| 0.1 | 1.4 | GO:0015924 | mannosyl-oligosaccharide mannosidase activity(GO:0015924) |
| 0.1 | 1.1 | GO:0010314 | phosphatidylinositol-5-phosphate binding(GO:0010314) |
| 0.1 | 6.5 | GO:0015485 | cholesterol binding(GO:0015485) |
| 0.1 | 12.1 | GO:0004725 | protein tyrosine phosphatase activity(GO:0004725) |
| 0.1 | 1.2 | GO:0043422 | protein kinase B binding(GO:0043422) |
| 0.1 | 13.7 | GO:0044325 | ion channel binding(GO:0044325) |
| 0.1 | 4.7 | GO:0001205 | transcriptional activator activity, RNA polymerase II distal enhancer sequence-specific binding(GO:0001205) |
| 0.1 | 4.4 | GO:0016811 | hydrolase activity, acting on carbon-nitrogen (but not peptide) bonds, in linear amides(GO:0016811) |
| 0.1 | 108.0 | GO:0003723 | RNA binding(GO:0003723) |
| 0.1 | 2.3 | GO:0016790 | thiolester hydrolase activity(GO:0016790) |
| 0.1 | 0.3 | GO:0004666 | prostaglandin-endoperoxide synthase activity(GO:0004666) |
| 0.1 | 1.8 | GO:0005546 | phosphatidylinositol-4,5-bisphosphate binding(GO:0005546) |
| 0.0 | 1.0 | GO:0005158 | insulin receptor binding(GO:0005158) |
| 0.0 | 1.5 | GO:0000980 | RNA polymerase II distal enhancer sequence-specific DNA binding(GO:0000980) |
| 0.0 | 5.0 | GO:0030674 | protein binding, bridging(GO:0030674) |
| 0.0 | 19.2 | GO:0005509 | calcium ion binding(GO:0005509) |
| 0.0 | 0.4 | GO:0032183 | SUMO binding(GO:0032183) |
| 0.0 | 0.4 | GO:0008157 | protein phosphatase 1 binding(GO:0008157) |
| 0.0 | 2.2 | GO:0004896 | cytokine receptor activity(GO:0004896) |
| 0.0 | 1.6 | GO:0061630 | ubiquitin protein ligase activity(GO:0061630) |
Gene overrepresentation in curated gene sets: canonical pathways category:
| Log-likelihood per target | Total log-likelihood | Term | Description |
|---|---|---|---|
| 10.2 | 519.2 | PID NFKAPPAB CANONICAL PATHWAY | Canonical NF-kappaB pathway |
| 5.2 | 155.1 | PID NFKAPPAB ATYPICAL PATHWAY | Atypical NF-kappaB pathway |
| 4.3 | 172.7 | PID SMAD2 3PATHWAY | Regulation of cytoplasmic and nuclear SMAD2/3 signaling |
| 3.8 | 275.8 | PID PLK1 PATHWAY | PLK1 signaling events |
| 3.6 | 191.8 | PID AURORA B PATHWAY | Aurora B signaling |
| 2.9 | 146.2 | PID ATR PATHWAY | ATR signaling pathway |
| 2.8 | 77.0 | SA G1 AND S PHASES | Cdk2, 4, and 6 bind cyclin D in G1, while cdk2/cyclin E promotes the G1/S transition. |
| 2.6 | 179.4 | PID HES HEY PATHWAY | Notch-mediated HES/HEY network |
| 2.4 | 77.0 | PID WNT SIGNALING PATHWAY | Wnt signaling network |
| 2.3 | 81.2 | PID VEGFR1 PATHWAY | VEGFR1 specific signals |
| 1.9 | 89.1 | PID FOXM1 PATHWAY | FOXM1 transcription factor network |
| 1.7 | 58.8 | PID AVB3 OPN PATHWAY | Osteopontin-mediated events |
| 1.6 | 84.4 | ST B CELL ANTIGEN RECEPTOR | B Cell Antigen Receptor |
| 1.5 | 42.6 | PID PRL SIGNALING EVENTS PATHWAY | Signaling events mediated by PRL |
| 1.4 | 59.2 | PID HIF2PATHWAY | HIF-2-alpha transcription factor network |
| 1.1 | 26.3 | SIG CHEMOTAXIS | Genes related to chemotaxis |
| 1.1 | 29.4 | PID AURORA A PATHWAY | Aurora A signaling |
| 1.1 | 25.0 | PID ARF6 DOWNSTREAM PATHWAY | Arf6 downstream pathway |
| 1.0 | 4.1 | SA PROGRAMMED CELL DEATH | Programmed cell death, or apoptosis, eliminates damaged or unneeded cells. |
| 1.0 | 71.6 | PID RAC1 PATHWAY | RAC1 signaling pathway |
| 0.9 | 78.3 | PID E2F PATHWAY | E2F transcription factor network |
| 0.8 | 64.4 | SIG PIP3 SIGNALING IN CARDIAC MYOCTES | Genes related to PIP3 signaling in cardiac myocytes |
| 0.8 | 91.4 | PID CMYB PATHWAY | C-MYB transcription factor network |
| 0.8 | 47.3 | PID CERAMIDE PATHWAY | Ceramide signaling pathway |
| 0.8 | 69.0 | PID AR PATHWAY | Coregulation of Androgen receptor activity |
| 0.8 | 24.4 | PID IL2 PI3K PATHWAY | IL2 signaling events mediated by PI3K |
| 0.8 | 26.9 | PID ERBB1 INTERNALIZATION PATHWAY | Internalization of ErbB1 |
| 0.7 | 6.7 | PID BETA CATENIN DEG PATHWAY | Degradation of beta catenin |
| 0.5 | 33.2 | WNT SIGNALING | Genes related to Wnt-mediated signal transduction |
| 0.4 | 16.2 | PID TELOMERASE PATHWAY | Regulation of Telomerase |
| 0.4 | 59.6 | PID P53 DOWNSTREAM PATHWAY | Direct p53 effectors |
| 0.4 | 6.5 | ST G ALPHA I PATHWAY | G alpha i Pathway |
| 0.4 | 2.5 | ST IL 13 PATHWAY | Interleukin 13 (IL-13) Pathway |
| 0.3 | 10.5 | PID LIS1 PATHWAY | Lissencephaly gene (LIS1) in neuronal migration and development |
| 0.3 | 14.2 | PID VEGFR1 2 PATHWAY | Signaling events mediated by VEGFR1 and VEGFR2 |
| 0.2 | 9.5 | PID TAP63 PATHWAY | Validated transcriptional targets of TAp63 isoforms |
| 0.2 | 40.7 | NABA ECM AFFILIATED | Genes encoding proteins affiliated structurally or functionally to extracellular matrix proteins |
| 0.2 | 6.5 | PID FOXO PATHWAY | FoxO family signaling |
| 0.2 | 12.0 | PID MYC REPRESS PATHWAY | Validated targets of C-MYC transcriptional repression |
| 0.2 | 6.6 | PID BMP PATHWAY | BMP receptor signaling |
| 0.1 | 1.7 | SA CASPASE CASCADE | Apoptosis is mediated by caspases, cysteine proteases arranged in a proteolytic cascade. |
| 0.1 | 5.1 | PID IL4 2PATHWAY | IL4-mediated signaling events |
| 0.1 | 5.6 | PID HEDGEHOG GLI PATHWAY | Hedgehog signaling events mediated by Gli proteins |
| 0.1 | 2.8 | PID ERBB NETWORK PATHWAY | ErbB receptor signaling network |
| 0.1 | 6.6 | PID NFAT TFPATHWAY | Calcineurin-regulated NFAT-dependent transcription in lymphocytes |
| 0.1 | 3.6 | PID ARF6 PATHWAY | Arf6 signaling events |
| 0.1 | 2.8 | PID EPHRINB REV PATHWAY | Ephrin B reverse signaling |
| 0.1 | 1.0 | PID RET PATHWAY | Signaling events regulated by Ret tyrosine kinase |
| 0.1 | 3.8 | PID HIF1 TFPATHWAY | HIF-1-alpha transcription factor network |
| 0.0 | 0.8 | PID NFAT 3PATHWAY | Role of Calcineurin-dependent NFAT signaling in lymphocytes |
Gene overrepresentation in curated gene sets: REACTOME pathways category:
| Log-likelihood per target | Total log-likelihood | Term | Description |
|---|---|---|---|
| 15.9 | 571.9 | REACTOME OXYGEN DEPENDENT PROLINE HYDROXYLATION OF HYPOXIA INDUCIBLE FACTOR ALPHA | Genes involved in Oxygen-dependent Proline Hydroxylation of Hypoxia-inducible Factor Alpha |
| 9.3 | 241.5 | REACTOME INHIBITION OF THE PROTEOLYTIC ACTIVITY OF APC C REQUIRED FOR THE ONSET OF ANAPHASE BY MITOTIC SPINDLE CHECKPOINT COMPONENTS | Genes involved in Inhibition of the proteolytic activity of APC/C required for the onset of anaphase by mitotic spindle checkpoint components |
| 7.9 | 118.9 | REACTOME SLBP DEPENDENT PROCESSING OF REPLICATION DEPENDENT HISTONE PRE MRNAS | Genes involved in SLBP Dependent Processing of Replication-Dependent Histone Pre-mRNAs |
| 7.2 | 129.6 | REACTOME NOTCH HLH TRANSCRIPTION PATHWAY | Genes involved in Notch-HLH transcription pathway |
| 6.7 | 140.2 | REACTOME DSCAM INTERACTIONS | Genes involved in DSCAM interactions |
| 6.1 | 30.4 | REACTOME APC C CDH1 MEDIATED DEGRADATION OF CDC20 AND OTHER APC C CDH1 TARGETED PROTEINS IN LATE MITOSIS EARLY G1 | Genes involved in APC/C:Cdh1 mediated degradation of Cdc20 and other APC/C:Cdh1 targeted proteins in late mitosis/early G1 |
| 5.9 | 94.5 | REACTOME POL SWITCHING | Genes involved in Polymerase switching |
| 5.6 | 129.6 | REACTOME DEPOSITION OF NEW CENPA CONTAINING NUCLEOSOMES AT THE CENTROMERE | Genes involved in Deposition of New CENPA-containing Nucleosomes at the Centromere |
| 4.9 | 157.6 | REACTOME FORMATION OF TUBULIN FOLDING INTERMEDIATES BY CCT TRIC | Genes involved in Formation of tubulin folding intermediates by CCT/TriC |
| 4.9 | 9.7 | REACTOME VIF MEDIATED DEGRADATION OF APOBEC3G | Genes involved in Vif-mediated degradation of APOBEC3G |
| 4.8 | 110.6 | REACTOME CYCLIN A B1 ASSOCIATED EVENTS DURING G2 M TRANSITION | Genes involved in Cyclin A/B1 associated events during G2/M transition |
| 4.1 | 119.3 | REACTOME BRANCHED CHAIN AMINO ACID CATABOLISM | Genes involved in Branched-chain amino acid catabolism |
| 4.0 | 296.1 | REACTOME FORMATION OF THE TERNARY COMPLEX AND SUBSEQUENTLY THE 43S COMPLEX | Genes involved in Formation of the ternary complex, and subsequently, the 43S complex |
| 3.8 | 357.1 | REACTOME MITOTIC PROMETAPHASE | Genes involved in Mitotic Prometaphase |
| 3.8 | 110.2 | REACTOME G1 S SPECIFIC TRANSCRIPTION | Genes involved in G1/S-Specific Transcription |
| 3.6 | 10.8 | REACTOME AUTODEGRADATION OF THE E3 UBIQUITIN LIGASE COP1 | Genes involved in Autodegradation of the E3 ubiquitin ligase COP1 |
| 3.4 | 53.7 | REACTOME METABOLISM OF NON CODING RNA | Genes involved in Metabolism of non-coding RNA |
| 3.1 | 106.4 | REACTOME RNA POL III TRANSCRIPTION TERMINATION | Genes involved in RNA Polymerase III Transcription Termination |
| 3.0 | 68.7 | REACTOME SYNTHESIS OF PIPS AT THE GOLGI MEMBRANE | Genes involved in Synthesis of PIPs at the Golgi membrane |
| 3.0 | 302.4 | REACTOME PEPTIDE CHAIN ELONGATION | Genes involved in Peptide chain elongation |
| 3.0 | 59.2 | REACTOME BASE FREE SUGAR PHOSPHATE REMOVAL VIA THE SINGLE NUCLEOTIDE REPLACEMENT PATHWAY | Genes involved in Base-free sugar-phosphate removal via the single-nucleotide replacement pathway |
| 2.8 | 46.8 | REACTOME MITOCHONDRIAL FATTY ACID BETA OXIDATION | Genes involved in Mitochondrial Fatty Acid Beta-Oxidation |
| 2.7 | 30.2 | REACTOME ASSOCIATION OF LICENSING FACTORS WITH THE PRE REPLICATIVE COMPLEX | Genes involved in Association of licensing factors with the pre-replicative complex |
| 2.7 | 42.7 | REACTOME VITAMIN B5 PANTOTHENATE METABOLISM | Genes involved in Vitamin B5 (pantothenate) metabolism |
| 2.5 | 233.1 | REACTOME ANTIVIRAL MECHANISM BY IFN STIMULATED GENES | Genes involved in Antiviral mechanism by IFN-stimulated genes |
| 2.4 | 24.1 | REACTOME RAF MAP KINASE CASCADE | Genes involved in RAF/MAP kinase cascade |
| 2.2 | 17.7 | REACTOME IRAK1 RECRUITS IKK COMPLEX | Genes involved in IRAK1 recruits IKK complex |
| 2.2 | 52.8 | REACTOME PURINE SALVAGE | Genes involved in Purine salvage |
| 2.2 | 186.6 | REACTOME RESPIRATORY ELECTRON TRANSPORT | Genes involved in Respiratory electron transport |
| 2.2 | 159.6 | REACTOME REGULATION OF ORNITHINE DECARBOXYLASE ODC | Genes involved in Regulation of ornithine decarboxylase (ODC) |
| 2.2 | 21.7 | REACTOME PREFOLDIN MEDIATED TRANSFER OF SUBSTRATE TO CCT TRIC | Genes involved in Prefoldin mediated transfer of substrate to CCT/TriC |
| 2.1 | 77.4 | REACTOME SRP DEPENDENT COTRANSLATIONAL PROTEIN TARGETING TO MEMBRANE | Genes involved in SRP-dependent cotranslational protein targeting to membrane |
| 2.0 | 135.1 | REACTOME GLUCONEOGENESIS | Genes involved in Gluconeogenesis |
| 2.0 | 20.4 | REACTOME SYNTHESIS SECRETION AND DEACYLATION OF GHRELIN | Genes involved in Synthesis, Secretion, and Deacylation of Ghrelin |
| 1.9 | 11.5 | REACTOME IRAK2 MEDIATED ACTIVATION OF TAK1 COMPLEX UPON TLR7 8 OR 9 STIMULATION | Genes involved in IRAK2 mediated activation of TAK1 complex upon TLR7/8 or 9 stimulation |
| 1.9 | 36.0 | REACTOME MRNA DECAY BY 5 TO 3 EXORIBONUCLEASE | Genes involved in mRNA Decay by 5' to 3' Exoribonuclease |
| 1.7 | 57.7 | REACTOME CELL EXTRACELLULAR MATRIX INTERACTIONS | Genes involved in Cell-extracellular matrix interactions |
| 1.7 | 67.9 | REACTOME CHOLESTEROL BIOSYNTHESIS | Genes involved in Cholesterol biosynthesis |
| 1.7 | 107.8 | REACTOME NOTCH1 INTRACELLULAR DOMAIN REGULATES TRANSCRIPTION | Genes involved in NOTCH1 Intracellular Domain Regulates Transcription |
| 1.6 | 30.7 | REACTOME CIRCADIAN REPRESSION OF EXPRESSION BY REV ERBA | Genes involved in Circadian Repression of Expression by REV-ERBA |
| 1.5 | 51.4 | REACTOME NONSENSE MEDIATED DECAY ENHANCED BY THE EXON JUNCTION COMPLEX | Genes involved in Nonsense Mediated Decay Enhanced by the Exon Junction Complex |
| 1.4 | 37.4 | REACTOME RETROGRADE NEUROTROPHIN SIGNALLING | Genes involved in Retrograde neurotrophin signalling |
| 1.3 | 23.9 | REACTOME TETRAHYDROBIOPTERIN BH4 SYNTHESIS RECYCLING SALVAGE AND REGULATION | Genes involved in Tetrahydrobiopterin (BH4) synthesis, recycling, salvage and regulation |
| 1.1 | 29.9 | REACTOME SIGNALING BY HIPPO | Genes involved in Signaling by Hippo |
| 1.1 | 9.0 | REACTOME REMOVAL OF THE FLAP INTERMEDIATE FROM THE C STRAND | Genes involved in Removal of the Flap Intermediate from the C-strand |
| 1.0 | 8.2 | REACTOME PACKAGING OF TELOMERE ENDS | Genes involved in Packaging Of Telomere Ends |
| 1.0 | 32.7 | REACTOME REGULATION OF WATER BALANCE BY RENAL AQUAPORINS | Genes involved in Regulation of Water Balance by Renal Aquaporins |
| 1.0 | 29.5 | REACTOME SULFUR AMINO ACID METABOLISM | Genes involved in Sulfur amino acid metabolism |
| 0.9 | 9.0 | REACTOME SYNTHESIS OF PIPS AT THE LATE ENDOSOME MEMBRANE | Genes involved in Synthesis of PIPs at the late endosome membrane |
| 0.9 | 14.2 | REACTOME SYNTHESIS OF PE | Genes involved in Synthesis of PE |
| 0.9 | 31.2 | REACTOME LYSOSOME VESICLE BIOGENESIS | Genes involved in Lysosome Vesicle Biogenesis |
| 0.8 | 26.6 | REACTOME NEPHRIN INTERACTIONS | Genes involved in Nephrin interactions |
| 0.8 | 12.5 | REACTOME SYNTHESIS OF SUBSTRATES IN N GLYCAN BIOSYTHESIS | Genes involved in Synthesis of substrates in N-glycan biosythesis |
| 0.8 | 18.2 | REACTOME HYALURONAN UPTAKE AND DEGRADATION | Genes involved in Hyaluronan uptake and degradation |
| 0.7 | 2.7 | REACTOME NEF MEDIATED DOWNREGULATION OF MHC CLASS I COMPLEX CELL SURFACE EXPRESSION | Genes involved in Nef mediated downregulation of MHC class I complex cell surface expression |
| 0.7 | 13.3 | REACTOME GLYCOGEN BREAKDOWN GLYCOGENOLYSIS | Genes involved in Glycogen breakdown (glycogenolysis) |
| 0.7 | 56.2 | REACTOME APOPTOTIC CLEAVAGE OF CELLULAR PROTEINS | Genes involved in Apoptotic cleavage of cellular proteins |
| 0.7 | 26.9 | REACTOME SEMA4D INDUCED CELL MIGRATION AND GROWTH CONE COLLAPSE | Genes involved in Sema4D induced cell migration and growth-cone collapse |
| 0.6 | 39.5 | REACTOME COLLAGEN FORMATION | Genes involved in Collagen formation |
| 0.6 | 39.2 | REACTOME LOSS OF NLP FROM MITOTIC CENTROSOMES | Genes involved in Loss of Nlp from mitotic centrosomes |
| 0.6 | 9.5 | REACTOME REGULATION OF IFNG SIGNALING | Genes involved in Regulation of IFNG signaling |
| 0.5 | 3.1 | REACTOME FORMATION OF RNA POL II ELONGATION COMPLEX | Genes involved in Formation of RNA Pol II elongation complex |
| 0.5 | 12.2 | REACTOME GLUTATHIONE CONJUGATION | Genes involved in Glutathione conjugation |
| 0.4 | 7.1 | REACTOME ACYL CHAIN REMODELLING OF PG | Genes involved in Acyl chain remodelling of PG |
| 0.4 | 46.0 | REACTOME CLASS B 2 SECRETIN FAMILY RECEPTORS | Genes involved in Class B/2 (Secretin family receptors) |
| 0.4 | 14.9 | REACTOME SIGNAL TRANSDUCTION BY L1 | Genes involved in Signal transduction by L1 |
| 0.3 | 5.2 | REACTOME REGULATION OF PYRUVATE DEHYDROGENASE PDH COMPLEX | Genes involved in Regulation of pyruvate dehydrogenase (PDH) complex |
| 0.3 | 9.5 | REACTOME METABOLISM OF PORPHYRINS | Genes involved in Metabolism of porphyrins |
| 0.3 | 6.5 | REACTOME ENDOSOMAL SORTING COMPLEX REQUIRED FOR TRANSPORT ESCRT | Genes involved in Endosomal Sorting Complex Required For Transport (ESCRT) |
| 0.3 | 1.6 | REACTOME RNA POL I PROMOTER OPENING | Genes involved in RNA Polymerase I Promoter Opening |
| 0.2 | 3.8 | REACTOME GLUCOSE TRANSPORT | Genes involved in Glucose transport |
| 0.2 | 3.8 | REACTOME SYNTHESIS OF PC | Genes involved in Synthesis of PC |
| 0.2 | 1.9 | REACTOME RNA POL III TRANSCRIPTION INITIATION FROM TYPE 3 PROMOTER | Genes involved in RNA Polymerase III Transcription Initiation From Type 3 Promoter |
| 0.2 | 10.9 | REACTOME MYOGENESIS | Genes involved in Myogenesis |
| 0.2 | 1.4 | REACTOME REGULATION OF HYPOXIA INDUCIBLE FACTOR HIF BY OXYGEN | Genes involved in Regulation of Hypoxia-inducible Factor (HIF) by Oxygen |
| 0.2 | 1.7 | REACTOME APOPTOSIS INDUCED DNA FRAGMENTATION | Genes involved in Apoptosis induced DNA fragmentation |
| 0.2 | 21.6 | REACTOME FACTORS INVOLVED IN MEGAKARYOCYTE DEVELOPMENT AND PLATELET PRODUCTION | Genes involved in Factors involved in megakaryocyte development and platelet production |
| 0.2 | 6.5 | REACTOME PLC BETA MEDIATED EVENTS | Genes involved in PLC beta mediated events |
| 0.2 | 6.2 | REACTOME REGULATION OF MRNA STABILITY BY PROTEINS THAT BIND AU RICH ELEMENTS | Genes involved in Regulation of mRNA Stability by Proteins that Bind AU-rich Elements |
| 0.2 | 2.7 | REACTOME CYTOSOLIC SULFONATION OF SMALL MOLECULES | Genes involved in Cytosolic sulfonation of small molecules |
| 0.1 | 1.0 | REACTOME SIGNAL ATTENUATION | Genes involved in Signal attenuation |
| 0.1 | 2.8 | REACTOME DOWNREGULATION OF ERBB2 ERBB3 SIGNALING | Genes involved in Downregulation of ERBB2:ERBB3 signaling |
| 0.1 | 4.6 | REACTOME INTRINSIC PATHWAY FOR APOPTOSIS | Genes involved in Intrinsic Pathway for Apoptosis |
| 0.1 | 20.3 | REACTOME ANTIGEN PROCESSING UBIQUITINATION PROTEASOME DEGRADATION | Genes involved in Antigen processing: Ubiquitination & Proteasome degradation |
| 0.1 | 23.0 | REACTOME SIGNALING BY RHO GTPASES | Genes involved in Signaling by Rho GTPases |
| 0.1 | 24.4 | REACTOME METABOLISM OF CARBOHYDRATES | Genes involved in Metabolism of carbohydrates |
| 0.1 | 7.9 | REACTOME ACTIVATION OF CHAPERONE GENES BY XBP1S | Genes involved in Activation of Chaperone Genes by XBP1(S) |
| 0.1 | 1.2 | REACTOME ROLE OF DCC IN REGULATING APOPTOSIS | Genes involved in Role of DCC in regulating apoptosis |
| 0.1 | 11.2 | REACTOME PROCESSING OF CAPPED INTRON CONTAINING PRE MRNA | Genes involved in Processing of Capped Intron-Containing Pre-mRNA |
| 0.1 | 9.3 | REACTOME RESPONSE TO ELEVATED PLATELET CYTOSOLIC CA2 | Genes involved in Response to elevated platelet cytosolic Ca2+ |
| 0.1 | 0.8 | REACTOME G ALPHA Z SIGNALLING EVENTS | Genes involved in G alpha (z) signalling events |
| 0.1 | 1.4 | REACTOME N GLYCAN ANTENNAE ELONGATION IN THE MEDIAL TRANS GOLGI | Genes involved in N-glycan antennae elongation in the medial/trans-Golgi |
| 0.1 | 1.6 | REACTOME DOWNREGULATION OF SMAD2 3 SMAD4 TRANSCRIPTIONAL ACTIVITY | Genes involved in Downregulation of SMAD2/3:SMAD4 transcriptional activity |
| 0.0 | 1.0 | REACTOME NOREPINEPHRINE NEUROTRANSMITTER RELEASE CYCLE | Genes involved in Norepinephrine Neurotransmitter Release Cycle |
| 0.0 | 0.9 | REACTOME NEGATIVE REGULATORS OF RIG I MDA5 SIGNALING | Genes involved in Negative regulators of RIG-I/MDA5 signaling |